wvde - school system strategic plan page 1 of 33 five...
TRANSCRIPT

FIVE-YEAR STRATEGIC PLAN 2005-2010
Annual Update 2007
WOOD COUNTY SCHOOLS WOOD COUNTY SCHOOLS 1210 13TH ST PARKERSBURG WV 26101-4144
Telephone: (304) 420-9663 Fax: (304) 420-9513
"Good plans shape good decisions. That's why good planning helps to make elusive dreams come true."
Lester R. Bittel, The Nine Master Keys of Management
Page 1 of 33WVDE - School System Strategic Plan
8/28/2008https://wveis.k12.wv.us/oneplan2008/district/print_plan.cfm?action=p

SCHOOL SYSTEM STRATEGIC PLANNING COMMITTEE Administration Mrs. Dianne Boggess
Mrs. Sue WoodwardDr. Toni DeVoreMr. Ralph BoardMr. Richard SummersMr. Robert HarrisDr. Frieda OwenMr. Lawrence HasbargenMr. William A. NidayMrs. Karen BrunicardiMr. Mike BoydDr. Yvonne SantinMrs. Sue Ellen Johnson
Business & Community Ms. Teresa KimmelMr. George KellenbergerMr. Dan McPhersonMr. Jim RossDr. Marie Foster Gnage
ESL Parent Ms. Valentino ArriagaFederal Programs Dr. Frank BonoParents Mrs. Lori Williamson
Mrs. Kathy Albertson(Title I) Mrs. Rhonda BaranowskiMrs. Angie GantMr. John Sines
Students Miss Elizabeth LockneyMr. Fareed Cheema
Teachers Mrs. Leslie CoxMs Kim CunninghamMs. Carole CunninghamMrs. Myla KreinikMrs. Lois Rowe
Technology Committee Mr. Robert MathewsMr. Steve LuxMrs. Deborah LampMs. Jozetta MillerMr. Emil WhipkeyMs. Gilda HaddoxMrs. Christine WhytsellMr. William Allen
The committee broke into subgroups to work on the sections of the plan. They then brought back a draft of their section to review and revise with the group. The entire plan was presented to the Faculty Senate and Local School Improvement Council for review, before submission.
Page 2 of 33WVDE - School System Strategic Plan
8/28/2008https://wveis.k12.wv.us/oneplan2008/district/print_plan.cfm?action=p

SCHOOL SYSTEM MISSION STATEMENT Wood County Schools will create a challenging and diverse educational environment in which all students will master the essential curriculum and beyond to become successful members of society.
CORE BELIEFS THAT DRIVE SCHOOL SYSTEM IMPROVEMENT We believe...1. Our students are our most important community resource and deserve the highest quality
education we can provide. 2. All students have the right and responsibility to learn and will learn, given appropriate time
and attention to their unique abilities and life experiences.3. All students will graduate with the knowledge and skills to become productive citizens.4. All employees must be committed to the high standards necessary for all students to
learn.5. Effective and honest communication is essential.6. Education is a valued partnership shared by school, family, and community.7. All schools must provide a safe, positive, and welcoming environment to everyone.
Page 3 of 33WVDE - School System Strategic Plan
8/28/2008https://wveis.k12.wv.us/oneplan2008/district/print_plan.cfm?action=p
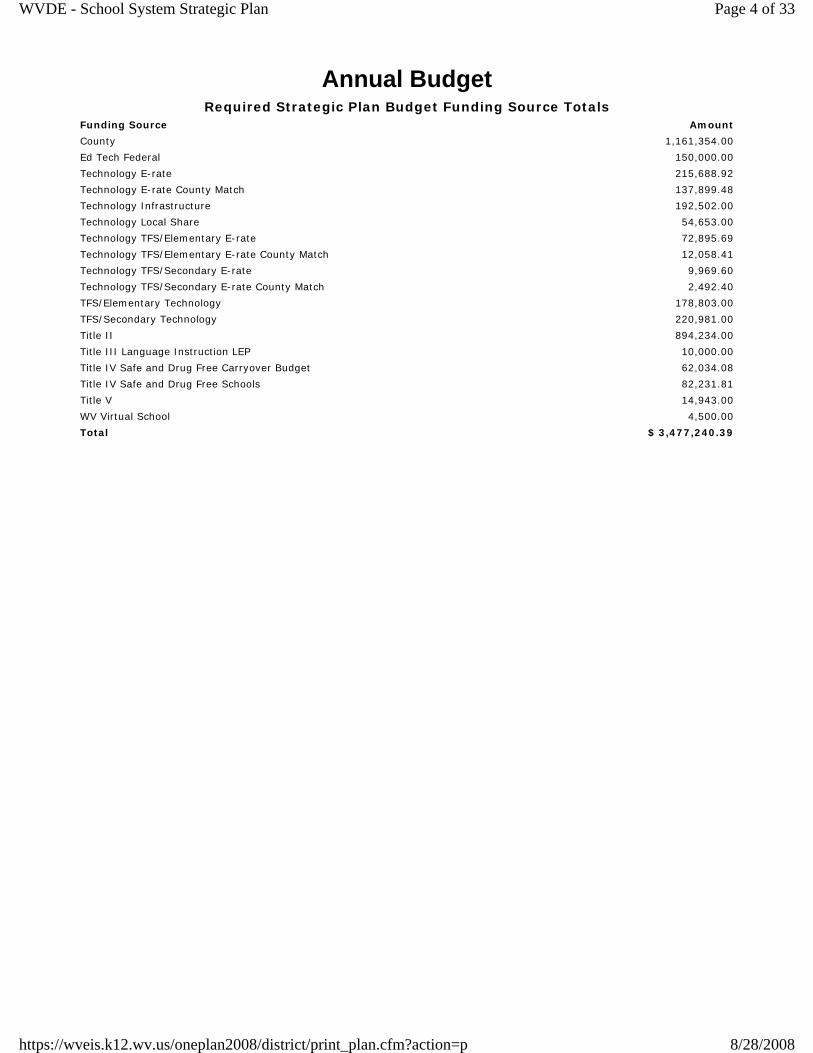
Annual Budget Required Strategic Plan Budget Funding Source Totals
Funding Source Amount
County 1,161,354.00
Ed Tech Federal 150,000.00
Technology E-rate 215,688.92
Technology E-rate County Match 137,899.48
Technology Infrastructure 192,502.00
Technology Local Share 54,653.00
Technology TFS/Elementary E-rate 72,895.69
Technology TFS/Elementary E-rate County Match 12,058.41
Technology TFS/Secondary E-rate 9,969.60
Technology TFS/Secondary E-rate County Match 2,492.40
TFS/Elementary Technology 178,803.00
TFS/Secondary Technology 220,981.00
Title II 894,234.00
Title III Language Instruction LEP 10,000.00
Title IV Safe and Drug Free Carryover Budget 62,034.08
Title IV Safe and Drug Free Schools 82,231.81
Title V 14,943.00
WV Virtual School 4,500.00
Total $ 3,477,240.39
Page 4 of 33WVDE - School System Strategic Plan
8/28/2008https://wveis.k12.wv.us/oneplan2008/district/print_plan.cfm?action=p

DATA ANALYSIS A. EXTERNAL DATA
ANALYSISWhat enrollment increases or decreases have occurred in your school system? How has this impacted the system?For several years, Wood County Schools experienced an enrollment decline of approximately 200 students per year. However, enrollment data at the beginning of 2007-2008 indicates that the district’s enrollment may be becoming more stable. (End of first week enrollment is only 19 less, 13,471, than at the same time in 2006-2007.) The district continues to increse enrollment in pre-k programs with additional classess and therefore students each year. For the first time in several years kindergarten enrollment exceeds 1000 sudents district wide. Moreover, projections from an enrollment projection consultant indicate that enrollment will increase by 596, including 574 pre-k students, by 2009-2010. According to available data, what changes have occurred in the age, ethnic, or racial population demographics of your county? What are the implications?Wood County’s median age is 39.3 years and it is increasing. Moreover, 31.9% of Wood County households include children under 18 years old. Although this percentage is similar to national data, it nonetheless reflects a decreasing trend in Wood County. As the community ages, it is reasonable to expect the birth rate and, concomitantly, student enrollment to decline in the long run. Therefore, student enrollment may increase for a number of years due to the district’s move toward universal pre-k program; however, enrollment will again begin to decline once the pre-k program has been expanded to the fullest degree assuming that the aging population trend continues.Have there been any significant changes in the socio-economic demographics of your county? If so, what are the implications?Since 2000, the percentage of Wood County students who participate in the free and reduced meals program increased from 37% to 42%. This is a 5% increase in five years. Moreover, this increasing trend has been steady, with a 1-2% increase for each of the five years. Last year (2005-2006) was the first year the rate has not increased, rather it remained at 42%. The 2006-2007 rate was 40.78%, the first decline (although slight) in seven years. Numerous studies have shown a strong correlation between poverty level and student achievement. Consequently, the poverty level presents a daunting challenge to the district’s instructional program. Have there been changes in the economic stability or economic trends in your county? What are the implications?Wood County’s per capita income of $24,691 ranks ninth in the state and represents 108% of the state average. However, it is 81% of the national average, and it continues to decrease. These data are in line with the growing trend in Wood County Schools of students participating in the free and reduced meals program. More than likely this trend toward lower income households reflects the fact that several major industries have left the county in the last seven years. Thus, not only does the district have more low income students on its rolls, but its tax base has decreased.What are the changes in family characteristics or background of the students served in your county? What are the implications?In addition to information provided previously in this section, the number of single parent households and households where grandparents are the primary care giver to children has grown significantly. Single parent households typically correlate with low income, which, in turn, correlates with lower student achievement. Again, these demographics present Wood County Schools with a greater challenge in its efforts to close the achievement gap. What are the significant social issues in your county? Are such things as drug abuse, homelessness, poverty, juvenile delinquency rate, or crime an increasing problem?Wood County students continue to experiment with cigarettes, alcohol, and marijuana at a rate consistent with students in the same grade level in the national sample. Multi-year comparisons show that overall use of cigarettes, beer and marijuana use in Wood County has declined. Cigarettes and beer are the most readily available drugs. Most drug use -regardless of the drug - occurs on the weekend at a friend’s house.
At each grade Wood County students have been threatened more and are more afraid that another student will hurt them at school than students at the same grade in the national sample. For the most part the older a student is, the safer they feel. In Wood County all students feel the safest place at school is in the classroom. Students feel the least safe on the school bus and in the school parking lot. Both places are traditionally the least supervised at school.
B. STUDENT ACHIEVEMENT DATAANALYSIS
No Child Left Behind School Reports
Again in 2006-2007, Wood County Schools did not make AYP in special education. Although achievement improved and remains above the state average in elementary reading language arts, we did not meet the annual measurable objective. In middle school reading language arts, scores dropped slightly and are below the state average. This is an area of concern. At the high school level, reading language arts achievement dropped by three precentile points, remaining significantly below the state average, another area of concern. In elementary mathematics, proficiency for students with disabilities dropped slightly and is below the state average. At the middle level, in spite of a 5% increase in mastery, we are below the state average. In special education, high school mathematics is the only area showing an improving trend with scores above the state average.
For the first time, achievement for low socioeconomic scores is an area of concern. In elementary reading language arts, achievement dropped slightly, in middle school no trend toward improvement is evident, and high school students have not shown improvement. Proficiency in the low SES subgroup for elementary mathematics shows a decrease at the same time students in the all category are showing improvement. At middle school, proficiency in math for low SES students has leveled off and is below the state average. High school math dropped significantly in the low SES subgroup and is 7.5 percentage points below the state average.
Page 5 of 33WVDE - School System Strategic Plan
8/28/2008https://wveis.k12.wv.us/oneplan2008/district/print_plan.cfm?action=p

The number of schools making AYP dropped from 23 in 2005-2006 to 19 in 2006-2007; however, Edison and Hamilton junior high schools moved into the AYP column, demonstrating that improvement is possible, even in special education. We need to look at the strategies these schools implemented toward improved achievement. WESTEST Confidential Summary Report2006-2007 aggregate scores for middle school reading language arts continue to fall below the state average. Taken together with seventh grade results on the State Writing Assessment, which also are below the state average, this indicates a concern in middle school reading language arts. WESTEST Confidential Item Analysis SummaryReading/Language Arts: Although mastery in elementary reading language arts remains above the state average, scores appear to have leveled off. Middle school reading language arts scores have dropped in four years, falling below the state average. High school reading language arts, while still above the state average, is the lowest in four years. This is a serious concern. .
Mathematics: Elementary mathematics shows consistent improvement in all standards, continuing well above the state average. Middle school math has improved slightly, while high school mathematics dropped significantly. Both levels are above state averages. A comparison of WESTEST scores and ACT Explore and Plan suggests a disconnect between the standards of the assessment instruments. This is another concern that needs to be explored. WV Writing AssessmentOn the 2007 State Writing Assessment, 88% of tenth grade students scored at or above mastery, an increase of 6% over 2006. Tenth graders scored 1% above the state average and exceeded the 5% target for Objective 1.16. Only 75% of seventh graders scored at or above mastery, a decrease of 2% and 1% below the state average. Target increases for Objective 1.15 have not been met. Fourth graders scored 74% mastery, 4% above the state average.
At grades 10 and 7, students' lowest scores were on persuasive writing, the most difficult genre; however, on narrative writing, a less difficult genre, 92% of tenth graders scored at or above mastery while only 74% of seventh graders scored at or above mastery. Variant scores on different writing prompts indicate a need for instruction and practice on all four writing genres.
SAT/ACT ResultsWood County Schools again scored higher than both the state and national averages on the ACT with the exception of mathematics where we score below the national average. ACT and SAT scores show a historical decline in math. At the middle and high school level , the percentage of students scoring mastery or above on WESTEST also has decreased underscoring a concern for middle and high school mathematics. ACT Explore - Grade 8 Middle SchoolWood County scored above national averages on the ACT Explore except in mathematics; however, a downward trend is evident in all subjects as well as in the composite score, on which Wood County is at the national average of 14.9. This may be an area of concern. ACT Plan - Grade 10 High SchoolIncreases were seen in all areas of the ACT Plan with Wood County students scoring above national averages except in mathematics. Wood County 10th grade students in Fall 2006 were above national student performance in every measured area except Mathematics. On the composite score, Wood County students scored 17.8 compared to the national composite of 17.5. AP Testing Report/AP RateAlthough the number of students taking Advanced Placement courses has nearly tripled since 2001-2002, the percentage of test takers has decreased. This suggests that students may be motivated by weighted grades or increased rigor more that using AP courses for college credit. Increasing enrollment in AP courses with 75% of test takers earning a score of 3 or higherindicates this is not an area of concern. End of Course Testing Report for Career and Technical EducationIn 2006-2007, 657 technical students were tested; 72.45% scored 74% or higher (compared to the state average of 68.29). During 2006-2007 and 2007-2008, we have initated three new programs and replaced 50% of the teaching staff. With these changes, we can anticipate some fluctuation in test scores. Formative and Benchmark AssessmentsData from the ETS quarterly interim assessments are analyzed at the classroom and school levels to inform instruction. LEP - What are the procedures for identifying LEP students (service levels/cut-off scores)?Potential LEP students are identified as they enroll in their home school. School secretaries have been instructed to fill out a “home language survey” for potential LEP students. This form includes information about the newly enrolled student, including the primary or home language of the family if it is not English. The school office then sends the completed form to federal programs director. Within a week of receiving this form, the Woodcock-Munoz Language Survey is administered to each referred student to ascertain if the student needs ESL services. An overall measure of cognitive-academic language proficiency (CALP) is used to place the student at levels of proficiency yielding minimal service. Please see Step 2 of the Title III Federal Compliance section of this plan (Section VIII).LEP - What are the number and percent of LEP students at each proficiency level on WESTELL (negligible, very limited, average, advanced)?
Level 1 – no students (0%)
Level 2 – six students (23%)
Level 3 – eight students (31%)
Level 4 – ten students (38%)
Level 5 – two students (29%)
Although Wood County Schools increased the percentage of students scoring at Levels 4 and 5 from 45% to
Page 6 of 33WVDE - School System Strategic Plan
8/28/2008https://wveis.k12.wv.us/oneplan2008/district/print_plan.cfm?action=p

67%, the concern is to increase this percentage. LEP - What are the number and percent of LEP students participating in the statewide assessment program? In 2006, 18 (69%) of the 26 district’s LEP students participated in the WESTEST. The remaining 8 students were enrolled in non-target grades. Seven LEP students participated in the West Virginia Writing Assessment.
LEP - What are the number and percent of LEP students at or above the 50th percentile on the statewide assessment program?In the math subsection of the WESTEST, 11 (61%) of the 18 students scored at mastery or higher with 7 (39%) students scoring below mastery.
Data from the reading subsection revealed similar results, with 11 (61%) of the 18 students who took the test attaining mastery and 7 (39%) scoring below mastery. .
A concern is to have a higher percentage of LEP students score at the mastery level in both math and reading.
PRIORITIES1. To meet annual measurable objectives for reading/language arts and mathematics for students with disabilities and low SES students. 2.
To increase the number of schools making AYP. 3. To increase achivement in middle and high school mathematics, reading language arts, and middle school writing.
C. OTHER STUDENT OUTCOMESANALYSIS
Attendance Report (by subgroup if available)The Attendance Rate for 2006-2007 was 97.7% down .4% from 2005-2006. Attendance rates had improved from 98.0% in 2004-05 to 98.1% in 2005-06. Discipline Referral ReportReducing school suspensions, bullying, harassment, intimidation, assaults and substance abuse at the school play an important part in allowing students to feel safe while continuing to learn in a safe school environment. Students at the junior high schools accounted for 57% of the suspensions in 2006-07. The total number of suspensions has shown an increasing trend over the last four years. Discipline referrals continue to be tracked with the help of Wood County School's computer center. Dropout Rates/Graduation Rates (by subgroup if available)The graduation rate in 2007 was 87.2% (2006 86.1%). Graduation rates have increased each of the last four years from 83.4% in 2004. College Enrollment RateWood County's college-going rate has increased each year over the last three years. In 2003 the rate was 65.3%, 2004 was 70.5% and in 2005 the college-going rate was 71.8%. The 71.8% college-going rate is the third highest in West Virginia. College Developmental Course Rate36% of the students were required to take developmental courses (32% in Math & 17% Developmental English)PRIDE SurveyWood County students continue to experiment with cigarettes, alcohol, and marijuana at a rate consistent with students in the same grade level in the national sample. Multi-year comparisons show that overall use of cigarettes, beer and marijuana use in Wood County has declined. Cigarettes and beer are the most readily available drugs. Most drug use -regardless of the drug - occurs on the weekend at a friend’s house.
At each grade Wood County students have been threatened more and are more afraid that another student will hurt them at school than students at the same grade in the national sample. For the most part the older a student is, the safer they feel. In Wood County all students feel the safest place at school is in the classroom. Students feel the least safe on the school bus and in the school parking lot. Both places are traditionally the least supervised at school. CIMP Self AssessmentMeeting AYP for students with disabilities continues to be a priority in our county strategic plan. Participating in the pilot program for Response to Intervention (RtI) and concentrating on collaboration/teaming of general and special education teachers have been areas of focus. Wood County Schools continues to work toward having all professional special education personnel be highly qualified. In addition, there has been great improvement in completing initial evaluations for special education services within the 80-day timeframe as well as the transition of preschool students from Birth to Three (Part C). The graduation rate, dropout rate, and suspension rate of students with disabilities have improved but are still monitored as areas of concern. Lastly, Wood County Schools received an on-site focused monitoring self-assessment verification review on March 28, 2007 and no non-compliance issues were found. LEP - What are the number and percent of limited English proficiency (LEP) students?Of the 13,554 pre-k to twelfth grade students currently attending Wood County Schools (WCS), thirty-six (.26%) receive LEP services. The LEP students include three kindergarteners, four first graders, two second graders, four third graders, no fourth graders, seven fifth graders, three sixth graders, two seventh graders, three eighth graders, four ninth graders, and no students in grades ten through twelve. LEP - What are the major language groups?This group of thirty-six LEP students represents ten major language groups: Chinese (6), Vietnamese (4), Spanish (14), Portugese (1), Hindi (5). Japanese (1), German (1), Russian (1), Pager-English (2), and Telugu (1). LEP - What are the number and percent of immigrant students (*if available)?Students from foreign countries residing in the United States for less than one year are defined as immigrant students. Of the 36 identified LEP students in WCS, 4 fit the immigrant student definition. Thus, 11% of the LEP population in WCS has an immigrant status. LEP - What are the number and percent of migrant students?
Page 7 of 33WVDE - School System Strategic Plan
8/28/2008https://wveis.k12.wv.us/oneplan2008/district/print_plan.cfm?action=p

Currently, no migrant students have been identified in WCS.What are the number and percent of schools/levels serving LEP students?Sixteen of the twenty-seven public schools in Wood County (59%) currently serve one or more LEP students. More specifically, eleven of the nineteen elementary schools (58%), all five junior high schools (100%), and one of the three high schools (33%) serve at least one LEP student. Additionally, four private school students are served--a ninth grader and three tenth graders--all from the same private schoo.
D. CULTURE AND CONDITIONSANALYSIS
Office of Performance Audits Compliances and RecommendationsFollow up onsites at Jefferson Elementary Center, Edison Junior High and Hamilton Junior High showed all noncompliances had been satisfactorily addressed. Monitoring Reports (Special Education and NCLB)The OSE District Self-Assessment was submitted in December of 2004. Areas on non-compliance were addressed in certified employed Special Education personnel meeting the highly qualified standard, percentage of students with disabilities suspended or removed in comparison with non disabled students, as well as drop out rate and graduation rate of students with disabilities. Highly Qualified Personnel ReportThe percentage of courses taught by highly qualified teachers in Wood County is 97.8% This is well above the state average. In our high poverty and high ethnicity schools 100% of courses are taught by highly qualified teachers. Digital Divide Report (Technology)In order to provide web resources and gain maximum usage of our existing programs, we will strive to replace as many Windows 95 and 98 computers as possible with the funding available. Our Digital Divide Survey results indicate that we still have 155 Windows 95 and 1247 Windows 98 computers in schools. Replacement of these 95/98 machines is high priority. New lab machines will all be XP Pro or Windows Vista as appropriate. In other areas of the survey, Wood County seems to be very close to the state norm. In areas of need, we are already addressing ways to improve. Our technology activities coincide with our instructional strategies and our constant vigilance to maintain working, updated equipment is an ongoing goal. All schools will use Edline to improve home/school communication with a website and email.
Page 8 of 33WVDE - School System Strategic Plan
8/28/2008https://wveis.k12.wv.us/oneplan2008/district/print_plan.cfm?action=p

GOALS, SPECIFIC OBJECTIVE AND PERFORMANCE TARGET Goal 1: To assure that all students master an academically challenging curriculum.
Objective Objective Short Name Baseline 5-year Target1.1 The percentage of proficient aggregate
students in the elementary grade span will increase in reading/language arts.
1.1 Aggregate elem reading/lang arts
83.00 86.30
1.2 The percentage of proficient aggregate students in the elementary grade span will increase in mathematics.
1.2 Aggregate elementary mathematics
79.00 85.50
1.3 The percentage of proficient aggregate students in the middle grade span will increase in reading/language arts.
1.3 Aggregate middle reading/lang arts
82.00 83.80
1.4 The percentage of proficient aggregate students in the middle grade span will increase in mathematics.
1.4 Aggregate middle mathematics 79.00 80.10
1.5 The percentage of proficient aggregate students in the high school grade span will increase in reading/language arts.
1.5 Aggregate high sch reading/lang arts
79.00 79.50
1.6 The percentage of proficient aggregate students in the high school grade span will increase in mathematics.
1.6 Aggregate high sch mathematics
74.00 73.90
1.7 The percentage of disabled elementary students scoring below mastery in reading/language arts will decrease annually by at least 10%. (Safe Harbor beginning in 2007-08)
1.7 Disabled elem reading/lang arts
46.00 64.35
1.8 The percentage of disabled elementary students scoring below mastery in mathematics will decrease annually by at least 10%. (Safe Harbor beginning in 2007-08)
1.8 Disabled elem mathematics
47.00 63.87
1.9 The percentage of disabled middle school students scoring below mastery in reading/language arts will decrease annually by at least 10%. (Safe Harbor beginning in 2007-2008)
1.9 Disabled middle reading/lang arts
37.00 55.02
1.10 The percentage of disabled middle school students scoring below mastery in mathematics will decrease annually by at least 10%. (Safe Harbor beginning in 2007-08)
1.10 Disabled middle mathematics
32.00 52.03
1.11 The percentage of disabled high school students scoring below mastery in reading/language arts will decrease annually by at least 10%. (Safe Harbor beginning in 2007-08)
1.11 Disabled high reading/lang arts
31.00 54.80
1.12 The percentage of disabled high school students scoring below mastery in mathematics will decrease annually by at least 10%. (Safe Harbor beginning in 2007-08)
1.12 Disabled high mathematics
23.00 48.17
1.13 Wood County Schools will implement a prioritized standards-based curriculum and formative assessments in reading/language arts, mathematics, science and social studies. (Note: Baseline and targets indicate the percentage of implementation.)
1.13 Prioritized curr/formative assess
25.00 100.00
1.14 The percentage of proficient fourth grade students will increase.
1.14 Fourth grade writing assessment
76.00 77.00
1.15 The percentage of proficient seventh grade students will increase.
1.15 Seventh grade writing assessment
75.00 79.00
1.16 The percentage of proficient tenth grade students will increase.
1.16 Tenth grade writing assessment
89.00 93.00
1.17 There will be an annual increase in the percentage of LEP students who attain English proficiency.
1.17 LEP attain English proficiency 5.50 8.00
1.18 Their will be an annual increase in the percentage of LEP students making progress in learning English.
1.18 LEP progress learning English 0.00 29.00
1.19 Note: This represents objectives 1.1-1.12 which are addressed by the same action steps.
All core curriculum objectives 0.00 0.00
Goal 2: To employ and support personnel to effectively instruct, engage, manage, and
Page 9 of 33WVDE - School System Strategic Plan
8/28/2008https://wveis.k12.wv.us/oneplan2008/district/print_plan.cfm?action=p

evaluate student learning.Objective Objective Short Name Baseline 5-year Target
2.1 By the start of the 2006-07 school year, 100% of classroom teachers will meet Highly Qualified Teacher requirements.
2.1 100% HQT 96.00 100.00
Goal 3: To assure a positive learning environment and create community pride by providing clean, safe, and well maintained facilities and grounds.
Objective Objective Short Name Baseline 5-year Target3.1 By August 2008, the construction of all
high schools will be sufficiently complete to allow for grade configuration change.
3.1 High School construction completed
10.00 100.00
3.2 Wood County Schols will provide funding sources to complete Priority 1 and 2 Capital Improvement Projects at all Elementary and Middle schools.
3.2 Elem/Middle Capital Improve Project
500000.00 999999.00
3.3 Safety Policies governing school building security and access control measures will be implemented and consistent across the county
3.3 Safety Policies and Practices
80.00 100.00
Goal 4: To assure that all schools have effective leadership, culture, and organizational practices that result in all students mastering the essential curriculum and beyond.
Objective Objective Short Name Baseline 5-year Target4.1 The number of Pre-K students served by
Wood County Schools will show an increasing trend.
4.1 Increase in pre-k students 305.00 700.00
4.2 Wood County Schools will implement effective leadership practices and school organizational structures to enable all schools to make AYP.
4.2 Leaders/organization for AYP
22.00 27.00
4.3 The number of students suspended for violation of ATOD Policy will be reduced by 5%
4.3 Reduce student ATOD use 155.00 140.00
4.4 The number of students suspended for physical fights will decrease by 5% 4.4 Reduce student violence 224.00 200.00
Goal 5: Technology Goal: To provide access to appropriate technology resources in order to increase student achievement and foster development of 21st century learning skills.
Objective Objective Short Name Baseline 5-year Target5.1 To increase the percentage of
workstations running Windows 2000 or newer operating system by 10% or more each year.
5.1 Technology
0.38 100.00
Page 10 of 33WVDE - School System Strategic Plan
8/28/2008https://wveis.k12.wv.us/oneplan2008/district/print_plan.cfm?action=p

Goal 1: To assure that all students master an academically challenging curriculum.Objective 1.1 The percentage of proficient aggregate students in the elementary grade span will increase in reading/language arts.
As measured by: WESTESTBaseline Data 83.00
Targets Actual2005-2006 88.00 2005-2006 83.502006-2007 88.50 2006-2007 83.302007-2008 84.30 2007-2008 N/A2008-2009 85.30 2008-2009 N/A2009-2010 86.30 2009-2010 N/A
Objective 1.2 The percentage of proficient aggregate students in the elementary grade span will increase in mathematics.
As measured by: WESTESTBaseline Data 79.00
Targets Actual2005-2006 84.00 2005-2006 82.102006-2007 87.10 2006-2007 82.502007-2008 83.50 2007-2008 N/A2008-2009 84.50 2008-2009 N/A2009-2010 85.50 2009-2010 N/A
Objective 1.3 The percentage of proficient aggregate students in the middle grade span will increase in reading/language arts.
As measured by: WESTESTBaseline Data 82.00
Targets Actual2005-2006 87.00 2005-2006 82.302006-2007 87.30 2006-2007 80.802007-2008 81.80 2007-2008 N/A2008-2009 82.80 2008-2009 N/A2009-2010 83.80 2009-2010 N/A
Objective 1.4 The percentage of proficient aggregate students in the middle grade span will increase in mathematics.
As measured by: WESTESTBaseline Data 79.00
Targets Actual2005-2006 84.00 2005-2006 77.902006-2007 82.90 2006-2007 77.102007-2008 78.10 2007-2008 N/A2008-2009 79.10 2008-2009 N/A2009-2010 80.10 2009-2010 N/A
Objective 1.5 The percentage of proficient aggregate students in the high school grade span will increase in reading/language arts.
As measured by: WESTESTBaseline Data 79.00
Targets Actual2005-2006 84.00 2005-2006 81.802006-2007 86.80 2006-2007 76.502007-2008 77.50 2007-2008 N/A2008-2009 78.50 2008-2009 N/A2009-2010 79.50 2009-2010 N/A
Objective 1.6 The percentage of proficient aggregate students in the high school grade span will increase in mathematics.
As measured by: WESTESTBaseline Data 74.00
Targets Actual2005-2006 79.00 2005-2006 75.602006-2007 80.60 2006-2007 70.902007-2008 71.90 2007-2008 N/A2008-2009 72.90 2008-2009 N/A2009-2010 73.90 2009-2010 N/A
Objective 1.7 The percentage of disabled elementary students scoring below mastery in reading/language arts will decrease annually by at least 10%. (Safe
Page 11 of 33WVDE - School System Strategic Plan
8/28/2008https://wveis.k12.wv.us/oneplan2008/district/print_plan.cfm?action=p

Harbor beginning in 2007-08)
As measured by: WESTESTBaseline Data 46.00
Targets Actual2005-2006 52.00 2005-2006 48.402006-2007 54.40 2006-2007 51.102007-2008 55.99 2007-2008 N/A2008-2009 60.39 2008-2009 N/A2009-2010 64.35 2009-2010 N/A
Objective 1.8 The percentage of disabled elementary students scoring below mastery in mathematics will decrease annually by at least 10%. (Safe Harbor beginning in 2007-08)
As measured by: WESTESTBaseline Data 47.00
Targets Actual2005-2006 53.00 2005-2006 52.902006-2007 58.90 2006-2007 51.802007-2008 56.62 2007-2008 N/A2008-2009 60.96 2008-2009 N/A2009-2010 63.87 2009-2010 N/A
Objective 1.9 The percentage of disabled middle school students scoring below mastery in reading/language arts will decrease annually by at least 10%. (Safe Harbor beginning in 2007-2008)
As measured by: WESTESTBaseline Data 37.00
Targets Actual2005-2006 44.00 2005-2006 38.602006-2007 44.60 2006-2007 38.302007-2008 44.47 2007-2008 N/A2008-2009 50.02 2008-2009 N/A2009-2010 55.02 2009-2010 N/A
Objective 1.10 The percentage of disabled middle school students scoring below mastery in mathematics will decrease annually by at least 10%. (Safe Harbor beginning in 2007-08)
As measured by: WESTESTBaseline Data 32.00
Targets Actual2005-2006 38.00 2005-2006 29.202006-2007 35.20 2006-2007 34.202007-2008 40.78 2007-2008 N/A2008-2009 46.70 2008-2009 N/A2009-2010 52.03 2009-2010 N/A
Objective 1.11 The percentage of disabled high school students scoring below mastery in reading/language arts will decrease annually by at least 10%. (Safe Harbor beginning in 2007-08)
As measured by: WESTESTBaseline Data 31.00
Targets Actual2005-2006 37.00 2005-2006 41.302006-2007 47.30 2006-2007 38.002007-2008 44.20 2007-2008 N/A2008-2009 49.78 2008-2009 N/A2009-2010 54.80 2009-2010 N/A
Objective 1.12 The percentage of disabled high school students scoring below mastery in mathematics will decrease annually by at least 10%. (Safe Harbor beginning in 2007-08)
As measured by: WESTESTBaseline Data 23.00
Targets Actual2005-2006 29.00 2005-2006 25.802006-2007 31.80 2006-2007 28.902007-2008 36.01 2007-2008 N/A2008-2009 42.41 2008-2009 N/A2009-2010 48.17 2009-2010 N/A
Objective 1.13 Wood County Schools will implement a prioritized standards-based curriculum and formative assessments in reading/language arts, mathematics,
Page 12 of 33WVDE - School System Strategic Plan
8/28/2008https://wveis.k12.wv.us/oneplan2008/district/print_plan.cfm?action=p

science and social studies. (Note: Baseline and targets indicate the percentage of implementation.)
As measured by: The percent of implementation each yearBaseline Data 25.00
Targets Actual2005-2006 37.50 2005-2006 37.502006-2007 75.00 2006-2007 75.002007-2008 75.00 2007-2008 N/A2008-2009 100.00 2008-2009 N/A2009-2010 100.00 2009-2010 N/A
Objective 1.14 The percentage of proficient fourth grade students will increase.
As measured by: West Virginia Writing AssessmentBaseline Data 76.00
Targets Actual2005-2006 81.00 2005-2006 80.002006-2007 85.00 2006-2007 74.002007-2008 75.00 2007-2008 N/A2008-2009 76.00 2008-2009 N/A2009-2010 77.00 2009-2010 N/A
Objective 1.15 The percentage of proficient seventh grade students will increase.
As measured by: West Virginia Writing AssessmentBaseline Data 75.00
Targets Actual2005-2006 85.00 2005-2006 77.002006-2007 82.00 2006-2007 76.002007-2008 77.00 2007-2008 N/A2008-2009 78.00 2008-2009 N/A2009-2010 79.00 2009-2010 N/A
Objective 1.16 The percentage of proficient tenth grade students will increase.
As measured by: West Virginia Writing AssessmentBaseline Data 89.00
Targets Actual2005-2006 94.00 2005-2006 82.002006-2007 87.00 2006-2007 90.002007-2008 91.00 2007-2008 N/A2008-2009 92.00 2008-2009 N/A2009-2010 93.00 2009-2010 N/A
Objective 1.17 There will be an annual increase in the percentage of LEP students who attain English proficiency.
As measured by: WESTELLBaseline Data 5.50
Targets Actual2005-2006 6.00 2005-2006 0.102006-2007 6.50 2006-2007 6.452007-2008 7.00 2007-2008 N/A2008-2009 7.50 2008-2009 N/A2009-2010 8.00 2009-2010 N/A
Objective 1.18 Their will be an annual increase in the percentage of LEP students making progress in learning English.
As measured by: WESTELLBaseline Data 0.00
Targets Actual2005-2006 25.00 2005-2006 25.002006-2007 26.00 2006-2007 33.002007-2008 27.00 2007-2008 N/A2008-2009 28.00 2008-2009 N/A2009-2010 29.00 2009-2010 N/A
Objective 1.19 Note: This represents objectives 1.1-1.12 which are addressed by the same action steps.
As measured by: WESTESTBaseline Data 0.00
Page 13 of 33WVDE - School System Strategic Plan
8/28/2008https://wveis.k12.wv.us/oneplan2008/district/print_plan.cfm?action=p

Targets Actual2005-2006 0.00 2005-2006 0.002006-2007 0.00 2006-2007 0.002007-2008 0.00 2007-2008 N/A2008-2009 0.00 2008-2009 N/A2009-2010 0.00 2009-2010 N/A
Page 14 of 33WVDE - School System Strategic Plan
8/28/2008https://wveis.k12.wv.us/oneplan2008/district/print_plan.cfm?action=p

Goal 2: To employ and support personnel to effectively instruct, engage, manage, and evaluate student learning.Objective 2.1 By the start of the 2006-07 school year, 100% of classroom teachers will meet Highly Qualified Teacher requirements.
As measured by: The percentage of teachers in core subjects that are highly qualified according to certification and NCLB standardsBaseline Data 96.00
Targets Actual2005-2006 98.00 2005-2006 97.802006-2007 100.00 2006-2007 0.002007-2008 100.00 2007-2008 N/A2008-2009 100.00 2008-2009 N/A2009-2010 100.00 2009-2010 N/A
Page 15 of 33WVDE - School System Strategic Plan
8/28/2008https://wveis.k12.wv.us/oneplan2008/district/print_plan.cfm?action=p
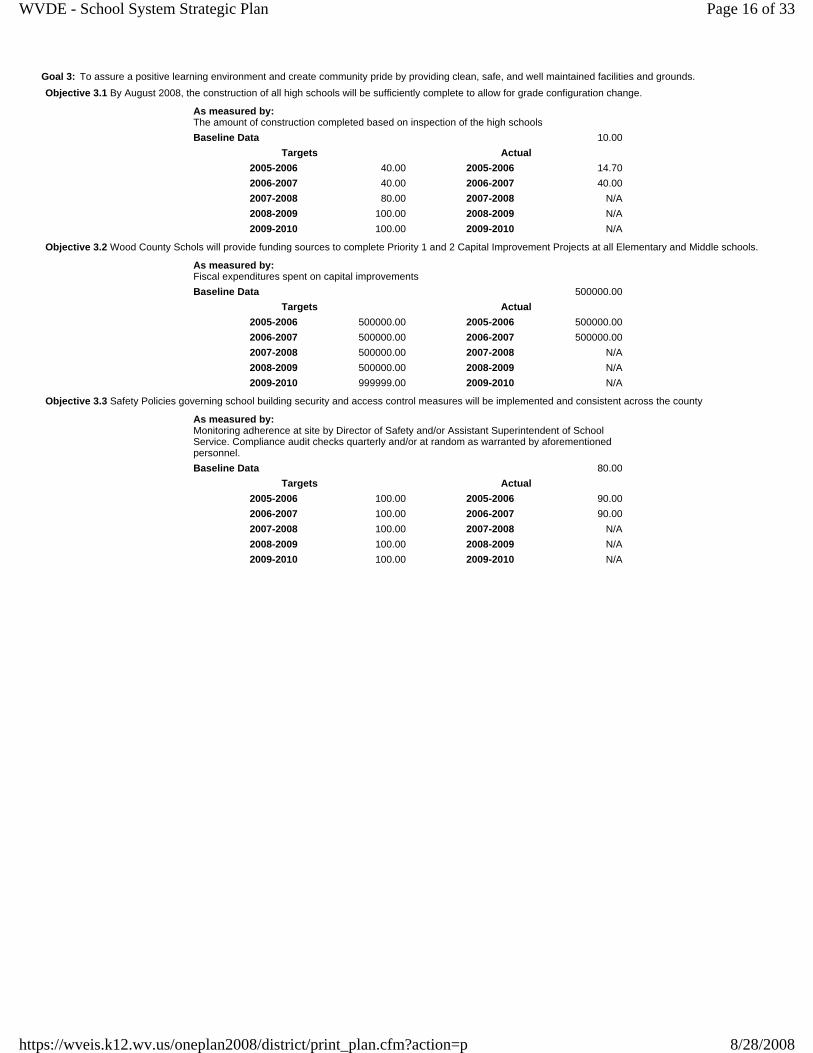
Goal 3: To assure a positive learning environment and create community pride by providing clean, safe, and well maintained facilities and grounds. Objective 3.1 By August 2008, the construction of all high schools will be sufficiently complete to allow for grade configuration change.
As measured by: The amount of construction completed based on inspection of the high schoolsBaseline Data 10.00
Targets Actual2005-2006 40.00 2005-2006 14.702006-2007 40.00 2006-2007 40.002007-2008 80.00 2007-2008 N/A2008-2009 100.00 2008-2009 N/A2009-2010 100.00 2009-2010 N/A
Objective 3.2 Wood County Schols will provide funding sources to complete Priority 1 and 2 Capital Improvement Projects at all Elementary and Middle schools.
As measured by: Fiscal expenditures spent on capital improvementsBaseline Data 500000.00
Targets Actual2005-2006 500000.00 2005-2006 500000.002006-2007 500000.00 2006-2007 500000.002007-2008 500000.00 2007-2008 N/A2008-2009 500000.00 2008-2009 N/A2009-2010 999999.00 2009-2010 N/A
Objective 3.3 Safety Policies governing school building security and access control measures will be implemented and consistent across the county
As measured by: Monitoring adherence at site by Director of Safety and/or Assistant Superintendent of School Service. Compliance audit checks quarterly and/or at random as warranted by aforementioned personnel.Baseline Data 80.00
Targets Actual2005-2006 100.00 2005-2006 90.002006-2007 100.00 2006-2007 90.002007-2008 100.00 2007-2008 N/A2008-2009 100.00 2008-2009 N/A2009-2010 100.00 2009-2010 N/A
Page 16 of 33WVDE - School System Strategic Plan
8/28/2008https://wveis.k12.wv.us/oneplan2008/district/print_plan.cfm?action=p

Goal 4: To assure that all schools have effective leadership, culture, and organizational practices that result in all students mastering the essential curriculum and beyond.
Objective 4.1 The number of Pre-K students served by Wood County Schools will show an increasing trend.
As measured by: The number of Pre-K students enrolled in Wood County SchoolsBaseline Data 305.00
Targets Actual2005-2006 400.00 2005-2006 502.002006-2007 540.00 2006-2007 548.002007-2008 580.00 2007-2008 N/A2008-2009 620.00 2008-2009 N/A2009-2010 700.00 2009-2010 N/A
Objective 4.2 Wood County Schools will implement effective leadership practices and school organizational structures to enable all schools to make AYP.
As measured by: The number of schools that make AYP each yearBaseline Data 22.00
Targets Actual2005-2006 23.00 2005-2006 24.002006-2007 24.00 2006-2007 20.002007-2008 25.00 2007-2008 N/A2008-2009 26.00 2008-2009 N/A2009-2010 27.00 2009-2010 N/A
Objective 4.3 The number of students suspended for violation of ATOD Policy will be reduced by 5%
As measured by: WVEIS, Coordinator program recordsBaseline Data 155.00
Targets Actual2005-2006 155.00 2005-2006 155.002006-2007 150.00 2006-2007 179.002007-2008 150.00 2007-2008 N/A2008-2009 145.00 2008-2009 N/A2009-2010 140.00 2009-2010 N/A
Objective 4.4 The number of students suspended for physical fights will decrease by 5%
As measured by: WVEIS, Coordinator program recordsBaseline Data 224.00
Targets Actual2005-2006 224.00 2005-2006 224.002006-2007 220.00 2006-2007 216.002007-2008 210.00 2007-2008 N/A2008-2009 205.00 2008-2009 N/A2009-2010 200.00 2009-2010 N/A
Page 17 of 33WVDE - School System Strategic Plan
8/28/2008https://wveis.k12.wv.us/oneplan2008/district/print_plan.cfm?action=p

Goal 5: Technology Goal: To provide access to appropriate technology resources in order to increase student achievement and foster development of 21st century learning skills.
Objective 5.1 To increase the percentage of workstations running Windows 2000 or newer operating system by 10% or more each year.
As measured by: Digital Divide SurveyBaseline Data 0.38
Targets Actual2005-2006 0.48 2005-2006 0.502006-2007 0.58 2006-2007 0.692007-2008 0.68 2007-2008 N/A2008-2009 0.88 2008-2009 N/A2009-2010 100.00 2009-2010 N/A
Page 18 of 33WVDE - School System Strategic Plan
8/28/2008https://wveis.k12.wv.us/oneplan2008/district/print_plan.cfm?action=p

HIGH YIELD STRATEGIES THAT WILL BE UTILIZED TO COMPLETE
THE FIVE YEAR PLAN CURRICULUM INSTRUCTION SCHOOL
EFFECTIVENESS STUDENT/PARENT SUPPORT
CONTINUOUS IMPROVEMENT
Rigorous Performance in Core
Subjects Classroom Environments Culture of Support and Trust and
Collaboration
Culture that Accepts
Responsibility for Students District Leadership to Create
Learning Centered Schools
21st Century Content Instructional Management Performance Goals to Develop
21st Century Learners
Innovative Approaches to
Meeting Subgroup Needs Change as an On-Going
Continuous Process
Standards-Based Curriculum
Standards-Based Unit and
Lesson Design Leadership Development
Support System for Student Physical and Social and
Emotional Needs Identification of System-Wide
Core Beliefs
Prioritization and Mapping 21st Century Learning Skills Integration of 21st Century
Learning
Developmental Guidance with Character and Career Education
Development Well-Articulated Mission
Performance Benchmarks Differentiated Instruction Balanced Professional
Development
Strategies that Develop Students having 21st Century Learning
Skills Change Based on Internal and
External Factors
Balanced Assessment System
Research-Based High Yield
Instructional Strategies Presence of the Correlates of Effective Schools
Effective Transition Pre K to Post
Secondary Systemic Design and
Implementation
Pre K-12 Literacy Model Authentic Classroom
Assessments Understanding the Need to
Develop 21st Century Graduates Parents as Respected and
Valued Partners Use of Data to Target
Improvement Efforts
Pre K-12 Mathematics Model
Adjustment of Instructional Time
Professional Development for
School Strategic Planning
Committees
Parent Involvement
Communication System Change Processes that Address Interrelatedness of Activities and
Resources
Curriculum Support System Integration of Literacy Strategies
Support for the Work of the School Strategic Planning
Process Proactive Community
Plan and Do and Study and Act
Cycle
Curriculum Monitoring Process
Accelerated Learning Analyze Trends and Establish
Priorities for School Improvement Data-Based System for
Monitoring Student Academic
and Personal Progress Collaboratively Developed
Strategic Plan
Instructional Support System
Time and Resources to Support
School-Based Learning
Communities
Effective Preschool Programs
Instructional Monitoring System
Support for School-Based
Professional Development that is
Ongoing and Embedded
Highly Qualified Teachers District Monitoring System for
School Accountability
Time Prior to and During the Instructional Term for Meaningful
Staff Planning
Other Strategies Staff Training
Comprehensive Multi-Component Approach
Clear and Consistent Consequences
Conflict Resolution and Peer Mediation
Technology Integration
Page 19 of 33WVDE - School System Strategic Plan
8/28/2008https://wveis.k12.wv.us/oneplan2008/district/print_plan.cfm?action=p
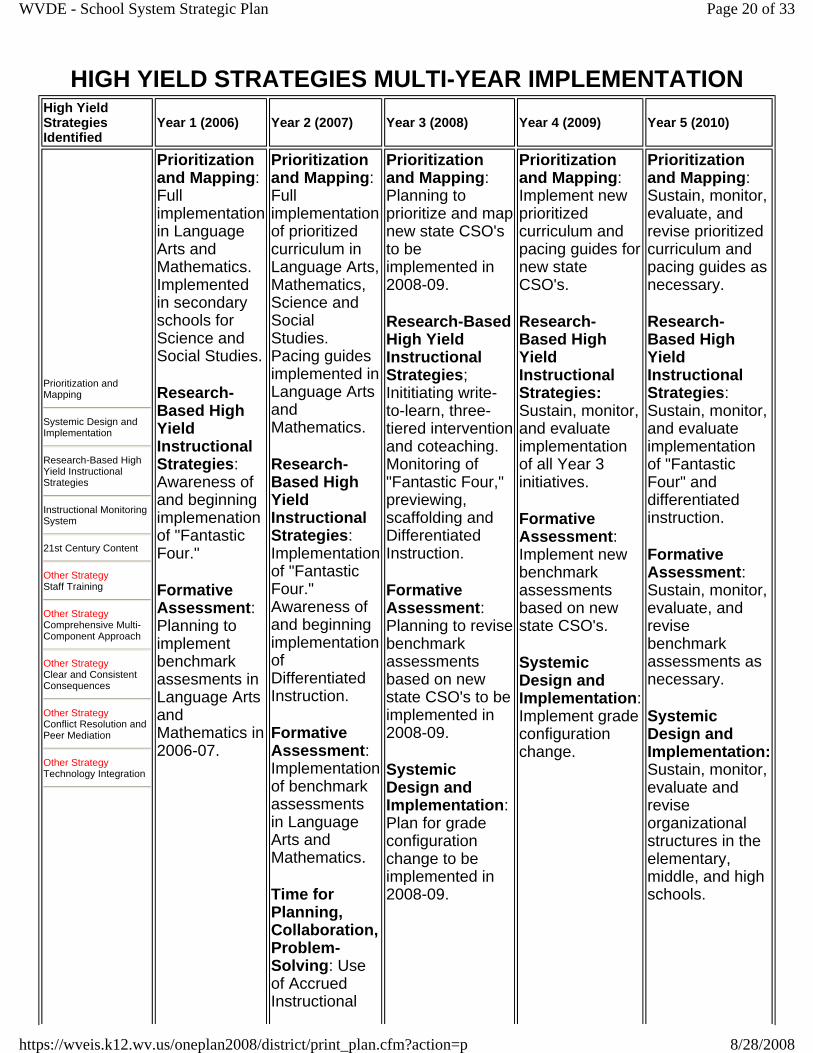
HIGH YIELD STRATEGIES MULTI-YEAR IMPLEMENTATION High Yield Strategies Identified
Year 1 (2006) Year 2 (2007) Year 3 (2008) Year 4 (2009) Year 5 (2010)
Prioritization and Mapping
Systemic Design and Implementation
Research-Based High Yield Instructional Strategies
Instructional Monitoring System
21st Century Content
Other Strategy Staff Training
Other Strategy Comprehensive Multi-Component Approach
Other Strategy Clear and Consistent Consequences
Other Strategy Conflict Resolution and Peer Mediation
Other Strategy Technology Integration
Prioritization and Mapping: Full implementation in Language Arts and Mathematics. Implemented in secondary schools for Science and Social Studies.
Research-Based High Yield Instructional Strategies: Awareness of and beginning implemenation of "Fantastic Four."
Formative Assessment: Planning to implement benchmark assesments in Language Arts and Mathematics in 2006-07.
Prioritization and Mapping: Full implementation of prioritized curriculum in Language Arts, Mathematics, Science and Social Studies. Pacing guides implemented in Language Arts and Mathematics.
Research-Based High Yield Instructional Strategies: Implementation of "Fantastic Four." Awareness of and beginning implementation of Differentiated Instruction.
Formative Assessment: Implementation of benchmark assessments in Language Arts and Mathematics.
Time for Planning, Collaboration, Problem-Solving: Use of Accrued Instructional
Prioritization and Mapping: Planning to prioritize and map new state CSO's to be implemented in 2008-09.
Research-Based High Yield Instructional Strategies; Inititiating write-to-learn, three-tiered intervention and coteaching. Monitoring of "Fantastic Four," previewing, scaffolding and Differentiated Instruction.
Formative Assessment: Planning to revise benchmark assessments based on new state CSO's to be implemented in 2008-09.
Systemic Design and Implementation: Plan for grade configuration change to be implemented in 2008-09.
Prioritization and Mapping: Implement new prioritized curriculum and pacing guides for new state CSO's.
Research-Based High Yield Instructional Strategies: Sustain, monitor, and evaluate implementation of all Year 3 initiatives.
Formative Assessment: Implement new benchmark assessments based on new state CSO's.
Systemic Design and Implementation: Implement grade configuration change.
Prioritization and Mapping: Sustain, monitor, evaluate, and revise prioritized curriculum and pacing guides as necessary.
Research-Based High Yield Instructional Strategies: Sustain, monitor, and evaluate implementation of "Fantastic Four" and differentiated instruction.
Formative Assessment: Sustain, monitor, evaluate, and revise benchmark assessments as necessary.
Systemic Design and Implementation: Sustain, monitor, evaluate and revise organizational structures in the elementary, middle, and high schools.
Page 20 of 33WVDE - School System Strategic Plan
8/28/2008https://wveis.k12.wv.us/oneplan2008/district/print_plan.cfm?action=p

time on three days to analyze formative assessments. Implementation of collaborative time at least twice monthly in each school.
Page 21 of 33WVDE - School System Strategic Plan
8/28/2008https://wveis.k12.wv.us/oneplan2008/district/print_plan.cfm?action=p

HIGH YIELD STRATEGIES SCIENTIFICALLY BASED RESEARCH High Yield Strategies Identified Scientifically Based ResearchPrioritization and Mapping Title I compliance
<:namespace prefix = o /> If the purpose of the assignment is to improve student learning, then the teacher should employ formative assessment. This focuses on giving students frequent quick feedback as written comments. The results of formative assessment often drive changes in instructional strategies, collaboration among staff, modification of school schedules, and realignment of resources. To be most effective, formative assessment must be ongoing.
If the purpose of the assignment is to create a finished product, then the teacher should employ summative assessments. The teacher gives the feedback needed to “justify” the grade assigned. The teacher must establish sound assessment criteria and inform students of this criterion. Doing these two things enables student and faculty expectations to match. It makes defending your summative assessments much easier.
(Erin Hogan Fouberg, Summative versus Formative Assessment, Teaching and Learning Technologies, TIP)
Systemic Design and Implementation
Research-Based High Yield Instructional Strategies
Instructional Monitoring System
21st Century Content
Other Strategy Staff Training
Title IV: Studies indicate that prevention programs are most effective when teachers are trained by program developers or prevention experts.
Supporting Citation:
Dusenbury, L. & Falco, M. (1995). Eleven components of effective drug abuse prevention curricula. Journal of School Health, 65(10) 420-425.
Other Strategy Comprehensive Multi-Component Approach Title IV: Programs that use a combination of (1) normative education, (2)
information about the consequences of drugs and violence and (3) social skills training, including social influences training (especially peer pressure resistance skills) are more successful in preventing drug use, crime and delinquency than using a single approach.
Supporting Citations:
Dent, C.W. et al. (1995). Two-year behavior outcomes of Project No Tobacco Use. Journal of Clinical and Consulting Psychology, 63, 676-677.
Gottfredson, D.C. (1997). School-based crime prevention. In L. Sherman (Ed.), Preventing crime: what works, what doesn't, what's promising: A report to the United States Congress (pp. 5-1 - 5-74). Washington, DC: US Department of Justice.
Hansen, W.B. (1992) School-based substance abuse prevention: A review of the state of the art in curriculum, 1980-1990. Health Education Research: Theory and
Page 22 of 33WVDE - School System Strategic Plan
8/28/2008https://wveis.k12.wv.us/oneplan2008/district/print_plan.cfm?action=p

Practice 7(3), 403-430.
Hawkins, W.B., Catalano, R.F. & Miller, J.Y. (1992). Risk and protective factors for alcohol and other drug problems in adolescence and early adulthood: Implications for substance abuse prevention. Pscyhological Bulletin, 112(1), 64-105.
Other Strategy Clear and Consistent Consequences
Title IV: Schools that actively respond to problem behaviors and cultivate a positive, healthy environment have lasting effects on students' long-term behaviors in adolescence and beyond.
Supporting Citation:
Anderson, J. (2002). Nix the quick fix: middle-school discipline for the long term. Independent School, 61(4), pp. 64-71.
Gottfredson, D.C., Gottfredson, G.D., & Hybl, L.G. (1993). Managing adolescent behavior: A multi year, multi school study. American Educational Research Journal, 30(1), pp. 179-215.
Lewis TJ, Sugai G, Colvin G (1998). Reducing problem behavior through a school-wide system of effective behavior support: investigation of a school-wide social skills training program and contextual interventions. School Psychology Review, 27(3), pp. 446-459.
St. Leger, L. H. (1999). The opportunities and effectiveness of the health promoting primary school in improving child health: a review of the claims and evidence. Health Education Research, 14(1), pp. 51-69.
Other Strategy Conflict Resolution and Peer Mediation
Title IV: Conflict resolution provides training to an entire class, grade, or school. In general, these programs teach students to manage anger, control aggressive responses, understand conflict, and avoid and diffuse potentially violent confrontations. Peer mediation training is provided to a few selected students. They are taught to mediate disputes between other students. Both conflict resolution and peer mediation allow students to settle disagreements peacefully among themselves. Research has found that some programs have had a positive impact on students' attitudes about interpersonal violence, improve school discipline, and positively impact absenteeism.
Supporting Citations:
DuRant, R.J. et al. (1996). Comparison of two violence prevention curricula for middle school adolescents. Journal of Adolescent Health, 19, 111-117.
Johnson,D.W. (1996). Conflict resolution and peer mediation programs in elementary and secondary schools: a review of the research. Review of Educational Research, 66(4), p.459-506.
Lindsay, Paul (1998). Conflict resolution and peer mediation in public schools: what works?. Mediation Quarterly, v.16,no.1, 85-99.
Powell, K.E., Muir-McClain, L. and Halasyamani, L. (1995) A review of selected school-based conflict resolution and peer mediation projects. Journal of School Health 65(10), 426-431.
Other Strategy
Page 23 of 33WVDE - School System Strategic Plan
8/28/2008https://wveis.k12.wv.us/oneplan2008/district/print_plan.cfm?action=p

Technology Integration
Page 24 of 33WVDE - School System Strategic Plan
8/28/2008https://wveis.k12.wv.us/oneplan2008/district/print_plan.cfm?action=p

Technology PlanSubmitted by - rwm96001 2007-09-14 15:27:57.0
E-rate Year 2008-2009 Federal CompliancesFederal/State Compliances listed below must be addressed in the county/school plan.
Technology -01 – USING TECHNOLOGY EQUIPMENT/INFRASTRUCTURE FOR EQUITABLE ACCESS TO 21ST CENTURY TECHNOLOGY TOOLS List one or more activity/strategy that describes how the county/school will budget for and use the technology equipment/infrastructure that supports the acquisition of twenty-first century skills The action steps should ensure that the capabilities of the technology infrastructure are adequate for acceptable performance of the technology being implemented in the public schools. Technology 02 - TECHNOLOGY INTEGRATION FOR 21st CENTURY SKILLS/STUDENT ACHIEVEMENT List one or more activity/strategy that focuses on using technology to improve achievement of all students with special emphasis on high need and high poverty students. The strategies/action steps should include how 21st century tools and skills will allow students to access information, solve problems, communicate clearly, make informed decisions, acquire new knowledge, construct products, reports and systems and access online assessment systems. Technology 03- PROVIDING COLLABORATION/COMMUNICATION TOOLS (TELECOMMUNICATIONS NETWORK/EMAIL) List one or more activity/strategy that describes how the county/school will ensure that the use of telecommunications and internal connections in the schools will enhance student learning. The action steps/strategies should ensure sufficient bandwidth to support teaching and learning and to provide satisfactorily for instructional management needs. Technology 04- INCREASED ACCESS FOR STUDENTS AND TEACHERS TO 21ST CENTURY TOOLS List one or more activity/strategy that describes how the county/school will provide increased access to technology for students and teachers. . Technology 05 – DELIVERY OF 21ST CENTURY CONTENT THROUGH DISTANCE LEARNING List one or more activity/strategy that describes how the county/school will use innovative strategies (e.g., distance learning) to provide for an effective model for the distance delivery or virtual delivery of instruction in subjects where there exists low student enrollment or a shortage of certified teachers or where the delivery method substantially improves the quality of an instructional program (e.g., WV Virtual School). Technology 06- 21ST CENTURY PARENT/COMMUNITY/PARTNERSHIP COLLABORATION Include strategies for promoting collaboration with various partners including parents, community organizations, higher education, schools of colleges and universities, employers and content providers. Technology 07- PROFESSIONAL DEVELOPMENT FOR 21ST CENTURY INSTRUCTION Include professional development activities for using the telecommunications network for training teachers and administrators to improve the integration of technology. Include strategy(ies) (e.g., technology integration specialists). to provide ongoing support and assistance to teachers in integrating technology into twenty-first century instruction. Technology 08- MAINTENANCE AND REPAIR OF 21ST CENTURY TOOLS List one or more activity/strategy that describes how the school/county will implement, support, maintain and repair all computer equipment and internal connections. Technology 09- ADULT LITERACY List one or more activity/strategy that describes how the school/ county will collaborate with adult literacy providers when appropriate.
Narrative SummaryThe county and school technology plans provide a description of how the county and schools plan to allocate adequate resources to provide students with equitable access to 21st century technology tools, including instructional offerings and appropriate curriculum, assessment and technology integration resources aligned to both the content and rigor of state content standards as well as to learning skills and technology tools. The plans include the various technologies that enable and enhance the attainment of 21st century skills outcomes for all students. How we plan for technology in our county and schools is based upon the validation from research-based evaluation findings from previous West Virginia-based evaluation projects. In addition, through the technology planning process, the county and schools continue to study and include emerging technologies for application in a twenty-first century learning environment. The purchase of technology through state contracts provides for uniformity in technological hardware and software standards and procedures. State provided anti-virus protection software helps to ensure network security and integrity. Expanded bandwidth, along with additional local, state and federal funding, provide increased ability for the county to ensure that the capabilities and capacities of the technology infrastructure are adequate for acceptable performance of the
Page 25 of 33WVDE - School System Strategic Plan
8/28/2008https://wveis.k12.wv.us/oneplan2008/district/print_plan.cfm?action=p
technology being implemented in the public schools. As an additional benefit, the county and schools enjoy the opportunity to purchase from state contracts that allow us to be able to take advantage of appropriate bulk purchasing abilities and to purchase from competitively bid contracts. An added benefit for our county and school data collection and reporting to the Department of Education and to the federal government is WVEIS, the state-provided comprehensive statewide uniform integrated education management and information system. Also developed by WVEIS, the online county and school’s technology plan’s structure allows flexibility to adjust the plan based on developing technology, federal and state requirements and changing local school and county needs. The online county and school technology plans are developed in compliance with United States Department of Education regulations and Federal Communications Commission requirements for federal E-rate discounts. The county and schools also continue to seek applicable federal government funds, philanthropic funds, and other partnership funds (or any combination of these types of funds) to augment state appropriations and encourage the pursuit of funding through grants, gifts and donations. Some technology initiatives in schools and counties may not be adequately addressed in the goals/objective/strategy section of the technology planning section. The county and school narrative allow planning teams to structure a framework/narrative description to describe how the county and schools will allocate adequate resources to provide students and teachers to twenty-first century technology tools,
Technology Needs AssessmentIn order to provide web resources and gain maximum usage of our existing programs, we will strive to replace as many Windows 95 and 98 computers as possible with the funding available. Our Digital Divide Survey results indicate that we still have 155 Windows 95 and 1247 Windows 98 computers in schools. Replacement of these 95/98 machines is high priority. New lab machines will all be XP Pro or Windows Vista as appropriate. In other areas of the survey, Wood County seems to be very close to the state norm. In areas of need, we are already addressing ways to improve. Our technology activities coincide with our instructional strategies and our constant vigilance to maintain working, updated equipment is an ongoing goal. All schools will use Edline to improve home/school communication with a website and email.
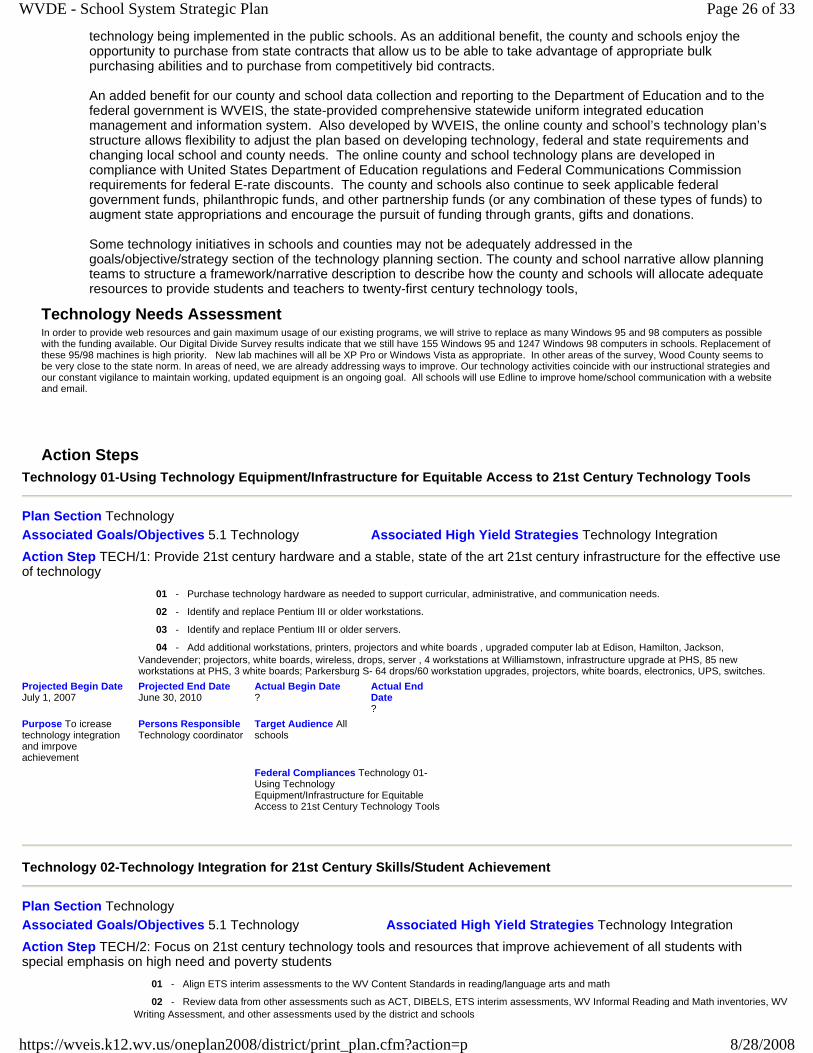
Action StepsTechnology 01-Using Technology Equipment/Infrastructure for Equitable Access to 21st Century Technology Tools
Plan Section Technology Associated Goals/Objectives 5.1 Technology Associated High Yield Strategies Technology Integration Action Step TECH/1: Provide 21st century hardware and a stable, state of the art 21st century infrastructure for the effective use of technology
01 - Purchase technology hardware as needed to support curricular, administrative, and communication needs. 02 - Identify and replace Pentium III or older workstations. 03 - Identify and replace Pentium III or older servers. 04 - Add additional workstations, printers, projectors and white boards , upgraded computer lab at Edison, Hamilton, Jackson, Vandevender; projectors, white boards, wireless, drops, server , 4 workstations at Williamstown, infrastructure upgrade at PHS, 85 new workstations at PHS, 3 white boards; Parkersburg S- 64 drops/60 workstation upgrades, projectors, white boards, electronics, UPS, switches.
Projected Begin Date July 1, 2007
Projected End Date June 30, 2010
Actual Begin Date ?
Actual End Date ?
Purpose To icrease technology integration and imrpove achievement
Persons Responsible Technology coordinator
Target Audience All schools
Federal Compliances Technology 01-Using Technology Equipment/Infrastructure for Equitable Access to 21st Century Technology Tools
Technology 02-Technology Integration for 21st Century Skills/Student Achievement
Plan Section Technology Associated Goals/Objectives 5.1 Technology Associated High Yield Strategies Technology Integration Action Step TECH/2: Focus on 21st century technology tools and resources that improve achievement of all students with special emphasis on high need and poverty students
01 - Align ETS interim assessments to the WV Content Standards in reading/language arts and math 02 - Review data from other assessments such as ACT, DIBELS, ETS interim assessments, WV Informal Reading and Math inventories, WV Writing Assessment, and other assessments used by the district and schools
Page 26 of 33WVDE - School System Strategic Plan
8/28/2008https://wveis.k12.wv.us/oneplan2008/district/print_plan.cfm?action=p
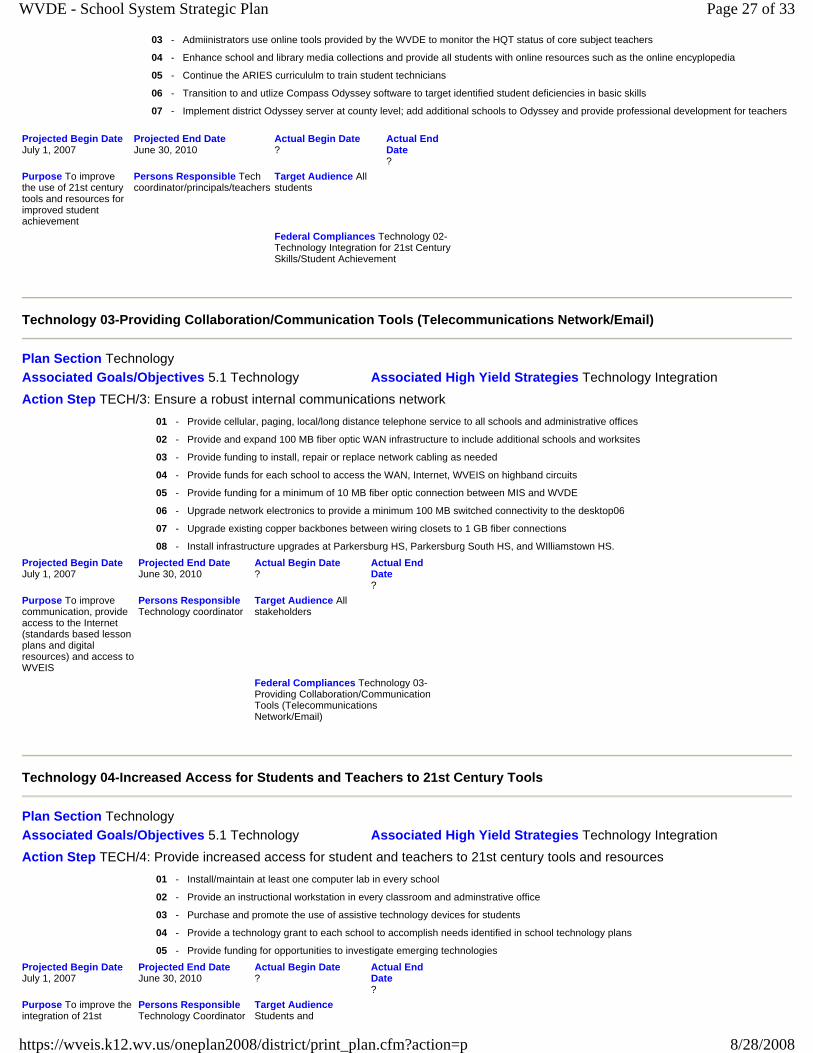
03 - Admiinistrators use online tools provided by the WVDE to monitor the HQT status of core subject teachers 04 - Enhance school and library media collections and provide all students with online resources such as the online encyplopedia 05 - Continue the ARIES curricululm to train student technicians 06 - Transition to and utlize Compass Odyssey software to target identified student deficiencies in basic skills 07 - Implement district Odyssey server at county level; add additional schools to Odyssey and provide professional development for teachers
Projected Begin Date July 1, 2007
Projected End Date June 30, 2010
Actual Begin Date ?
Actual End Date ?
Purpose To improve the use of 21st century tools and resources for improved student achievement
Persons Responsible Tech coordinator/principals/teachers
Target Audience All students
Federal Compliances Technology 02-Technology Integration for 21st Century Skills/Student Achievement
Technology 03-Providing Collaboration/Communication Tools (Telecommunications Network/Email)
Plan Section Technology Associated Goals/Objectives 5.1 Technology Associated High Yield Strategies Technology Integration Action Step TECH/3: Ensure a robust internal communications network
01 - Provide cellular, paging, local/long distance telephone service to all schools and administrative offices 02 - Provide and expand 100 MB fiber optic WAN infrastructure to include additional schools and worksites 03 - Provide funding to install, repair or replace network cabling as needed 04 - Provide funds for each school to access the WAN, Internet, WVEIS on highband circuits 05 - Provide funding for a minimum of 10 MB fiber optic connection between MIS and WVDE 06 - Upgrade network electronics to provide a minimum 100 MB switched connectivity to the desktop06 07 - Upgrade existing copper backbones between wiring closets to 1 GB fiber connections 08 - Install infrastructure upgrades at Parkersburg HS, Parkersburg South HS, and WIlliamstown HS.
Projected Begin Date July 1, 2007
Projected End Date June 30, 2010
Actual Begin Date ?
Actual End Date ?
Purpose To improve communication, provide access to the Internet (standards based lesson plans and digital resources) and access to WVEIS
Persons Responsible Technology coordinator
Target Audience All stakeholders
Federal Compliances Technology 03-Providing Collaboration/Communication Tools (Telecommunications Network/Email)
Technology 04-Increased Access for Students and Teachers to 21st Century Tools
Plan Section Technology Associated Goals/Objectives 5.1 Technology Associated High Yield Strategies Technology Integration Action Step TECH/4: Provide increased access for student and teachers to 21st century tools and resources
01 - Install/maintain at least one computer lab in every school 02 - Provide an instructional workstation in every classroom and adminstrative office 03 - Purchase and promote the use of assistive technology devices for students 04 - Provide a technology grant to each school to accomplish needs identified in school technology plans 05 - Provide funding for opportunities to investigate emerging technologies
Projected Begin Date July 1, 2007
Projected End Date June 30, 2010
Actual Begin Date ?
Actual End Date ?
Purpose To improve the integration of 21st
Persons Responsible Technology Coordinator
Target Audience Students and
Page 27 of 33WVDE - School System Strategic Plan
8/28/2008https://wveis.k12.wv.us/oneplan2008/district/print_plan.cfm?action=p

century tools and resources across the curriculum to provide rigor, enhance learning and improve student achievement
teachers/administrators
Federal Compliances Technology 04-Increased Access for Students and Teachers to 21st Century Tools
Technology 05-Delivery of 21st Century Content through Distance Learning
Plan Section Technology Associated Goals/Objectives 5.1 Technology Associated High Yield Strategies Technology Integration Action Step TECH/5: Utilize innovative strategies for providing rigorous and specialized courses that may not be available without the use of 21st century tools and resources 01 - Provide online/distance courses when not otherwise available in school setting (e.g., WV Virtual School courses) Projected Begin Date July 1, 2007
Projected End Date June 30, 2010
Actual Begin Date ?
Actual End Date ?
Purpose To provide rigor/enhance learning/improve achievement
Persons Responsible Technology Coordinator/Princpals/Teachers
Target Audience Students
Federal Compliances Technology 05-Delivery of 21st Century Content through Distance Learning
Technology 06-21st Century Parent/Community/Partnership Collaboration
Plan Section Technology Associated Goals/Objectives 5.1 Technology Associated High Yield Strategies Technology Integration Action Step TECH/6: Promote parental involvement and improved collaboration with community/home through the use of 21st century tools and resources
01 - Notify by letter, newspaper and electronic media all parents and students in Title I schools. identified for improvement of the option to transfer to another public school not identified for improvement with the LEA providing free transportatio01 02 - Implement and support Grade Quick in all secondary schools and in selected elementary schools. 03 - Implement a wide area rapid notification system for emergency and other communicaztion needs. 04 - Subscribe to a web-hosting service to develop interactive district and school websites.
Projected Begin Date July 1, 2007
Projected End Date June 30, 2010
Actual Begin Date ?
Actual End Date ?
Purpose To improve communication
Persons Responsible Technology coordinator/principal/teachers
Target Audience All stakeholders
Federal Compliances Technology 06-21st Century Parent/Community/Partnership Collaboration
Technology 07-Professional Development for 21st Century Instruction
Plan Section Technology Associated Goals/Objectives 5.1 Technology Associated High Yield Strategies Technology Integration Action Step TECH/7: Provide professional development for using the telecommunications network for training teachers and adminstrators to improve the integration of 21st century tools and resources
01 - Provide funds for the external evaluation of the Round 5 EETT grant 02 - Provide funds for travel expenses for training EETT technology integration specialists 03 - Employ two Technology Integration Specialists for the targeted EETT schools.
Page 28 of 33WVDE - School System Strategic Plan
8/28/2008https://wveis.k12.wv.us/oneplan2008/district/print_plan.cfm?action=p

04 - Provide support for selected secondary technology integration specialists as selected by the WVDE 05 - Train school staffs on the implementation and effective use of Edline and GradeQuick. 06 - Provide training for teachers to use TFS hardware/software to improve achievement, accomplish goals, enhance 21st century skills, and master the WV Technology Content Standards 07 - Provide substitutes for teachers to attend training sessions in support of local, state, and federal technology initiatives. 08 - Provide professional development in ETS for formative/interim assessments 09 - Provide professional development on DIBELS and assessment analysis.
Projected Begin Date July 1, 2007
Projected End Date June 30, 2010
Actual Begin Date ?
Actual End Date ?
Purpose To provide rigor, enhance learning/improve achievement
Persons Responsible Technology Coordinator
Target Audience Teachers/principals
Federal Compliances Technology 07-Professional Development for 21st Century Instruction
Technology 08-Maintenance and Repair of 21st Century Tools
Plan Section Technology Associated Goals/Objectives 5.1 Technology Associated High Yield Strategies Technology Integration Action Step TECH/8: Maintain and repair all computer equipment and internal connections
01 - Implement and expand use of the online technology work order system 02 - Provide repair services for technology equipment 03 - Provide replacement parts for technology hardware 04 - Provide training/professional development for technology support personnel
Projected Begin Date July 1, 2007
Projected End Date June 30, 2010
Actual Begin Date ?
Actual End Date ?
Purpose To provide a stable and robust 21st century learning environment
Persons Responsible Technology coordinator/RESA/Vendors/County technicians
Target Audience All stakeholders
Federal Compliances Technology 08-Maintenance and Repair of 21st Century Tools
Technology 09-Adult Literacy
Plan Section Technology Associated Goals/Objectives 5.1 Technology Associated High Yield Strategies Technology Integration Action Step TECH/9: Collaborate with adult literacy providers
01 - Cooperate with Adult Literacy providers to share technology resources in support of adult learning 02 - Provide hardware and software support to the Adult Basic Education Center
Projected Begin Date July 1, 2007
Projected End Date June 30, 2010
Actual Begin Date ?
Actual End Date ?
Purpose To improve the use of 21st century tools and resources
Persons Responsible Technology Coordinator/Adult literacy providers
Target Audience All stakeholders
Federal Compliances Technology 09-Adult Literacy
E-rate Budgets
Page 29 of 33WVDE - School System Strategic Plan
8/28/2008https://wveis.k12.wv.us/oneplan2008/district/print_plan.cfm?action=p
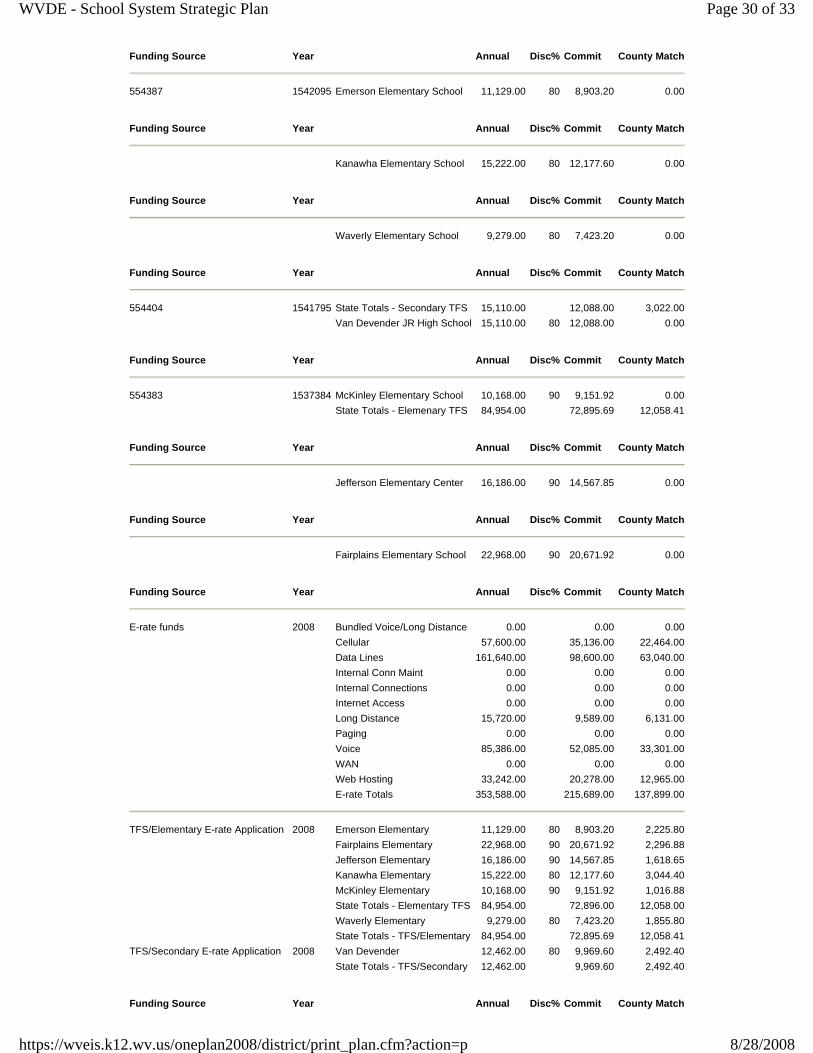
Funding Source Year Annual Disc% Commit County Match
554387 1542095 Emerson Elementary School 11,129.00 80 8,903.20 0.00
Funding Source Year Annual Disc% Commit County Match
Kanawha Elementary School 15,222.00 80 12,177.60 0.00
Funding Source Year Annual Disc% Commit County Match
Waverly Elementary School 9,279.00 80 7,423.20 0.00
Funding Source Year Annual Disc% Commit County Match
554404 1541795 State Totals - Secondary TFS 15,110.00 12,088.00 3,022.00Van Devender JR High School 15,110.00 80 12,088.00 0.00
Funding Source Year Annual Disc% Commit County Match
554383 1537384 McKinley Elementary School 10,168.00 90 9,151.92 0.00State Totals - Elemenary TFS 84,954.00 72,895.69 12,058.41
Funding Source Year Annual Disc% Commit County Match
Jefferson Elementary Center 16,186.00 90 14,567.85 0.00
Funding Source Year Annual Disc% Commit County Match
Fairplains Elementary School 22,968.00 90 20,671.92 0.00
Funding Source Year Annual Disc% Commit County Match
E-rate funds 2008 Bundled Voice/Long Distance 0.00 0.00 0.00Cellular 57,600.00 35,136.00 22,464.00Data Lines 161,640.00 98,600.00 63,040.00Internal Conn Maint 0.00 0.00 0.00Internal Connections 0.00 0.00 0.00Internet Access 0.00 0.00 0.00Long Distance 15,720.00 9,589.00 6,131.00Paging 0.00 0.00 0.00Voice 85,386.00 52,085.00 33,301.00WAN 0.00 0.00 0.00Web Hosting 33,242.00 20,278.00 12,965.00E-rate Totals 353,588.00 215,689.00 137,899.00
TFS/Elementary E-rate Application 2008 Emerson Elementary 11,129.00 80 8,903.20 2,225.80Fairplains Elementary 22,968.00 90 20,671.92 2,296.88Jefferson Elementary 16,186.00 90 14,567.85 1,618.65Kanawha Elementary 15,222.00 80 12,177.60 3,044.40McKinley Elementary 10,168.00 90 9,151.92 1,016.88State Totals - Elementary TFS 84,954.00 72,896.00 12,058.00Waverly Elementary 9,279.00 80 7,423.20 1,855.80State Totals - TFS/Elementary 84,954.00 72,895.69 12,058.41
TFS/Secondary E-rate Application 2008 Van Devender 12,462.00 80 9,969.60 2,492.40State Totals - TFS/Secondary 12,462.00 9,969.60 2,492.40
Funding Source Year Annual Disc% Commit County Match
Page 30 of 33WVDE - School System Strategic Plan
8/28/2008https://wveis.k12.wv.us/oneplan2008/district/print_plan.cfm?action=p

E-rate funds 2007 Bundled Voice/Long Distance 0.00 0.00 0.00Cellular 57,600.00 35,136.00 22,464.00Data Lines 161,640.00 98,600.40 63,039.60Internal Conn Maint 0.00 0.00 0.00Internal Connections 0.00 0.00 0.00Internet Access 0.00 0.00 0.00Long Distance 15,720.00 9,589.20 6,130.80Paging 0.00 0.00 0.00Voice 85,386.00 52,085.46 33,300.54WAN 0.00 0.00 0.00Web Hosting 33,242.00 20,277.86 12,964.54E-rate Totals 353,588.00 215,688.92 137,899.48
TFS/Elementary E-rate Application 2007 Emerson Elementary 11,129.00 80 8,903.20 2,225.80Fairplains Elementary 22,968.00 90 20,671.92 2,296.88Jefferson Elementary 16,186.00 90 14,567.85 1,618.65Kanawha Elementary 15,222.00 80 12,177.60 3,044.40McKinley Elementary 10,168.00 90 9,151.92 1,016.88Waverly Elementary 9,279.00 80 7,423.20 1,855.80State Totals - TFS/Elementary 84,954.00 72,895.69 12,058.41
TFS/Secondary E-rate Application 2007 Van Devender 12,462.00 80 9,969.60 2,492.40State Totals - TFS/Secondary 12,462.00 9,969.60 2,492.40
Funding Source Year Annual Disc% Commit County Match
E-rate funds 2006 Cellular 55,200.00 33,120.00 22,080.00Data Lines 144,754.80 86,852.88 57,901.92Internal Conn Maint 0.00 0.00 0.00Internal Connections 0.00 0.00 0.00Internet Access 0.00 0.00 0.00Long Distance 13,147.20 7,888.32 5,258.88Paging 0.00 0.00 0.00Voice 77,978.04 46,786.82 31,191.22WAN 0.00 0.00 0.00Web Hosting 31,746.15 19,047.69 12,698.46E-rate Totals 322,826.19 193,695.71 129,130.48
State Basic Skills E-rate Application 2006 State Totals - BS/CE 0.00 0.00 0.00
State SUCCESS E-rate Application 2006 State Totals - SUCCESS 0.00 0.00 0.00
Funding Source Year Annual Disc% Commit County Match
E-rate funds 2005 Cellular 31,800.00 19,080.00 12,720.00Data Lines 155,970.00 93,582.00 62,388.00Internal Conn Maint 0.00 0.00 0.00Internal Connections 0.00 0.00 0.00Internet Access 0.00 0.00 0.00Long Distance 9,600.00 5,760.00 3,840.00Paging 0.00 0.00 0.00Voice 74,219.04 44,531.42 29,687.62Web Hosting 0.00 0.00 0.00E-rate Totals 271,589.04 162,953.42 108,635.62
State Basic Skills E-rate Application 2005 State Totals - BS/CE 0.00 0.00 0.00
State SUCCESS E-rate Application 2005 State Totals - SUCCESS 0.00 0.00 0.00
E-Rate Compliance
Page 31 of 33WVDE - School System Strategic Plan
8/28/2008https://wveis.k12.wv.us/oneplan2008/district/print_plan.cfm?action=p

County E-Rate Compliance QuestionsAcceptable Use PolicyLook at the information included in this section. Revise if any of the information listed is incorrect or needs to be updated.
1. Do you have an Acceptable Use Policy? Yes No
2. If yes, what is the last date of adoption/revision? 08/15/2006
3. When was the public meeting held for CIPA Compliance? 05/10/2001
4. Provide the URL to your acceptable use policy.http://www.edline.net/pages/WCS/BOE/Board_Policies/6000_-_Instruction/6144_1
SchoolsOther
Buildings Total
5. Please identify for E-Rate requirements the number of buildings in your county that have Dial Up modem connections to the Internet? 0 0 0
6. Please identify for E-Rate requirements the number of buildings in your county that have 56K frame relay connections to the Internet? 1 0 1
7. Please identify for E-Rate requirements the number of buildings in your county that have T-1 frame relay connections to the Internet? 28 0 28
8. Please identify for E-Rate requirements the number of buildings in your county that have ATM T-1 Internet connections? 0 0 0
9. Please identify for E-Rate requirements the number of buildings in your county that have cable modem connections to the Internet? 0 0 0
10. Please identify for E-Rate requirements the number of buildings in your county that have DSL connections to the Internet? 0 0 0
11. Please identify for E-Rate requirements the number of buildings in your county that have 10 Mb connections to the Internet? 0 1 1
12. Please identify for E-Rate requirements the number of buildings in your county that have 45 Mb connections to the Internet? 0 0 0
13. Please identify for E-Rate requirements the number of buildings in your county that have 100 Mb connections to the Internet? 0 0 0
14. Please identify for E-Rate requirements the number of buildings in your county that have 1 Gb connections to the Internet? 0 0 0
15. Please identify for E-Rate requirements the number of buildings in your county that have more than 1 Gb connections to the Internet? 0 0 0
16. Please identify for E-Rate requirements any other configurations that may exist for buildings connecting to the Internet?
Three of our administrative building connected to a WAN at 100 Mb speed, and then share a 10 Mb connection to the Internet.
Page 32 of 33WVDE - School System Strategic Plan
8/28/2008https://wveis.k12.wv.us/oneplan2008/district/print_plan.cfm?action=p

WORK PLAN SUMMARYSupport/Capacity Building Process
The assistant superintendents and directors are responsible for the implementation of the action steps. Each of these individuals are responsible for the professional development needed to implement the actions steps for which they are responsible.
Process Monitoring
The superintendent will hold monthly strategic plan review meetings with the central office personnel responsible for the implementation of the action steps. Central office personnel will be responsible for reporting on the progress of the implmentation of the action steps at these meetings. Adjustments to the action steps can also be made during these meetings. We will also report quarterly to the Board of Education our progress in the implementation of the strategic plan. Each school also uses their strategic plan as the basis of their meeting with the Board of Education during their LSIC report.
Evaluation Process
We will judge the success of our action steps based on the targets we have established. We will also use our monthly strategicv plan review meetings to gather anecdotal evidence as to the success of our action steps.
Page 33 of 33WVDE - School System Strategic Plan
8/28/2008https://wveis.k12.wv.us/oneplan2008/district/print_plan.cfm?action=p