wssda webinar march 27, 2014 barbara posthumus, director of business services lake washington school...
TRANSCRIPT
Basics of School Finance
WSSDA WebinarMarch 27, 2014
Barbara Posthumus, Director of Business ServicesLake Washington School [email protected]

2
School Funding History Sources of Revenue Funding Model Budgeting
Agenda
Washington State Constitution Article IX
“It is the paramount duty of the state to make ample provisions for the education of all children residing within its borders,...”
School Funding History
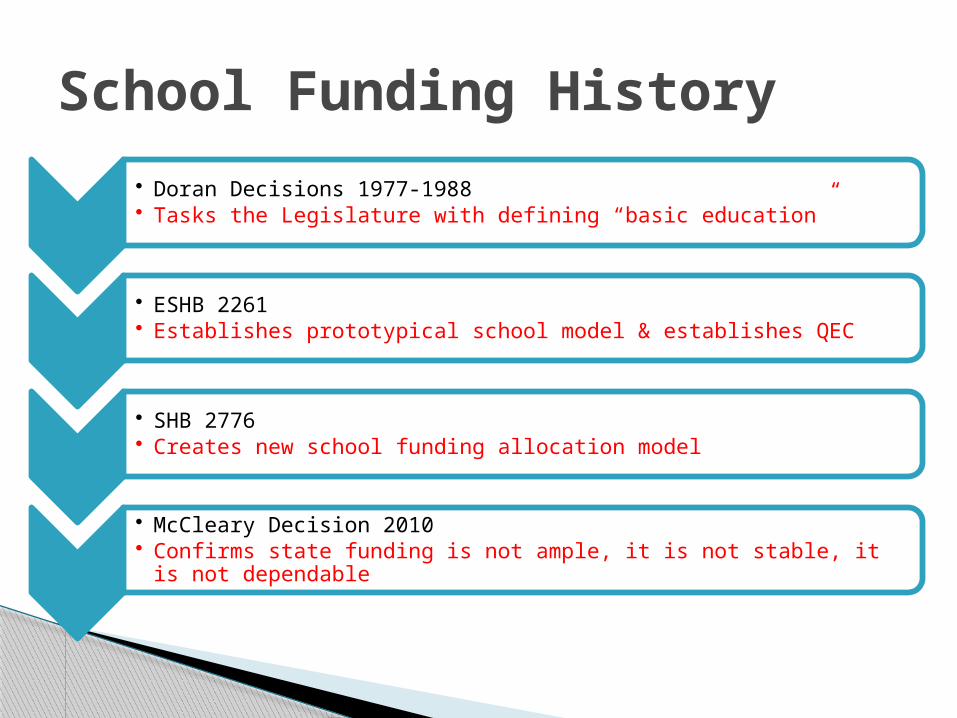
• Doran Decisions 1977-1988• Tasks the Legislature with defining “basic education”
• ESHB 2261 • Establishes prototypical school model & establishes QEC
• SHB 2776• Creates new school funding allocation model
• McCleary Decision 2010• Confirms state funding is not ample, it is not stable, it is not
dependable

Doran Court Decisions Doran I - 1977
◦ the level of funding provided by the state.... was not fully sufficient..
◦ legislature had not defined basic ed or provided fully sufficient funding without reliance on special excess levies
◦ led to Basic Ed Act of 1977 which established revised funding formula, substantially increased state funding, and limited amount and purpose of special levies.

Doran Court Decisions Doran II - 1983
◦ duty to fully fund includes not only basic ed act also: special education; transitional bilingual; remediation; transportation for some pupils.
Doran III - 1988◦ required establishment of some form of “safety
net” in special education

ESHB 2261 ESHB 2261 passed in 2009
◦ Defines new programs of Basic Education, while mandating that no new requirements shall be implemented without associated funding.
◦ Adopts prototype schools funding model. ◦ Establishes that programs shall be fully funded by the
2018-19 school year. ◦ Establishes a new funding formula for Pupil Transportation,
to begin during or before 2013. ◦ Created the Quality Education Council (QEC) to develop
and implement workgroups on funding formulas, data governance, levy, compensation
◦ Creates a roadmap for work groups to define the details of the funding formulas.

SHB2776 Prototypical School Funding Model
SHB2776 passed in 2010◦ Implements the new funding structure for education
as proposed by the QEC and the Funding formula technical workgroup
◦ New funding structure to begin Sept 2011◦ New structure only - no new dollars◦ Creates timeline for funding phase-in and 2018
deadline for full funding◦ Funding shall be for allocation purposes only

SHB 2776 Goals (continued)
More funding must begin in 2012-13 Full Day Kindergarten fully funded statewide
by 2017-18 K-3 Class Size Reduction fully funded by
2017-18 Materials, Supplies and Operating Costs fully
funded by 2015-16 Transportation fully funded by 2014-15
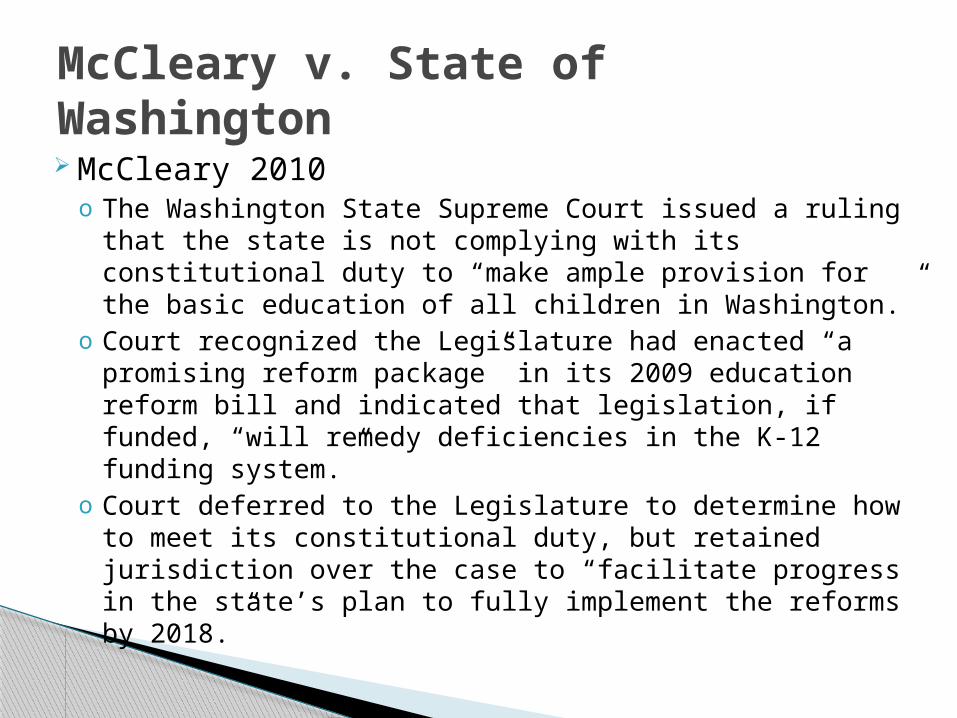
McCleary v. State of Washington McCleary 2010o The Washington State Supreme Court issued a ruling that
the state is not complying with its constitutional duty to “make ample provision for the basic education of all children in Washington.”
o Court recognized the Legislature had enacted “a promising reform package” in its 2009 education reform bill and indicated that legislation, if funded, “will remedy deficiencies in the K-12 funding system.”
o Court deferred to the Legislature to determine how to meet its constitutional duty, but retained jurisdiction over the case to “facilitate progress in the state’s plan to fully implement the reforms by 2018.”
Sources of Revenue

12
Retail Sales45%
B&O Tax21%
Property Tax13%
Use Tax3%
Real Estate Excise Tax
3%
Public Utility3%
Other12%
State PerspectiveWhere Does the money come from?
Source: Organization and Financing of Washington Public Schools May 2013

13
Public Schools44%
Higher Ed8%
Government Oper.3%
Human Services37%
Natural Resources
1% Other8%
State PerspectiveWhere Does the money go to?
Source: Organization and Financing of Washington Public Schools May 2013

14
State BEA66%
Local Property Tax/Levy
23%
Federal10%
Other Local1%
(apportionment)
District PerspectiveWhere Does the money come from?
Source: Organization and Financing of Washington Public Schools May 2013

15
Largest Revenue source for school districts Basic Education Categorical
◦ Special Education◦ Highly Capable◦ Learning Assistance Program◦ Bilingual Instruction◦ Transportation
State Revenue or “Apportionment”
16
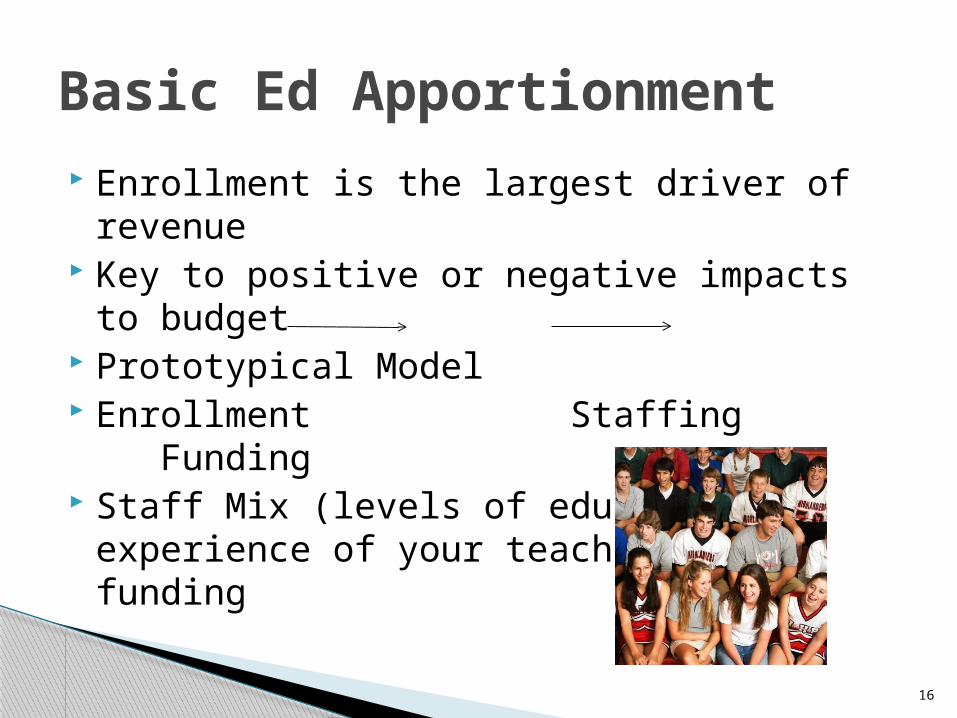
Enrollment is the largest driver of revenue Key to positive or negative impacts to
budget Prototypical Model Enrollment Staffing Funding Staff Mix (levels of education and
experience of your teachers) drive funding
Basic Ed Apportionment

Prototypical School Funding Model
Fixed theoretical school size used for modeling purposes
Funding formula assumptions are based upon prototypical school
Class size assumptions are different based upon grade and subject
Planning time for teachers is factored in for determination of class size
Category Elem K-6 Middle 7-8
High 9-12
Base Enroll 400 432 600

18
Certificated Instructional Staffing (CIS) Legislative class size allocations plus
planning time equals teachers
Prototypical Model
Students per staff
% Increase in Teachers to Cover Planning
Elem Gr K-3 25.23 15.5%
Elem Gr 4-6 27.00 15.5%
Middle Gr 7-8 28.53 20.0%
High Gr 9-12 28.74 20.0%
K-1 High Poverty
20.30 20.0%
Gr 2-3 High Poverty
24.10 20.00
19
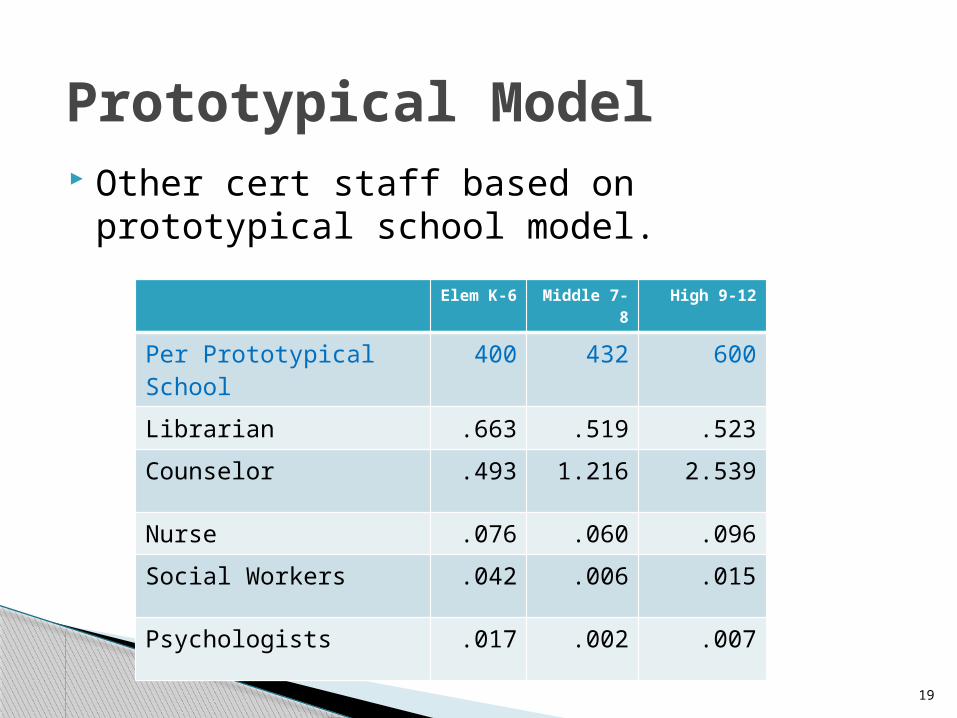
Other cert staff based on prototypical school model.
Prototypical Model
Elem K-6
Middle 7-8
High 9-12
Per Prototypical School 400 432 600
Librarian .663 .519 .523
Counselor .493 1.216 2.539
Nurse .076 .060 .096
Social Workers .042 .006 .015
Psychologists .017 .002 .007

20
Classified Staff (CIS)
Prototypical Model
Elem K-6
Middle 7-8
High 9-12
District Wide
Per Prototypical School 400 432 600 Per 1,000 students
Teaching Assistance .936 .700 .652
Office Support 2.012 2.325 3.269
Custodians 1.657 1.942 2.965
Student & Staff Safety .079 .092 .141
Family Involvement Coord.
.0825
Technology .628
Facilities/Maint./Grounds 1.813
Warehouse/Mechanics .332
Central classified administration
5.3% of staff units x 74.5%

21
Certified Administration Staff (CAS)
Prototypical Model
Elem K-6
Middle 7-8
High 9-12
Per Prototypical School 400 432 600
Principal 1.253 1.353 1.880
District Wide
Central Administration 5.3% of staff units
x 25.5%

22
LAKE WASHINGTON SCHOOL DISTRICTBASIC ED STAFFING 2013-14 Actual
Elem Middle High Planning Elem Middle HighGrades K-6 Grades 7-8 Grades 9-12 Time Grades K-6 Grades 7-8 Grades 9-12 Total
Ratios Staff FTE
Certificated Certificated
Grade K-3 25.23 15.5% Grade K-3 352.360 352.360
Grad K-1 High Poverty 20.85 15.5% Grad K-1 High Poverty 0.000 0.000
Grad 2-3 High Poverty 24.10 15.5% Grade 2-3 High Poverty 0.000 0.000
Grade 4 27.00 15.5% Grade 4 94.637 94.637
Grade 5-6 27.00 15.5% Grade 5-6 174.988 174.988
Grade 7-8 28.53 20.0% Grade 7-8 156.475 156.475
Grades 9-12 28.74 20.0% Grades 9-12 243.120 243.120
Subtotal 1,021.580
Per Prototypical School 400 432 600 1,000
Librarian 0.663 0.519 0.523 Librarian 23.205 4.469 5.075 32.749
Counselor 0.493 1.216 2.009 Counselor 17.255 10.472 19.496 47.223
School Nurses 0.076 0.060 0.096 School Nurses 2.660 0.517 0.932 4.109
Social Workers 0.042 0.006 0.015 Social Workers 1.470 0.052 0.146 1.668
Psychologists 0.017 0.002 0.007 Psychologists 0.595 0.017 0.068 0.680
Subtotal 86.429
Total Cert Staff 1,108.009
Principals 1.253 1.353 1.880 Principals 43.855 11.651 18.245 73.751
Classified Classified
Teaching Assistance 0.936 0.700 0.652 Teaching Assistance 32.760 6.028 6.327 45.115
Office Support 2.012 2.325 3.269 Office Support 70.420 20.022 31.724 122.166
Custodians 1.657 1.942 2.965 Custodians 57.995 16.724 28.774 103.493
Student & Staff Safety 0.079 0.092 0.141 Student & Staff Safety 2.765 0.792 1.368 4.925
Family Involvement 0.0825 Family Involvement 2.887 2.887
278.586
Total School Staff 1,460.346
Districtwide Districtwide
Technology 0.628 Technology 14.785
Facilities/Maint/Grounds 1.813 Facilities/Maint/Grounds 42.683
Warehouse/Mechanics 0.332 Warehouse/Mechanics 7.816
Cert Admin 5.3% 25.47%
Classified Admin 5.3% 74.53% Cert Admin 20.595
Classified Admin 60.264All staff calc 0.065699 0.063788CLS staff calc 0.014484 0.014485 Total Cert Instructional Staff 1,108.009
Total Cert Administrative Staff 94.346Total Classified Staff 404.134

Certified staffing FTE and Staff Mix (levels of education and experience of your teachers) drive funding. Cert FTE multiplied by state salary allocation equals funding
Classified and Administration FTE multiplied by average state salary allocation equals funding
Some districts are grandfathered at higher amounts
Salaries drive mandatory benefits and medical benefits
23
How Model Drives Funding

24
Materials, Supplies and Operating Costs (MSOC)
2014-15 Level
Technology $89.13
Utilities and Insurance $242.17
Curriculum and Textbooks $95.69
Other Supplies and Library Materials $203.16
Instructional Professional Development
$14.80
Facilities Maintenance $119.97
Security and Central Office $83.12
Total $848.04
Substitutes Career and Technical Education (Vocational
Education) Small Schools Districts – special allocations
25
Basic Apportionment

Special Education◦ Funded based on a % of basic ed◦ Birth to Pre-Kindergarten=115%◦ Kindergarten to age 21 =93.09%
Learning Assistance Program (LAP), Transitional Bilingual (ELL) and Highly Capable◦ Provides funding for additional hours of
instruction◦ Formula drives cert teachers
Transportation
26
State Categorical Funding

Local Levy◦ Must be voted on by community at least every
four years◦ Amount that can be collected is capped by state
formula◦ Increased from 24% to 28% in 2011◦ Set to sunset after 2017◦ Some districts are grandfathered at higher
percentage Levy Equalization
27
Levy Funds

Special Education IDEA Vocational Education Title I (Remediation) Title II (Professional Development) Title III (Limited English Proficiency) Free and Reduced Lunch Funding Head Start Other Grants
28
Federal Funding

29
Investment earnings Fee programs – all day kindergarten, sports
participation, food services, summer school Grants and donations Rentals and leases – facilities use Revenue from other school districts Fines and fees from students (workbooks, supply
fees)
Local Nontax/Other
Budgeting

31
Enrollment Mid-Year Projections (Fund Balance) Legislative Impact Budget Preparation Multi-year Budget Projection Monitoring and Reporting
Year in the Life of School District Budgeting
Enrollment
Mid-Year Projections
Budget Preparatio
n
Multi-Year Projections
Reporting

32
Staffing drives 85% of budget State defines format of budget
◦ Program – Activity - Object
Budget Factors

33
Basic Educa-tion54%
Special Education13%
Vocational4%
Compens. Educa-tion6%
Other Instruction1%
Community Services
1%
Transportation/Food Srvs
8%
Other Support Svcs.14%
District PerspectiveWhere Does the money go?
Source: Organization and Financing of Washington Public Schools May 2013

34
Certificated Salaries
45%
Classified Salaries17%
Employee Benefits/Taxes
21%
Supplies and Ma-terials
6%
Purchased Services
11%
Capital Outlay0%
District PerspectiveWhere Does the money go?
Source: OSPI Financial Summary 2011-12

35
Date Action
January Next year Enrollment Projections Complete
Feb/Mar Prepare Current Staffing Data
Mar/April Departmental Budget Preparation
April Staffing Allocations for next year developed
April/May District Budget Advisory Process
April Legislative Session Ends
May- early June Balance Budget
May Board Work Session Presentation
June Prepare Budget Document an send draft to Board
Sample Timeline

36
Date Action
June 25 Board Meeting – Draft Budget Presentation
July 10 Final date to prepare budget and available to public
July 10 Final date to forward draft budget to ESD
July 20 Publish First Notice of Public Hearing
July 20 Final date to have copies of Budget available to public (1st class districts) and due to ESD for review
July 27 Publish Second Notice of Public Hearing
August 6 Board Meeting – Public Hearing and Final Adoption
August 31 Final date to Adopt Budget (1st class districts)
Sept 3 Final date to forward budget to ESD (1st class districts)
Sample Timeline
37
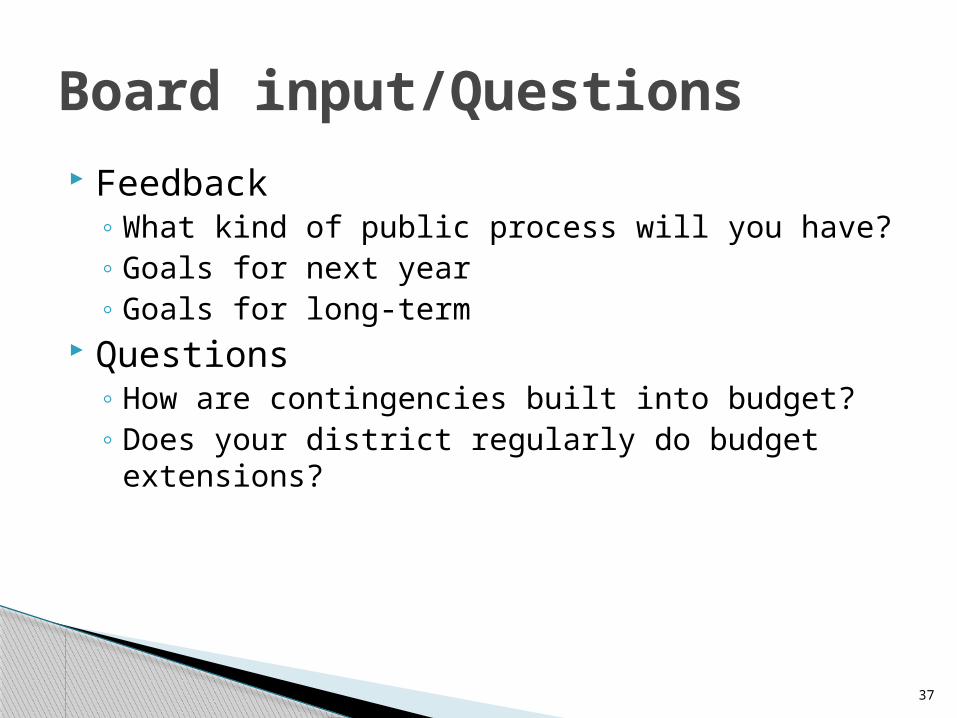
Feedback◦ What kind of public process will you have?◦ Goals for next year◦ Goals for long-term
Questions◦ How are contingencies built into budget?◦ Does your district regularly do budget extensions?
Board input/Questions

38
Multi-year Budget Projection
How do decisions today effect long-term budget outlook?

39
“A monthly budget status report for each fund shall be prepared by the administration of each school district; and a copy of the most current budget status reports shall be provided to each member of the board of directors of the district at the board's regular monthly meeting. The report shall contain the most current approved budget amounts by summary level accounts and the fund balance at the beginning and end of the period being analyzed….Also, as a part of the budget status report, the administration shall provide each member of the board of directors with a brief written explanation of any significant deviations in revenue and/or expenditure projections that may affect the financial status of the district… “
Monitoring and ReportingWAC 392-123-115

40
Meet with Business Manager Ask about funding issues Ask about budget preparation process Ask about long-range financial picture Ask about monthly board financial reports
Next steps

41
Additional Resources Organization and Financing of Washington Public
Schoolshttp://
www.k12.wa.us/safs/PUB/ORG/13/Final%20Edition%202013.pdf
A Citizen’s Guide to WA State K-12 Financehttp://
www.leg.wa.gov/Senate/Committees/WM/Documents/2014%20K12%20Citizens%20Guide.pdf
“A Brief History of Education Funding in WA State” This is a one-page pictorial timeline of fundinghttp://
www.k12.wa.us/Communications/PressReleases2014/EducationFundingChart.pdf
Quality Education Council (QEC) reportshttp://www.k12.wa.us/QEC/default.aspx

42
Final Questions