writing skills in ninth grade - educational testing service · holistic scores ... baseline writing...
TRANSCRIPT
The Impact of Short-Term Use of CriterionSM on Writing Skills in Ninth Grade
March 2007 RR-07-07
ResearchReport
JoAnn Leah Rock
Research & Development

The Impact of Short-Term Use of CriterionSM on Writing Skills in Ninth Grade
JoAnn Leah Rock
ETS, Princeton, NJ
March 2007

As part of its educational and social mission and in fulfilling the organization's nonprofit charter
and bylaws, ETS has and continues to learn from and also to lead research that furthers
educational and measurement research to advance quality and equity in education and assessment
for all users of the organization's products and services.
ETS Research Reports provide preliminary and limited dissemination of ETS research prior to
publication. To obtain a PDF or a print copy of a report, please visit:
http://www.ets.org/research/contact.html
Copyright © 2007 by Educational Testing Service. All rights reserved.
e-rater, ETS, and the ETS logo are registered trademarks of Educational Testing Service (ETS). Criterion is a trademark of
ETS.
The Impact of Short-Term Use of CriterionSM on Writing Skills in Ninth Grade
JoAnn Leah Rock
ETS, Princeton, NJ
March 2007

Abstract
In this study, a hierarchical linear model (HLM) was used within a cluster random assignment
design to test the impact of Criterionsm on students’ writing skill when Criterion was used as a
supplementary instructional tool in ninth grade English classrooms over a 4 week period. The
study was conducted in three states: Indiana, Pennsylvania, and New Jersey. The sample
consisted of 1,464 ninth graders aggregated across 10 schools, 34 teachers, and 61 classes.
Findings indicate that over a short time period, Criterion use improved the mechanical aspects of
student essays as measured by the analytic scores given to their essays. Students in ninth grade
English classes who used Criterion several times a week over a 1 month period received higher
analytic scores on their essays written at the end of the study period than those who were in
classes that did not. The effect was small, but statistically significant at the .05 level using a one-
tailed test. These findings suggest a role for automated feedback systems in supporting writing
instruction.
Key words: Automated feedback systems, essay scores, writing instruction
i

Acknowledgments
Thanks are due to Brent Bridgeman, Kathleen Kramer, and Lisa Costa for their numerous
contributions.
ii

Table of Contents
Page
Introduction..................................................................................................................................... 1
Conceptual Model Guiding the Evaluation..................................................................................... 2
Sample Description......................................................................................................................... 3
Power Calculations and Sample Size.......................................................................................... 3
Random Assignment................................................................................................................... 4
Baseline Student Characteristics................................................................................................. 5
Teacher Characteristics............................................................................................................... 7
Method ............................................................................................................................................ 9
Measures ..................................................................................................................................... 9
Response Analysis: Outcome Measures ..................................................................................... 9
Scoring of the Writing Assessments......................................................................................... 11
Reliability.................................................................................................................................. 12
Procedures................................................................................................................................. 12
Analytic Strategy ...................................................................................................................... 13
Results........................................................................................................................................... 14
Impact on Analytic Scores........................................................................................................ 15
Impact on Subsample................................................................................................................ 17
Holistic Scores .......................................................................................................................... 17
Discussion..................................................................................................................................... 19
Limitations of the Study Design ............................................................................................... 20
Criterion as a Supplementary Instructional Tool...................................................................... 21
References..................................................................................................................................... 23
Notes ............................................................................................................................................. 25
List of Appendixes........................................................................................................................ 26
iii

List of Tables
Page
Table 1. Sample Size Stratified by State..................................................................................... 4
Table 2. Sample Size: Treatment and Comparison Group.......................................................... 4
Table 3. Baseline Demographics ................................................................................................ 6
Table 4. Baseline Writing Characteristics................................................................................... 7
Table 5. Teacher Characteristics................................................................................................. 8
Table 6. Response Rates by Data Source.................................................................................. 10
Table 7. Response Rates Within Student Writing Assessment................................................. 11
Table 8. Impact Sample Size: Treatment and Comparison Groups.......................................... 13
Table 9. Hierarchical Linear Model, Level 2 for Full Sample: Analytic Scores ...................... 16
Table 10. Reduction in Proportion of Variance of Analytic Scores ........................................... 16
Table 11. Comparison of Intraclass Correlations in Unconditional and Adjusted Models:
Analytic Written Scores.............................................................................................. 17
Table 12. Hierarchical Linear Model, Level 2 Subsample: Analytic Scores.............................. 18
Table 13. Hierarchical Linear Model, Level 2 Full Sample: Holistic Scores............................. 18
Table 14. Hierarchical Linear Model, Level 2 Subsample: Holistic Scores............................... 19
iv
Introduction
The purpose of this report is to present the findings from a three state random assignment
evaluation that examined the impact of CriterionSM on students’ writing skills in ninth grade.
Criterion, developed by ETS, is a Web-based, automated feedback system that provides students
with instant holistic scores and diagnostic feedback on essays submitted online. When used as an
instructional tool, Criterion may improve students’ writing skill by providing additional
opportunities to practice writing and to benefit from the immediate individualized feedback and
revision capability provided by the service (Burstein, Chodorow, & Leacock, 2004).
In this study, a hierarchical linear model (HLM) was used within a cluster random
assignment design to test the impact of Criterion on students’ writing skill when Criterion was
used as a supplementary instructional tool in ninth grade English classrooms over a 4 week
period. The impact of Criterion is the difference in writing skills at the end of the period between
students who used Criterion and those who did not. The study was conducted in three states:
Indiana, Pennsylvania, and New Jersey. The sample consisted of 1,464 ninth graders aggregated
across 10 schools, 34 teachers, and 61 classes.
The following research questions are addressed in this report:
• Did the use of Criterion improve the impact of students’ writing skill when used as a
supplemental instructional tool over a 4 week period in ninth grade English classes?
• Was the impact consistent across different levels of student writing ability?
In the study design, the unit of randomization was the class, with the teacher serving as
the stratifier. For each teacher, two of their assigned ninth grade classes were selected to
participate in the study. The two selected classes were matched by academic track such as
general education or college-bound. Matching improves the likelihood that random assignment
will produce two equal groups when the number of units of randomization is small (Light,
Singer, Willet, 1990). After selection, one of the teacher’s two classes was randomly assigned to
the treatment group and the other to the comparison group. In the final implementation of the
design, nine teachers contributed one class and two teachers contributed three classes, all of
which were randomly assigned to either the treatment group or the comparison group.
Classes randomly assigned to the treatment group used Criterion for approximately 1
month. Students in this group received automated feedback on a series of persuasive essays
1

written in their English classes. (Persuasive writing was chosen because this genre is included in
many high school state assessments.) The students in classes assigned to the comparison group
received feedback on their essays using the method typically used by their teacher such as
handwritten comments.
Random assignment is the most rigorous way to estimate the impact of an educational
product on student achievement. Random assignment allows causal inferences to be drawn about
the program’s efficacy by eliminating selection bias in the makeup of the groups prior to the
intervention (Mosteller & Boruch, 2002). In other words, treatment-comparison differences on
selected outcomes can be attributed to the educational tool or practice, rather than to preexisting
characteristics between the two groups.
Conceptual Model Guiding the Evaluation
Automated feedback systems such as Criterion have the potential to support writing
instruction by providing students with opportunities to write and revise their essays after getting
immediate, individualized feedback (Burstein, Chodorow, & Leacock, 2003). Theories about
teaching writing have evolved over the past 30 years (Dahl & Farnan, 1998; Pritchard &
Honeycutt, 2006). This shift was largely due to several foundational studies that examined the
writing process of successful writers (Emig, 1971; Freedman, Dyson, Flower, & Chafe, 1987).
Emig found that successful writers used an iterative writing process that consisted of writing a
draft, receiving feedback, and revising the draft (the write, feedback, and revision cycle).
Accordingly, in the 1970s, the focus in writing instruction shifted from the end product to the
iterative process of writing (Calkins, 1994; Graves, 1983; Nystrand, 2006). When the focus was
on the end product, feedback on student writing was largely summative and consisted of
correcting surface errors in the conventions of written language (Dyson & Freedman, 1990).
Summative feedback at the end of the writing process is not as effective in improving writing as
feedback that is part of the formative process (Beach & Friedrich, 2006). However, providing
ongoing formative feedback on components of the iterative writing process, including prewriting
and revision, is time-consuming and often not feasible for teachers to provide.
Automated feedback systems may facilitate the iterative writing process by alleviating
teachers of the time-intensive practice of providing formative individual feedback to students
(Burstein et al., 2003). Through an automated system, students can get specific diagnostic
feedback that addresses important components of writing, such as sentence structure, word
2

usage, and organizational structure (Burstein, 2003). Students are able to use this information to
revise their essays and therefore independently participate in the write, feedback, and revision
cycle. In addition, Criterion can provide students with practice in writing timed essays that are
part of many state assessments. This type of writing assessment requires students to develop high
quality essays on demand, which may be different from the writing tasks students practice in
schools (Freedman, 1991).
Criterion uses two ETS developed applications, e-rater® and Critique. E-rater uses an
application of natural language processing (NLP) that provides writers a holistic score on essays
submitted online. NLP predicts the overall quality of an essay by comparing the essay with
hundreds of human-scored essays (Burstein & Chodorow, 2003). The level of agreement or
reliability between Criterion and trained readers is very high, approximately .98 (Shermis,
Burstein, & Leacock, 2006.) On the other hand, Critique provides the diagnostic feedback
capability of Criterion and analyzes elements of grammar, usage, mechanics, style, organization,
and development. Errors from these categories are identified within the essay itself and feedback
is provided for each identified error.
Sample Description
The full study sample consisted of 1,464 ninth grade students from 10 high schools in
Indiana, Pennsylvania, and New Jersey. The high schools and states were selected for
convenience and interest and are not a representative sample of high schools in the United States.
The full sample was aggregated across 34 teachers and 61 classes across the 10 schools in the
study. See Table 1.
Four factors were used to identify possible districts and schools for the evaluation: (a) the
districts and schools had diverse student populations, (b) the districts and schools were not using
Criterion, (c) persuasive essays were included on state high school examinations, and (d)
computer capacity to support Criterion was available.
Once a school was selected, teachers within the school volunteered to participate in the
study. The demographic characteristics of the schools in the sample are described in Appendix A.
Power Calculations and Sample Size
The sample size in the study was sufficient to detect an effect size of .3 with power of .80
for a one-tailed test at a significance level of .05. Using the method proposed by Braun (2003),
3

the power calculations began with an assumption of an effect of interest at the student level and
translated this effect into a corresponding value and sample size at the class level. See Table 2.
Table 1
Sample Size Stratified by State
State Level Indiana Pennsylvania New Jersey Total
Schools 4 3 3 10 Teachers 22 4 8 34 Classes 37 6 18 61 Students 951 122 391 1,464
Note. Data are from the Criterion 1 Evaluation Database.
Table 2
Sample Size: Treatment and Comparison Group
Full Treatment Comparison
Teacher Classes Students Classes Students % Classes Students %
34 61 1,464 31 739 50.1 30 725 49.5
These two levels are necessary for two reasons. First, in this study the unit of analysis is
students, while the unit of allocation is classrooms. Second, the error variance of students within
classrooms might be correlated, and therefore the intraclass correlation has to be taken into
account when estimating the effect size. This is because the effect size is based on the variance
among students and in this case, the variance among students might have two components, the
first due to the class they are in and the second due to individual variation. Of the three
parameters needed to detect the power of the design, two of them (significance level and sample
size) were set, solving for the third (effect size).
Random Assignment
The goal of the random assignment design was to yield unbiased estimates of the efficacy
of Criterion by creating two initially equal groups prior to the beginning of the study period.
Therefore, the observed differences between the groups at the end of the study period could be
4

attributed to the program rather than a preexisting difference that may have been related to the
outcome of interest (Mosteller & Boruch, 2002).
In this study, random assignment occurred within teachers at the class level. Teachers
who volunteered to participate in the evaluation were asked to enlist two of their assigned
English classes. One of these classes was assigned to the treatment group and the other to the
comparison group. The two classes selected were matched by academic track—for example,
general or college prep. To increase the generalizability of the findings, honor classes and
classrooms with a high proportion of students who had disabilities or were English language
learners were not included in the sample.1
While randomization is sufficient to ensure equal initial groups when the sample is large,
controlling for observable differences that may remain in smaller samples increases the validity
of the impact estimate (Shadish, Cook, & Campbell, 2002). Therefore, an estimation model was
constructed to control for remaining differences in baseline characteristics between treatment and
comparison groups that were related to the outcome measures. An initial analysis was conducted
to determine which covariates to include in the model. Covariates were selected that differed
between treatment and comparison groups after randomization and were correlated to the
outcome measure. Prior achievement is an important covariate to include in the model as it is
highly correlated to achievement outcomes (Bloom, Richburg-Hayes & Black, 2005). See
Appendix E.
Baseline Student Characteristics
Demographics. The full study sample was predominately White students (59%). The
minority population of the sample was mixed; 18% African-American students; 5% Hispanic
students, and 3% Asian or Pacific Islander students. The remainder of the sample was Native
American students or identified themselves as part of another ethnic group.2 The sample was
split equally between males and females and included a small percentage of English language
learners.
The differences in baseline demographic characteristics between the students in the
treatment group and those in the comparison group were tested. The baseline characteristics
examined were ethnicity, gender, English language learners, and writing skills. See Table 3. The
purpose of this analysis was to examine the success of the random assignment design in creating
two reasonably equal groups at baseline according to observable characteristics. There were no
5

statistically significant differences in ethnicity and English language learners at the baseline
between the treatment and comparison groups. The treatment group had a slightly higher
percentage of males than females. The remaining observable differences between the treatment
and comparison groups will be accounted for by including these measures as covariates in the
impact estimation model.
Table 3
Baseline Demographics
Full Treatment Comparison Chi-sqa Characteristics p-value N N N % % %
Ethnicity White 865 59 433 59 432 60 .55 African American 259 18 129 17 130 18 Hispanic 73 5 39 5 34 5 Asian 30 2 19 3 11 2 Pacific Islander 12 1 4 1 8 1 American Indian 9 1 5 1 4 1 Other 76 5 43 6 33 5 Missing 140 10 70 9 68 10
Gender Male 675 46 362 49 313 43 .03** Female 662 45 316 43 346 47 Missing 127 9 8 9
English language learner b Yes 96 7 52 7 44 6 .48 No 1,240 85 625 84 615 85 Missing 128 8 62 8 66 9
Note. Data are from the Criterion 1 student survey. a A chi-square was used to estimate the statistical significance of the differences between
treatment and comparison groups at baseline. The chi-square was calculated within each
demographic category. b English language learner is defined as students who first language was
not English.
** p < .05.
6
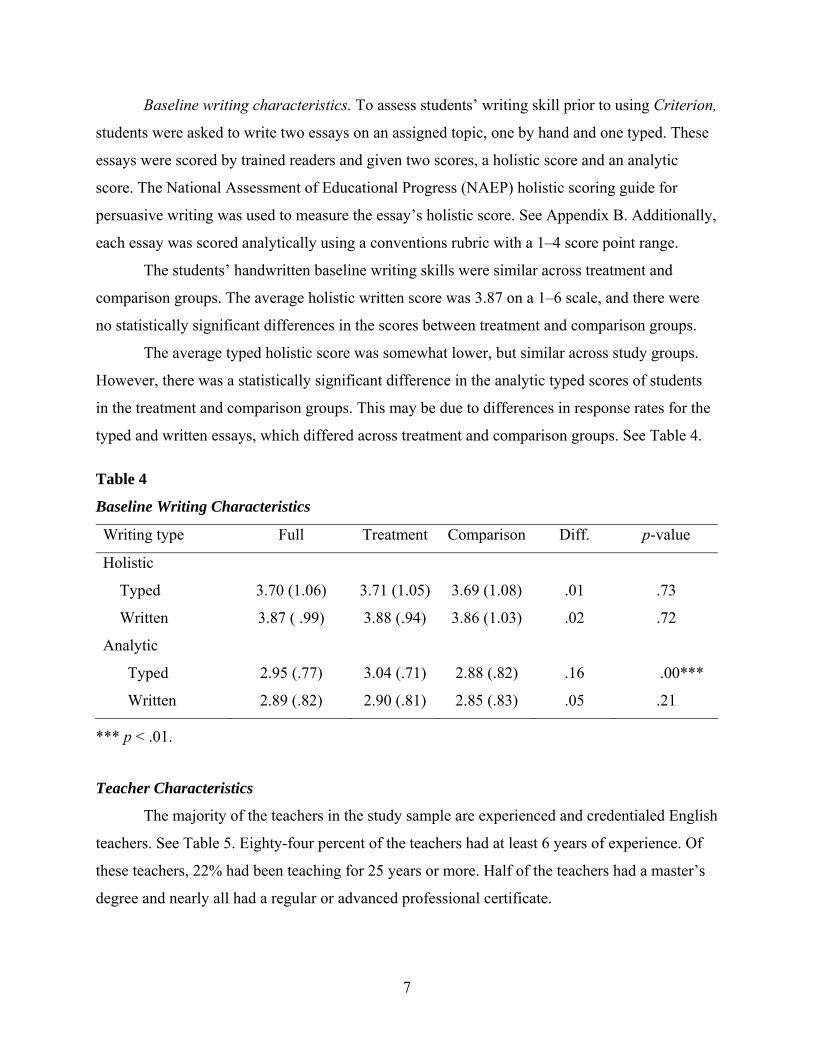
Baseline writing characteristics. To assess students’ writing skill prior to using Criterion,
students were asked to write two essays on an assigned topic, one by hand and one typed. These
essays were scored by trained readers and given two scores, a holistic score and an analytic
score. The National Assessment of Educational Progress (NAEP) holistic scoring guide for
persuasive writing was used to measure the essay’s holistic score. See Appendix B. Additionally,
each essay was scored analytically using a conventions rubric with a 1–4 score point range.
The students’ handwritten baseline writing skills were similar across treatment and
comparison groups. The average holistic written score was 3.87 on a 1–6 scale, and there were
no statistically significant differences in the scores between treatment and comparison groups.
The average typed holistic score was somewhat lower, but similar across study groups.
However, there was a statistically significant difference in the analytic typed scores of students
in the treatment and comparison groups. This may be due to differences in response rates for the
typed and written essays, which differed across treatment and comparison groups. See Table 4.
Table 4
Baseline Writing Characteristics
p-value Writing type Full Treatment Comparison Diff.
Holistic
Typed 3.70 (1.06) 3.71 (1.05) 3.69 (1.08) .01 .73
Written 3.87 ( .99) 3.88 (.94) 3.86 (1.03) .02 .72
Analytic
Typed 2.95 (.77) 3.04 (.71) 2.88 (.82) .16 .00***
Written 2.89 (.82) 2.90 (.81) 2.85 (.83) .05 .21
*** p < .01.
Teacher Characteristics
The majority of the teachers in the study sample are experienced and credentialed English
teachers. See Table 5. Eighty-four percent of the teachers had at least 6 years of experience. Of
these teachers, 22% had been teaching for 25 years or more. Half of the teachers had a master’s
degree and nearly all had a regular or advanced professional certificate.
7

Table 5
Teacher Characteristics
Experience % a
Certification
Advanced 25
Regular 72
Probationary 4
Highest degree
Master’s 50
Bachelor 44
Education specialist 5
Experience teaching English
2 years or less 4
3-5 12
6-10 49
11-24 13
25 or more 22
Note. Data are from the Criterion 1 Evaluation Database. a Percentages might not add up to 100% due to rounding.
However, these findings suggest that the random assignment design was reasonably
successful in creating two similar student groups. The major anomaly is the difference in the
typed analytic prescores. To address this issue, two steps were taken. First, scores from the
written essays were used to estimate the impact of Criterion. This was done because the response
rates on the written essays were similar across treatment and comparison groups and the baseline
average scores were similar across these groups. Second, an estimation model was constructed to
account for remaining observable differences between treatment and comparison groups. Student
reports of their baseline writing experiences and opportunities in school are described in
Appendix C.
8

Method
Measures
Data collection consisted of three sources: (a) a student writing assessment, (b) a teacher
survey, and (c) student survey. Student data were collected before and after the use of Criterion
by students in the treatment group.
The student writing assessment consisted of four persuasive prompts. Students responded
to two of the prompts prior to the start of the study and two at the end. At each time period, one
of the responses to the prompts was typed and the other handwritten. The impact of Criterion on
the handwritten essays is included in this report. This impact is the difference in the average
score given to essays handwritten by students who used Criterion and the average for those who
did not, at the end of the study period. Causal inferences that could be drawn from the typed
essays are weaker because of the difference in response rates for the typed essays across
treatment and comparison groups, which may have created differences in outcomes unrelated to
Criterion.3
The persuasive prompts used in the study were culled from released ninth grade
assessments and reviewed by focus groups of English language arts (ELA) teachers and ETS
content specialists. The prompts were piloted with ninth grade students in New Jersey. A list of
the prompts is included in Appendix D. Counterbalancing was used to ensure that the order and
mode in which students responded to the prompts in the writing assessment varied across classes
and did not influence the observed outcomes.
The demographic characteristics of students in the sample were collected through a pre-
and postsurvey. In addition, the student presurvey included questions about students’ writing
experiences in high school. Teachers’ educational background and teaching experiences were
collected through a teacher survey at the end of the study period. In addition, teachers were asked
about their views of automated feedback systems as a supplementary instructional tool.
Response Analysis: Outcome Measures
The response rates for the three data sources were very high and consistent across
treatment and comparison groups.
Ninety-five percent of the sample responded to the writing assessment, and the response
rate was consistent across treatment and comparison groups and scores. This suggests that the
9
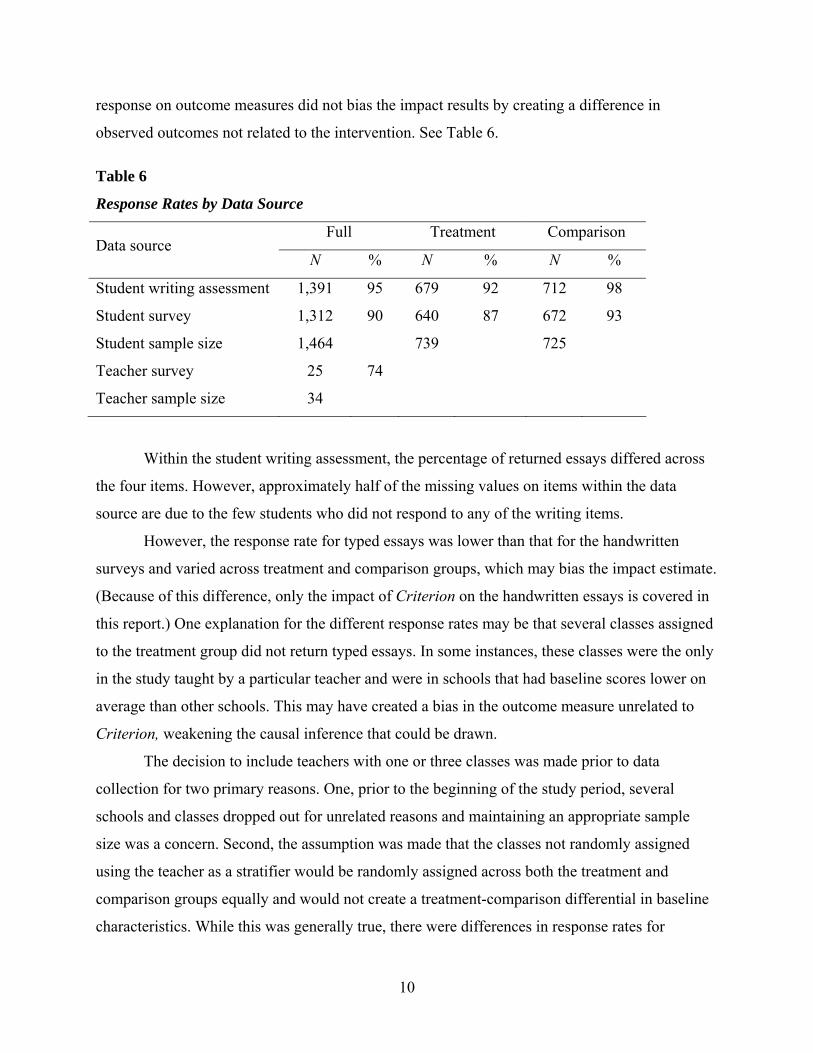
response on outcome measures did not bias the impact results by creating a difference in
observed outcomes not related to the intervention. See Table 6.
Table 6
Response Rates by Data Source
Full Treatment Comparison Data source
N N N % % %
Student writing assessment 1,391 95 679 92 712 98
Student survey 1,312 90 640 87 672 93
Student sample size 1,464 739 725
Teacher survey 25 74
Teacher sample size 34
Within the student writing assessment, the percentage of returned essays differed across
the four items. However, approximately half of the missing values on items within the data
source are due to the few students who did not respond to any of the writing items.
However, the response rate for typed essays was lower than that for the handwritten
surveys and varied across treatment and comparison groups, which may bias the impact estimate.
(Because of this difference, only the impact of Criterion on the handwritten essays is covered in
this report.) One explanation for the different response rates may be that several classes assigned
to the treatment group did not return typed essays. In some instances, these classes were the only
in the study taught by a particular teacher and were in schools that had baseline scores lower on
average than other schools. This may have created a bias in the outcome measure unrelated to
Criterion, weakening the causal inference that could be drawn.
The decision to include teachers with one or three classes was made prior to data
collection for two primary reasons. One, prior to the beginning of the study period, several
schools and classes dropped out for unrelated reasons and maintaining an appropriate sample
size was a concern. Second, the assumption was made that the classes not randomly assigned
using the teacher as a stratifier would be randomly assigned across both the treatment and
comparison groups equally and would not create a treatment-comparison differential in baseline
characteristics. While this was generally true, there were differences in response rates for
10

outcome measures that differed across treatment and in comparison groups that appeared to be
related to these teachers. However, redefining the sample by response rates on the outcomes
measure weakens the generalizability of the findings. Therefore, the impact of Criterion was
estimated for scores from the handwritten essays where the response rates were the same across
treatment and comparison groups and the baseline differences were the same across these groups.
See Table 7.
Table 7
Response Rates Within Student Writing Assessment
Full Treatment Comparison Writing type
N N N % % %
Holistic
Written 1,329 96 641 94 688 97
Typed 1,217 87 545 80 672 94
Analytic
Written 1,327 95 641 94 670 96
Typed 1,215 87 545 80 686 80
Sample size 1,391 679 712
Scoring of the Writing Assessments
In total, 5,088 essays were collected and scored by external scorers. Ten teachers not
participating in the study were hired to holistically and analytically score the essays. The scorers
were experienced high school English teachers who had knowledge of holistic scoring. The
scoring session was held at ETS and lasted 2 weeks. Each essay was scored using the NAEP 1–6
point holistic scoring guide for persuasive writing. The holistic score was based on whether or
not a position was presented, the organization of the essay, how much detail supported the
position, facility in the use of the language, and evidence of knowledge of grammar rules.
Additionally, each essay was scored analytically using a conventions rubric with a 1–4 score
point range. The analytic score was based on the students’ mastery of grammar, usage, and
mechanics.
11

Reliability
The interrater reliability of the scores was assessed using two samples randomly drawn
for double-scoring. The first sample of 200 essays was drawn and double-scored over the first 2
days of the scoring session. The reliability between the scorers on these essays was .85 as
measured by a Pearson r correlation.4 In addition, 25% of the full sample was double-scored.
The overall interrater reliability (using the 25% double-scored essays) on the essays that were
handwritten was approximately .64 for the holistic scores and .53 for the analytic scores. The
reliability of the scores on the typed essays was .63 for the holistic scores and .52 for the analytic
scores. The reliability of the holistic and analytic scores differed slightly across prompts for both
modes of writing. Throughout the remainder of the scoring session, back-reading was used.
Back-reading is when the lead scorer periodically re-reads scored essays during the scoring
session to examine consistency in scores among the scorers to maintain the reliability. In future
studies, ongoing double-scored samples in addition to back-reading of essays may help maintain
the reliability at its initial high rate.
Procedures
The teachers in the sample were notified of the group assignment for each of their classes
in the study. Students in both groups were asked to complete a series of assigned persuasive
essays over a 4 week period in their ninth grade English classes. Classes randomly assigned to
the treatment group used Criterion to draft and revise their essays according to the automated
feedback provided by the system. The classes assigned to the comparison group received
feedback in the nonautomated method normally used by their teacher and completed at least one
revision of each essay after receiving this feedback.
The teachers were instructed to limit the evaluation activities to 2 days for classes in both
the treatment and comparison group. Teachers could choose which prompts to assign during this
period,5 including drawing from other grades and genres. The only requirement was that the
students in both groups had to complete the write, feedback, and revision cycle for each prompt.
In other words, for each essay students had to write a draft, receive feedback, and revise the draft
accordingly. Students could also use Criterion from home or in writing labs, and Criterion
activities could be assigned for completion outside of class (as could activities in the comparison
group). Variation in the feedback mechanisms within the comparison group was expected
12
because the teachers were instructed to do what they would normally do to provide feedback on
essays—for example, write comments or talk to students.
The instructions given to teachers in the Criterion group were designed to allow students
the full benefit of the Criterion features that were hypothesized to influence student writing, such
as more opportunities to write. For example, Criterion teachers may have been able to assign
more essays, since the required write, feedback, and revision cycle could have been finished in a
shorter time span.
Analytic Strategy
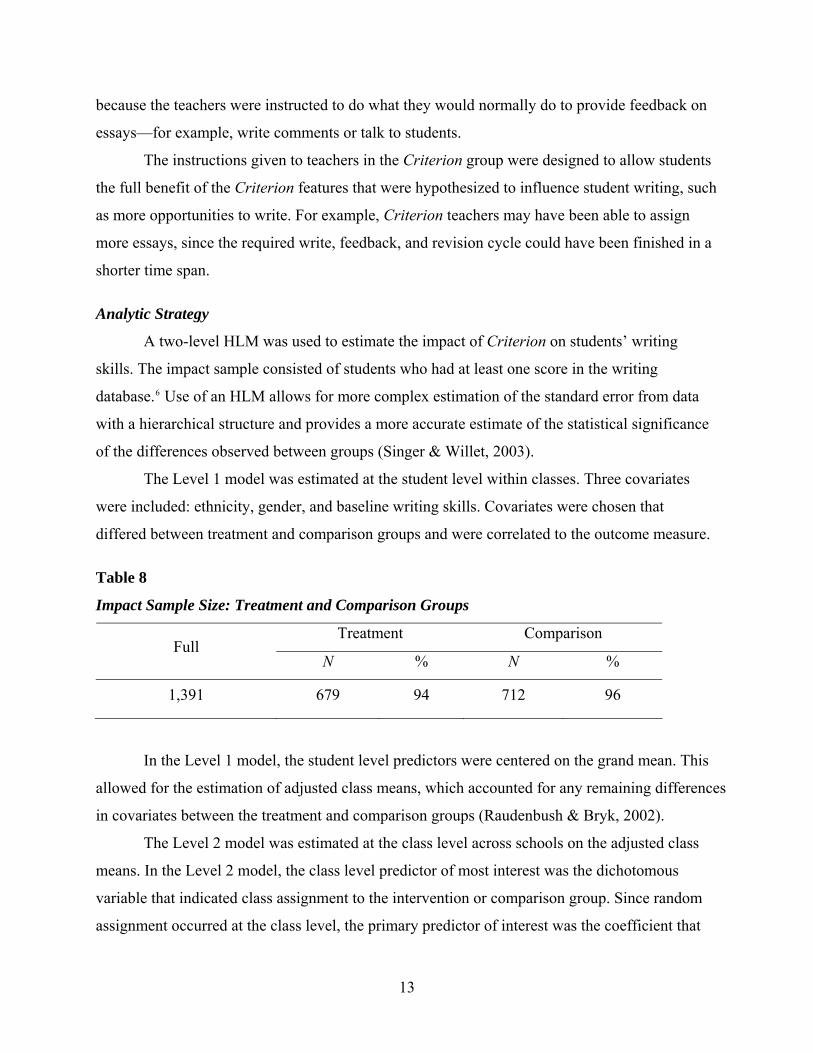
A two-level HLM was used to estimate the impact of Criterion on students’ writing
skills. The impact sample consisted of students who had at least one score in the writing
database.6 Use of an HLM allows for more complex estimation of the standard error from data
with a hierarchical structure and provides a more accurate estimate of the statistical significance
of the differences observed between groups (Singer & Willet, 2003).
The Level 1 model was estimated at the student level within classes. Three covariates
were included: ethnicity, gender, and baseline writing skills. Covariates were chosen that
differed between treatment and comparison groups and were correlated to the outcome measure.
Table 8
Impact Sample Size: Treatment and Comparison Groups
Treatment Comparison Full
N N % %
1,391 679 94 712 96
In the Level 1 model, the student level predictors were centered on the grand mean. This
allowed for the estimation of adjusted class means, which accounted for any remaining differences
in covariates between the treatment and comparison groups (Raudenbush & Bryk, 2002).
The Level 2 model was estimated at the class level across schools on the adjusted class
means. In the Level 2 model, the class level predictor of most interest was the dichotomous
variable that indicated class assignment to the intervention or comparison group. Since random
assignment occurred at the class level, the primary predictor of interest was the coefficient that
13

explained change in the dichotomous variable that measured random assignment of a class to the
treatment or comparison group. This coefficient is the estimated impact of using Criterion. Class
size was also included in the Level 2 model. In the estimation process, the Level 1 and Level 2
models are joined in a combined model. This model allows for a more complex estimation of the
error term, which takes into account the dependence of observations within the nested data
structure (Raudenbush & Bryk, 2002). The two-level hierarchical model used to estimate the
impact of using Criterion is described in the following equations. Equation 1 shows the Level 1
student model. Let = the outcome for student i, class j; = the adjusted mean for class j; 0 jβijΥ
= the Level 1 covariate effect, prewriting; 1 jβ 2 jβ = the Level 1 covariate effect, African
American/Hispanic indicator; = the Level 1 covariate effect, other ethnicity indicator; 3 jβ 4 jβ =
the Level 1 covariate effect, gender; = the prewriting score; 1Χ 2Χ = African
American/Hispanic indicator; = other indicator; = gender; 3Χ 4Χ X 1…3 = grand mean centering;
= the Level 1 random effect; and = the Level 1 variance. 2σϒ
− − −+ +1j(Χ j2(Χ 3 j(Χ = + ) ) )ojβ 1 jβ 2 jβ 3 jβִִ ִִ ִִִijΥ 1 jX 2 jX 3 jX
−+ +4 j(Χ (1) )4 jβ ¡jϒ4 jX
Equation 2 shows the Level 2 class model. Let 0 jβ = the adjusted means across schools;
= the Level 2 intercept; = aggregate impact of intervention; 00γ 01γ 02γ = the Level 2 covariate
effect, school size; = the treatment indicator; = class size; and 01μ1W 2W = the level 2 random
effects.
= + + + (2) 00γ 01γ 02γ 01μ( ) ( )0 jβ 1W 2W
Results
The impact or effect of Criterion on writing skills in ninth grade is defined as the
difference between the average scores on essays written by students in classes randomly assigned
to treatment and comparison groups at the end of the study period. The impact was estimated
using a two-level HLM to adjust for treatment-comparison group differences on observable
measures and to account for the hierarchical structure of the data. (Impacts adjusted using
ordinary least squares are shown in Appendix F.) In this section, the impact of Criterion on two
14

writing outcomes is reported. The two outcomes are the holistic and analytic scores on essays
handwritten by students in response to persuasive prompts. The holistic score measures the
overall quality of the essay, and the analytic score measures the mechanics of the essays such as
grammar.7
The impact of Criterion on the full sample and a subsample of this sample was estimated.
The full sample included all students who had a least one score in the writing database. The
subsample included students whose baseline scores were in the lower quartile of the distribution
of the outcome measure.
The treatment-comparison difference on the average analytic scores on persuasive essays
written at the end of the study period was statistically significant at the .05 level using a one-
tailed test after students in the treatment classes used Criterion for 1 month. The treatment-
comparison difference between the holistic scores on these essays was not statistically significant
at the .05 level using a similar test.
Impact on Analytic Scores
Full sample. Students in classes randomly assigned to use Criterion over a 4 week period
had on average higher analytic scores on the persuasive essays written at the end of the study
period than those in the comparison classes. The analytic score measured the mechanical aspect
of the essays, such as grammar. See Table 9. The difference is small and statistically significant
at the .05 level using a one-tailed test.
On average, the analytic scores on the essays written by students in the classes who used
Criterion were .11 of a point higher on a 1–4 scale than those who did not. This is an effect size
of .15, which is classified as small (Lipsky, 1990).
The units in the Level 2 model are adjusted class averages on analytic scores that were
created in the Level 1 model separately for each class ( ). ojβ
The is the coefficient associated with the class-level treatment indicator in the Level 2
model. This coefficient is the average difference in analytic written scores between students in
treatment classes and those in comparison classes—in other words, the impact of Criterion on
students’ writing skill.
01γ
15

Table 9
Hierarchical Linear Model, Level 2 for Full Sample: Analytic Scores
Fixed effects Model for class means
Coefficient SE t-ratio p-value
Intercept, 00γ 2.89 .05 60.382 .00
Treatment, 01γ .11 .06 1.74 .045**
Class size, 02γ .02 .00 2.34 .02 ***
Random effects Model for class means
2χ P-value df Variance component .02 43 72.99 .003 ***
0jμClass mean,
.48 Level 1 effect, 1jϒ
** p < .05. *** p < .01.
Proportion of variance in analytic scores explained by Criterion. About 10% of the
variance between classes is explained by class assignment to the treatment group, which is an
additional indicator of Criterion’s impact on writing skill (other factors affecting the variance
between classes are differences in demographic characteristics, baseline writing skills, and class
size). In this analysis, the reduction in the proportion of variance explained by the impact of
Criterion is examined by comparing the variance explained by the unconditional model, the
Level 1 adjusted means model, and the Level 2 model only including class size. See Table 10.
Table 10
Reduction in Proportion of Variance of Analytic Scores
Variance (
Proportion 2χ p-value Model ) 0 jβ of variance explained
Unconditional .07992 223.46 .000
Adjusted means .02885 80.50 .001 .64
Class size .02767 77.97 .001 .04
Impact of Criterion .02495 72.99 .003 .10
16

In addition, the intraclass correlation among analytic scores provides a benchmark for the
variation between classes that could possibly be explained by class use of Criterion. In this
sample, about 13% of the variation among students’ analytic scores is explained by variance in
class averages (ρ = .13). Sixty-four percent of this variance in class averages is explained by
differences in demographic characteristics and prewriting scores. In fact, the intraclass
correlation drops from .13 to .06 when the class averages are adjusted for baseline background
characteristics. See Table 11.
Table 11
Comparison of Intraclass Correlations in Unconditional and Adjusted Models: Analytic
Written Scores
Ρ-value 00τ 2σModel
Unconditional .5528 .0799 .13
Adjusted means .4766 .0288 .06
Impact on Subsample
The impact of Criterion on the analytic scores given to student essays was somewhat
smaller at the lower end of the baseline writing distribution and did not reach statistical
significance. The lack of statistical significance may partly be due to a decrease in sample size.
On average, the analytic scores on essays written by students in classes assigned to the treatment
group were .06 of a point higher than those assigned to the comparison group. See Table 12.
Holistic Scores
Full sample. The essays written by students in the sample were scored using the NAEP
1–6 point holistic scoring guide for persuasive writing. The holistic score was based on whether
a position was presented, the organization of the essay, use of detail to support the position,
facility in the use of language, and evidence of knowledge of grammar rules.
The treatment-comparison group difference between the average holistic scores on
persuasive essays was not statistically significant at the .05 level for a one-tailed test. See Table 13.
17

Table 12
Hierarchical Linear Model, Level 2 Subsample: Analytic Scores
Fixed effects Model for class means
Coefficient SE t-ratio p-value
2.58 .08 32.75 .00 Intercept, 00γ
Treatment, .06 .10 .59 .56 01γ
Class size, –.02 .01 –2.19 .03*** 02γ
Random effects Model for class means
p-value df Variance component 2χ
.05 7 20.25 .005*** Class mean, 0jμ
.58 Level 1 effect, 1jϒ
*** p < .01.
Table 13
Hierarchical Linear Model, Level 2 Full Sample: Holistic Scores
Fixed effects Model for class means
Coefficient SE t-ratio p-value
Intercept, 00γ 3.81 .08 46.121 .00
Treatment, 01γ .10 .11 .96 .34
Class size, 02γ .03 .02 2.34 .02***
Random effects Model for class means
p-value df Variance component 2χ
Class mean, 0jμ .14 43 136.41 .000
Level 1 effect, .63 1jϒ
*** p < .01.
18

Subsample. The writing subsample was defined as students across treatment and
comparison groups that were in the lower quartile of the prewriting distribution at baseline. The
impact of Criterion on the holistic scores on essays at the end of the study period did not reach
statistical significance. See Table 14. Further research is needed to understand the pattern of
effects for different subgroups and to test whether the differences in impact between the full
sample and the subsample are statistically significant.
Table 14
Hierarchical Linear Model, Level 2 Subsample: Holistic Scores
Fixed effects Model for class means
t-ratio p-value Coefficient SE
3.40 .07 47.08 .000 Intercept, 00γ
Treatment, 01γ .10 .13 .79 .43
– .07 .02 – 4.08 .00 Class size, 02γ
Random effects Model for class means
p-value df Variance component 2χ
.10 13 50.56 .00 Class mean, 0j
μ
.70 Level 1 effect, 1jϒ
Discussion
Schools are increasingly accountable for preparing students to write well (Freedman,
1987). Writing is an important form of communication for success in school and today’s labor
market (MacArthur, Graham, & Fitzgerald, 2006). However, providing students with the type of
ongoing formative feedback that supports writing instruction is challenging for schools (Dyson
& Freedman, 1990). Automated feedback systems when used as a supplemental instructional tool
may help schools improve students’ writing by providing formative feedback on students’ essays
and allowing for revisions based on this accurate and specific feedback (Burstein et al., 2004).
19

This random assignment evaluation provides preliminary evidence that automated
feedback systems may be a useful supplemental instructional tool for writing instruction in high
school. In this study, students in ninth grade classes who used Criterion several times a week
over a 1 month period received higher analytic scores on their persuasive essays written at the
end of the study period than did those in classes who did not use Criterion. While replication
studies are required, the random assignment design and its implementation support the causal
inference that the use of Criterion was the cause for the differences in the analytic scores given
to the essays written by students in the treatment comparison groups. However, limitations of the
study design should be taken into consideration when interpreting the findings.
Limitations of the Study Design
Contrast in treatment. While randomly assigning classes taught by the same teacher to
treatment and comparison groups eliminates confounding factors due to differences in teacher
characteristics, it is possible that teachers may influence the contrast in treatment. For example,
instruction in the two classes may differ in ways associated with the outcomes, but unrelated to
the use of Criterion.
Three-level hierarchical linear model. Although the proportion of variance explained by
differences among classes is low, a three-level HLM that included the teacher as a separate level
may provide a more precise estimate of the standard error that was used to estimate the statistical
significance of the treatment-comparison difference.
Teachers with unequal numbers of classes in the sample. Several teachers in the study
had an unequal number of classes (1 or 3 classes) in the sample. While the original design study
called for two classes per teachers, the decision was made prior to randomization to include these
classes because of sample size and recruitment concerns. Including these teachers in the sample
may have created a treatment-comparison group difference on writing outcomes—when
measured as scores from typed essays—that was unrelated to the use of Criterion. This situation
might weaken the causal inferences that could be drawn. The difference in writing outcomes
happened because several teachers did not return typed essays. These teachers had one class in
the study that was randomly assigned to the treatment group, were more likely to come from
schools with lower average prewriting scores, and were more prevalent by chance in the
treatment group than in the comparison. Therefore, the impact of Criterion, estimated from
20

scores on the handwritten essays, was used where the causal inferences that could be drawn were
stronger.
Equated scores. In this study, scores given to essays were not adjusted for the intrinsic
differences in difficulty of the essays involved. While essay prompts were randomized across
groups and time periods, this counterbalancing may not fully eliminate this problem.
Single measure used to assess writing. In this study, a single score or item was used to
assess student’s writing skill. Multiple indicators would provide a more reliable measure of a
student’s writing skill. A second study of Criterion underway by the author uses multiple
measures of writing across genres.
Criterion as a Supplementary Instructional Tool
While the impact of Criterion on students’ writing was small and limited to the analytic
score on essays, the practical importance of this finding should be viewed within the short time
period Criterion was used by the students in the study and the complexity of the writing process.
Students in this study only used Criterion several times a week over a 1 month period.
Considering how difficult it is to improve writing skill, a small impact on analytic skills seems
reasonable. A second study on the efficacy of Criterion examines the use of Criterion over 1
year and will provide information on the impact of Criterion when used for a longer time period.
Several factors, however, may have contributed to the lack of an impact on the holistic
scores on student essays. On the one hand, it is possible that simply using Criterion longer would
improve the overall quality of a student’s essay. On the other hand, integrating Criterion more
fully into teacher’s instructional practice may be required to see improvements in holistic quality.
For example, Criterion feedback is not genre-specific, and students may need guidance from the
teacher to interpret the ways in which feedback from Criterion can help improve the strength of
their overall argument. In addition, teachers might benefit from professional development
training that provides guidance in more fully integrating Criterion into instructional practice.
At the same time, to optimize the impact of an automated feedback system on student’s
writing, creative solutions may be required to address the issue of students having access to
computers. About 43% of the students in this study reported using a computer in school
infrequently—once every few weeks or rarely. In comparison, approximately 70% of students
reported using a computer every day from home. Strategies that specifically encourage
21
independent use of automated feedback systems, along with its use in school in partnership with
teachers, may be important to the application of Criterion as a supplementary instructional tool.
In conclusion, this study provides scientific evidence that Criterion used over a short time
period improved the mechanical aspects of student essays as measured by the analytic scores
given to their essays. Students in ninth grade English classes who used Criterion several times a
week over a 1 month period received higher analytic scores on essays written at the end of the
study period than those students who were in classes that did not use Criterion. The effect was
small, but statistically significant at the .05 level using a one-tailed test. Given the short time
period that the product was used and the complexity of the writing process, the study findings
suggest a role for automated feedback systems in supporting writing instruction. Future research
that examines the effect of Criterion when used over a longer time period and the use of
professional development models by teachers to integrate the product into their instruction may
identify ways that automated feedback systems can have a larger impact on the writing skills of
students.
22

References
Beach, R., & Friedrich, R. (2006). Response to writing. In C. MacArthur, S. Graham, & J.
Fitzgerald (Eds.), Handbook of writing research. (pp. 222–234). New York: The Guilford
Press.
Bloom, H. S., Richburg-Hayes, L., & Black, A. R. (2005). Using covariates to improve
precision: Empirical guidance for studies that randomize schools to measure the impacts
of educational interventions. New York: MDRC.
Braun, H. (2003). Power calculations for hierarchical analyses. Princeton, NJ: ETS.
Burstein, J. (2003). The e-rater scoring engine: Automated essay scoring with natural language
processing. In M. D. Sherman & J. Burstein (Eds.), Automated essay scoring: A cross-
disciplinary perspective. Hillsdale, NJ: Lawrence Erlbaum Associates, Inc.
Burstein, J., & Chodorow, M. (2003). Directions in automated essay scoring. In R. Kaplan (Ed.),
Handbook of applied linguistics. New York: Oxford University Press.
Burstein, J., Chodorow, M., & Leacock, C. (2003). CriterionSM online essay evaluation: An
application for automated evaluation of student essays. In J. Riedl & R. Hill, Proceedings
of the fifteenth conference on Innovative Applications of Artificial Intelligence (pp. 3–10).
Menlo Park, CA: AAAI Press.
Burstein, J., Chodorow, M., & Leacock, C. (2004). Automated essay evaluation: The Criterion
Online Writing Service. AI Magazine, 25(3), 27–36.
Calkins, L. M. (1994). The art of teaching writing (new ed.). Portsmouth, NH: Heinemann.
Dahl, K. L., & Farnan, N. (1998). Children’s writing perspectives from research. Newark, DE:
International Reading Association.
Dyson, A. H., & Freedman, S. W. (1990, July). On teaching writing: A review of the literature
(Occasional Paper No. 20). Berkeley, CA: National Center for the Study of Writing and
Literacy.
Emig, J. (1971). The composing processes of twelfth graders (NCTE Research Rep. No. 13.).
Urbana, IL: National Council of Teachers of English.
Freedman, S. W. (1987). Recent developments in writing: How teachers manage response.
English Journal, 76(6), 35–40.
23

Freedman, S. W. (1991). Evaluating writing: Linking large-scale testing and classroom
assessment (Occasional Paper No. 27). Berkeley, CA: National Center for the Study of
Writing and Literacy.
Freedman, S. W, Dyson, A. H, Flower, L., & Chafe, W. (1987). Research in writing: Past,
present, and future (Technical Rep. No. 1). Berkeley, CA: National Center for the Study
of Writing and Literacy.
Graves, D. H. (1983). Writing: Teachers & children at work. Portsmouth, NH: Heinemann.
Light, R. J., Singer, J. D., & Willett, J. B. (1990). By design: Planning research on higher
education. Cambridge, MA: Harvard University Press.
Lipsky, M. W. (1990). Design sensitivity: Statistical power for experimental research. Newbury
Park, CA: Sage.
MacArthur, C. A, Graham, S., & Fitzgerald, J. (Eds.). (2006). Handwork of writing research.
New York: The Guilford Press.
Mosteller, F., & Boruch, R. (2002). Evidence matters: Randomized trials in educational
research. Washington, DC: Brookings Institute Press.
Nystrand, M. (2006). The social and historical context for writing research. In C. MacArthur, S.
Graham, & J. Fitzgerald (Eds.), Handbook of writing research (pp. 11–27). New York:
The Guilford Press.
Pritchard, R., & Honeycutt, R. (2006). The process approach to writing instruction: Examining
its effectiveness. In C. MacArthur, S. Graham, & J. Fitzgerald (Eds.), Handbook of
writing research (pp. 275–290). New York: The Guilford Press.
Raudenbush, S. W., & Bryk, A. S. (2002). Hierarchical linear models: Applications and data
analysis methods (2nd ed.). Thousand Oaks, CA: Sage Publications.
Shadish, W. R., Cook, T. D., & Campbell, D. T. (2002). Experimental quasi-experimental
designs for generalized causal inference. New York: Houghton Mifflin Company.
Shermis, M. D., Burstein, J., & Leacock, C. (2006). Applications of computers in assessment
analysis of writing. In C. MacArthur, S. Graham, & J. Fitzgerald (Eds.), Handbook of
writing research (pp. 403–416). New York: The Guilford Press.
Singer, J., & Willet, J. (2003). Applied longitudinal data analysis-modeling change and event
occurrence. Oxford; UK: Oxford University Press.
24
Notes
1 The exceptions were nine teachers who enlisted one class and two teachers who enlisted three
classes. These classes were randomly assigned to a treatment or a comparison group.
2 Ten percent of the sample did not provide their ethnicity.
3 Regression-adjusted impacts on the typed scores are included in Appendix F for background.
4 Only holistic scores were available for the first sample of 200 essays.
5 Prompts that were part of the pre- and postwriting assessment were not chosen by the teachers.
6 The baseline characteristics of the impact sample were examined using a similar analysis that
was used with the full sample. The results indicated that the baseline characteristics were
similar across treatment and comparison groups, except for gender. This suggests that the
definition of the impact sample and the pattern of missing values did not create a bias in the
sample.
7 In this report, scores on handwritten persuasive essays written at the end of the study period are
reported. The impact on the holistic and analytic scores was estimated separately.
25

List of Appendixes
Page
A - Demographics of Schools in the Sample .............................................................................. 27
B - Scoring Rubrics: Holistic and Analytic ................................................................................ 28
C - Baseline Writing Experiences............................................................................................... 32
D - List of Prompts ..................................................................................................................... 34
E - Covariate Analysis: Regression Coefficients for Baseline Characteristics and Writing
Outcomes .............................................................................................................................. 35
F - Impact of Criterion on Writing Skills.................................................................................... 36
26

Appendix A
Demographics of Schools in the Sample
The study sample consisted of four schools from Indiana, three schools from
Pennsylvania, and four from New Jersey. The demographics and ethnicity of the schools differed
within and across states.
The four schools in Indiana differed in both the location of their facilities and the
diversity of their student body. One of the four schools predominately had White students and
was located on the urban fringe of a large city. The student population was 94% White, with
small numbers of African-American, Hispanic, and Asian students.
The other three schools had more diverse student bodies. One school was located in a
large city. Fifty-seven percent of the students at that school were White, and there was a sizeable
African-American population (34%). The second school also had a diverse student population;
about 48% of students were White, 38% were African-American, and 10% were Hispanic, with a
small Asian population. The third school had the largest African-American population (97% of
students) and was located on an urban fringe of a large city.
In contrast, the three Pennsylvania schools were all located on urban fringes of large
cities. While two of the schools predominately had White students (over 90%), the three schools’
minority populations differed. The first school had a small African-American and Asian
population, while the second had Asian and Hispanic populations. The third was more diverse
with a sizeable African-American population (35%).
The three schools in New Jersey had predominately White students, and all had diverse
minority populations that included African-American, Hispanic, and Asian students.
27

Appendix B
Scoring Rubrics: Holistic and Analytic
Holistic
6 The persuasive essay demonstrates a high degree of competence in response to the prompt but
may have a few minor errors. An essay in this category generally has the following features:
• conveys a definite opinion or position on the issue
• is well-developed with a clear organizational structure
• contains considerable detail that supports the opinion or position
• clearly demonstrates facility in the use of language
• is generally free from errors in mechanics, usage, and sentence structure
5 The persuasive essay demonstrates clear competence in response to the prompt but may have
minor errors. An essay in this category generally has the following features:
• conveys a clear opinion or position on the issue
• is developed with a clear organizational structure
• contains details that effectively support the opinion or position.
• demonstrates facility in the use of language
• contains few errors in mechanics, usage, and sentence structure
4 The persuasive essay demonstrates competence in response to the prompt. An essay in this
category generally has the following features:
• conveys an opinion or position on the issue
• is adequately developed but may have occasional weaknesses in organizational
structure
• contains details that support the opinion or position
• demonstrates adequate facility in the use of language
• may display some errors in mechanics, usage, or sentence structure but not a
consistent pattern or accumulation of such errors
28

3 The persuasive essay demonstrates some degree of competence in response to the prompt but
is clearly flawed. An essay in this category reveals one or more of the following weaknesses:
• conveys an opinion or position on the issue
• is somewhat developed but lacks clear organizational structure
• contains few details that support the opinion or position
• demonstrates inappropriate use of language
• reveals a pattern or accumulation of errors in mechanics, usage, or sentence structure
2 The persuasive essay demonstrates only limited competence and is seriously flawed. An essay
in this category reveals one or more of the following weaknesses:
• contains an unclear opinion or ambiguous position on the issue
• lacks development and/or organizational structure
• contains little or no relevant detail
• displays serious or persistent errors in use of language
• displays serious errors in mechanics, usage, or sentence structure
1 The persuasive essay demonstrates fundamental deficiencies in writing skills. An essay in this
category reveals one or more of the following weaknesses:
• makes no attempt to state an opinion or position on the issue
• is undeveloped
• is incoherent
• contains serious and persistent writing errors
29
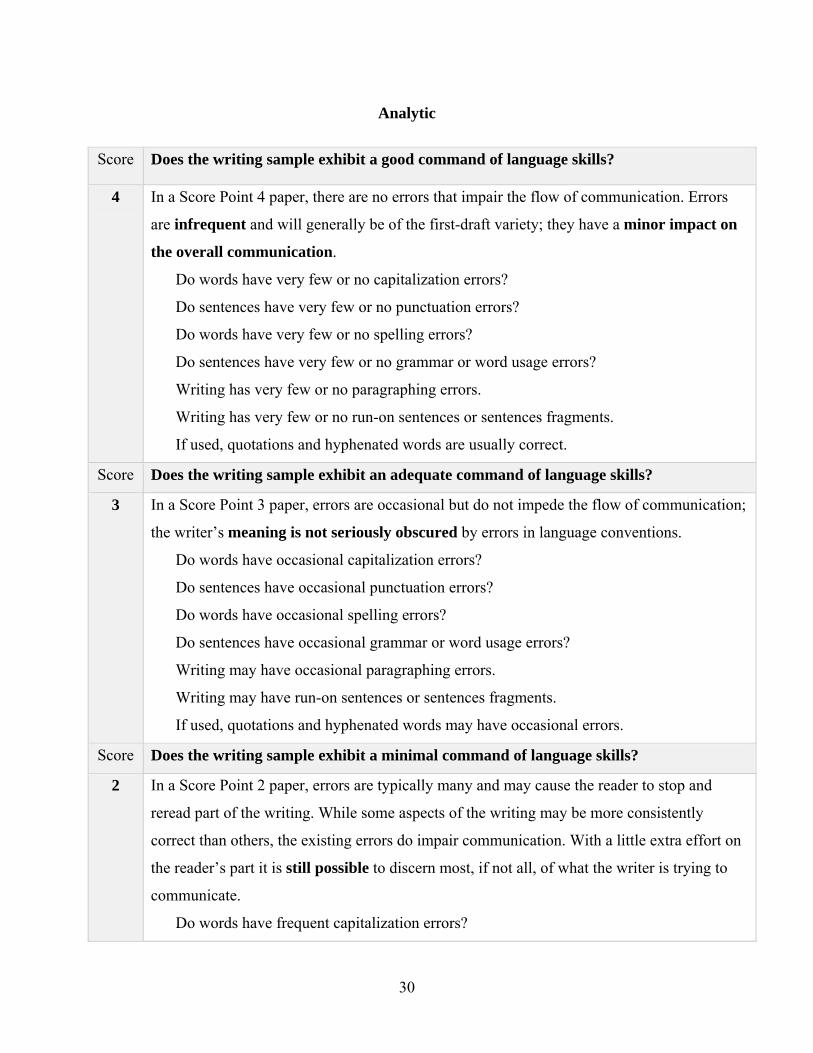
Analytic
Does the writing sample exhibit a good command of language skills? Score
4 In a Score Point 4 paper, there are no errors that impair the flow of communication. Errors
are infrequent and will generally be of the first-draft variety; they have a minor impact on
the overall communication.
Do words have very few or no capitalization errors?
Do sentences have very few or no punctuation errors?
Do words have very few or no spelling errors?
Do sentences have very few or no grammar or word usage errors?
Writing has very few or no paragraphing errors.
Writing has very few or no run-on sentences or sentences fragments.
If used, quotations and hyphenated words are usually correct.
Does the writing sample exhibit an adequate command of language skills? Score
3 In a Score Point 3 paper, errors are occasional but do not impede the flow of communication;
the writer’s meaning is not seriously obscured by errors in language conventions.
Do words have occasional capitalization errors?
Do sentences have occasional punctuation errors?
Do words have occasional spelling errors?
Do sentences have occasional grammar or word usage errors?
Writing may have occasional paragraphing errors.
Writing may have run-on sentences or sentences fragments.
If used, quotations and hyphenated words may have occasional errors.
Does the writing sample exhibit a minimal command of language skills? Score
2 In a Score Point 2 paper, errors are typically many and may cause the reader to stop and
reread part of the writing. While some aspects of the writing may be more consistently
correct than others, the existing errors do impair communication. With a little extra effort on
the reader’s part it is still possible to discern most, if not all, of what the writer is trying to
communicate.
Do words have frequent capitalization errors?
30
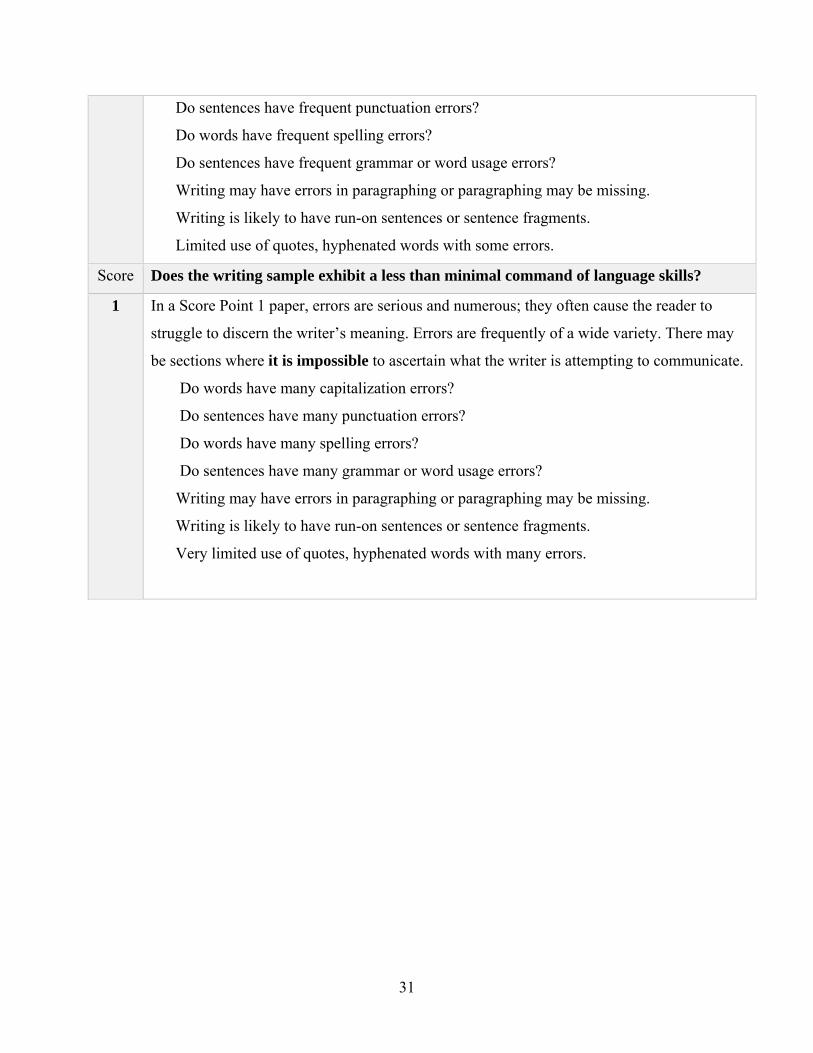
Do sentences have frequent punctuation errors?
Do words have frequent spelling errors?
Do sentences have frequent grammar or word usage errors?
Writing may have errors in paragraphing or paragraphing may be missing.
Writing is likely to have run-on sentences or sentence fragments.
Limited use of quotes, hyphenated words with some errors.
Does the writing sample exhibit a less than minimal command of language skills? Score
1 In a Score Point 1 paper, errors are serious and numerous; they often cause the reader to
struggle to discern the writer’s meaning. Errors are frequently of a wide variety. There may
be sections where it is impossible to ascertain what the writer is attempting to communicate.
Do words have many capitalization errors?
Do sentences have many punctuation errors?
Do words have many spelling errors?
Do sentences have many grammar or word usage errors?
Writing may have errors in paragraphing or paragraphing may be missing.
Writing is likely to have run-on sentences or sentence fragments.
Very limited use of quotes, hyphenated words with many errors.
31

Appendix C
Baseline Writing Experiences
Students reported few opportunities to write essays in school and even less experience
writing essays under the type of timed conditions used in mandated state tests. Over 65%
reported writing essays once every few weeks or rarely. Over 60% of students’ reported that they
had rarely written timed essays and 26% indicated only writing once every few weeks.
In general, the use in-school of computers in this sample was low. Over 40% were only
using a computer once every few weeks or rarely. Students were much more likely to use
computers at home, with close to 70% stating that they used a computer every day. About 80%
of students stated that they seldom wrote their essays directly on their computer.
Table B1
Baseline Writing Experience
Frequency
Rarely Every few weeks
Once a week
Three times a week
Every day
Experience
T C T C T C T C T C
Opportunity to write in ninth grade
Write persuasive 64 58 28 35 5 5 2 3 0.9 0.5
Write essay 16 14 51 53 21 22 8 8 5 5
Write timed essay 66 66 25 27 6 5 2 2 0.4 2
Computer use
Inside school 20 17 24 26 16 20 11 13 29 25
Outside school 5 7 4 5 6 5 13 14 71 69
32
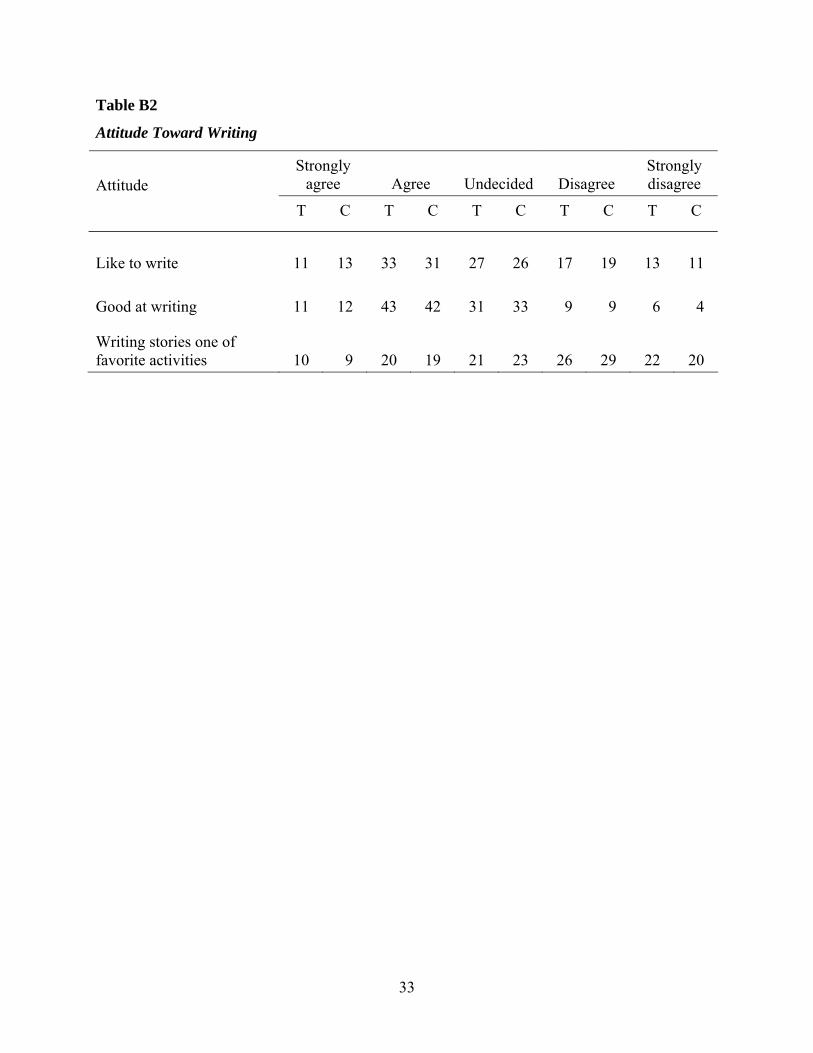
Table B2
Attitude Toward Writing
Strongly agree Agree Undecided Disagree
Strongly disagree Attitude
T C T C T C T C T C
Like to write 11 13 33 31 27 26 17 19 13 11
Good at writing 11 12 43 42 31 33 9 9 6 4
Writing stories one of favorite activities 10 9 20 19 21 23 26 29 22 20
33

34
Appendix D
List of Prompts
Prewriting Assessment
Prompt A
At some high schools, certain classes have no teachers. The students are taught only by
computers. What is your opinion about this idea? Write a letter to your principal stating your
opinion and supporting it with convincing reasons. Be sure to explain your reasons in detail.
Prompt B
In recent years, the media have been involved in covering the lives and actions of wealthy
people, politicians, royalty, and movie/TV stars. Do you think that the media have the
responsibility to report the private lives of wealthy or famous people? Write a persuasive paper
telling whether you agree or disagree that the media should report the private lives of wealthy or
famous people. Give reasons or explanations why you think as you do.
Postwriting Assessments
Prompt C
Write a persuasive essay telling whether you feel students should be required to complete
75 hours of community service as part of their graduation requirements. Give at least two reasons
to support your position. The way in which you present your argument could decide whether you
will be required to do 75 hours of community service before you graduate from high school.
Prompt D
Your city council is considering a safety regulation that would require skateboarders,
rollerbladers, and bikers to wear safety helmets. Decide whether or not you agree with this
regulation. Write to convince your city council of your position.

Appendix E
Covariate Analysis: Regression Coefficients for Baseline Characteristics and Writing Outcomes
Holistic Analytic Variable
p–value
35
Typed Written p–value Typed p–value Written p–value
Intercept 2.41 (.12) .0001*** 2.53 (.12) .0001*** 2.14 (.10) .0001*** 2.14 (.09) .0001***
Prescore .43 (.03) .0001*** .41 (.03) .0001*** .36 (.03) .0001*** .33 (.03) .0001***
African Am. –.47 (.08) .0001*** –.46 (.07) .0001*** –.27 (.06) .0001*** –.21 (.06) .0004***
Hispanic –.36 (.13) .0058*** –.29 (.12) .0131*** –.41 (.10) .0001*** –.30 (.10) .0016***
Asian .05 (.17) .79 –.23 (.17) .19 .33 (.13) .0128*** –.04 (.14) .7640
Pacific Is. .28 (.28) .32 .32 (.27) .24 .26 (.22) .22 –.29 (.22) .1941
Native Am. –.50 (.31) .11 –.62 (.30) .04 .38 (.24) .11 –.20 (.24) .41
Other –.23 (.12) .07* –.19 (.11) .09 –.16 (.10) .11 –.17(.09) .07*
Female –.14 (.05) .0089*** –.26 (.05) .0001*** –.12 (.04) .0041*** –.13 (.04) .0021***
R–square .28 .25 .20 .25
F–statistics 50.58 49.61 33.0 49.61
p–value of F-statistic
.0001*** .0001*** .0001*** .0001***
* p < .1. *** p < .01.

Appendix F
Impact of Criterion on Writing Skills
Adjusted means a Unadjusted means Measure
Impactb p-value p-value Comparison Treatment Comparison Treatment Impact
Holistic
36
Typed 3.84 3.88 .04(.05) .50 3.80 3.84 .05(.06) .39
Written 3.86 3.92 .06(.05) .27 3.84 3.88 .05(.06) .37
Analytic
Typed 3.10 3.10 .04(.04) .97 3.05 3.11 .06(.05) .17
Written 2.90 3.00 .10(.04) .02 2.89 3.00 .11(.05) .02
a The adjusted means were estimated using linear analysis of covariance procedures and controlling for differences in characteristics. b Impact of using Criterion was estimated using ordinary least squares (OLS) impact regression.