wrap-up and review wrap-up and review psy440 july 8, 2008
Post on 22-Dec-2015
215 views
TRANSCRIPT
Wrap-up and ReviewWrap-up and Review
PSY440
July 8, 2008
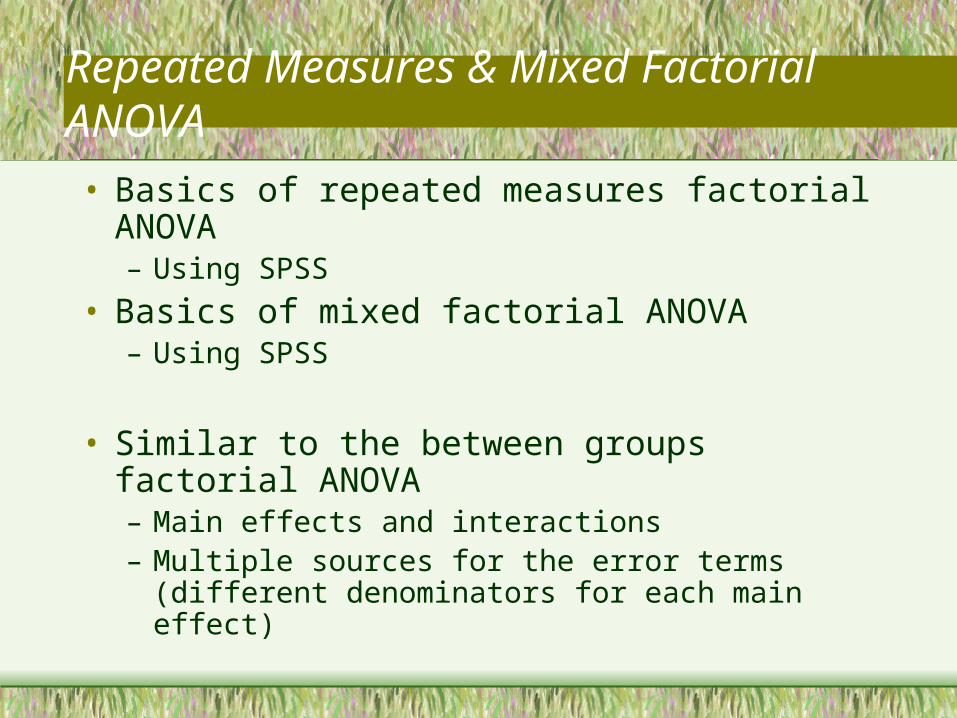
Repeated Measures & Mixed Factorial ANOVA
• Basics of repeated measures factorial ANOVA– Using SPSS
• Basics of mixed factorial ANOVA– Using SPSS
• Similar to the between groups factorial ANOVA– Main effects and interactions– Multiple sources for the error terms (different
denominators for each main effect)

Example
• Suppose that you are interested in how sleep deprivation impacts performance. You test 5 people on two tasks (motor and math) over the course of time without sleep (24 hrs, 36 hrs, and 48 hrs). Dependent variable is number of errors in the tasks.– Both factors are manipulated as within subject
variables– Need to conduct a within groups factorial
ANOVA
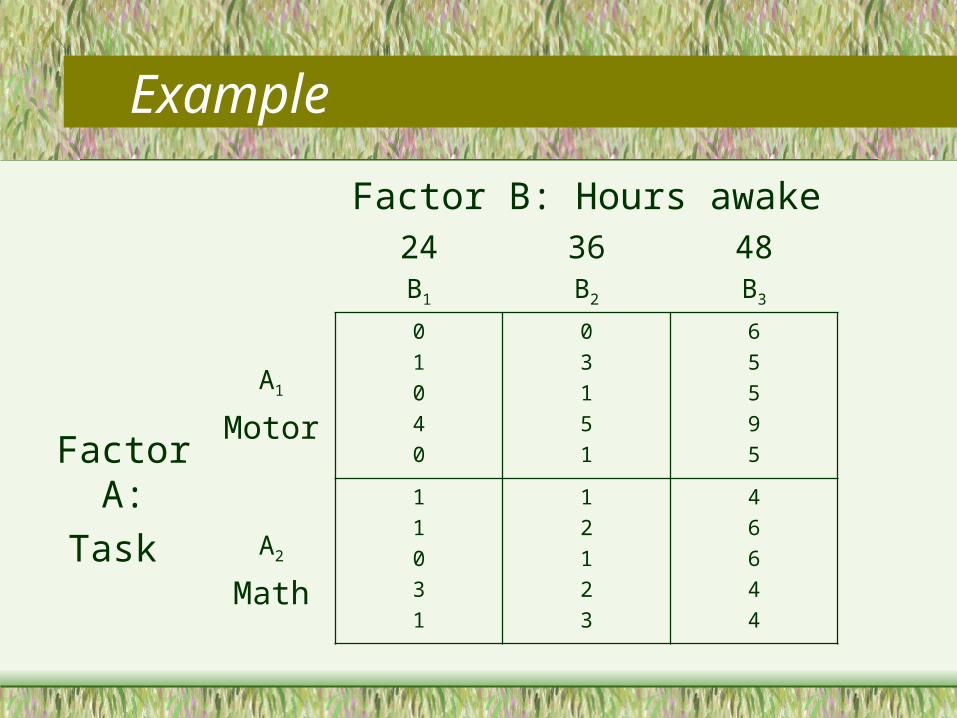
Example
Factor B: Hours awake24B1
36B2
48B3
Factor A:
Task
A1
Motor
0
1
0
4
0
0
3
1
5
1
6
5
5
9
5
A2
Math
1
1
0
3
1
1
2
1
2
3
4
6
6
4
4
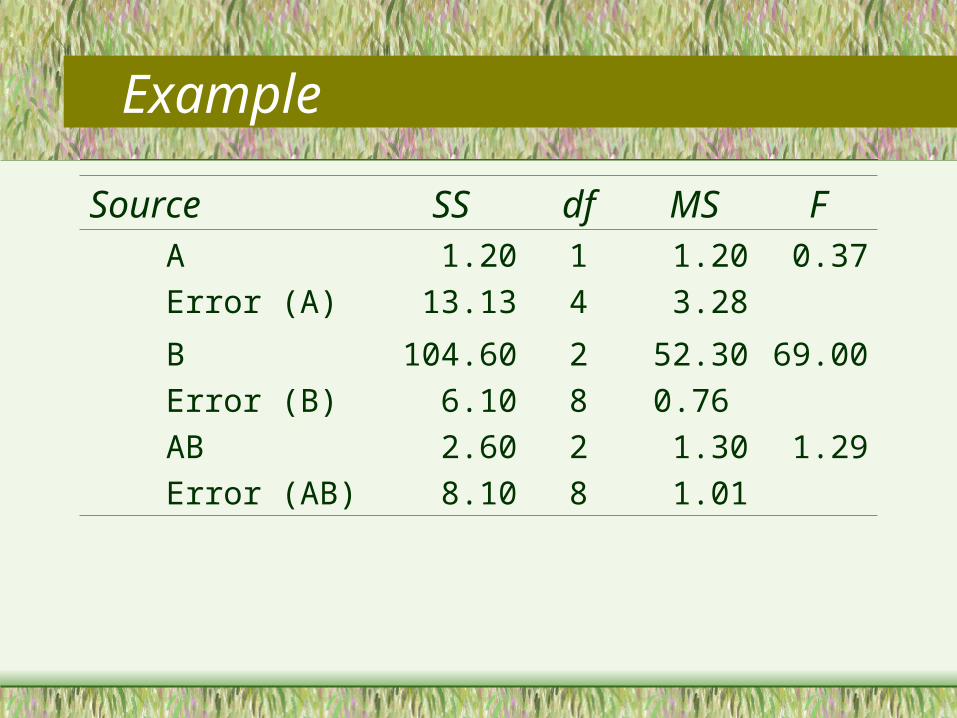
Example
Source SS df MS F A
Error (A)
1.20
13.13
1
4
1.20
3.28
0.37
B
Error (B)
AB
Error (AB)
104.60
6.10
2.60
8.10
2
8
2
8
52.30
0.76
1.30
1.01
69.00
1.29
Example
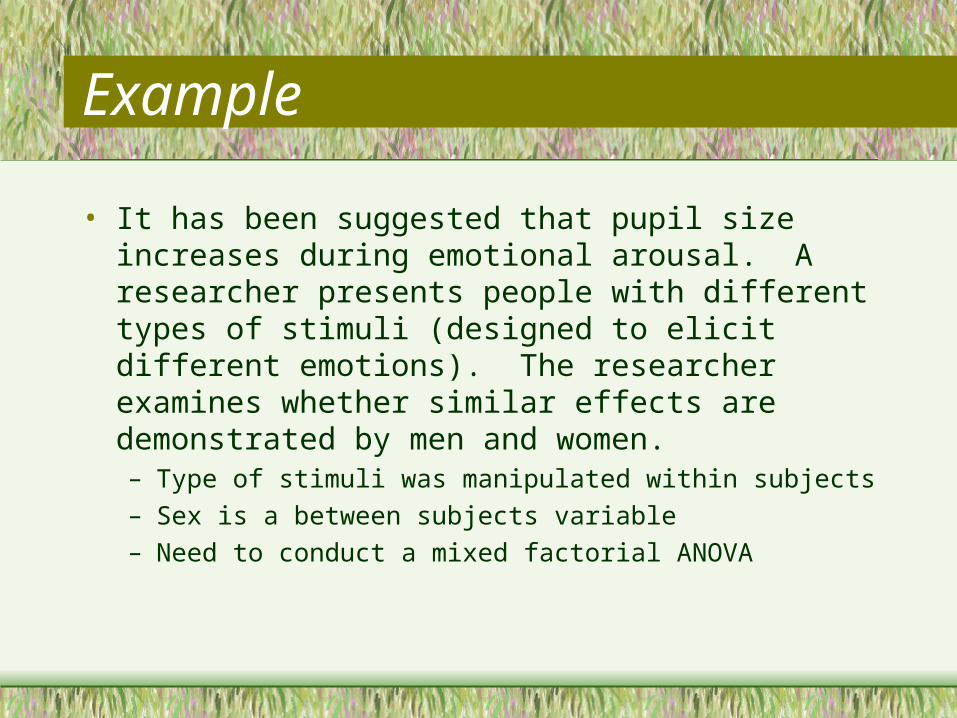
• It has been suggested that pupil size increases during emotional arousal. A researcher presents people with different types of stimuli (designed to elicit different emotions). The researcher examines whether similar effects are demonstrated by men and women.– Type of stimuli was manipulated within subjects
– Sex is a between subjects variable
– Need to conduct a mixed factorial ANOVA
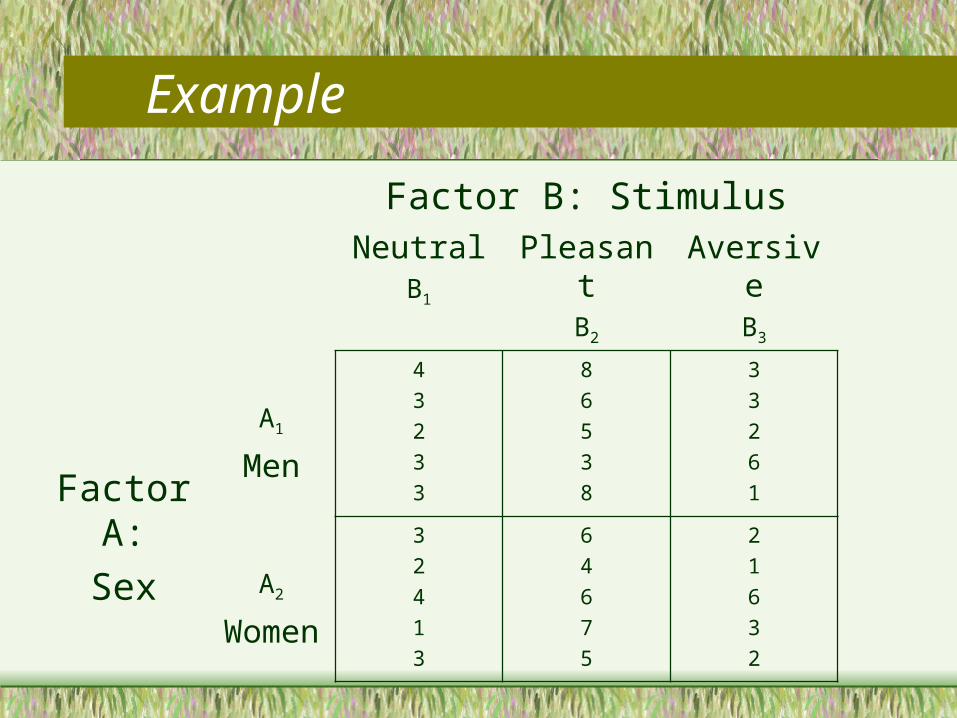
Example
Factor B: StimulusNeutral
B1
PleasantB2
AversiveB3
FactorA:
Sex
A1
Men
4
3
2
3
3
8
6
5
3
8
3
3
2
6
1
A2
Women
3
2
4
1
3
6
4
6
7
5
2
1
6
3
2

Example
Source SS df MS FBetween
A
Error (A)
0.83
20.00
1
8
0.83
2.50
0.33
Within
B
AB
Error (B)
58.10
0.07
39.20
2
2
16
29.00
0.03
2.45
11.85
0.01
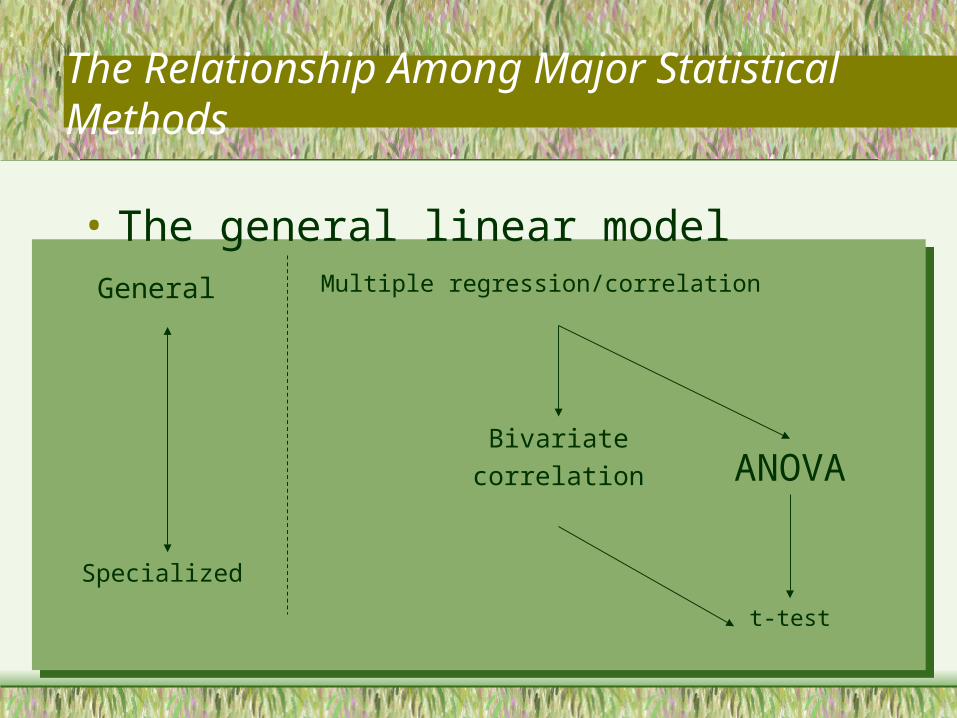
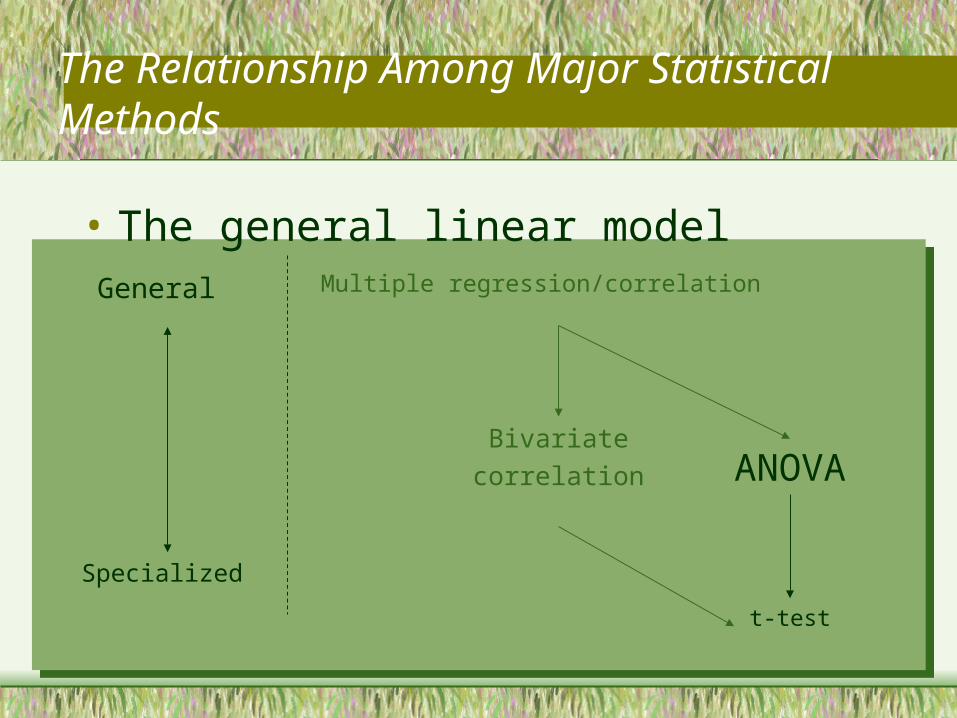
The Relationship Among Major Statistical Methods
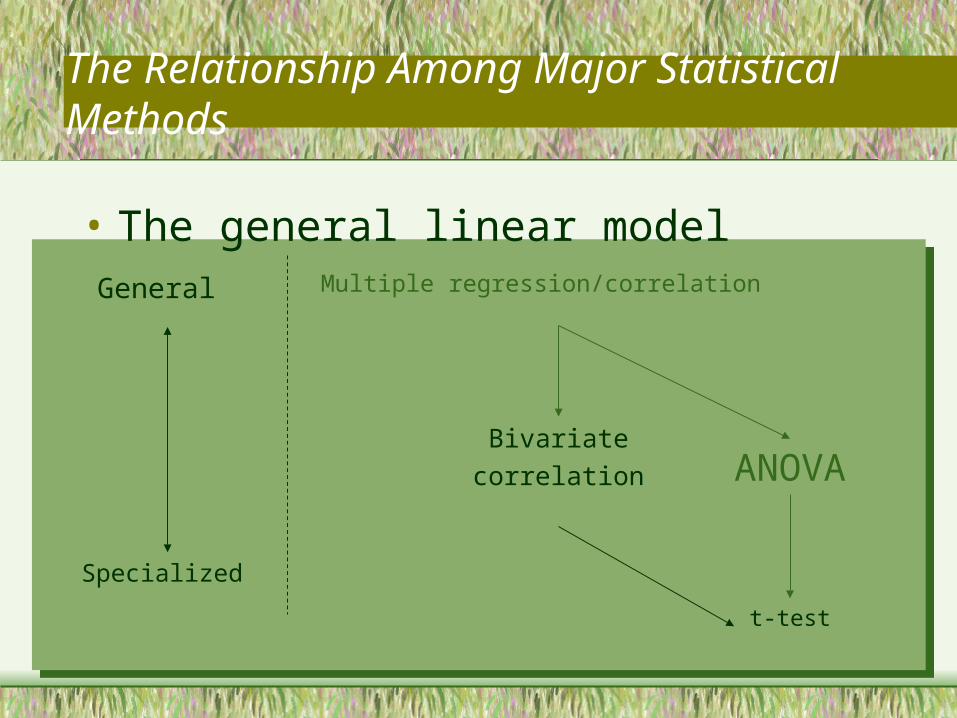
• The general linear model
General
Specialized
Multiple regression/correlation
Bivariate
correlationANOVA
t-test

• The general linear model
General
Specialized
Multiple regression/correlation
Bivariate
correlationANOVA
t-test
The Relationship Among Major Statistical Methods
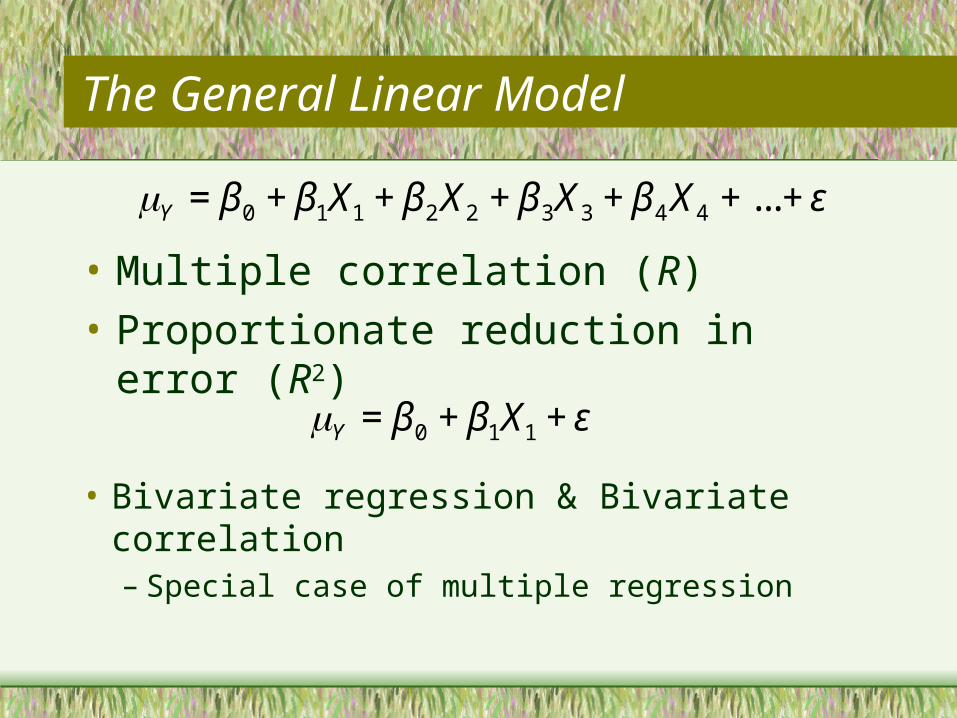
The General Linear Model
μY = β0 + β1X1 + β2 X2 + β 3X3 + β 4 X4 + ... + ε
• Multiple correlation (R)
• Proportionate reduction in error (R2)
• Bivariate regression & Bivariate correlation– Special case of multiple regression
μY = β0 + β1X1 + ε
• The general linear model
General
Specialized
Multiple regression/correlation
Bivariate
correlationANOVA
t-test
The Relationship Among Major Statistical Methods
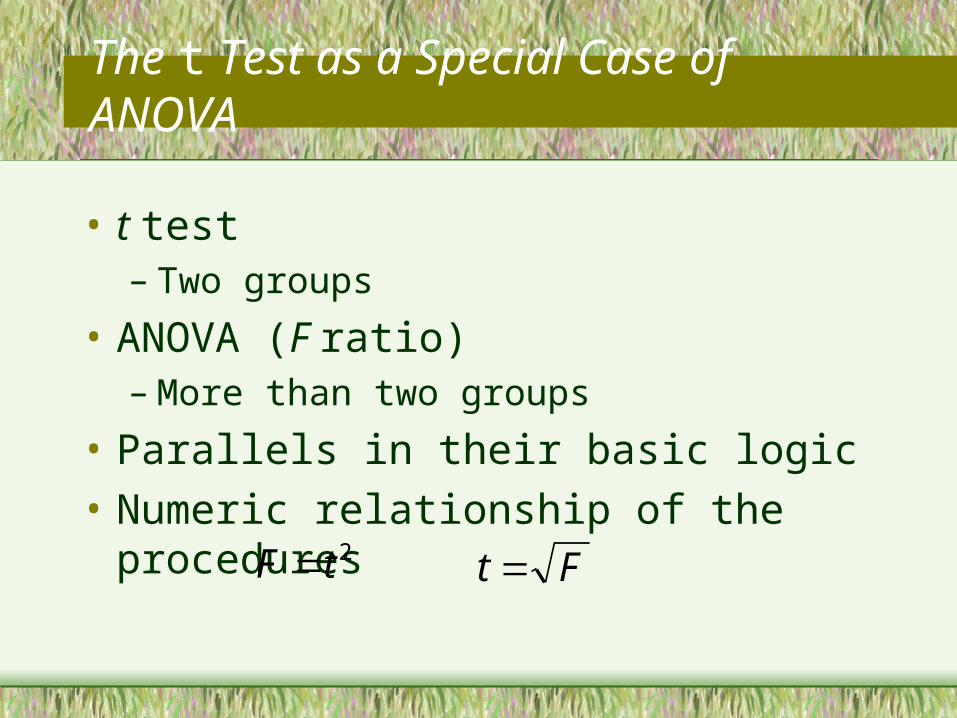
The t Test as a Special Case of ANOVA
• t test– Two groups
• ANOVA (F ratio)– More than two groups
• Parallels in their basic logic
• Numeric relationship of the procedures2tF = Ft =
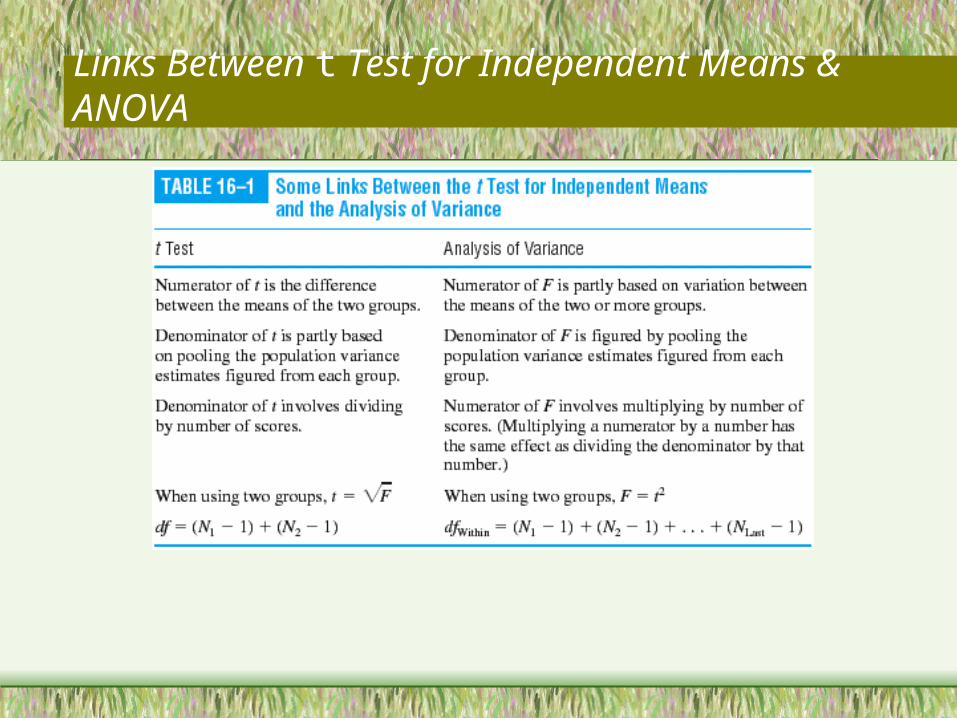
Links Between t Test for Independent Means & ANOVA

The Relationship Among Major Statistical Methods
• The general linear model
General
Specialized
Multiple regression/correlation
Bivariate
correlationANOVA
t-test
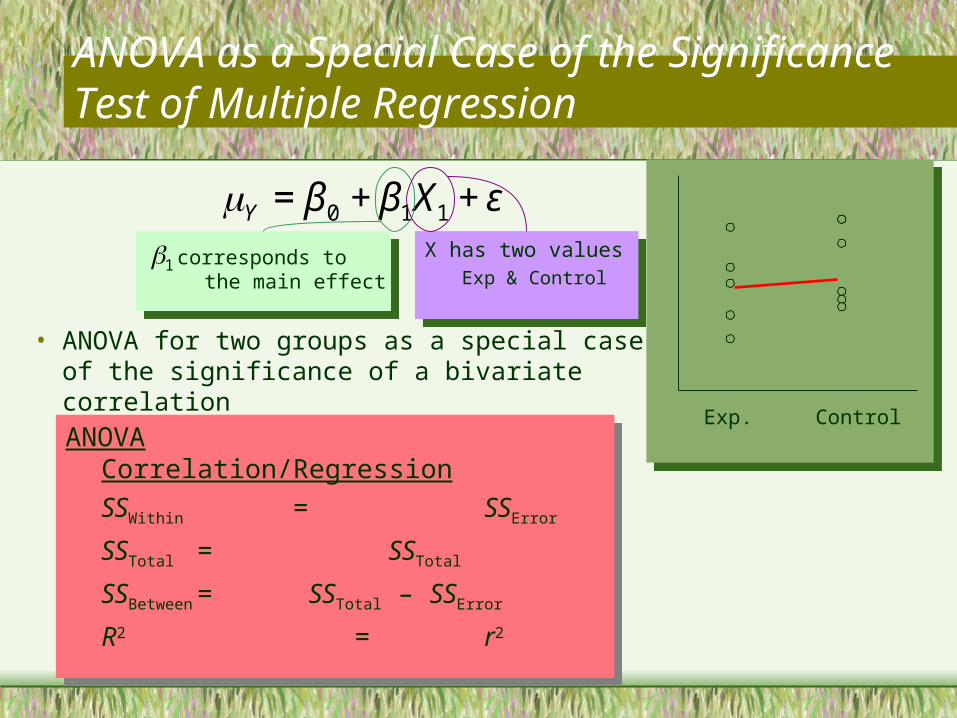
ANOVA as a Special Case of the Significance Test of Multiple Regression
ANOVA Correlation/Regression
SSWithin = SSError
SSTotal = SSTotal
SSBetween = SSTotal – SSError
R2 = r2
ANOVA Correlation/Regression
SSWithin = SSError
SSTotal = SSTotal
SSBetween = SSTotal – SSError
R2 = r2
μY = β0 + β1X1 + ε
Exp. Control
corresponds to the main effect
β1 X has two valuesExp & Control
X has two valuesExp & Control
• ANOVA for two groups as a special case of the significance of a bivariate correlation
ANOVA as a Special Case of the Significance Test of Multiple Regression
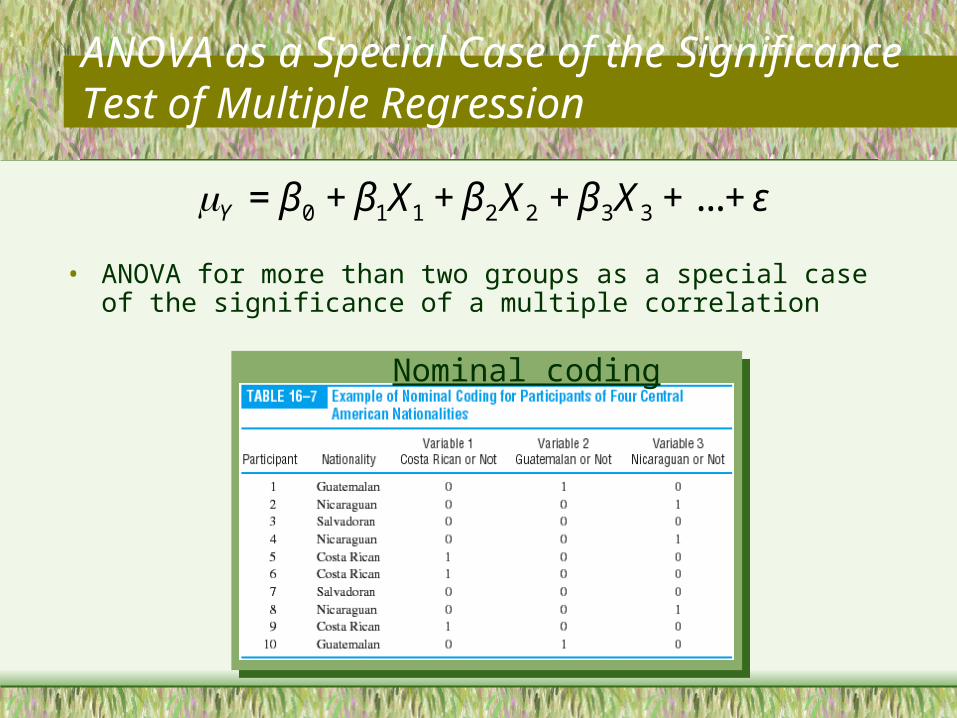
• ANOVA for more than two groups as a special case of the significance of a multiple correlation
μY = β0 + β1X1 + β2 X2 + β 3X3 + ... + ε
Nominal coding
ANOVA as a Special Case of the Significance Test of Multiple Regression
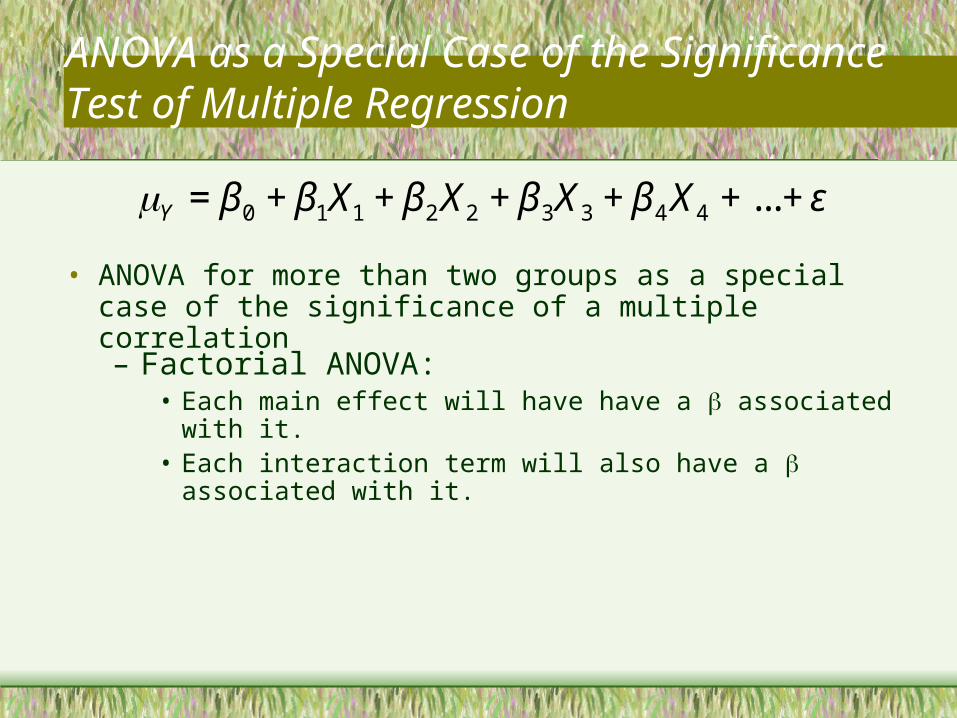
– Factorial ANOVA: • Each main effect will have have a β associated with it.• Each interaction term will also have a β associated with it.
μY = β0 + β1X1 + β2 X2 + β 3X3 + β 4 X4 + ... + ε
• ANOVA for more than two groups as a special case of the significance of a multiple correlation
The Relationship Among Major Statistical Methods
• The general linear model
General
Specialized
Multiple regression/correlation
Bivariate
correlationANOVA
t-test
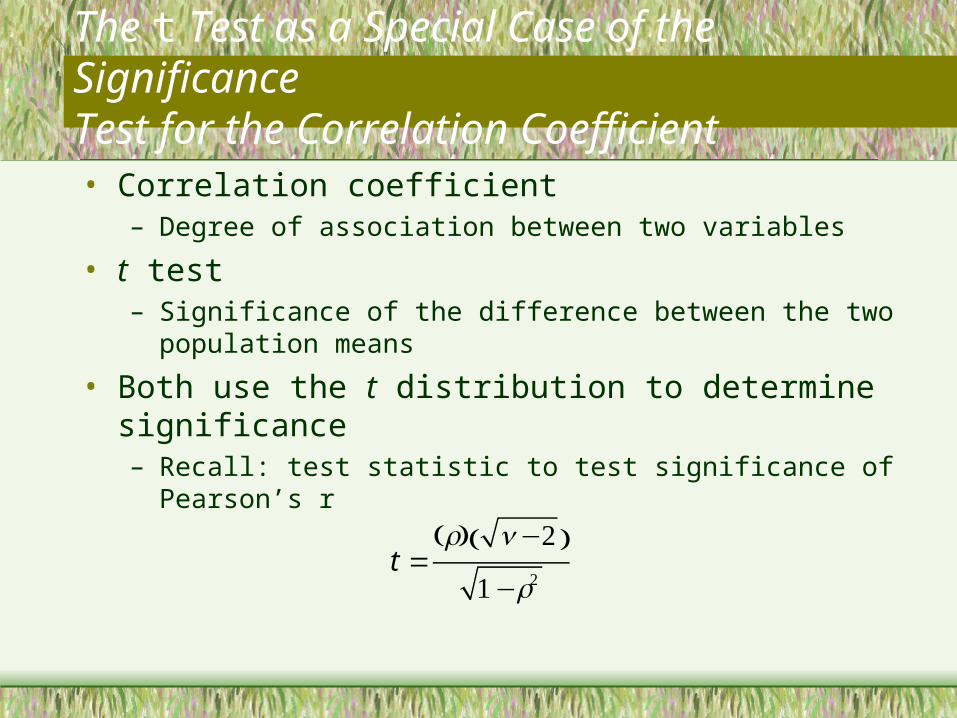
The t Test as a Special Case of the Significance Test for the Correlation Coefficient
• Correlation coefficient– Degree of association between two variables
• t test– Significance of the difference between the two population means
• Both use the t distribution to determine significance– Recall: test statistic to test significance of Pearson’s r
t =r( ) n−2( )
1−r2

Relation Between Correlation and t Test for Independent Means

Choice of Statistical Tests
General
Specialized
Multiple regression/correlation
Bivariate
correlationANOVA
t-test
• t test, ANOVA, and correlation can all be done as multiple regression– However, each usually used in specific research contexts
– Correlation and regression automatically give estimates of effect size and not just significance

Final Exam
– Basic Probability
– Descriptive statistics• Means
• Standard deviation
– Normal Distribution– Distribution of sample
means (Central Limit Theorem)
– Error types• Type 1 ()
• Type 2 (β)
• Statistical power
– Hypothesis testing• 1-sample z test
• T-tests– 1-sample– Related samples– Independent samples
• ANOVA– 1 factor– Repeated Measures– Factorial
• Correlation & regression
– Experimental Design
• Topics
Final Exam
Make sure you know which test to use to answer different questions about a data set:
One or two categorical variables?Two or more continuous variables?One or more categorical variable and one continuous variable?Also, refer to flow chart from lecture.When to use repeated measures vs. between groups ANOVA?When to use one, two, or paired samples t-tests?