wp&c — portfolio optimization offering introduction
TRANSCRIPT

Wilson Perumal & Company, Inc.
PORTFOLIO OPTIMIZATIONREFOCUSING ON THE CORE FOR PROFIT AND GROWTH

Wilson Perumal & Company, Inc.
Executive Summary
• Portfolio optimization can unlock significant financial benefits for companies: typicaloutcomes are 10-30% increases in EBITDA and 10-25% reductions in Working Capital
‒ Companies often see additional benefits in service level improvements and growth rates
• While many companies recognize their complexity issues, portfolio optimizationremains an under-used lever for value creation in most companies
‒ Many companies recognize the issue, yet are unable to quantify the business case, and lack the experience to execute successfully, or;
‒ Efforts focus on “Cutting the tail,” and lack a holistic approach that unlocks bigger benefits
• Wilson Perumal & Company is a leading management consulting firm with deepexpertise in portfolio optimization – we can guide you through this process
‒ Starting with the business case, we bring analytical rigor, cycles of experience and unique methodology to achieve your portfolio optimization goals
‒ Methodologies include: Square Root Costing, our approach to quantify true SKU-level profitability (Square Root Costing) and our 5-facet approach, to ensure a holistic view
• Our approach starts by understanding SKU- and customer-level profitability, specificvalue levers, and perceived barriers, to quickly align the organization
‒ A typical Phase 1 lasts about 5 weeks, quantifies the business case and specific portfolio levers for value creation, followed by a Phase 2, for execution and value capture
2
Wilson Perumal & Company, Inc.
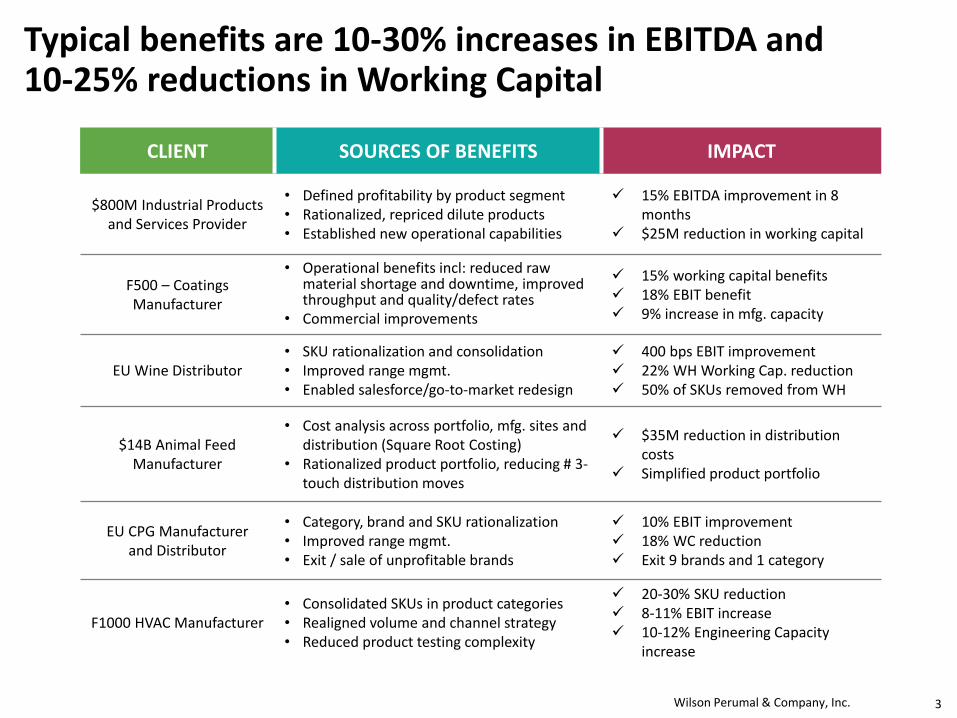
Typical benefits are 10-30% increases in EBITDA and 10-25% reductions in Working Capital
3
CLIENT SOURCES OF BENEFITS IMPACT
$800M Industrial Products and Services Provider
• Defined profitability by product segment• Rationalized, repriced dilute products• Established new operational capabilities
✓ 15% EBITDA improvement in 8months
✓ $25M reduction in working capital
F500 – Coatings Manufacturer
• Operational benefits incl: reduced rawmaterial shortage and downtime, improvedthroughput and quality/defect rates
• Commercial improvements
✓ 15% working capital benefits✓ 18% EBIT benefit✓ 9% increase in mfg. capacity
EU Wine Distributor• SKU rationalization and consolidation• Improved range mgmt.• Enabled salesforce/go-to-market redesign
✓ 400 bps EBIT improvement✓ 22% WH Working Cap. reduction✓ 50% of SKUs removed from WH
$14B Animal Feed Manufacturer
• Cost analysis across portfolio, mfg. sites anddistribution (Square Root Costing)
• Rationalized product portfolio, reducing # 3-touch distribution moves
✓ $35M reduction in distributioncosts
✓ Simplified product portfolio
EU CPG Manufacturer and Distributor
• Category, brand and SKU rationalization• Improved range mgmt.• Exit / sale of unprofitable brands
✓ 10% EBIT improvement✓ 18% WC reduction✓ Exit 9 brands and 1 category
F1000 HVAC Manufacturer• Consolidated SKUs in product categories• Realigned volume and channel strategy• Reduced product testing complexity
✓ 20-30% SKU reduction✓ 8-11% EBIT increase✓ 10-12% Engineering Capacity
increase

Wilson Perumal & Company, Inc.
Wilson Perumal & Company at a glance
4
• Focused on complexity, helping clients compete in a complex world
• Boutique, strategy & ops consulting firm with ~40 full-time consultants
• Founded 2009 by Stephen Wilson and Andrei Perumal
• Value & results oriented: focus on profit, growth and working capitaloutcomes
• Publications: 2 books published by McGraw-Hill and significant work withThe Wall Street Journal
• Our clients are leading corporations and private equity firms
• Consistently recognized (e.g., 2019 Best Small Strategy Firm to Work For)
Wilson Perumal & Company, Inc.
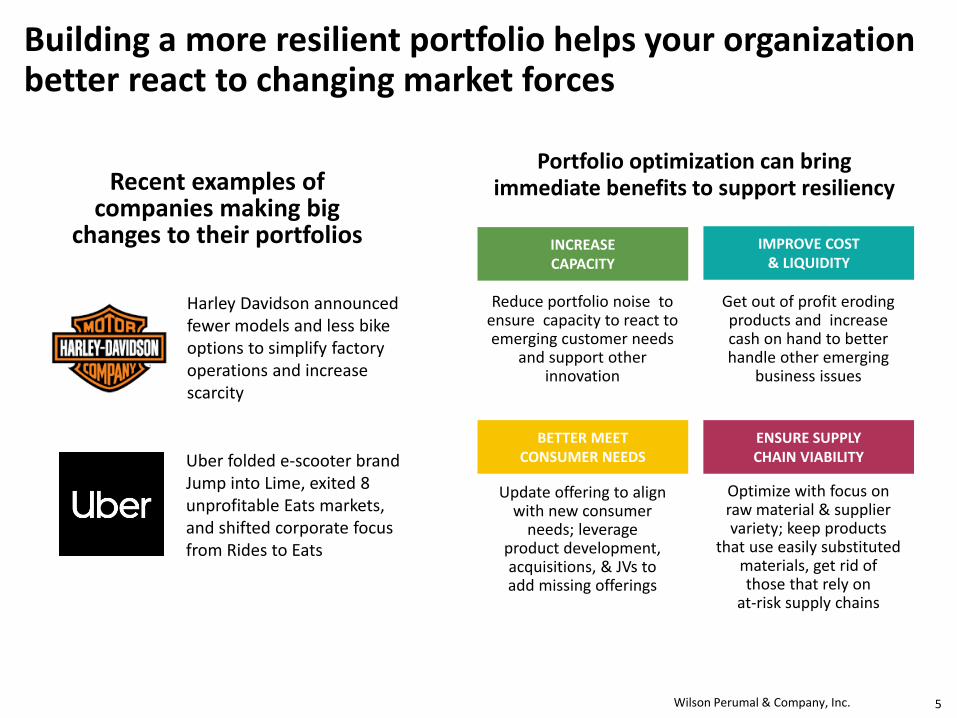
Building a more resilient portfolio helps your organization better react to changing market forces
5
INCREASE CAPACITY
IMPROVE COST & LIQUIDITY
Get out of profit eroding products and increase cash on hand to better handle other emerging
business issues
Reduce portfolio noise to ensure capacity to react to emerging customer needs
and support other innovation
ENSURE SUPPLY CHAIN VIABILITY
Optimize with focus on raw material & supplier variety; keep products
that use easily substituted materials, get rid of those that rely on
at-risk supply chains
BETTER MEET CONSUMER NEEDS
Update offering to align with new consumer
needs; leverage product development, acquisitions, & JVs to add missing offerings
Recent examples of companies making big
changes to their portfolios
Uber folded e-scooter brand Jump into Lime, exited 8 unprofitable Eats markets, and shifted corporate focus from Rides to Eats
Harley Davidson announced fewer models and less bike options to simplify factory operations and increase scarcity
Portfolio optimization can bring immediate benefits to support resiliency
Wilson Perumal & Company, Inc.
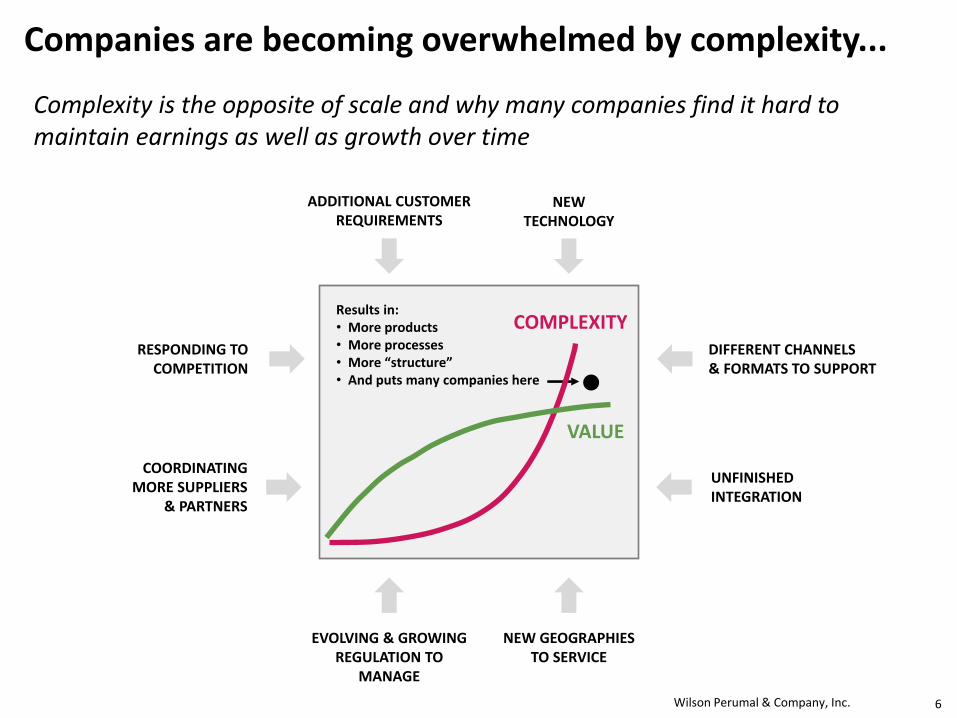
Companies are becoming overwhelmed by complexity...
66
Complexity is the opposite of scale and why many companies find it hard to maintain earnings as well as growth over time
ADDITIONAL CUSTOMER REQUIREMENTS
NEW TECHNOLOGY
DIFFERENT CHANNELS & FORMATS TO SUPPORT
UNFINISHED INTEGRATION
NEW GEOGRAPHIES TO SERVICE
EVOLVING & GROWING REGULATION TO
MANAGE
COORDINATING MORE SUPPLIERS
& PARTNERS
RESPONDING TO COMPETITION
COMPLEXITY
VALUE
Results in:• More products• More processes• More “structure”• And puts many companies here

Wilson Perumal & Company, Inc.
…Which often starts with product proliferation, as companies seek to drive growth
7
Organization
Where
complexity
arises
Organization
Where
complexity
hides
Organization
Where
complexity
takes root
• Lots of activity, but not much outcome• High cost of IT and complex systems• Long decision-making cycles• Too much SG&A ($, people)• Low levels of process automation• Too many locations, offices, facilities
• Hard to maintain shelf availability• Many “exceptions” in processes• Pricing inconsistency• Assortment shortages/surpluses• Customer confusion/ordering mistakes• High # of suppliers
• Inability to leverage scale or technology• Multiple faces to the customer• Difficulty executing change projects• Requirement for specialized sales/support• Poor space utilization, need for extra space
Product-Process
Process-Organization
Organization-Product
Where Complexity Hides
Where Complexity Takes Root
Where Complexity Arises
SYMPTOMSINTERACTION THE COMPLEXITY CUBE
Wilson Perumal & Company, Inc.
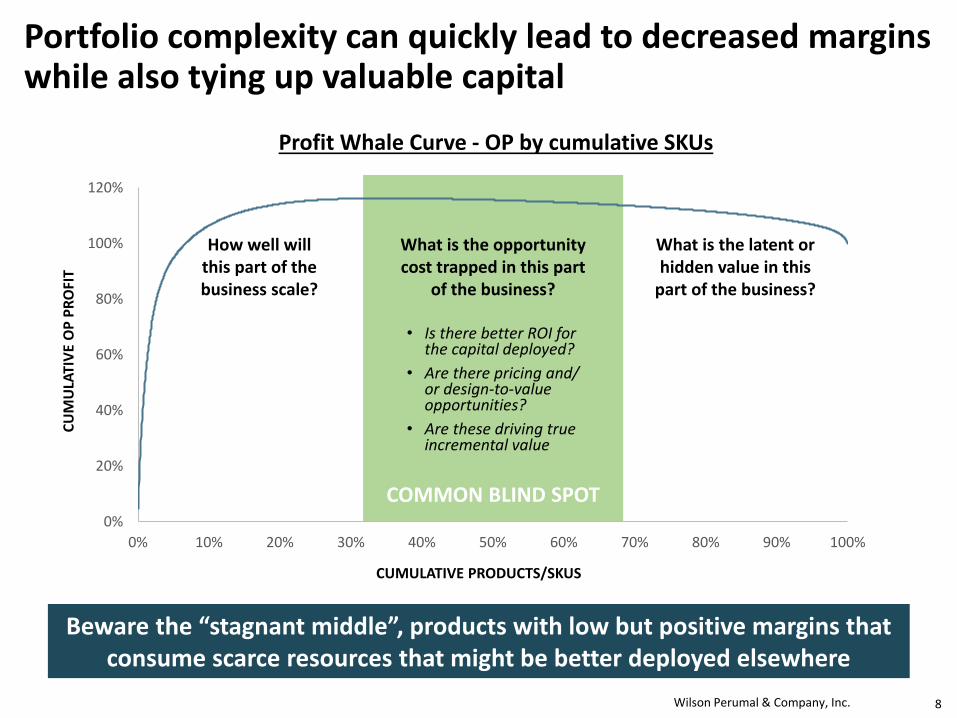
Portfolio complexity can quickly lead to decreased margins while also tying up valuable capital
8
0%
20%
40%
60%
80%
100%
120%
0% 10% 20% 30% 40% 50% 60% 70% 80% 90% 100%
CU
MU
LATI
VE
OP
PR
OFI
T
CUMULATIVE PRODUCTS/SKUS
How well will this part of the business scale?
What is the latent or hidden value in this
part of the business?
COMMON BLIND SPOT
What is the opportunity cost trapped in this part
of the business?
• Is there better ROI forthe capital deployed?
• Are there pricing and/or design-to-valueopportunities?
• Are these driving trueincremental value
Beware the “stagnant middle”, products with low but positive margins that consume scarce resources that might be better deployed elsewhere
Profit Whale Curve - OP by cumulative SKUs
Wilson Perumal & Company, Inc.
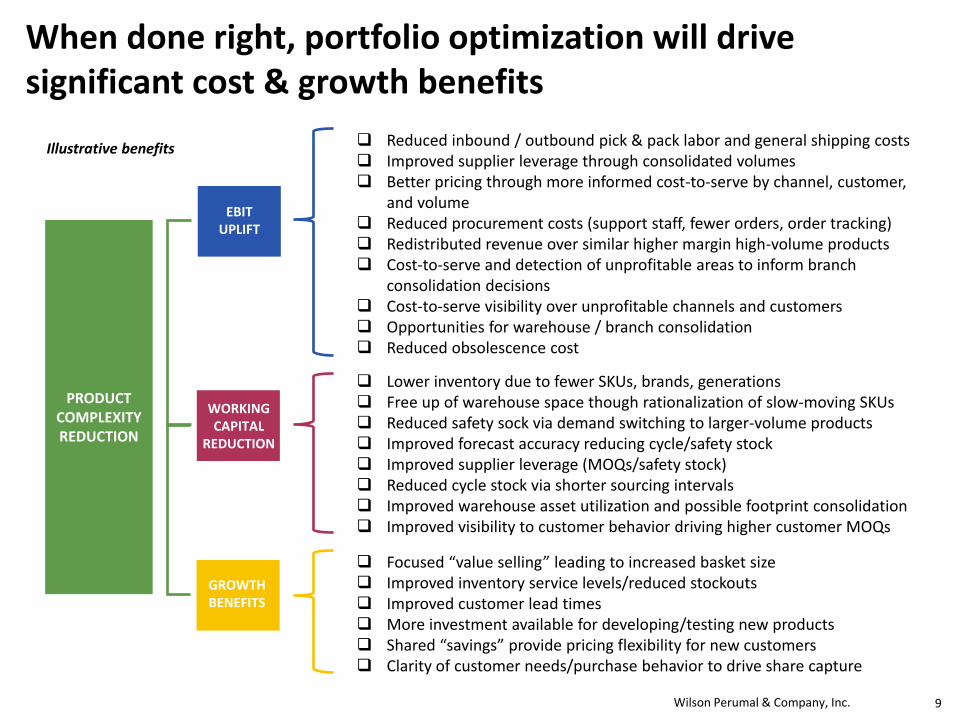
❑ Lower inventory due to fewer SKUs, brands, generations❑ Free up of warehouse space though rationalization of slow-moving SKUs❑ Reduced safety sock via demand switching to larger-volume products❑ Improved forecast accuracy reducing cycle/safety stock❑ Improved supplier leverage (MOQs/safety stock)❑ Reduced cycle stock via shorter sourcing intervals❑ Improved warehouse asset utilization and possible footprint consolidation❑ Improved visibility to customer behavior driving higher customer MOQs
❑ Reduced inbound / outbound pick & pack labor and general shipping costs❑ Improved supplier leverage through consolidated volumes❑ Better pricing through more informed cost-to-serve by channel, customer,
and volume❑ Reduced procurement costs (support staff, fewer orders, order tracking)❑ Redistributed revenue over similar higher margin high-volume products❑ Cost-to-serve and detection of unprofitable areas to inform branch
consolidation decisions❑ Cost-to-serve visibility over unprofitable channels and customers❑ Opportunities for warehouse / branch consolidation❑ Reduced obsolescence cost
When done right, portfolio optimization will drive significant cost & growth benefits
PRODUCTCOMPLEXITY REDUCTION
EBIT UPLIFT
WORKING CAPITAL
REDUCTION
GROWTH BENEFITS
❑ Focused “value selling” leading to increased basket size❑ Improved inventory service levels/reduced stockouts❑ Improved customer lead times❑ More investment available for developing/testing new products ❑ Shared “savings” provide pricing flexibility for new customers❑ Clarity of customer needs/purchase behavior to drive share capture
Illustrative benefits
9

Wilson Perumal & Company, Inc.
Focus on incremental revenue & substitutability helps to determine true incremental value and minimizes revenue risk
Cycles of experience, best practices, and industry-leading methodologies including a focus on integrating PLM and sustainment
Holistic review of the portfolio (using the 5 Facet Approach) to understand the cost vs. benefit of a product across the value chain
What makes our portfolio optimization approach different?
10
Deeper view of profitability, at the operating profit level by SKU, that accounts for the cost of complexity (using Square Root Costing)
Too often companies tackle portfolio optimization with a singular focus. Our approach avoids this by applying:
2
3
4
5
Balanced approach focusing not just on analysis, but also on practical implementation 1
Wilson Perumal & Company, Inc. 11
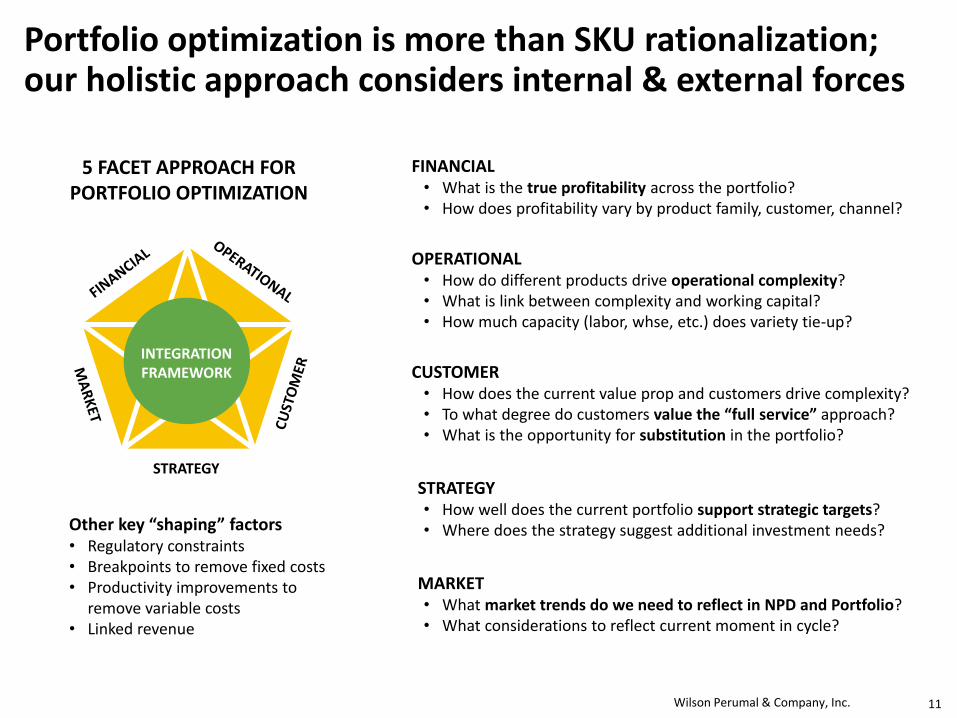
5 FACET APPROACH FOR PORTFOLIO OPTIMIZATION
FINANCIAL• What is the true profitability across the portfolio?• How does profitability vary by product family, customer, channel?
OPERATIONAL• How do different products drive operational complexity? • What is link between complexity and working capital?• How much capacity (labor, whse, etc.) does variety tie-up?
CUSTOMER• How does the current value prop and customers drive complexity?• To what degree do customers value the “full service” approach?• What is the opportunity for substitution in the portfolio?
STRATEGY• How well does the current portfolio support strategic targets?• Where does the strategy suggest additional investment needs?
MARKET• What market trends do we need to reflect in NPD and Portfolio?• What considerations to reflect current moment in cycle?
Other key “shaping” factors• Regulatory constraints• Breakpoints to remove fixed costs• Productivity improvements to
remove variable costs• Linked revenue
Portfolio optimization is more than SKU rationalization; our holistic approach considers internal & external forces
INTEGRATION FRAMEWORK
STRATEGY
Wilson Perumal & Company, Inc.
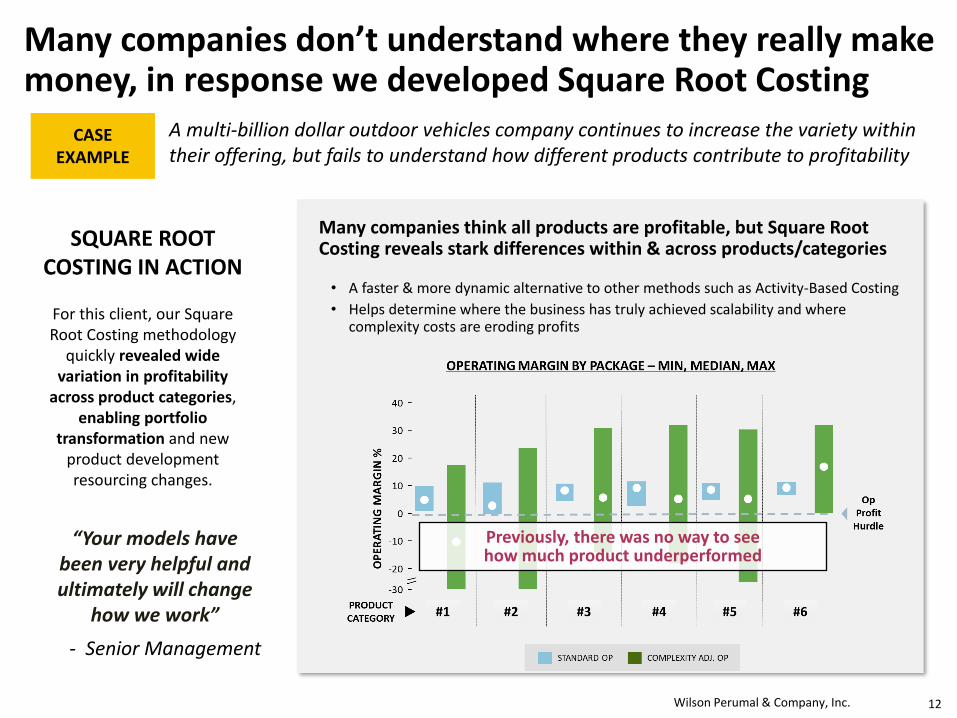
Many companies don’t understand where they really make money, in response we developed Square Root Costing
12
SQUARE ROOT COSTING IN ACTION
For this client, our Square Root Costing methodology
quickly revealed wide variation in profitability
across product categories, enabling portfolio
transformation and new product development resourcing changes.
“Your models have been very helpful and ultimately will change
how we work”
- Senior Management
Many companies think all products are profitable, but Square Root Costing reveals stark differences within & across products/categories
• A faster & more dynamic alternative to other methods such as Activity-Based Costing
• Helps determine where the business has truly achieved scalability and where complexity costs are eroding profits
A multi-billion dollar outdoor vehicles company continues to increase the variety within their offering, but fails to understand how different products contribute to profitability
CASE EXAMPLE
Previously, there was no way to see how much product underperformed
Wilson Perumal & Company, Inc.
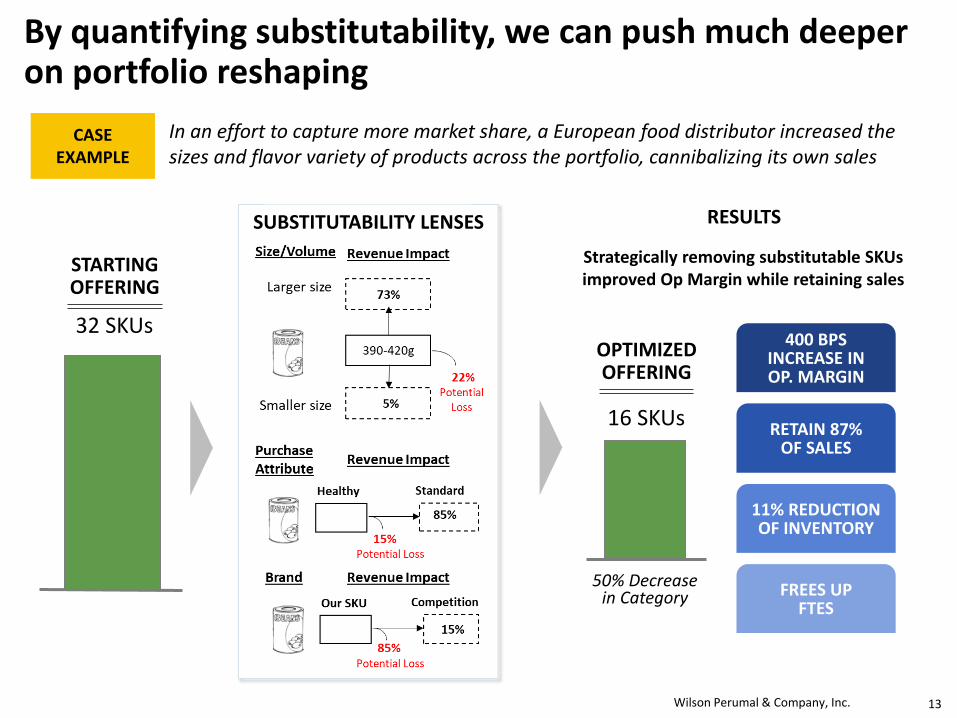
By quantifying substitutability, we can push much deeper on portfolio reshaping
13
32 SKUs
16 SKUs
STARTING OFFERING
OPTIMIZED OFFERING
400 BPS INCREASE IN OP. MARGIN
11% REDUCTION OF INVENTORY
FREES UPFTES
RETAIN 87% OF SALES
RESULTS
50% Decrease in Category
Strategically removing substitutable SKUs improved Op Margin while retaining sales
In an effort to capture more market share, a European food distributor increased the sizes and flavor variety of products across the portfolio, cannibalizing its own sales
CASE EXAMPLE
SUBSTITUTABILITY LENSES

Wilson Perumal & Company, Inc.
-45%
-35%
-25%
-15%
-5%
5%
15%
25%
0 5,000 10,000 15,000 20,000 25,000 30,000 35,000
In today’s environment, where do you invest, assess, or divest for maximum revenue recovery?
14
How Has Product Profitability Changed?
• Profit scaling curves help firms understand the true profitability of products/SKUs now and potential for scaled growth
• The crisis has moved all products down their respective profit curves reducing firm’s profitability and scale
What does recovery look like?
• While this may be temporary, it is important to rethink portfolio size and shape in the new world
‒ Which products do you want to invest in for the future?
‒ Which products should be end of life?
‒ Have customer behaviors shifted permanently?
‒ How has competition changed?
Complexity-Adjusted Profit Scaling Curves
Pro
ject
ed
Op
era
tin
g M
argi
n
Pdt D – Change Cost Structure/ EliminateD’s will never be profitable with the current cost structure
Pdt B – InvestB’s steep slope means quick margin recovery
Pdt A – InvestIncreasing sales restores A’s margin; position on the slope means slow recovery
COVID Sales Decline
$K Revenue
Pdt C – SustainC’s margins remain flat with sales decline
A
B
C
D
Pre-COVID Position
Post-COVID Position

Wilson Perumal & Company, Inc.
2
Optimization starts by understanding profitability, value, and strategic alignment (product, customer segments)
15
WEEK 1 WEEK 2 WEEK 3 WEEK 4 WEEK 5 MONTH 1 MONTH 2 MONTH 3
Rapid 5-week assessment of profitability & opportunities within products and channels
Short, mid, and longer-term opportunity realization, definition, and planning over 1-3 months
PORTFOLIO & CATEGORY REVIEW
CHANNEL & CUSTOMER REVIEW
PRODUCT & CUSTOMER PROFITABILITY ASSESSMENT
EXECUTENo-Regret/Quick Win
Opportunities
EXECUTE
Mid-Term Opportunities
NEXT-LEVEL DEFINITION
IMPLEMENTATION
INTERNAL ALIGNMENT
DEFINITIONLong-term/Structural/
Transformational Opportunities
EXECUTE
OPPORTUNITY DEFINITION
EXECUTE EXECUTE EXECUTE
…
…
An Initial 5-week assessment quantifies the business case, uncovers true service/product profitability, and builds a list of actionable opportunities
1
Wilson Perumal & Company, Inc.
CONTACT [email protected]
RESOURCES
Vantage Point: Square Root Costing Uncover your True Profit Generators Spotlight: Profit Scaling Curves
CASE STUDIES
Cost Reduction for a Consumer Durables Co. Portfolio Optimization at a European Food Co. Battling Proliferation at Industrial Equipment Co.