worst case housing needs - hud user · worst case housing needs 2017 report to congress preface...
TRANSCRIPT

WORST CASE HOUSING NEEDS2017 REPORT TO CONGRESS
U.S. Department of Housing and Urban Development | Office of Policy Development and Research

Visit PD&R’s website
huduser.govto find this report and others sponsored by HUD’s Office of Policy Development and Research (PD&R).
Other services of HUD User, PD&R’s research information service, include listservs, special interest
reports, bimonthly publications (best practices, significant studies from other sources), access to public
use databases, and a hotline (800-245-2691) for help accessing the information you need.

WORST CASE HOUSING NEEDS2017 REPORT TO CONGRESS
Prepared forU.S. Department of Housing and Urban DevelopmentOffice of Policy Development and Research
Prepared byNicole Elsasser WatsonBarry L. SteffenMarge MartinDavid A. Vandenbroucke
August 2017


WORST CASE HOUSING NEEDS 2017 REPORT TO CONGRESS
PREFACE
PREFACE The U.S. Department of Housing and Urban Development (HUD) is pleased to transmit to the U.S. Congress this 2017 report on Worst Case Housing Needs. This report—the 16th in a longstanding series—provides national data and analysis of the critical problems facing low-income renting families. The report draws on data from the American Housing Survey (AHS), which is funded by HUD and conducted by the U.S. Census Bureau. The AHS has been conducted every 2 years since 1973 and debuted a major redesign in 2015 that included a new national and metropolitan area longitudinal sample. The AHS is a key source of national data on housing markets, conditions, and dynamics.
Despite continued signs of a strengthening national economy, the report finds that severe housing problems are on the rise. In 2015, 8.30 million households had worst case needs, up from 7.72 million in 2013 and approaching the record high of 8.48 million in 2011. These households are defined as very low-income renters who do not receive government housing assistance and who paid more than one-half of their income for rent, lived in severely inadequate conditions, or both. High rents in proportion to renter incomes remain dominant among households with worst case needs, leaving these renters with substantial, unmet need for affordable housing.
The modest reduction in worst case needs observed in 2013 was not sustained and worst case needs continued their upward trend. Specifically, severe housing problems have grown 41 percent since the beginning of the Great Recession in 2007 and 66 percent since 2001. Worst case needs continue to affect all subgroups, whether defined by race and ethnicity, household structure, or location within metropolitan areas or regions.
Contributing most to the increase in worst case needs between 2013 and 2015 was a notable shift from homeownership to renting. The magnitude of this sustained postrecession trend, along with other demographic factors, increased the number of very low-income renters and thereby played a major role in growing worst case needs between 2013 and 2015. Modest gains in household incomes were met with rising rents, shrinking the supply of affordable rental housing stock in an increasingly competitive market. Even with the supply of more expensive units growing, higher-income renters occupy a growing share—43 percent—of the most affordable units. Only 62 affordable units are available per 100 very low-income renters, and only 38 units are available per 100 extremely low-income renters.
This report also uses new AHS enhancements to explore the variation in worst case needs and the distribution of housing assistance across a greater variety of market geographies. These data show that, although 43.2 percent of very low-income renters had worst case needs nationally, local markets reflect a substantial degree of variation beyond the longstanding trends observed across regions and types of metropolitan locations.


vWORST CASE HOUSING NEEDS 2017 REPORT TO CONGRESS
CONTENTS WORST CASE HOUSING NEEDS2017 REPORT TO CONGRESS Executive Summary ������������������������������������������������������������������������������������������� ix
Section 1� Extent and Nature of Worst Case Needs �������������������������������������� 1
Extent of Worst Case Needs in 2015 .................................................................. 1
Inadequate Housing and Inadequate Income .................................................. 3
Prevalence of Worst Case Needs by Income .................................................. 4
Increase in Worst Case Needs ........................................................................ 4
Demographics of Worst Case Needs ................................................................. 4
Worst Case Needs by Race and Ethnicity ....................................................... 5
Worst Case Needs by Household Type ........................................................... 5
Summary ............................................................................................................ 7
Section 2� Shortage of Affordable Housing ���������������������������������������������������� 9
Geography of Worst Case Needs ....................................................................... 9
Worst Case Needs and Housing Assistance by Region and Metropolitan Location .............................................................................. 10
Variation in Worst Case Needs Across Local Markets ................................... 11
Factors Limiting Access to Affordable Rental Housing ..................................... 13
How the Market Allocates Affordable Housing on a National Basis ............... 13
Affordability, Availability, and Adequacy of the National Rental Stock ............ 14
Rental Stock by Income ................................................................................ 15
Geography of Supply ........................................................................................ 16
Rental Stock by Region ................................................................................. 16
Summary .......................................................................................................... 17
CONTENTS

vi WORST CASE HOUSING NEEDS 2017 REPORT TO CONGRESS
CONTENTS
Section 3� Understanding the Trend in Worst Case Needs������������������������� 19
Changes in Affordable Housing Demand .......................................................... 19
Affordable Housing Supply and Demand .......................................................... 21
Concluding Summary ....................................................................................... 23
Appendix A� Detailed Data on Housing Problems and Supply of Affordable Housing ������������������������������������������������������������������������������������������25
Appendix B� Supplemental Exhibits ���������������������������������������������������������������65
Appendix C� Federal Housing Assistance and Affordable Housing Programs ����������������������������������������������������������������������������������������������������������� 67
Appendix D� Previous Reports to Congress on Worst Case Needs ����������69
Appendix E� Data and Methodology �������������������������������������������������������������� 71
Literature Cited ������������������������������������������������������������������������������������������������� 77

viiWORST CASE HOUSING NEEDS 2017 REPORT TO CONGRESS

viii WORST CASE HOUSING NEEDS 2017 REPORT TO CONGRESS

ixWORST CASE HOUSING NEEDS 2017 REPORT TO CONGRESS
EXECUTIVE SUMMARY
EXECUTIVE SUMMARY
WORST CASE HOUSING NEEDS2017 REPORT TO CONGRESS During the 2013-to-2015 period, worst case needs for housing assistance persisted at high levels across demographic groups, household types, and regions. Worst case needs are defined as renters with very low incomes—no more than 50 percent of the Area Median Income (AMI)—who do not receive government housing assistance and who pay more than one-half of their income for rent, live in severely inadequate conditions, or both. Worst Case Housing Needs: 2017 Report to Congress examines the causes of and trends in worst case needs, using the most recent data from the American Housing Survey (AHS).1
Substantial unmet needs for affordable rental housing remain even as incomes are improving. The unmet need for decent, safe, and affordable rental housing continues to outpace the ability of federal, state, and local governments to supply housing assistance and facilitate affordable housing production.
1 This Executive Summary and report are based on the U.S. Census Bureau’s March 2017 release of the 2015 AHS. Estimates may differ slightly from those of the Preview of 2015 Worst Case Housing Needs published in January 2017 using preliminary AHS data.

x WORST CASE HOUSING NEEDS 2017 REPORT TO CONGRESS
Worst Case Needs Have IncreasedThe number of renter households with worst case needs increased to 8.3 million in 2015, up from 7.7 million in 2013 and slightly less than the record high of 8.5 million in 2011 (see exhibit ES-1). The number of worst case needs in 2015 was 8 percent higher than in 2013, offsetting much of the 9-percent decrease observed during the 2011-to-2013 period and marking a 10-year growth rate of 39 percent.
The likelihood that a very low-income renter household had worst case needs increased from 42 percent in 2013 to 43 percent in 2015, approaching the record rate of 44 percent observed in 2011. The increase in worst case needs between 2013 and 2015 reflects both a larger population of susceptible very low-income renters and a higher prevalence of severe housing problems among that population. The data suggest that the nation’s ongoing economic recovery is continuing to have some beneficial effects on the incomes of very low-income renters, but growing competition for a limited supply of affordable units, a rising population of renter households and a declining population of homeowners, a widening rental assistance gap, and rising rents continue to drive severe housing problems among this vulnerable population.
Worst Case Needs Increased Across All Demographic Groups and Household TypesThe absolute number of households with worst case needs increased across all racial and ethnic groups. The prevalence of worst case needs during 2015 was 47 percent for Hispanic renters, 45 percent for non-Hispanic White renters, 37 percent for non-Hispanic Black renters, and 41 percent for others. The share of very low-income renters experiencing worst case needs increased between 2013 and 2015 for non-Hispanic White, non-Hispanic Black, and Hispanic renters but not for others.
Worst case needs also increased among all types of households. In 2015, 2.9 million families with children, 1.9 million elderly households without children, 2.8 million “other nonfamily” households (mostly single individuals), and 0.8 million “other family” households experienced worst case needs.
The proportion of very low-income renters with worst case needs also increased among all household types in 2015, ranging somewhat narrowly from a high of 47 percent for other nonfamily and other family households to 42 percent for families with children and 40 percent for elderly households without children.
About one in six renter households with worst case needs—17 percent—included a nonelderly person with
disabilities. These 1.4 million households remain 6 percent above the 2011 estimate.
Worst Case Needs Result From a Shortage of Affordable Rental HousingMost cases of worst case needs are caused by severe rent burdens—paying more than one-half of income for rent. Inadequate housing caused only 2 percent of worst case needs.
An increase by 700,000 in the number of very low-income renters who lack housing assistance—the group at risk of experiencing worst case needs—explains about 402,000 of the 582,000 new cases of worst case needs between 2013 and 2015. Four demographic factors, shown in the first four columns of exhibit ES-2, affected the size of this at-risk group. Contributing most to the increase in worst case needs was a notable shift from homeownership to renting, which surpassed even the marked tenure shift trends observed during the recessionary period. Also contributing to the increase in worst case needs were a modest level of household formation and a widening gap in rental assistance relative to need. A fourth factor, renter income increases, raised some renters out of the very low-income population, partially offsetting other demographic factors that increased worst case needs in 2015.
Although these demographic factors created a substantial net increase in demand for affordable rental units by a growing population of unassisted very low-income renters, inadequate market responses to the increased demand account for an
EXECUTIVE SUMMARY

xiWORST CASE HOUSING NEEDS 2017 REPORT TO CONGRESS
additional 180,000 cases of worst case needs, as shown in the fifth column of exhibit ES-2. This market-driven increase in worst case needs resulted from increased competition for a shrinking supply of affordable rental units.
If the supply of rental units were unchanged, greater demand would increase competition for affordable units, drive up rents, and increase prevalence of worst case needs. Although the total supply of rental units—including conversions of owner-occupied properties to rentals—increased by nearly 4.7 million, or more than 10 percent, between 2013 and 2015, renter households expanded by 3.6 million, or 9 percent. As a result, new renters absorbed much of the net increase of rental units, keeping overall rental vacancy rates under 10 percent. Among units affordable to renters with extremely low incomes (0 to 30 percent of AMI), the rental market was much tighter, with a vacancy rate of less than 4 percent.
For a growing population of very low-income renters, the expanding supply of rental units in 2015 failed to translate into increased availability of affordable housing (see exhibit ES-3). Unlike more expensive units, the stock of rental housing affordable to very low-income renters shrank between 2013 and 2015, and vacancy rates remained highest among the most expensive units. For renters with extremely low incomes, the ratio of affordable and available units decreased by 1 from 2013 levels to 38 units per 100 renters. For very low-income renters, the availability ratio decreased by 3, to 62 units per 100 renters.
This uneven pattern in supply growth was mimicked in renter income changes, with incomes growing more sharply
for renters overall than for poorer renters. Further, median monthly housing costs for renters increased by nearly 9 percent, a notable jump from costs that had remained relatively flat between 2011 and 2013. For the poorest renters, growing housing costs outpaced income gains, failing to relax typical housing cost burdens for those most vulnerable to worst case needs.
Conclusion Worst case housing needs are a national problem. Such severe housing problems have expanded dramatically during the past decade and were exacerbated by the economic recession and associated collapse of the housing market, which reduced homeownership through foreclosures and tight lending and increased demand for renting. The slight improvements observed since 2011 offer cause for hope, but the failure to sustain the more promising trends observed in 2013 is sobering. Recognizing that AHS sampling and design changes in 2015 increase opportunities for spurious conclusions, the latest resumption of worsening housing problems among the nation’s very low-income renters is attributable primarily to demographic and economic factors—especially a notable shift from homeownership to renting—that grew the number of households susceptible to worst case needs. Uneven housing market responses that increased the proportion of unassisted very low-income renters with severe rent burdens played a secondary yet substantial role.
Even with rental assistance, 6 of 10 extremely low-income renters and 4 of 10 very low-income renters do not have access to affordable and available housing units. Among very low-income renters in 2015, only 25 percent of households had rental assistance and an additional 43 percent had worst case needs for assisted or other affordable housing. In other words, only a small share of very low-income renters—32 percent—avoided severe housing problems in the unassisted private rental market in 2015. A broad strategy at the federal, state, and local levels is needed to continue to rebuild the economy, strengthen and realign markets, and provide assistance to those families most in need.
EXECUTIVE SUMMARY

xii WORST CASE HOUSING NEEDS 2017 REPORT TO CONGRESS

1WORST CASE HOUSING NEEDS 2017 REPORT TO CONGRESS
SECTION 1. EXTENT AND NATURE OF WORST CASE NEEDS
Section 1Extent and Nature of Worst Case NeedsThe U.S. Department of Housing and Urban Development (HUD) is the largest federal provider of affordable rental housing. In response to a request by Congress in 1991, HUD’s Office of Policy Development and Research (PD&R) periodically reports on the severity of worst case needs for affordable rental housing, as collected in the biennial American Housing Survey (AHS). This report is the 16th in the series of core reports.2
Extent of Worst Case Needs in 2015HUD examined the 2015 AHS data to understand the evolving dimensions of a persistently expanding shortage of decent and affordable rental housing for lower-income households. The basic facts presented and examined in the following pages are—
- In 2015, 8.30 million renters3 had worst case needs (see exhibit 1-1). These renters have very low incomes,4 lack housing assistance, and have either severe rent burdens or severely inadequate housing (or both).
2 PD&R supplements the core reports on worst case needs with periodic topical reports. For a list of previous titles, see appendix D.
3 That is, renter households.4 Very low income and extremely low income refer throughout this report to the income levels of
renters. Very low incomes are those incomes of no more than 50 percent of the Area Median Income (AMI), and extremely low incomes are those incomes of no more than 30 percent of AMI—typically below the poverty line. HUD programs use AMI based on local family incomes with adjustments for household size, more precisely known as HUD-adjusted area median family income, or HAMFI (see appendix E). Nationwide, median AMI was $66,700 in 2015. Median very low-income and extremely low-income levels were $28,400 and $17,050 per year, respectively. All these income levels are for a family of four. Thresholds defining extremely low-income and very low-income families can be much less than these national thresholds if they have fewer than four members or live in areas with lower median family incomes.

2 WORST CASE HOUSING NEEDS 2017 REPORT TO CONGRESS
- Between 2013 and 2015, the number of worst case needs increased by 7.5 percent following an 8.9-percent decrease observed during the 2011-to-2013 period. With this latest resumption of worsening housing problems, the number of worst case needs has increased by 40.6 percent since 2007, when the recession began, and by 65.6 percent since 2001.
- Consistent with long-term trends, the primary problem for worst case needs renters in 2015 was severe rent burden—insufficient tenant incomes relative to rents. Among all renter households, a 9.3-percent increase in median incomes between 2013 and 2015 was consumed, in part, by an 8.5-percent increase in median housing costs for renters. Severely inadequate housing accounted for only 1.8 percent of worst case needs.
- The most recent increase in worst case needs5 differed somewhat in cause and effect from the recession-driven increases observed from 2007 through 2011. During that period, the combination of mortgage foreclosures, widespread unemployment, and shrinking renter incomes resulted in historic increases in the number of very low-income renters with worst case needs: 2.57 million households or 43.5 percent. In contrast, post-recession gains in renter incomes played a mitigating role in the more modest 7.5-percent increase in worst case needs observed during the 2013-to-2015 period.
- In 2015, the United States had 19.24 million very low-income renters, a 4.0-percent increase from 2013 levels that reversed the 4.0-percent reduction seen in the 2011-to-2013 period. In 2015, 43.2 percent of very low-income renters and 51.6 percent of extremely low-income renters had worst case needs.
- Worst case needs also increased slightly as a proportion of U.S. households during the most recent 2-year period, from 6.7 percent in 2013 to 7.0 percent in 2015.
5 The Joint Center for Housing Studies of Harvard University reported that the American Community Survey (ACS) recorded a smaller decline in severely cost-burdened renters than the AHS between 2011 and 2013 and observed that the broader definition of occupancy used by the ACS generally records about 2 million more renter households, of which some are homeowners residing in seasonal rental units. See http://housingperspectives.blogspot.com/2016/06/are-renter-worst-case-housing-needs.html.
WHICH HOUSEHOLDS CAN HAVE WORST CASE NEEDS?
By definition, households that can have worst case needs are households that—
• Are renters.• Have very low incomes; that is, incomes of no
more than 50 percent of the Area Median Income (as adjusted for family size).
• Do not receive housing assistance.
PRIORITY PROBLEMS TRIGGER WORST CASE NEEDS
Two types of priority problems determine whether households have worst case needs.
1. Severe rent burden means a renter household is paying more than one-half of its income for gross rent (rent and utilities).
2. Severely inadequate housing refers to units having one or more serious physical problems related to heating, plumbing, and electrical systems or maintenance. (Problems are listed in appendix E.)
- Housing assistance prevents millions of renters from experiencing worst case needs, but the shortfall of housing assistance relative to need grew more severe between 2013 and 2015. In absolute terms, the number of assisted renters increased slightly, by 0.5 percent, but increasingly fell behind the growing need among very low-income renters. The share of very low-income renters receiving housing assistance fell by 0.8 points between 2013 and 2015.
- An important dimension of the affordable housing gap is that affordable units are not necessarily available to the renters who need them most; higher income renters occupy substantial shares of units that would be affordable to the lowest-income renters.
With these key facts in mind, section 1 explores the current extent and the demographic characteristics of worst case needs—which households have such needs and what are their situations.
SECTION 1. EXTENT AND NATURE OF WORST CASE NEEDS

3WORST CASE HOUSING NEEDS 2017 REPORT TO CONGRESS
WHAT IS A TYPICAL WORST CASE NEEDS HOUSEHOLD?
The typical renter with worst case housing needs6 is a family with two children, most often a minority family headed by either a single female or a married couple. The family resides in adequate or good-quality housing in a central city of a southern metropolitan area. Earnings are the family’s primary source of income, yet their low wages place them below the poverty line and in the extremely low-income category. Their rent plus utilities consume most, if not all, of their extremely low reported income, costing more than $1,000 per month on average. They meet other needs with food stamps from the Supplemental Nutrition Assistance Program, Medicaid, gifts from friends and relatives, and Earned Income Tax Credits.
Inadequate Housing and Inadequate Income
Of the two types of priority problems that make up worst case needs, severe rent burden is, by far, the more frequent problem. As exhibit 1-2 illustrates, 98.2 percent of all worst case needs renters, or 8.15 million households, had severe rent burdens in 2015. Paying one-half of a limited total income for rent leaves very little income for other essentials, such as food, medical care, transportation expenses, education, and childcare.
Severely inadequate housing alone made up only 1.8 percent of worst case needs in 2015. A total of 4.4 percent of worst case renters (364,000) had severely inadequate housing, either alone or in combination with severe rent burdens.
That severely inadequate housing causes such a small fraction of worst case needs is the result of a decades-long trend of improvements to the nation’s housing stock. More stringent building codes prevent the construction of units without complete plumbing or heating systems, and obsolete units are demolished each year.7 In addition, a portion of severe physical inadequacies reported in the AHS likely results from or reflects maintenance or upgrade activity occurring in occupied units. Among all renters, 2.7 percent of those with very low incomes had severely inadequate housing in 2015, but so did 1.3 percent of renters with higher incomes.8 Nevertheless, the housing stock is continually aging, and severely inadequate units continue to pose threats to the life and health of thousands of renters.
6 See table A-7 for household characteristics of worst case needs renters. Table A-14 describes average income and housing cost characteristics. 7 Changes in the overall housing stock are primarily driven by new construction and losses due to demolition and natural disasters (Econometrica, 2016).8 Homeowners reported severely inadequate housing at even lower rates than renters—2.0 percent of very low-income homeowners and 0.7 percent of homeowners
with higher incomes had severely inadequate housing. See table A-1B.9 The AHS samples both occupied and vacant residential housing units but excludes places like group quarters or motels where homeless persons may be sheltered
(HUD-Census, 2017a: 3–5).
PROGRESS IN REDUCING HOMELESSNESS
Homeless individuals and families clearly have the greatest need for affordable or assisted housing. Homeless people, however, are not included in official estimates of worst case needs because the American Housing Survey (AHS) covers only housing units and the households that live in them, and persons experiencing homelessness, by definition, do not live in a housing unit and are not surveyed by the AHS.9
In the most recent Annual Homeless Assessment Report to Congress, HUD estimated that 550,000 sheltered and unsheltered homeless people were in the United States during a given night in January 2016. Most of these, 68 percent, were staying in residential programs for homeless people, and the remaining 32 percent were staying in unsheltered locations (HUD-CPD, 2016).
Homelessness declined 3 percent between 2015 and 2016 and has declined 15 percent since 2007. Chronic homelessness among individuals declined 35 percent between 2007 and 2016.
SECTION 1. EXTENT AND NATURE OF WORST CASE NEEDS

4 WORST CASE HOUSING NEEDS 2017 REPORT TO CONGRESS
Prevalence of Worst Case Needs by Income
Because most cases of worst case needs are triggered by severe rent burdens, the adequacy of household incomes relative to rents of available units is crucial. Among the 19.24 million very low-income renters in 2015, 43.2 percent had worst case needs (exhibit 1-3). The very low-income category includes extremely low-income renters, who had an even greater prevalence of worst case needs, 51.6 percent. Extremely low-income households constituted the majority (58.7 percent) of very low-income renters and represented an even larger share (70.1 percent) of households with worst case needs.
Exhibit 1-3� Extremely Low-Income Renters Were Most Vulnerable to Worst Case Needs in 2015
0–30% AMI
>30–50% AMI
Total
Number (thousands)
11,290 7,945 19,235
Number that are worst case needs renters (thousands)
5,821 2,482 8,303
Percent that are worst case needs renters
51.6 31.2 43.2
AMI = Area Median Income (HUD-adjusted) Source: HUD-PD&R tabulations of American Housing Survey data
Increase in Worst Case Needs
Although worst case needs declined by 754,000 during the 2011-to-2013 period, they then increased by 582,000 (7.5 percent) by 2015, offsetting much of the previous improvement. The increase in the most recent period contributes to the long-term trend of increasing worst case needs, including growth of 38.6 percent, or 2.31 million households, during the 10-year span of 2005 to 2015 (exhibit 1-4).
Exhibit 1-4� Growth in Worst Case Needs Among All U�S� Households
2005 2007 2009 2011 2013 2015
All households (millions)
108.90 110.72 111.86 115.08 116.03 118.29
Renters with worst case needs (millions)
5.99 5.91 7.10 8.48 7.72 8.30
Worst case needs as percent of all households
5.50 5.33 6.34 7.36 6.65 7.02
Source: HUD-PD&R tabulations of American Housing Survey data
Worst case needs also increased slightly as a proportion of U.S. households during the most recent 2-year period, from 6.7 percent in 2013 to 7.0 percent in 2015.
Because the problem of worst case needs is primarily one of a scarcity of units with affordable rents relative to the number of renters with very low incomes, the balance of section 1 examines the demographics of the renters who have these problems. Section 2 explores the dimensions of the inadequate supply of affordable rental units, and section 3 summarizes and integrates supply and demand issues to shed light on the root causes and shifting dimensions of this national problem.
Demographics of Worst Case NeedsWorst case needs are an economic reality for many of the nation’s very low-income renters. The severe housing problems that trigger worst case needs are widespread for such households, yet notable variations exist among subgroups of the population.
Exhibit 1-5 shows population subgroups defined either on the basis of race and ethnicity (green markers) or on the basis of household structure (blue markers). The position of the markers reflects each subgroup’s share of very low-income renters and the proportion of such renters experiencing worst case needs. As a share of very low-income renters, the subgroups span a range of 36.2 percentage points, but the prevalence of worst case needs varied by only 10.0 points across all subgroups.
SECTION 1. EXTENT AND NATURE OF WORST CASE NEEDS

5WORST CASE HOUSING NEEDS 2017 REPORT TO CONGRESS
The larger and more-afflicted subgroups appear in the right side of the exhibit and therefore account for the greatest numbers of worst case households. Although Hispanic households, like elderly and non-Hispanic Black households, represented roughly one-fourth of very low-income renters in 2015, Hispanics were more likely to experience worst case needs. Subgroups on the left side represent relatively few very low-income renters but, in the case of families without children, were overrepresented among those with worst case needs. The variations in prevalence among subgroups, although limited, may reflect different access to affordable or assisted units resulting from differences in geographic distribution and markets, household preferences, disabilities, or possibly housing discrimination.
Worst Case Needs by Race and Ethnicity
Worst case needs were found across all types of communities, racial groups, and ethnic lines. Both similarities and differences emerged when examining the three largest racial and ethnic groups—non-Hispanic White, non-Hispanic Black, and Hispanic.
During 2015, non-Hispanic White renters experienced the greatest share of worst case needs (45.5 percent) followed by Hispanic renters (25.3 percent), non-Hispanic Black renters (21.7 percent), and renters of other races and ethnicities (7.5 percent). Together, the three largest race and ethnicity groups accounted for 92.5 percent of worst case needs in 2015, and minority households accounted for 54.5 percent of worst case needs.
The share of worst case needs approximates the relative share of very low-income renters in each group, but not all groups are proportionally represented among those renters with worst case needs. During 2015, worst case needs affected 44.6 percent of non-Hispanic White renters with very low incomes, somewhat less than the proportion of Hispanic renters (47.4 percent). Prevalence was lower for non-Hispanic Black renters (37.4 percent), and other very low-income renters fell between, with 41.2 percent having worst case needs.
Exhibit 1-6 shows that all racial and ethnic groups experienced increases in worst case needs between 2013 and 2015. The 582,000 additional cases of worst case needs in 2015 reflected 259,000 additional Hispanic households, 160,000 additional non-Hispanic White households, 143,000 additional non-Hispanic Black households, and 20,000 additional households among other very low-income renters.
In addition to absolute increases in numbers, the shares of very low-income renters with worst case needs in the largest racial and ethnic groups increased between 2013 and 2015, by 0.6 points for non-Hispanic White renters, 1.9 points for non-Hispanic Black renters, and 3.3 points for Hispanic renters. Prevalence rates decreased marginally by 0.9 points for very low-income renters of other races and ethnicities (despite the small absolute increase in number).
Exhibit 1-6 also illustrates how population change affects the long-term growth of worst case needs. Between 2005 and 2015, worst case needs increased 38.6 percent overall but increased only 21.9 percent for the largest subgroup of very low-income renters, non-Hispanic White households. Worst case needs expanded much more rapidly during these 10 years among minority subgroups—80.1 percent among Hispanic households, 34.7 percent among non-Hispanic Black households, and 59.2 percent among renters of other races and ethnicities. Disproportionate increases in incidence of worst case needs among minority groups, however, are explained more by greater expansion of very low-income renter populations than by greater increases in the percentage of very low-income minority renters with worst case needs. Between 2013 and 2015, the population of very low-income minority renters grew more rapidly than the 3.1 percent growth observed among their non-Hispanic White counterparts, with increases of 3.2, 6.1, and 5.5 percent observed among non-Hispanic Black, Hispanic, and other minority renters, respectively.
Worst Case Needs by Household Type
The composition of different households reflects variations in their stage of life, income and resources, and housing needs. Exhibit 1-7 shows that families with children constituted the largest share of households experiencing worst case needs in 2015—34.8 percent—followed by other nonfamily households
SECTION 1. EXTENT AND NATURE OF WORST CASE NEEDS

6 WORST CASE HOUSING NEEDS 2017 REPORT TO CONGRESS
(single adults and roommates)10 with 33.2 percent, elderly households without children (hereafter, elderly households) with 22.3 percent, and other family households with 9.7 percent.
Families With Children� The number of families with children having worst case needs increased by 55,000 during the 2013-to-2015 period to 2.89 million—partially offsetting the 400,000 decrease observed in the previous 2 years. Worst case needs increased despite a reduction of 61,000 in the number of very low-income renters with children. The increase is explained primarily by an increase in the share of very low-income renters with children experiencing worst case needs by 1.2 points, to 41.5 percent, as the percentage reporting housing assistance decreased by 1.4 points, or 115,000 households, to 24.8 percent.
10 See appendix E for more on the composition of household types.11 Estimates of the number of rental households that reported receiving rental housing assistance are presented for various subgroups in the tables of appendix
A. AHS estimates of assisted very low-income renters in this report rely on self-reported data. HUD continues to assess the use of administrative data matching procedures, which may better identify HUD-assisted households and exclude households assisted through state or local programs. The aggregate numbers of households served by HUD’s primary rental assistance programs based on administrative records are outlined in appendix C.
12 HUD defines elderly households as those having a household head or spouse who is at least age 62 and including no children younger than age 18.13 Table A-6A reveals that 45.3 percent of other family households with very low incomes included a married couple, 56.4 percent had a female householder, and the
mean household size was 2.48 persons.14 Within HUD’s largest rental assistance program, the Housing Choice Voucher program (HCVP), the majority (69 percent) of households served are either families
with children or elderly. In addition to the fact that only one-fourth of eligible households receive assistance, the scarcity of HCVP resources is further evidenced by long waiting lists. On average, eligible households waited 2.5 years before receiving a voucher in 2016. Public housing authorities have the discretion to establish local preferences for choosing which families to assist based on local housing needs and priorities within this constrained resource environment. See appendix C for additional information on HUD’s rental assistance programs.
Without housing assistance, substantially more cases of worst case needs would occur. Among very low-income renters with children, 1.73 million reported having rental assistance in 2015 and, by definition, could not have worst case needs. Only one in four very low-income renters with children received housing assistance, which helps account for the fact that the greatest share of worst case needs occurred in such families.11
Elderly Households� During 2015, 1.85 million elderly12 renters had worst case needs, an increase of 382,000 since 2013. The proportion of elderly very low-income renters with worst case needs was 39.8 percent in 2015, less than the rate for families with children but representing a 2.6-point increase since 2013. Poor elderly households that rely on fixed incomes rather than wages may be less likely to benefit from economic recovery trends that raised incomes for others in recent years.
Other Family Households� After considering families with children and elderly households, other households can be divided into those that include multiple members of a given family and those that do not. Other family households include those such as married couples who are childless, one or more parents with adult children at home, adult siblings sharing an apartment, and householders boarding an elderly parent.13
Other family households constitute the smallest category in exhibit 1-7, contributing 805,000 worst case households in 2015. The rate of worst case needs among very low-income renters in this group was 46.6 percent, exceeding the prevalence for families with children and elderly households. The high rate of worst case needs among this group is also growing rapidly, increasing by 3.5 points between 2013 and 2015, more than for any other household type. Complex dynamics within this small diverse group are likely driving this growth. Families might find themselves in this category as a result of economic distress. Such might be the case among adult relatives who “double up” due to economic hardship when they would otherwise choose to live independently. Nonelderly families without children may also be less likely to be prioritized among households competing for scarce housing assistance resources.14
0
9,000
2005 2009 20132007 2011 2015
Source: HUD-PD&R tabulations of American Housing Survey data
Wor
st c
ase
need
s (th
ousa
nds)
Exhibit 1-7. Growth in Worst Case Needs Among All Household Types, 2005–2015
8,000
7,000
6,000
5,000
4,000
3,000
2,000
1,000
Other family
Elderly, no childrenFamilies with children
Other nonfamily
587
3,778
2,104
621
1,291
2,324
324
2,053
1,209
2,187
352
2,157
1,328
2,734
633
2,401
1,470
3,236
801
2,969
1,471
2,833
741
2,676
1,853
2,888
805
2,758
SECTION 1. EXTENT AND NATURE OF WORST CASE NEEDS

7WORST CASE HOUSING NEEDS 2017 REPORT TO CONGRESS
Other Nonfamily Households� About 5.90 million very low-income renters in 2015 were other nonfamily households, making this category the second largest after families with children. Unlike families with children, however, other nonfamily households increased in number from 2013 to 2015.
Worst case needs affected 2.76 million other nonfamily households in 2015, 82,000 more than in 2013. Worst case needs affect 46.8 percent of very low-income renters of this type, a 0.7-point increase since 2013 and still the highest rate among the four household categories. Most renters in this group are single individuals, and the rest are unrelated people sharing a housing unit.15
Trends by Household Type� Exhibit 1-7 also displays how the changing distribution of household types relates to the growth of worst case needs. Between 2005 and 2015, the number of worst case needs increased 38.6 percent. During this period, worst case needs increased among all household types. Worst case needs expanded at a slower-than-average pace of 24.3 percent among families with children and 34.3 percent among other nonfamily households. Worst case needs grew more rapidly among elderly households, 43.5 percent, and among other family households, 148.5 percent, although this rapidly growing subgroup remains the smallest.
Households Including People With Disabilities� Having worst case needs can be especially difficult for renter households that include people with disabilities. Disabilities can reduce employment options and create difficulties in finding suitable housing at reasonable cost.
Beginning with the 2009 AHS, respondents were asked directly whether household members have any of six types of disabilities, including four basic functional limitations—visual, hearing, cognitive, and ambulatory—and two types of difficulties with activities of daily living—self-care and independent living. Ambulatory limitations (walking or climbing stairs) are the most frequently occurring type of disability, affecting 49.2 percent of very low-income renter households that include a nonelderly person with a disability. Cognitive limitations (serious difficulties concentrating, remembering, or making decisions) are next in prevalence, affecting 46.3 percent of these households.16 People with disabilities are found among all four household types discussed previously. As exhibit 1-8 shows, 3.53 million very low-income renter households, or 18.4 percent, include nonelderly individuals17 reporting at least one of the six measures of disability. Of the 8.30 million renters with worst case needs in 2015, 1.39 million, or 16.7 percent, included one or more nonelderly people with disabilities. Worst case needs among such households increased by 28.0 percent from 1.09 million in 2013.
15 Among very low-income nonfamily renter households, 81.1 percent were one-person households in 2015. See table A-6A. The AHS does not include college students living in institutional housing, but it may include students sharing off-campus housing and other households in which individuals double up to share housing expenses.
16 The data about types of limitations are summarized in table A-15. Also see HUD-PD&R (2008).17 The analysis is limited to nonelderly people with disabilities, because many elderly people suffer from impairments and activity limitations as a consequence of aging.
Note, however, that nonelderly people with disabilities may be found in elderly households, as exhibit 1-8 demonstrates. Households headed by an elderly person with disabilities are not excluded if they also have a nonelderly person with disabilities.
DISABILITY AND ACCESSIBILITY IN THE AMERICAN HOUSING SURVEY
Since 2009, the American Housing Survey (AHS) has collected information about the following types of disabilities—
• Deafness or serious difficulty hearing.• Blindness or difficulty seeing, even when
wearing glasses.• Serious difficulty concentrating, remembering, or
making decisions because of a physical, mental, or emotional condition.
• Serious difficulty walking or climbing stairs.• Serious difficulty dressing or bathing.• Difficulty doing errands alone because of a
physical, mental, or emotional condition.
The 2015 AHS also included questions related to the wheelchair accessibility of housing units and home modifications made to accommodate individuals with physical disabilities. As in 2011, future AHS surveys may periodically include topical modules of questions related to housing accessibility features.
For further information, see demographics and accessibility sections of the AHS Codebook Interactive Tool (HUD-Census, 2017b).
The share of worst case needs among very low-income renter households having nonelderly people with disabilities was 39.4 percent in 2015, up from 38.7 percent in 2013. Prevalence ranged from 37.7 percent for other nonfamily households to 41.5 percent for families with children. The largest household categories, however, accounted for most cases of worst case needs affecting people with disabilities—of those affected, 38.7 percent are families with children and 44.2 percent are other nonfamily households.
Summary Worst case needs for affordable rental housing remain a serious national problem, having improved only slightly since reaching peak levels in 2011. Of the 19.24 million very low-income renters susceptible to severe rent burdens and severely inadequate housing in 2015, 8.30 million (43.2 percent) faced one or both problems without housing assistance. Between 2013 and 2015,
SECTION 1. EXTENT AND NATURE OF WORST CASE NEEDS

8 WORST CASE HOUSING NEEDS 2017 REPORT TO CONGRESS
SECTION 1. EXTENT AND NATURE OF WORST CASE NEEDS
Exhibit 1-8� Worst Case Needs Were Common Among Nonelderly People With Disabilities Across All Household Types in 2015
Families With Children
Elderly Households
Without ChildrenOther Family Households
Other Nonfamily Households Total
Very low-income renter households (thousands)
6,962 4,652 1,726 5,895 19,235
Worst case needs (thousands) 2,888 1,853 805 2,758 8,303
Percent with worst case needs 41.5 39.8 46.6 46.8 43.2
Percent having nonelderly people with disabilities
18.6 3.3 26.2 27.6 18.4
Very low-income renter households having nonelderly people with disabilities (thousands)
1,295 155 453 1,627 3,530
Worst case needs (thousands) 538 61 177 614 1,390
Percent with worst case needs 41.5 39.4 39.1 37.7 39.4
Source: HUD-PD&R tabulations of American Housing Survey data
the number of worst case needs increased by 7.5 percent, following an 8.9-percent decrease observed during the 2011-to-2013 period. With this latest resumption of worsening housing problems, the number of worst case needs has increased by 40.6 percent since 2007, when the recession began, and by 65.6 percent (3.29 million households) since 2001. The percentage of U.S. households with worst case needs was 7.0 percent in 2015 compared with 5.5 percent in 2005.
Severely inadequate housing continues to be a relatively minor cause of worst case needs. In 2015, severely inadequate housing alone triggered a mere 1.8 percent of worst case needs, whereas 98.2 percent of worst case needs households had severe rent burdens, including 2.6 percent that had both types of housing problems. Reflecting the importance of severe rent burdens as a cause of worst case needs, more than two out of three households with worst case needs (70.1 percent) had extremely low incomes during 2015.
Very low-income renters among all racial or ethnic groups and all household compositions examined experienced growth in worst case needs. Since 2005, worst case needs have expanded much more rapidly among minority very low-income renters compared to their non-Hispanic White counterparts. Ten-year growth rates of 80.1 percent among Hispanic renters, 34.7 percent among non-Hispanic Black renters, and 59.2 percent among renters of other races and ethnicities outpaced 21.9 percent growth among the largest group of very low-income renters, non-Hispanic White households.
Among very low-income renters, worst case needs affected 41.5 percent of families with children, 39.8 percent of elderly households, 46.6 percent of other family households, and 46.8
percent of other nonfamily households. Families with children account for the greatest share of worst case needs—34.8 percent—followed by other nonfamily households (typically one-person households) with 33.2 percent.
Worst case needs affected 39.4 percent of very low-income renters reporting nonelderly people with disabilities in 2015, slightly less than the 43.2 percent prevalence among very low-income renters overall. Households having nonelderly people with disabilities accounted for 16.7 percent of worst case needs.
Section 2 examines how the broad problem of worst case needs is caused by shortages of affordable housing and is mitigated by assisted housing in national and regional markets.
9WORST CASE HOUSING NEEDS 2017 REPORT TO CONGRESS
SECTION 2. SHORTAGE OF AFFORDABLE HOUSING
Section 2Shortage of Affordable Housing The supply of rental units that are affordable to very low-income renters, especially those with extremely low incomes, is inadequate. Nationwide, only 66 affordable units exist for every 100 extremely low-income renters. The presence of higher-income renters in units that are affordable to extremely low-income renters worsens this shortage. Only 38 affordable units are available for occupancy for every 100 extremely low-income renters. A final blow is that a significant portion of the affordable and available stock is physically inadequate and may pose threats to occupants. Only one-half of affordable units, or 33 units, are both physically adequate and available for occupancy for every 100 extremely low-income renters. The geography of worst case needs and housing assistance sets a foundation for understanding competition for affordable rental housing and the shortages that result.
Geography of Worst Case NeedsHousing markets are local markets. To a greater extent than wealthier renters, very low-income and extremely low-income renters find their choice of housing units limited to communities and neighborhoods where poverty is more common.
As a relatively small national survey, the American Housing Survey does not support biennial estimates of worst case needs for most individual metropolitan areas.18 It does, however, support select estimates of worst case needs for certain large metropolitan areas included in the survey sample.19 It also supports a national examination of four types of metropolitan locations—central cities, urban and rural suburbs of central cities, and nonmetropolitan areas20—and of four geographic regions—the Northeast, Midwest, South, and West. This analysis by regional and metropolitan status adds considerable depth to the national picture of worst case needs.
18 HUD and the Census Bureau have traditionally conducted periodic AHS metropolitan surveys to supplement the national AHS. In 2015, the AHS was redesigned with a new national and metropolitan area longitudinal sample to account for changes in geography and attrition of housing units over time. In 2015, as in 2013, a supplemental sample of housing units in select metropolitan areas were combined with the national sample to produce metropolitan level estimates. Stand-alone surveys were also conducted in some additional metropolitan areas.
19 The redesigned AHS includes a longitudinal sample of the 15 largest metropolitan areas every 2 years and an additional 10 metropolitan areas surveyed on a rotating basis every 4 years. Select estimates for the metropolitan areas sampled in 2015 are presented in exhibit 2-3 and table A-11B. For more information on the 2015 AHS redesign, see appendix E.
20 Both central cities and suburbs are located within metropolitan areas. A central city consists of the largest city within a metropolitan area. Suburbs are located within metropolitan counties but outside central cities. For the purposes of this report, suburban areas are further distinguished as urban or rural based on their population density. Nonmetropolitan areas fall outside of metropolitan counties and tend to be more rural in nature.

10 WORST CASE HOUSING NEEDS 2017 REPORT TO CONGRESS
Worst Case Needs and Housing Assistance by Region and Metropolitan Location
A key aspect of the definition of worst case needs is that it can be understood as an indicator of need for affordable housing. Because rental housing with deep public subsidies falls into the affordable range, the definition of worst case needs excludes renters with housing assistance. Examining the spatial distribution of housing assistance21 and of worst case needs together provides information about the extent to which assistance is mitigating severe housing problems.
Exhibit 2-1 shows the distribution of the nation’s 19.24 million very low-income renters across the four census regions and three metropolitan categories. On a regional basis, most very low-income renters (6.70 million) lived in the South, 4.50 million lived in the West, 4.05 million lived in the Midwest, and 3.98 million lived in the Northeast in 2015.
21 AHS questions about receipt of rental assistance are designed to focus on federal housing assistance programs. These data result in an estimate of 4.79 million self-reported very low-income households with housing assistance, which is comparable with HUD’s program total. Other potential sources of housing assistance include the U.S. Department of Agriculture’s Rural Housing Service or other state or local programs. Also affecting this comparison, a small fraction of HUD-assisted renters may have incomes above the very low-income threshold, because they were admitted to programs under local policy preferences or their incomes increased after program admission. See the discussion of HUD’s rental assistance programs in appendix C and housing assistance status in appendix E.
22 Among suburban very low-income renters, most (79.8 percent) were concentrated in densely populated urban suburbs.23 Changes in annual estimates of very low-income renters in nonmetropolitan areas should be viewed with caution, because HUD assigns average income limits to
less populated areas to accommodate AHS data suppression. See the discussion of income cutoffs in association with AHS geography in appendix E.
Central cities were home to most (9.51 million) very low-income renters, followed by suburbs (7.23 million)22 and nonmetropolitan areas (2.49 million).23
Like very low-income renters, worst case needs were common in every region and metropolitan category across the nation. As a national average, 43.2 percent of very low-income renters had worst case needs. The prevalence of worst case needs among very low-income renters was greater than the national average in the South and West and in central cities and urban suburbs. On the other hand, the Midwest, Northeast, rural suburbs, and nonmetropolitan areas had smaller than average shares of very low-income renters with worst case needs.
Exhibit 2-1 also demonstrates the important role housing assistance plays in reducing worst case needs. Nationwide, 4.79 million very low-income renters (24.9 percent) reported receiving housing assistance compared with the 43.2 percent having worst case needs. Thus, 1.7 very low-income renters
Exhibit 2-1� Very Low-Income Renters Experienced Worst Case Needs Across Every Region and Metropolitan Location in 2015
Metropolitan Location
Region Central Cities Suburbs, Urban Suburbs, RuralNonmetropolitan
Areas Total
Northeast (thousands) 2,169 1,385 217 212 3,983
Percent with worst case needs 39.7 43.0 33.7 29.7 40.0
Percent with housing assistance 34.3 28.6 24.7 36.6 31.9
Midwest (thousands) 1,806 1,182 283 782 4,053
Percent with worst case needs 37.3 42.1 39.5 29.2 37.3
Percent with housing assistance 28.6 21.0 20.5 33.5 26.8
South (thousands) 3,048 1,840 672 1,136 6,696
Percent with worst case needs 45.9 52.6 30.8 31.1 43.7
Percent with housing assistance 23.0 17.1 21.4 29.9 22.4
West (thousands) 2,490 1,369 287 358 4,503
Percent with worst case needs 50.9 55.4 40.0 36.4 50.4
Percent with housing assistance 21.2 18.2 16.9 31.4 20.8
Total (thousands) 9,513 5,775 1,459 2,488 19,235
Percent with worst case needs 44.2 48.8 34.8 31.1 43.2
Percent with housing assistance 26.2 20.9 20.8 31.8 24.9
Source: HUD-PD&R tabulations of American Housing Survey data.
SECTION 2. SHORTAGE OF AFFORDABLE HOUSING

11WORST CASE HOUSING NEEDS 2017 REPORT TO CONGRESS
had worst case needs for every 1 that was assisted, somewhat worse than the 1.6 ratio seen in 2013. In other words, among very low-income renters, about 25 percent of households had rental assistance, an additional 43 percent had worst case needs for assisted or other affordable housing, and the remaining 32 percent avoided severe housing problems in the unassisted private rental market in 2015.
Housing assistance is relatively less common in the suburbs, where less than 21 percent of very low-income renters were assisted, and especially in the newer suburbs of the South and the West. The prevalence of housing assistance for very low-income renters also varied on a regional basis, ranging from 20.8 percent in the West to 31.9 percent in the Northeast. The region with the lowest rate of housing assistance among very low-income renters, the West, has experienced a long-term trend of the highest regional rate of worst case needs. Areas that developed during an earlier period continue to draw benefits from an established but aging stock of public housing.
Exhibit 2-2 charts the same data to illustrate the vital role of housing assistance in preventing households from falling into worst case needs. Worst case needs affected a smaller share of very low-income renters in nonmetropolitan areas, where housing assistance was relatively more available.
24 High rents introduce the question of whether enough rental units are available at Fair Market Rents (FMRs) to make housing vouchers an adequate policy response to affordable housing shortfalls. Appendix B, exhibit B-3, addresses the extent of the supply of below-FMR housing on a regional basis. Also see regional supply discussions to follow in this section.
Worst case needs were more prevalent in the West and the South, especially in urban suburbs, where housing assistance was scarcer—although high rents in the West also shaped this picture.24 Several areas having greater relative scarcity of housing assistance and an abundance of worst case needs account for substantial fractions of the national problem, as shown by the size of the bubbles in the lower right quadrant of exhibit 2-2. The relative size and trajectory of the bubbles representing worst case needs in central cities and urban suburbs also suggests that the largest shares of severe housing affordability problems were concentrated in densely populated urban areas. Compared with their urban counterparts, the small populations of very low-income renters living in rural suburbs differed from the general pattern by combining lower rates of housing assistance with lower rates of worst case needs in every region except the South.
Not shown in this exhibit are changes in rates of very low-income renters with worst case needs between 2013 and 2015, with increases of 3.6 and 2.6 percentage points observed in the West and South, compared with decreases of less than 1 point in the other regions (summarized in table A-10). In the same period, prevalence of worst case needs increased in urban suburbs and central cities by 4.4 and 1.7 percentage points, respectively, with decreases of 2.2 and 4.0 percentage points observed in rural suburbs and nonmetropolitan areas (summarized in table A-11A).
Variation in Worst Case Needs Across Local Markets
An examination of the distribution of very low-income renters and prevalence of worst case needs across the largest metropolitan areas offers additional insight into the variation of severe housing problems in central cities and suburbs. With densely populated urban cores connected to surrounding counties through strong commuting ties, metropolitan areas reflect groupings of central cities and suburbs with a high degree of social and economic integration. The redesigned AHS supports an examination of the variation in worst case needs across some of the largest metropolitan housing markets. Exhibit 2-3 shows the number of very low-income renters and the share experiencing worst case needs in the nation’s 15 largest metropolitan areas in 2015.
Although 43.2 percent of very low-income renters had worst case needs nationally, local markets reflect a substantial degree of variation beyond the macro-level trends observed across regions and types of metropolitan locations. Worst case needs affected substantial shares of very low-income renters in each of the nation’s largest metropolitan areas. Reflecting particularly severe local conditions, more than one-half of the very low-income renters residing in and around Miami, Riverside, Phoenix, and Los Angeles experienced worst case needs in 2015.
SECTION 2. SHORTAGE OF AFFORDABLE HOUSING

12 WORST CASE HOUSING NEEDS 2017 REPORT TO CONGRESS
Exhibit 2-3� Prevalence of Worst Case Needs Among Very Low-Income Renters Varied Across Metropolitan Markets in 2015
Metropolitan Area0–50%
AMI Metropolitan Area0–50%
AMI
New York-Newark-Jersey City, NY-NJ-PA Atlanta-Sandy Springs-Roswell, GA
Number (thousands) 1,834 Number (thousands) 259
Number with worst case needs (thousands) 815 Number with worst case needs (thousands) 127
Percent with worst case needs 44.4 Percent with worst case needs 49.0
Los Angeles-Long Beach-Anaheim, CA Boston-Cambridge-Newton, MA-NH
Number (thousands) 1,041 Number (thousands) 300
Number with worst case needs (thousands) 567 Number with worst case needs (thousands) 93
Percent with worst case needs 54.5 Percent with worst case needs 31.0
Chicago-Naperville-Elgin, IL-IN-WI San Francisco-Oakland-Hayward, CA
Number (thousands) 567 Number (thousands) 287
Number with worst case needs (thousands) 242 Number with worst case needs (thousands) 142
Percent with worst case needs 42.7 Percent with worst case needs 49.5
Dallas-Fort Worth-Arlington, TX Detroit-Warren-Dearborn, MI
Number (thousands) 365 Number (thousands) 251
Number with worst case needs (thousands) 177 Number with worst case needs (thousands) 115
Percent with worst case needs 48.5 Percent with worst case needs 45.8
Philadelphia-Camden-Wilmington, PA-NJ-DE-MD Riverside-San Bernardino-Ontario, CA
Number (thousands) 342 Number (thousands) 215
Number with worst case needs (thousands) 145 Number with worst case needs (thousands) 123
Percent with worst case needs 42.4 Percent with worst case needs 57.2
Houston-The Woodlands-Sugar Land, TX Phoenix-Mesa-Scottsdale, AZ
Number (thousands) 347 Number (thousands) 227
Number with worst case needs (thousands) 159 Number with worst case needs (thousands) 124
Percent with worst case needs 45.8 Percent with worst case needs 54.6
Washington-Arlington-Alexandria, DC-VA-MD-WV Seattle-Tacoma-Bellevue, WA
Number (thousands) 343 Number (thousands) 199
Number with worst case needs (thousands) 141 Number with worst case needs (thousands) 83
Percent with worst case needs 41.1 Percent with worst case needs 41.7
Miami-Fort Lauderdale-West Palm Beach, FL National
Number (thousands) 373 Number (thousands) 19,235
Number with worst case needs (thousands) 227 Number with worst case needs (thousands) 8,303
Percent with worst case needs 60.9 Percent with worst case needs 43.2
AMI = Area Median Income. Note: Estimates for the 15 largest metropolitan areas (by population ranking) are presented. The redesigned AHS samples these 15 metropolitan areas every 2 years. Estimates for 10 additional metropolitan areas surveyed in 2015 are presented in table A-11B.Source: HUD-PD&R tabulations of American Housing Survey data
SECTION 2. SHORTAGE OF AFFORDABLE HOUSING
13WORST CASE HOUSING NEEDS 2017 REPORT TO CONGRESS
Factors Limiting Access to Affordable Rental HousingEven with one-fourth of very low-income renters receiving housing assistance, the private market’s supply of affordable rental housing is inadequate. Nationally, less than a third of very low-income renters were able to avoid severe housing problems in the unassisted private rental market in 2015. An examination of the mismatches between the number of rental units needed by renters of various income categories and the number of affordable units provided by the market to those renters lends considerable insight into private rental market dynamics and the persistence of worst case needs.
How the Market Allocates Affordable Housing on a National Basis
The competition for good quality, affordable housing remains vigorous. Competition affects whether the neediest households can live in the most affordable units, the vacancy rate at different rent levels, and how quickly new units are occupied. Exhibit 2-4 shows the distribution of rental units and their occupancy by the affordability of their rents relative to the Area Median Income (AMI). For this analysis, a unit is considered affordable for a renter if the gross rent (rent plus utilities) does not exceed 30 percent of the maximum income of their income
25 Note that renters whose incomes place them at the bottom of an income range would not be able to afford rents at the top of their range. More detailed presentations of these data appear in appendixes A and B, where table A-12 and exhibit B-2 show unit affordability and occupancy status using 10-point income breaks.
26 Comparable estimates of the rental vacancy rate based on the Current Population Survey are slightly lower and reflect a steady decline in rental vacancy rates in recent years—9.5 percent in 2011, 8.3 percent in 2013, and 7.1 percent in 2015. See U.S. Housing Market Conditions charting data http://www.huduser.gov/portal/ushmc/hi_RentVac.html.
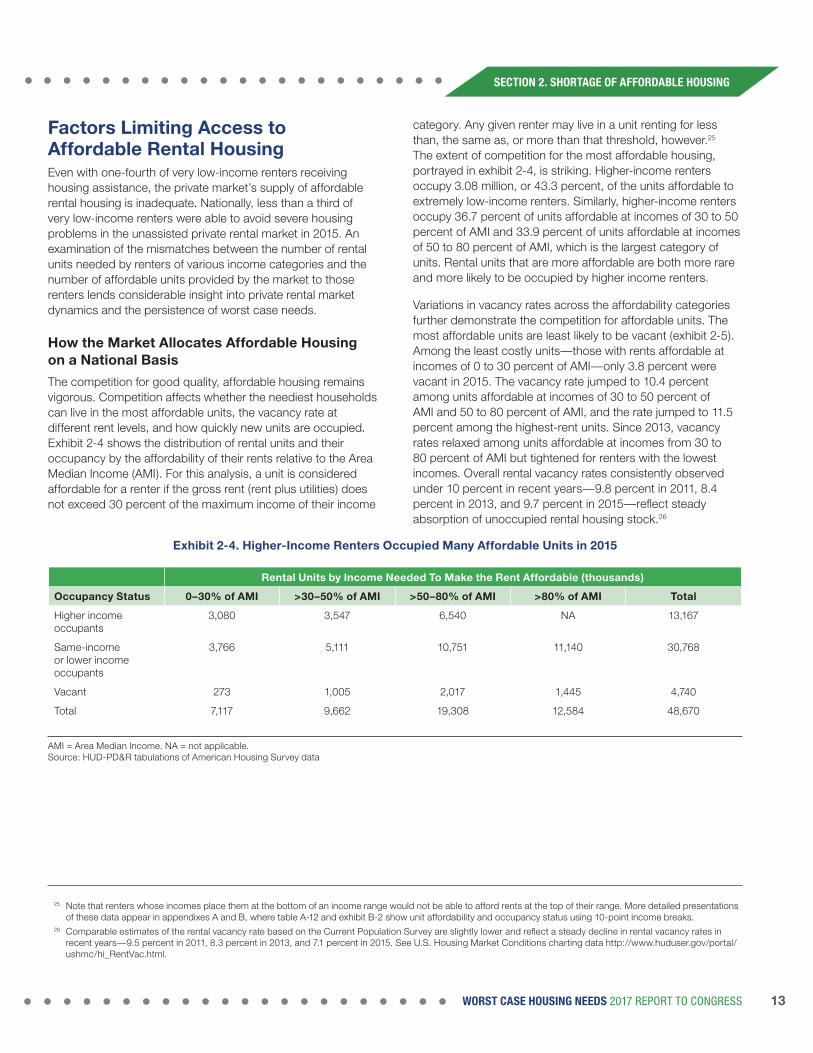
category. Any given renter may live in a unit renting for less than, the same as, or more than that threshold, however.25 The extent of competition for the most affordable housing, portrayed in exhibit 2-4, is striking. Higher-income renters occupy 3.08 million, or 43.3 percent, of the units affordable to extremely low-income renters. Similarly, higher-income renters occupy 36.7 percent of units affordable at incomes of 30 to 50 percent of AMI and 33.9 percent of units affordable at incomes of 50 to 80 percent of AMI, which is the largest category of units. Rental units that are more affordable are both more rare and more likely to be occupied by higher income renters.
Variations in vacancy rates across the affordability categories further demonstrate the competition for affordable units. The most affordable units are least likely to be vacant (exhibit 2-5). Among the least costly units—those with rents affordable at incomes of 0 to 30 percent of AMI—only 3.8 percent were vacant in 2015. The vacancy rate jumped to 10.4 percent among units affordable at incomes of 30 to 50 percent of AMI and 50 to 80 percent of AMI, and the rate jumped to 11.5 percent among the highest-rent units. Since 2013, vacancy rates relaxed among units affordable at incomes from 30 to 80 percent of AMI but tightened for renters with the lowest incomes. Overall rental vacancy rates consistently observed under 10 percent in recent years—9.8 percent in 2011, 8.4 percent in 2013, and 9.7 percent in 2015—reflect steady absorption of unoccupied rental housing stock.26
Exhibit 2-4� Higher-Income Renters Occupied Many Affordable Units in 2015
Rental Units by Income Needed To Make the Rent Affordable (thousands)
Occupancy Status 0–30% of AMI >30–50% of AMI >50–80% of AMI >80% of AMI Total
Higher income occupants
3,080 3,547 6,540 NA 13,167
Same-income or lower income occupants
3,766 5,111 10,751 11,140 30,768
Vacant 273 1,005 2,017 1,445 4,740
Total 7,117 9,662 19,308 12,584 48,670
AMI = Area Median Income. NA = not applicable. Source: HUD-PD&R tabulations of American Housing Survey data
SECTION 2. SHORTAGE OF AFFORDABLE HOUSING

14 WORST CASE HOUSING NEEDS 2017 REPORT TO CONGRESS
The gradient in national vacancy rates seen in exhibit 2-5 also became flatter for most units during both the 2011-to-2013 and the 2013-to-2015 periods. Nevertheless, the market for units affordable at extremely low income levels remained very tight. Greater vacancy rates continue to be found at the highest rent levels (which include numerous vacation homes). Compared with the market for the most affordable units, the availability of vacant units at higher rent levels shows that in many markets, rental assistance in the form of vouchers could reduce worst case needs to the extent landlords are willing to participate. In addition, the somewhat higher vacancy rate for the units affordable at only 10 percent of AMI is often ascribed to units that have physical or locational challenges and may soon be removed from the housing stock.
The shifts in vacancy from 2013 to 2015 reflect in part the expansion of the overall rental stock by approximately 4.7 million units, or over 10 percent, including an increase in vacancies by over 1 million units, or nearly 30 percent. The rental stock affordable to very low-income renters, however, decreased by over 1 million units, or approximately 7 percent with a negligible increase in affordable vacant units over the same period.27 Despite increases in vacant units while the overall rental stock was growing, strong rental demand nationwide kept vacancy rates fairly constrained for renters with median or lower incomes.
Although vacancy rates provide a valuable indication of the balance between supply and demand, they do not directly compare the number of affordable units with the number of
27 See tables A-12 and A-13.28 Measures of affordability, availability, and adequacy compare the entire housing stock with the entire renter population, and they do not reflect small-scale
geographic detail or the complexities of local housing markets.
renters. The remainder of section 2 makes such comparisons, employing three increasingly stringent concepts to assess whether the rental housing stock is sufficient for the need.
Affordability, Availability, and Adequacy of the National Rental Stock
The scarcity of affordable units is greatest for the poorest renters, but, because of the rapid increase in renter households and greater competition, that scarcity is reaching higher up the income scale. Exhibit 2-6 displays the rental housing stock in 2015. These aggregate data portray how well the overall stock could meet the need for affordable housing if location did not matter.28
Focusing first on all affordable units, regardless of whether higher-income households occupied them or whether they were adequate, the cumulative number of affordable units is shown to equal the cumulative number of renters only for incomes exceeding 52 percent of AMI. Beyond this point, more than 100 affordable units existed per 100 renters—enough, with perfect allocation, to provide affordable housing to every renter with a greater income. This threshold matched the 2013 estimate and remains greater than the 2007 level of 45 percent of AMI, meaning that the scarcity of affordable units continues to reach higher up the income scale than it did in 2007, prior to the financial crisis.
The ratio of affordable units per renter peaked at income levels of 98 percent of AMI. On a cumulative basis, a substantial
0%
15%
20%
10%
5%
10 20 30 40
Source: HUD-PD&R tabulations of American Housing Survey data
Per
cent
of r
enta
l uni
ts th
at a
re v
acan
t
Exhibit 2-5. Vacancies Were Lowest Among Most Affordable Rental Units, 2011 to 2015
Affordability category (percent of Area Median Income needed to afford the highest
rent in the category)
50 60 70 80 90 100 110 120+
Vacancy rate, 2015
Vacancy rate, 2013
Vacancy rate, 2011
SECTION 2. SHORTAGE OF AFFORDABLE HOUSING

15WORST CASE HOUSING NEEDS 2017 REPORT TO CONGRESS
surplus of units were affordable at higher levels of household income. As income increased, renters were increasingly likely to spend less than 30 percent of their incomes on housing.29
The situation was completely different at the low end of the income scale. Enough affordable units existed to house 66 percent of extremely low-income renters in 2015 if those units somehow could have been perfectly allocated. This shortage was substantial and critical, with little improvement from the ratio of 65 percent observed in 2013.
MEASURING WHETHER AFFORDABLE HOUSING STOCK IS SUFFICIENT FOR NEED
• Affordability measures the extent to which enough rental housing units of different costs can provide each renter household with a unit it can afford (based on the 30-percent-of-income standard). Affordability, which is the broadest measure of the relative supply of the housing stock, addresses whether sufficient housing units would exist if allocated solely on the basis of cost. The affordable stock includes both vacant and occupied units.
• Availability measures the extent to which affordable rental housing units are available to renters within a particular income range. Availability is a more restrictive concept, because units that meet the definition must be available and affordable. Some renters choose to spend less than 30 percent of their incomes on rent, occupying housing that is affordable to renters of lower incomes. These units thus are not available to lower-income renters. A unit is available at a given level of income if (1) it is affordable at that level and (2) it is occupied by a renter either at that income level or at a lower level or is vacant.
• Adequacy extends the concept of availability by considering whether sufficient rental units are physically adequate (based on unit characteristics described in appendix E), affordable, and available. Adequacy thus is the most restrictive of the three measures.
29 Table A-1A shows that only 12.7 percent of renters with incomes greater than 80 percent of AMI had either moderate or severe rent burdens compared with 68.3 percent of renters with lower incomes.
30 The availability measure also removes units from consideration if they have artificially low rents, because they are occupied as a benefit of employment (for example, units provided for caretakers) or because relatives or friends of the occupants own the units. In 2015, 2.14 million renter households (4.9 percent) occupied units while paying no rent. The AHS does not provide estimates of the number of households paying a positive but less-than-market rent because of employment or other reasons.
31 Previous research based on the Residential Finance Survey indicated that 12 percent of units with gross rents of $400 or less produced negative net operating income, suggesting they were headed for demolition or conversion to nonresidential use (JCHS, 2006). More recent research based on the Housing Vacancy Survey suggests more than 10 percent of vacant units held off the market are in need of repair, abandoned, condemned, or to be demolished (JCHS, 2016).
The second line in exhibit 2-6 includes the criterion of availability in addition to affordability, meaning that it considers whether higher-income renters currently occupy affordable units.30 Availability poses an important additional constraint on renters seeking affordable units; only 38 percent of extremely low-income renters could actually find an affordable and available unit, even if location were not a factor.
The paucity of affordable and available units is worsened by the occupancy of a considerable proportion of the most affordable housing stock by renters who could afford to spend more (as shown previously in exhibit 2-4). The affordable stock was nominally sufficient to house every renter with an income greater than 52 percent of AMI, yet the affordable and available stock did not match the number of renters until household incomes reached about 80 percent of AMI.
The third line in exhibit 2-6 adds a third criterion—that units should be physically adequate—which further reduced the supply of the rental housing stock. For renters even with low incomes (up to 80 percent of AMI), only 89 adequate units were available for every 100 renters. The physically adequate stock did not fully match the need until it included units affordable only to renters with incomes exceeding 124 percent of AMI, consistent with 2013 levels and a substantial shift from the 110 percent of AMI observed in 2011.
Rental Stock by Income
We have seen that relatively few rental units are affordable, and—because of occupancy by higher income renters and limited vacancies—even fewer are available to renters with the lowest incomes. Exhibit 2-7 summarizes the three housing stock measures for the standard income groups used in this report.
A severe mismatch existed between the number of extremely low-income renters and the number of affordable units available to them. For every 100 extremely low-income renters, only 66 affordable units existed, and only 38 of those units were affordable and available. If physically adequate units are required, then only 33 units were available for every 100 extremely low-income renters.31 These figures suggest that 12 percent of affordable and available units for extremely low-income renters had severe deficiencies. Renters with very low incomes found 93 affordable units, 62 affordable and available units, and only 54 affordable, available, and physically adequate units per 100 renters. About 13 percent of the affordable and available units for this larger group had severe physical problems.
SECTION 2. SHORTAGE OF AFFORDABLE HOUSING

16 WORST CASE HOUSING NEEDS 2017 REPORT TO CONGRESS
Exhibit 2-7� Rental Housing Stock Was Scarcest for Extremely Low-Income Renters in 2015
Rental Units per 100 Renters
Income Category Affordable
Affordable and
Available
Affordable, Available,
and Adequate
Extremely low-income renters (0–30% AMI)
66.0 37.7 33.0
Very low-income renters (0–50% AMI)
92.9 62.0 53.7
Low-income renters (0–80% AMI)
135.4 99.9 88.7
AMI = Area Median Income. Source: HUD-PD&R tabulations of American Housing Survey data
Renters with low incomes find that the affordable and available rental stock was nearly sufficient to house them all, although 11 percent of such units had severe physical problems.
Overall, the supply of affordable housing improved slightly from its record low point in 2011, although fewer units were both affordable and available. Exhibit 2-8 illustrates that the supply of affordable housing stock for extremely low-
Exhibit 2-8� Fewer Affordable Units Were Available in 2015
Rental Units per 100 Renters
Change
Income Category 2011 2013 2015
2011 to
2013
2013 to
2015
Extremely low-income renters (0–30% AMI)
Affordable 58.2 65.3 66.0 7.1 0.7
Affordable and available 35.8 39.0 37.9 3.2 – 1.1
Very low-income renters (0–50% AMI)
Affordable 92.4 97.2 92.9 4.8 – 4.3
Affordable and available 64.6 65.2 62.0 0.6 – 3.2
AMI = Area Median Income. Source: HUD-PD&R tabulations of American Housing Survey data
32 For renters who could afford rents no greater than the FMR, appendix B, exhibit B-3, reveals that although enough affordable units existed in each region, the number of available units in each region was sufficient to house only 76 to 85 percent of those renters. For renters who attempt to find a unit with a housing choice voucher, the housing quality standards of that program imply that their success will depend on the prevalence of “adequate” units in their area—not merely affordable and available units. Across regions, there were enough physically adequate, affordable, and available units to house only 70 to 77 percent of renters who could not afford rents higher than FMR.
income renters increased by 1 unit per 100 renters from 2013 to 2015, following a 7-unit gain during the previous 2 years. The ratio of affordable and available units, however, decreased by 1 unit from 2013 levels to 38 units per 100 extremely low-income renters.
For very low-income renters, the overall supply of affordable units decreased by more than 4 units per 100 renters, offsetting a nearly 5-unit gain in the previous 2 years. The more focused affordable and available unit ratio lost 3 units per 100 renters. Netting out the 1-point loss in units available at 0 to 30 percent of AMI from the 3-point loss for very low-income renters suggests that the stock at 30 to 50 percent of AMI became more constrained during the 2013-to-2015 period.
Geography of SupplyThe preceding discussion shows that worst case needs are dispersed across the nation, yet they can be concentrated in certain geographic areas, and it shows that spatial variation in worst case needs is affected in part by the availability of housing assistance.
Affordable rental housing includes both units that receive public rent assistance and units that for-profit and nonprofit housing providers offer at modest rents. The examination of affordable housing supply on a national basis reveals, first, that the supply of rental units that are affordable to very low-income and poorer households remains substantially inadequate; second, that this shortage is worsened by the natural preference of higher-income renters for more affordable units; and third, that the shortage is further worsened by the physical inadequacy of some of the stock.
The following discussion sharpens that picture by showing how shortages vary by geography.
Rental Stock by Region
Rental markets are constrained for extremely low-income renters across the four census regions despite substantial variation in the availability of affordable rental units.32 Exhibit 2-9 illustrates that the Midwest showed the best availability, with 77 units per 100 very low-income renters. The West was worst off, with fewer than 44 units per 100 very low-income renters, compared with 63 units for the Northeast and 64 for the South. For extremely low-income renters, the availability of affordable units was far from adequate in any region. Even low-income renters with incomes up to 80 percent of AMI found, in the West and the Northeast, that not enough affordable units were available.
SECTION 2. SHORTAGE OF AFFORDABLE HOUSING

17WORST CASE HOUSING NEEDS 2017 REPORT TO CONGRESS
Exhibit 2-9� Rental Housing Stock Was Insufficient for Extremely Low-Income Renters Across All
Regions in 2015
Housing Units per 100 Renters
Income Category Affordable
Affordable and Available
Affordable, Available,
and Adequate
Northeast
Extremely low-income renters (0–30% AMI)
71.7 42.8 36.0
Very low-income renters (0–50% AMI)
92.2 63.2 54.1
Low-income renters (0–80% AMI)
126.2 95.0 81.8
Midwest
Extremely low-income renters (0–30% AMI)
66.2 39.9 35.2
Very low-income renters (0–50% AMI)
118.8 77.3 67.6
Low-income renters (0–80% AMI)
145.6 109.5 98.3
South
Extremely low-income renters (0–30% AMI)
70.8 38.7 34.3
Very low-income renters (0–50% AMI)
95.4 64.1 55.1
Low-income renters (0–80% AMI)
142.2 104.4 92.6
West
Extremely low-income renters (0–30% AMI)
53.9 29.9 26.6
Very low-income renters (0–50% AMI)
64.0 43.7 38.2
Low-income renters (0–80% AMI)
119.9 87.6 78.7
AMI = Area Median Income.
Source: HUD-PD&R tabulations of American Housing Survey data
On a regional basis, adding the adequacy test restricted the estimated supply for very low-income renters less in the West, eliminating 6 units, than in the other regions, which lost 9 to 10 units per 100 very low-income renters.
Nevertheless, the primary point in exhibit 2-9 is that extremely low-income renters continued to face severely constrained markets across all four regions. The Northeast, Midwest, and South had affordable units available only for two in five extremely low-income renters, and the West only for one in three.
Similar analysis of affordable housing supply on the basis of metropolitan status displayed minimal variation in 2015. Measures of affordability, availability, and adequacy for each income group were generally within a few points of the national summary values presented in exhibit 2-7, regardless of whether calculated for central cities, urban suburbs, rural suburbs, or nonmetropolitan areas.
Summary Worst case needs are commonplace in every region and metropolitan category across the United States. Nationwide, 43.2 percent of very low-income renters had worst case needs in 2015. Prevalence increased by 3.6 percentage points from 2013 levels in the West and by 2.6 percentage points in the South, which both had greater-than-average rates of worst case needs in 2015. Central cities and urban suburbs also had greater-than-average prevalence rates and were home to the vast majority (84.6 percent) of worst case needs households.
Housing assistance, including that provided by HUD, is an important preventer of worst case needs among very low-income renters. Nationwide, 24.9 percent of very low-income renters, or 4.79 million households, reported receiving housing assistance. For every very low-income renter who was assisted, however, another 1.7 renters had worst case needs for such assistance.
Steady absorption of unoccupied rental housing stock has reduced overall vacancy rates to consistently less than 10 percent since 2011. With 93 rental units affordable for every 100 very low-income renters, not all such households could find an affordable unit in 2015, even if allocations were perfect among households across the nation (that is, if the lowest-rent units were allocated to the lowest-income households first). Many fewer affordable units were actually available to renters with the lowest incomes, because vacancy rates were lowest for the lowest-rent units and many affordable units were rented to higher income families. In 2015, the vacancy rate for units affordable at extremely low incomes was only 3.8 percent compared with 11.5 percent for units affordable at more than 80 percent of AMI. The expansion of rental stock to meet surging rental demand between 2013 and 2015 mostly benefited higher-income households, with less stock affordable to very low-income renters.
SECTION 2. SHORTAGE OF AFFORDABLE HOUSING

18 WORST CASE HOUSING NEEDS 2017 REPORT TO CONGRESS
Because of competition for affordable units, when a simple ratio of affordable units per 100 very low-income renters is made more stringent by adding availability as a constraint, the ratio decreases from 93 affordable units to only 62 affordable and available units per 100 very low-income renters, and it decreases from 66 to 38 per 100 extremely low-income renters. Higher income families occupied 43.3 percent of units affordable to extremely low-income renters.
In addition, a substantial proportion of available units are not in standard physical condition. The number of affordable, available, and adequate units in 2015 was only 54 per 100 very low-income renters and only 33 per 100 extremely low-income renters.
Given the scarcity of affordable, available, and adequate units for the poorest renters, the efficacy of housing assistance in preventing worst case needs, and the surplus of units available at higher rent levels, housing vouchers continue to offer an important policy option for addressing the growing problem of worst case needs using the existing housing stock.
SECTION 2. SHORTAGE OF AFFORDABLE HOUSING

Section 3
Understanding the Trend in Worst Case Needs Section 2 demonstrated that worst case needs are prevalent across the nation as a result of the limited availability of adequate, affordable rental units relative to the number of very low-income renters who need them. Section 3 elaborates how the changes in the number of units, the number of renters, and the rents they paid during the 2013-to-2015 period underlie this result.
Post-recession improvements in worst case needs observed between 2011 and 2013 were not sustained during the 2013-to-2015 period. The 754,000 decline in worst case needs between 2011 and 2013 was partially reversed in the latest 2013-to-2015 period, increasing by 582,000 households. Across both periods, however, about 70 percent of the change in worst case needs was attributed to demographic changes among unassisted very low-income renters and 30 percent to changes in market conditions.
Consistent with the previous 2-year period, formation of new households and changes in tenure from homeownership to renting continued to escalate worst case needs between 2013 and 2015. Rising incomes also continued to benefit renters, although increases in tenant incomes among very low-income renters were too weak to fully offset other factors between 2013 and 2015. Departing, however, from trends observed in the previous 2-year period, inadequate increases in rental assistance and the widening of the gap between demand for affordable rental housing and the supply of affordable units drove worst case needs upward between 2013 and 2015.
Changes in Affordable Housing DemandThe previous sections of this report have shown that the increase in the number of households with worst case needs reflects both changes in the population vulnerable to worst case needs—unassisted very low-income renters—and changes in the share of those renters experiencing the severe problems that trigger worst case needs. The population of vulnerable renters is affected primarily by demographic factors (including their incomes and, to a small extent, HUD’s categorization of their incomes). This population, in turn, substantially determines the demand for affordable housing. The rate of worst case needs among these vulnerable renters, by contrast, reflects the economic response of the housing market to these demographic changes.
19WORST CASE HOUSING NEEDS 2017 REPORT TO CONGRESS
SECTION 3. UNDERSTANDING THE TREND IN WORST CASE NEEDS

20 WORST CASE HOUSING NEEDS 2017 REPORT TO CONGRESS
The following analysis sorts out these factors. First, we distinguish between the effects of population change and the effects of the prevalence of worst case needs to estimate their relative importance. Then we identify how much various demographic factors affected the population change.33
The population of unassisted very low-income renters increased 5.1 percent between 2013 and 2015, from 13.74 million to 14.44 million. During the same period, the rate of worst case needs in this population increased from 56.2 to 57.5 percent.
From these facts, we can attribute a net increase of 402,000 cases of worst case needs (about 70 percent of the total increase) to demographic changes and a further increase of about 180,000 cases (about 30 percent of the increase) to changes in the prevalence of severe problems. The demographic effect and the prevalence effect together explain the 582,000 additional cases of worst case needs observed in the AHS in 2015 compared with the number of cases observed in 2013. 34
The 402,000 increase in worst case needs resulting from demographic shifts can be further broken down into four components, illustrated by the first four columns of exhibit 3-1.
33 Any analysis of survey data faces limitations from both sampling error and nonsampling error. Such errors are compounded when multiple survey years are compared. Additionally, the 2015 AHS was administered to a completely different sample of households than previous AHS iterations. This analysis takes the AHS estimates at face value, but the reader should recognize that multiple sources of potential error exist.
34 The demographic effect equals the new prevalence rate times the numerical increase (or decrease) in renters, and the prevalence effect is the increase (or decrease) in the prevalence rate times the baseline number of renters.
35 AHS estimates. Annual homeownership estimates based on the Current Population Survey/Housing Vacancy Survey were 65.1 percent for 2013 and 63.7 percent for 2015.36 As a percentage of renter households, very low-income renters decreased from 45.9 percent in 2013 to 43.8 percent in 2015.37 Methodological factors are summarized in the sidebar, “Changes in Income Limits and Worst Case Needs.”
1� Household formation� The nation added 2.23 million new households between 2013 and 2015, to which we attribute a proportional increase of 154,000 cases of worst case needs. The household formation growth rate was 1.9 percent during this 2-year period, equivalent to the average biennial increase of 1.9 percent since 2005 as measured by the AHS.
2� Renter share of households� Shifts in tenure from homeownership to renting account for 563,000 new cases of worst case needs. The homeownership rate declined from 65.3 percent in 2013 to 62.9 percent in 2015,35 as the nation added 3.66 million renter households, a notable increase of 9.1 percent. By comparison, renter households increased 3.6 percent from 2011 to 2013, and the average biennial growth rate in renter households since 2005 has been 4.6 percent.
3� Renter income changes� Changes in income that raised renter households out of the very low-income category account for a 404,000-case reduction of worst case needs. In 2015, 734,000 additional renters had very low incomes, a 4.0-percent increase. Because the tenure shift discussed previously was more than sufficient to explain this increase, the attributed impact of renter income changes on the number of worst case needs is negative.36 This increase in very low-income renters offset the 4.0-percent decrease during the 2011-to-2013 period but still compared favorably with the 12.5-percent increase during the 2009-to-2011 period and was consistent with average biennial increases of 3.6 percent observed since 2005.37
4� Rental assistance gap� We attribute 89,000 cases of the total increase in worst case needs to the widening gap in rental assistance. The number of unassisted very low-income renters increased by 699,000 households during the 2013-to-2015 period because the number of very low-income renters reporting housing assistance increased only slightly (35,000 cases) while the number of very low-income renters overall increased by 734,000. The resulting 5.1-percent increase in the number of unassisted very low-income renters partially reversed the 6.4-percent decrease seen during the preceding 2-year period but was moderate compared with the 14.3-percent increase during the 2009-to-2011 period. This increase in the rental assistance gap was comparable with biennial increases in unassisted very low-income renters since 2005 averaging 4.2 percent.
SECTION 3. UNDERSTANDING THE TREND IN WORST CASE NEEDS

21WORST CASE HOUSING NEEDS 2017 REPORT TO CONGRESS
Lingering effects of 2013 sequestration budget cuts may also help explain why the closing gap in rental assistance observed in the 2011-to-2013 period was reversed in the 2013-to-2015 period. For example, the number of households served by HUD’s largest rental assistance program, the Housing Choice Voucher program, declined temporarily between 2013 and 2014 following sequestration. The number of households served by the program did not fully restore to presequestration levels until 2016.38
This analysis shows that demographic factors that caused net increases in the population of unassisted very low-income renters account for much of the increase in worst case needs between 2013 and 2015. Such factors drove large decreases in the previous 2 years as measured by the AHS. The increase in tenure shifts from homeownership to renting was the most important demographic factor during the most recent period, more than offsetting tenant income effects.
38 According to calendar year-end HUD administrative records from 2012 to 2016.
After accounting for these four demographic factors, about 30 percent of the increase in worst case needs remains to be attributed to the fifth column of exhibit 3-1. Affordable unit competition represents the extent to which the market responded to the increased demand. Because the supply of affordable and available units did not increase enough to meet the increased demand, the prevalence of worst case needs increased.
Affordable Housing Supply and DemandExhibit 2-8 shows that the availability of affordable rental units became more constrained during the 2013-to-2015 period. Such affordability metrics are affected by multiple demographic and market factors. Some additional data, including key numbers underlying the changes in available unit ratios, will shed light on the issue.
Exhibit 3-2� Changes in Affordable Rental Housing Availability Driven by Growing Population of Renters and Rising Costs, 2013–2015
Extremely Low-Income (0–30% AMI)
Very Low-Income (0–50% AMI)
Low-Income (0–80% AMI) Totala
Cumulative affordable and available rental units (thousands)
2013 4,354 12,088 26,617 43,992
2015 4,278 11,854 27,716 48,670
Percent change -1.7 -1.9 +4.1 +10.6
Cumulative households (thousands)
2013 11,163 18,538 26,333 40,294
2015 11,290 19,235 27,931 43,930
Percent change +1.1 +3.8 +6.1 +9.0
Income limit (median, current dollars)
2013 16,800 28,000 44,618 —
2015 17,050 28,400 45,450 —
Percent change +1.5 +1.4 +1.9 —
Median household income (all renters, current dollars)
2013 — — — 30,000
2015 — — — 32,796
Percent change — — — +9.3
Median monthly housing cost (all renters, current dollars)
2013 — — — 850
2015 — — — 922
Percent change — — — +8.5
AMI = Area Median Income. a Total represents all units or renters, not the sum of the cumulative income categories. Source: HUD-PD&R tabulations of American Housing Survey data
SECTION 3. UNDERSTANDING THE TREND IN WORST CASE NEEDS
22 WORST CASE HOUSING NEEDS 2017 REPORT TO CONGRESS
Exhibit 3-2 examines the factors responsible for the change in the availability of affordable units. The total number of rental units increased by about 4.68 million (10.6 percent) between 2013 and 2015, building on a modest increase of 920,000 (2.1 percent) during the previous 2 years. The 3.64 million new renter households absorbed much of the net increase of rental units.
Between 2013 and 2015, both of the primary market forces of supply and demand contributed to increased worst case needs among the most vulnerable, extremely low-income subset—the supply of affordable and available units for these renters decreased modestly by 1.7 percent or 76,000 units, while an additional 127,000 households, a 1.1-percent increase, put upward pressure on demand for affordable units.
The loss of affordable and available stock was about the same in percentage terms for the broader very low-income category, but demand increased more steeply. Netting out the extremely low-income estimates from the very low-income estimates reveals that households with incomes of 30 to 50 percent of Area Median Income increased while available units decreased. The increase in extremely low-income renters was supplemented by a further increase of 570,000 renters with incomes 30 to 50 percent of AMI, and the loss of 76,000 extremely low-income units was coupled with a loss of 158,000 units available and affordable at 30 to 50 percent of AMI. As renters occupying affordable units shifted to higher income categories, their units were no longer considered available for the income category they exited. The data of exhibit 3-2 suggest that such transitions may have reduced availability for both extremely low-income renters and for renters at 30 to 50 percent of AMI but not for renters of higher incomes.
CHANGES IN INCOME LIMITS AND WORST CASE NEEDS
A minimal portion of the increase in renters with extremely low and very low incomes between 2013 and 2015, and of those with worst case needs, is explained by a shift in income limits. HUD calculates income limits on the basis of Area Median Incomes, including both owners and renters, and then uses the income limits to define the boundaries of the extremely low-income, very low-income, and low-income categories.
39 Another potential cause of an increase in the median renter’s income could be the addition of new, higher-income renters. HUD has not assessed the extent to which each factor contributed to the result.
40 Includes rent, utilities, property insurance, land rent, and association fees but excludes any separate security deposit or parking fees.41 Average monthly incomes and gross rents across income groups are set forth in table A-14.
Exhibit 3-2 shows that, across the nation, the income limits for the median renter household increased slightly between 2013 and 2015. That is, the greatest income qualifying as extremely low income increased by $250, and the greatest income qualifying as very low income increased by $400. As a result, each category captured more households during 2015.
The median renter’s income increased 9.3 percent between 2013 and 2015. To the extent that these are the same households in both years, this increase represents a substantial gain in income compared with incomes during the recessionary period.39 The median renter’s income placed her in the very low-income category in 2011 and the low-income category in 2013 and 2015. At the same time, the median monthly housing costs for renters40 also increased by 8.5 percent, a notable jump from the nearly flat 0.6-percent increase during the previous 2 years. Putting these two factors together, to the extent that renters enjoyed income gains during the 2013-to-2015 period, increasing housing costs consumed a good share of additional income. This tandem increase in rents and incomes stands in contrast to the trend between 2011 and 2013, when income gains outpaced housing costs by substantial margins and worst case housing needs decreased. Further helping to explain the most recent increase in worst case needs, for extremely low-income renters, growth in rental costs outpaced income gains from 2013 to 2015. Although average incomes grew by 4.7 percent among this group, average gross rental costs increased more rapidly, by 6.9 percent, failing to relax typical housing cost burdens for the most vulnerable renters and yielding a greater number of worst case housing needs.41
Growing incomes of renter households accompanied a substantial increase in the number of renter households, but, unfortunately, income increases were insufficient to prevent growth in the number classified as having very low incomes. Even as the overall supply of rental units expanded, rents increased and the shortage of affordable and available units for extremely low-income renters and very low-income renters became more severe. These factors provide the primary framework for understanding the increase in worst case housing needs between 2013 and 2015.
Exhibit 3-3 examines the biennial percentage change of two supply and demand factors, the number of very low-income renters and the number of units they can afford, in the context of changes in worst case needs observed over the past 10 years.
SECTION 3. UNDERSTANDING THE TREND IN WORST CASE NEEDS

23WORST CASE HOUSING NEEDS 2017 REPORT TO CONGRESS
Exhibit 3-2 shows that, across the nation, the income limits for the median renter household increased slightly between 2013 and 2015. That is, the greatest income qualifying as extremely low income increased by $250, and the greatest income qualifying as very low income increased by $400. As a result, each category captured more households during 2015.
The median renter’s income increased 9.3 percent between 2013 and 2015. To the extent that these are the same households in both years, this increase represents a substantial gain in income compared with incomes during the recessionary period.39 The median renter’s income placed her in the very low-income category in 2011 and the low-income category in 2013 and 2015. At the same time, the median monthly housing costs for renters40 also increased by 8.5 percent, a notable jump from the nearly flat 0.6-percent increase during the previous 2 years. Putting these two factors together, to the extent that renters enjoyed income gains during the 2013-to-2015 period, increasing housing costs consumed a good share of additional income. This tandem increase in rents and incomes stands in contrast to the trend between 2011 and 2013, when income gains outpaced housing costs by substantial margins and worst case housing needs decreased. Further helping to explain the most recent increase in worst case needs, for extremely low-income renters, growth in rental costs outpaced income gains from 2013 to 2015. Although average incomes grew by 4.7 percent among this group, average gross rental costs increased more rapidly, by 6.9 percent, failing to relax typical housing cost burdens for the most vulnerable renters and yielding a greater number of worst case housing needs.41
Growing incomes of renter households accompanied a substantial increase in the number of renter households, but, unfortunately, income increases were insufficient to prevent growth in the number classified as having very low incomes. Even as the overall supply of rental units expanded, rents increased and the shortage of affordable and available units for extremely low-income renters and very low-income renters became more severe. These factors provide the primary framework for understanding the increase in worst case housing needs between 2013 and 2015.
Exhibit 3-3 examines the biennial percentage change of two supply and demand factors, the number of very low-income renters and the number of units they can afford, in the context of changes in worst case needs observed over the past 10 years.
With few exceptions, the number of households experiencing worst case needs has increased steadily, with the sharpest increases observed during and immediately following the recessionary period. In most instances, increases in worst case needs were accompanied by increasing numbers of very low-income renters, indicating increasing demand for affordable rental units. Correspondingly, in most instances, increases in worst case needs were also accompanied by declines in the national supply of units affordable to very low-income renters.
In 2013, which witnessed the sharpest decline in worst case needs in the past decade, that trend reversed. The number of very low-income renters decreased, easing demand, and the number of units affordable to very low-income renters increased, growing the national supply of affordable housing. In 2015, however, supply of affordable units declined as demand for those units rose, yielding an increase in very low-income renters with worst case housing needs.
Concluding Summary An analysis of demographic and market factors indicates that, of the total increase of worst case needs by 582,000 during the 2013-to-2015 period, about 70 percent is attributable to demographic changes that grew the population of unassisted very low-income renters, and 30 percent is attributable to market responses that increased the prevalence of worst case needs among such households.
Four demographic factors affected the number of unassisted, very low-income renters who were susceptible to worst
case needs from 2013 to 2015. On net, demographic factors increased worst case needs after driving modest reductions in the previous 2 years. National household formation tended to increase worst case needs by 154,000 cases, and a marked increase in the renter share of households contributed 563,000 more. The growing gap in rental assistance relative to the need accounted for another 89,000 cases. These increasing factors, accounting for 806,000 new cases, were partially offset by renter income increases that raised renters out of the very low-income population and reduced worst case needs by 404,000 cases.
The increase in the number of unassisted, very low-income renters represents a quantitative increase in the number of affordable units demanded. Even if the supply were unchanged, we would expect increased competition for affordable units, increasing rents, and increasing prevalence of worst case needs. Therefore, after demographic factors on net grew worst case needs by 402,000, it is reasonable that market-driven increases in prevalence would account for a further increase of 180,000 cases.
The market response is somewhat less tidy than the previous sentence suggests. The total supply of rental units increased somewhat more (by approximately 4.7 million units, or more than 10 percent) than the total renter population (3.64 million renters, or 9.0 percent). However, with vacancy rates highest among the most expensive units, the number of rental units affordable and available to very low-income renters decreased by 234,000 units (1.9 percent), while the very low-income renter population increased by 734,000 households (4.0 percent). This uneven pattern in supply growth was mimicked in renter income changes, with median income growing more sharply for renters overall (9.3 percent) than the median income threshold for very low-income renters (1.4 percent). Further, the 8.5 percent increase in median monthly housing costs for renters was a notable departure from nearly flat costs during the previous 2 years.
Worst case housing needs are a national problem. They expanded dramatically during the past decade and were exacerbated by the economic recession and associated collapse of the housing market, which reduced homeownership through foreclosures and increased demand for renting. The slight improvements observed since 2011 offer cause for hope, but the failure to sustain the more promising trends observed in 2013 is sobering. Even with public rental assistance, it remains the case that 6 of 10 extremely low-income renters and 4 of 10 very low-income renters do not have access to affordable and available housing units. In 2015, 1.7 very low-income households experienced worst case needs for every very low-income household with rental assistance. A broad strategy at the federal, state, and local levels is needed to continue to rebuild the economy, strengthen the market, and provide assistance to those families most in need.
SECTION 3. UNDERSTANDING THE TREND IN WORST CASE NEEDS

24 WORST CASE HOUSING NEEDS 2017 REPORT TO CONGRESS

Appendix A Detailed Data on Housing Problems and Supply of Affordable Housing
Table A-1A� Housing Conditions of Renter Households by Relative Income, 2013 and 2015 ................................................................................ 27
Table A-1B� Housing Conditions of Owner Households by Relative Income, 2013 and 2015 .................................................................................28
Table A-2A� Housing Conditions of Renters and Owners, 2001–2015— Number of Households................................................................... 29
Table A-2B� Housing Conditions of Renters and Owners, 2001–2015— Percentage of Households ..............................................................30
Table A-3� Housing Conditions of Unassisted Renter Households by Relative Income, 2013 and 2015 ..................................................... 31
Table A-4� Incidence of Housing Problems Among Renters by Relative Income, 2013 and 2015 .................................................................. 32
Table A-5A� Incidence of Housing Problems Among Very Low-Income Renters by Household Type, 2013 and 2015 .................................. 35
Table A-5B� Incidence of Housing Problems Among Very Low-Income Renter Households Containing Persons With Disabilities* by Household Type, 2013 and 2015 .................................................... 37
Table A-6A� Housing Problems and Characteristics of Very Low-Income Renters by Household Type, 2015 .................................................. 39
Table A-6B� Housing Problems and Characteristics of Extremely Low-Income Renters by Household Type, 2015 ............................. 41
Table A-7� Housing Problems and Characteristics of Very Low-Income Worst Case Renters by Household Type, 2015 ............................... 43
Table A-8� Housing Problems and Characteristics of Extremely Low-Income Worst Case Renters by Household Type, 2015 ............................... 45
Table A-9� Incidence of Housing Problems Among Very Low-Income Renters by Race and Ethnicity, 2013 and 2015—Number and Percentage . 47
25WORST CASE HOUSING NEEDS 2017 REPORT TO CONGRESS
APPENDIX A. DETAILED DATA ON HOUSING PROBLEMS AND SUPPLY OF AFFORDABLE HOUSING

Table A-10� Incidence of Housing Problems Among Very Low-Income Renters by Region, 2013 and 2015—Number and Percentage ...... 49
Table A-11A� Incidence of Housing Problems Among Very Low-Income Renters by Metropolitan Location, 2013 and 2015—Number and Percentage . 51
Table A-11B� Housing Conditions of Renter Households by Relative Income, Sampled Metropolitan Areas, 2015 ................................................. 54
Table A-12� Households Occupying Rental Units by Affordability of Rent and Income of Occupants, 2013 and 2015 ............................................ 59
Table A-13� Renters and Rental Units Affordable and Available to Them by Relative Income, 2001–2015 ..............................................................60
Table A-14� Average Income and Average Gross Rent of Renter Households by Relative Income, 2013 and 2015 ................................................ 61
Table A-15� Housing Conditions of Households Having Nonelderly People With Disabilities by Disability Type, 2013 and 2015 ......................... 62
26 WORST CASE HOUSING NEEDS 2017 REPORT TO CONGRESS
APPENDIX A. DETAILED DATA ON HOUSING PROBLEMS AND SUPPLY OF AFFORDABLE HOUSING

Table A-1A� Housing Conditions of Renter Households by Relative Income, 2013 and 2015
Household Income as Percentage of HUD-Adjusted Area Median Family Income
2015 0–30% >30–50% >50–80% >80–120% >120% All Incomes
Total households (thousands) 11,290 7,945 8,696 7,051 8,948 43,930
Unassisted with severe problems 5,821 2,482 880 258 210 9,651
Unassisted with nonsevere problems only
779 3,344 3,755 1,684 893 10,455
Unassisted with no problems 988 1,027 3,623 4,908 7,720 18,265
Assisted 3,702 1,092 438 202 125 5,559
Any with severe problems 7,500 2,634 896 263 215 11,509
Rent burden >50% of income 7,385 2,525 748 207 124 10,988
Severely inadequate housing 352 157 161 60 97 828
Any with nonsevere problems only 1,776 3,848 3,919 1,712 899 12,153
Rent burden >30–50% of income 1,511 3,611 3,296 1,276 424 10,118
Moderately inadequate housing 357 452 506 336 376 2,027
Crowded housing 122 358 361 157 122 1,120
Any with no problems 2,014 1,463 3,881 5,077 7,834 20,269
2013
Total households (thousands) 11,104 7,397 7,815 6,683 7,274 40,273
Unassisted with severe problems 5,607 2,114 674 279 201 8,874
Unassisted with nonsevere problems only
779 3,185 3,182 1,370 717 9,233
Unassisted with no problems 1,046 1,011 3,502 4,841 6,236 16,636
Assisted 3,672 1,087 457 194 120 5,530
Any with severe problems 7,116 2,237 720 287 205 10,566
Rent burden >50% of income 6,937 2,072 502 161 72 9,744
Severely inadequate housing 445 217 225 131 138 1,155
Any with nonsevere problems only 1,809 3,638 3,327 1,406 726 10,906
Rent burden >30–50% of income 1,515 3,403 2,843 952 310 9,022
Moderately inadequate housing 373 371 416 339 342 1,840
Crowded housing 173 345 296 159 92 1,066
Any with no problems 2,179 1,522 3,768 4,990 6,343 18,801
Source: HUD-PD&R tabulations of the American Housing Survey
27WORST CASE HOUSING NEEDS 2017 REPORT TO CONGRESS
APPENDIX A. DETAILED DATA ON HOUSING PROBLEMS AND SUPPLY OF AFFORDABLE HOUSING
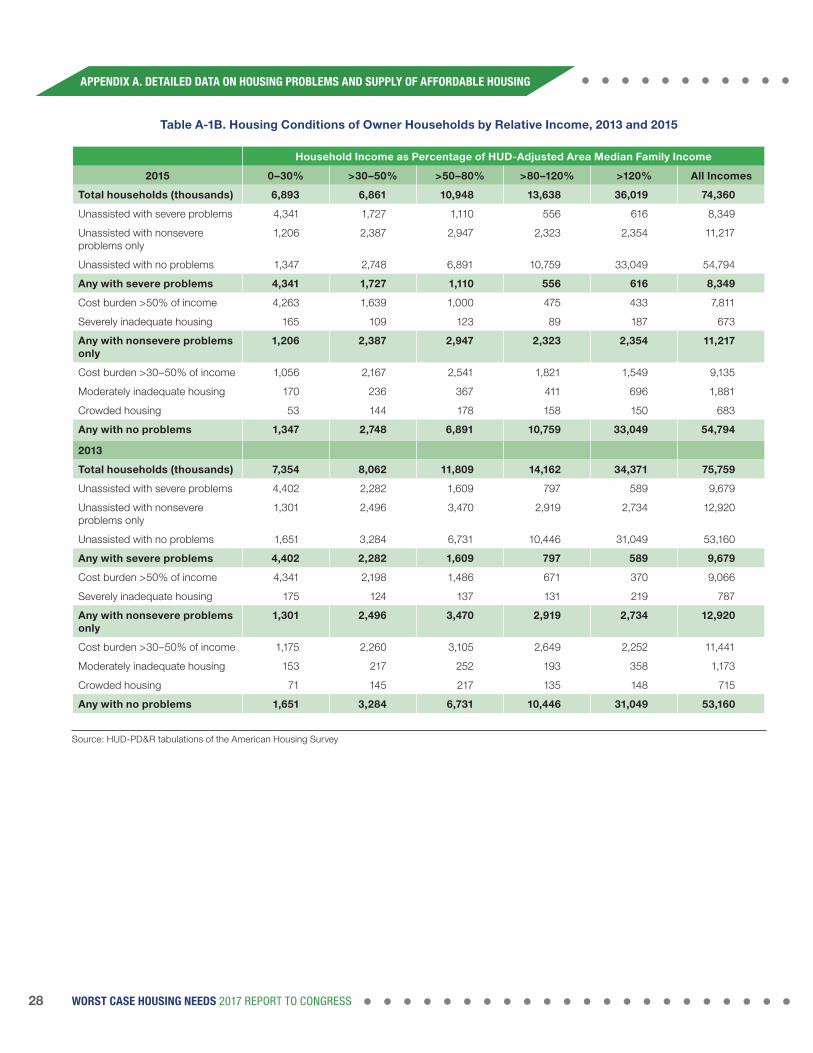
Table A-1B� Housing Conditions of Owner Households by Relative Income, 2013 and 2015
Household Income as Percentage of HUD-Adjusted Area Median Family Income
2015 0–30% >30–50% >50–80% >80–120% >120% All Incomes
Total households (thousands) 6,893 6,861 10,948 13,638 36,019 74,360
Unassisted with severe problems 4,341 1,727 1,110 556 616 8,349
Unassisted with nonsevere problems only
1,206 2,387 2,947 2,323 2,354 11,217
Unassisted with no problems 1,347 2,748 6,891 10,759 33,049 54,794
Any with severe problems 4,341 1,727 1,110 556 616 8,349
Cost burden >50% of income 4,263 1,639 1,000 475 433 7,811
Severely inadequate housing 165 109 123 89 187 673
Any with nonsevere problems only
1,206 2,387 2,947 2,323 2,354 11,217
Cost burden >30–50% of income 1,056 2,167 2,541 1,821 1,549 9,135
Moderately inadequate housing 170 236 367 411 696 1,881
Crowded housing 53 144 178 158 150 683
Any with no problems 1,347 2,748 6,891 10,759 33,049 54,794
2013
Total households (thousands) 7,354 8,062 11,809 14,162 34,371 75,759
Unassisted with severe problems 4,402 2,282 1,609 797 589 9,679
Unassisted with nonsevere problems only
1,301 2,496 3,470 2,919 2,734 12,920
Unassisted with no problems 1,651 3,284 6,731 10,446 31,049 53,160
Any with severe problems 4,402 2,282 1,609 797 589 9,679
Cost burden >50% of income 4,341 2,198 1,486 671 370 9,066
Severely inadequate housing 175 124 137 131 219 787
Any with nonsevere problems only
1,301 2,496 3,470 2,919 2,734 12,920
Cost burden >30–50% of income 1,175 2,260 3,105 2,649 2,252 11,441
Moderately inadequate housing 153 217 252 193 358 1,173
Crowded housing 71 145 217 135 148 715
Any with no problems 1,651 3,284 6,731 10,446 31,049 53,160
Source: HUD-PD&R tabulations of the American Housing Survey
28 WORST CASE HOUSING NEEDS 2017 REPORT TO CONGRESS
APPENDIX A. DETAILED DATA ON HOUSING PROBLEMS AND SUPPLY OF AFFORDABLE HOUSING
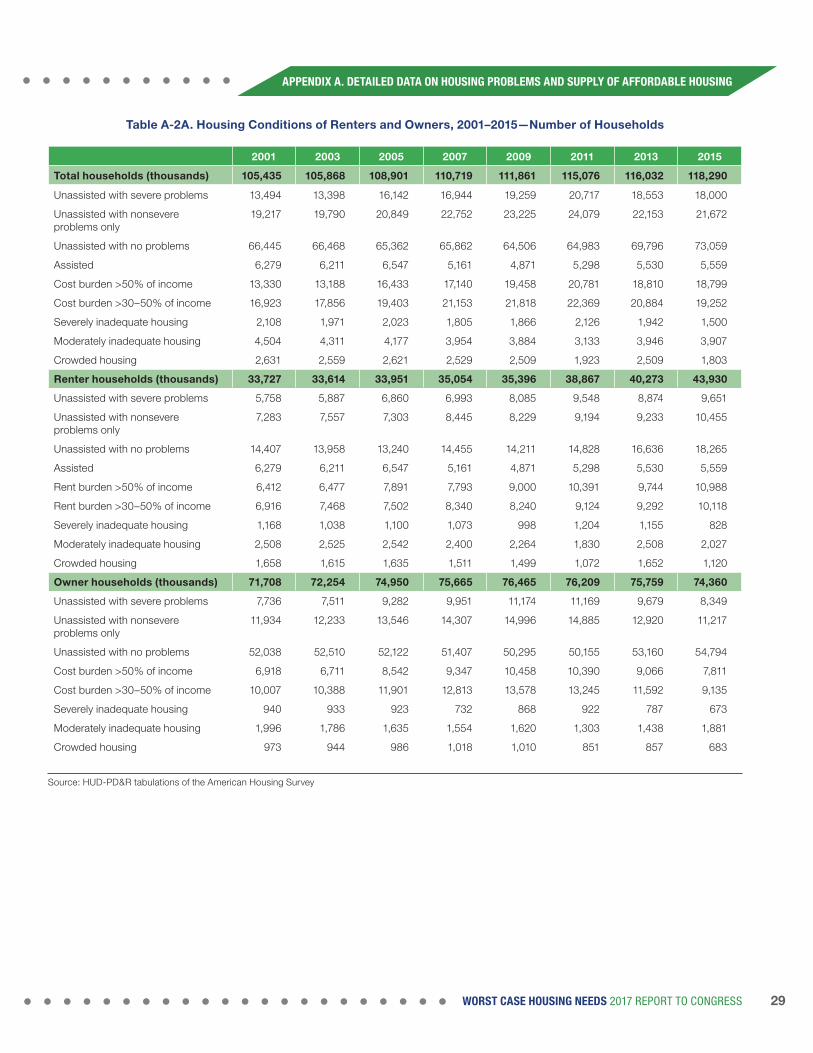
Table A-2A� Housing Conditions of Renters and Owners, 2001–2015—Number of Households
2001 2003 2005 2007 2009 2011 2013 2015
Total households (thousands) 105,435 105,868 108,901 110,719 111,861 115,076 116,032 118,290
Unassisted with severe problems 13,494 13,398 16,142 16,944 19,259 20,717 18,553 18,000
Unassisted with nonsevere problems only
19,217 19,790 20,849 22,752 23,225 24,079 22,153 21,672
Unassisted with no problems 66,445 66,468 65,362 65,862 64,506 64,983 69,796 73,059
Assisted 6,279 6,211 6,547 5,161 4,871 5,298 5,530 5,559
Cost burden >50% of income 13,330 13,188 16,433 17,140 19,458 20,781 18,810 18,799
Cost burden >30–50% of income 16,923 17,856 19,403 21,153 21,818 22,369 20,884 19,252
Severely inadequate housing 2,108 1,971 2,023 1,805 1,866 2,126 1,942 1,500
Moderately inadequate housing 4,504 4,311 4,177 3,954 3,884 3,133 3,946 3,907
Crowded housing 2,631 2,559 2,621 2,529 2,509 1,923 2,509 1,803
Renter households (thousands) 33,727 33,614 33,951 35,054 35,396 38,867 40,273 43,930
Unassisted with severe problems 5,758 5,887 6,860 6,993 8,085 9,548 8,874 9,651
Unassisted with nonsevere problems only
7,283 7,557 7,303 8,445 8,229 9,194 9,233 10,455
Unassisted with no problems 14,407 13,958 13,240 14,455 14,211 14,828 16,636 18,265
Assisted 6,279 6,211 6,547 5,161 4,871 5,298 5,530 5,559
Rent burden >50% of income 6,412 6,477 7,891 7,793 9,000 10,391 9,744 10,988
Rent burden >30–50% of income 6,916 7,468 7,502 8,340 8,240 9,124 9,292 10,118
Severely inadequate housing 1,168 1,038 1,100 1,073 998 1,204 1,155 828
Moderately inadequate housing 2,508 2,525 2,542 2,400 2,264 1,830 2,508 2,027
Crowded housing 1,658 1,615 1,635 1,511 1,499 1,072 1,652 1,120
Owner households (thousands) 71,708 72,254 74,950 75,665 76,465 76,209 75,759 74,360
Unassisted with severe problems 7,736 7,511 9,282 9,951 11,174 11,169 9,679 8,349
Unassisted with nonsevere problems only
11,934 12,233 13,546 14,307 14,996 14,885 12,920 11,217
Unassisted with no problems 52,038 52,510 52,122 51,407 50,295 50,155 53,160 54,794
Cost burden >50% of income 6,918 6,711 8,542 9,347 10,458 10,390 9,066 7,811
Cost burden >30–50% of income 10,007 10,388 11,901 12,813 13,578 13,245 11,592 9,135
Severely inadequate housing 940 933 923 732 868 922 787 673
Moderately inadequate housing 1,996 1,786 1,635 1,554 1,620 1,303 1,438 1,881
Crowded housing 973 944 986 1,018 1,010 851 857 683
Source: HUD-PD&R tabulations of the American Housing Survey
29WORST CASE HOUSING NEEDS 2017 REPORT TO CONGRESS
APPENDIX A. DETAILED DATA ON HOUSING PROBLEMS AND SUPPLY OF AFFORDABLE HOUSING

Table A-2B� Housing Conditions of Renters and Owners, 2001-2015—Percentage of Households
2001 2003 2005 2007 2009 2011 2013 2015
Total households 100�0 100�0 100�0 100�0 100�0 100�0 100�0 100�0
Unassisted with severe problems 12.8 12.7 14.8 15.3 17.2 18.0 16.0 15.2
Unassisted with nonsevere problems only
18.2 18.7 19.1 20.5 20.8 20.9 19.1 18.3
Unassisted with no problems 63.0 62.8 60.0 59.5 57.7 56.5 60.2 61.8
Assisted 6.0 5.9 6.0 4.7 4.4 4.6 4.8 4.7
Cost burden >50% of income 12.6 12.5 15.1 15.5 17.4 18.1 16.2 15.9
Cost burden >30–50% of income 16.1 16.9 17.8 19.1 19.5 19.4 18.0 16.3
Severely inadequate housing 2.0 1.9 1.9 1.6 1.7 1.8 1.7 1.3
Moderately inadequate housing 4.3 4.1 3.8 3.6 3.5 2.7 3.4 3.3
Crowded housing 2.5 2.4 2.4 2.3 2.2 1.7 2.2 1.5
Renter households 100�0 100�0 100�0 100�0 100�0 100�0 100�0 100�0
Unassisted with severe problems 17.1 17.5 20.2 19.9 22.8 24.6 22.0 22.0
Unassisted with nonsevere problems only
21.6 22.5 21.5 24.1 23.2 23.7 22.9 23.8
Unassisted with no problems 42.7 41.5 39.0 41.2 40.1 38.2 41.3 41.6
Assisted 18.6 18.5 19.3 14.7 13.8 13.6 13.7 12.7
Rent burden >50% of income 19.0 19.3 23.2 22.2 25.4 26.7 24.2 25.0
Rent burden >30–50% of income 20.5 22.2 22.1 23.8 23.3 23.5 23.1 23.0
Severely inadequate housing 3.5 3.1 3.2 3.1 2.8 3.1 2.9 1.9
Moderately inadequate housing 7.4 7.5 7.5 6.8 6.4 4.7 6.2 4.6
Crowded housing 4.9 4.8 4.8 4.3 4.2 2.8 4.1 2.6
Owner households 100�0 100�0 100�0 100�0 100�0 100�0 100�0 100�0
Unassisted with severe problems 10.8 10.4 12.4 13.2 14.6 14.7 12.8 11.2
Unassisted with nonsevere problems only
16.6 16.9 18.1 18.9 19.6 19.5 17.1 15.1
Unassisted with no problems 72.6 72.7 69.5 67.9 65.8 65.8 70.2 73.7
Cost burden >50% of income 9.6 9.3 11.4 12.4 13.7 13.6 12.0 10.5
Cost burden >30–50% of income 14.0 14.4 15.9 16.9 17.8 17.4 15.3 12.3
Severely inadequate housing 1.3 1.3 1.2 1.0 1.1 1.2 1.0 0.9
Moderately inadequate housing 2.8 2.5 2.2 2.1 2.1 1.7 1.9 2.5
Crowded housing 1.4 1.3 1.3 1.3 1.3 1.1 1.1 0.9
Source: HUD-PD&R tabulations of the American Housing Survey
30 WORST CASE HOUSING NEEDS 2017 REPORT TO CONGRESS
APPENDIX A. DETAILED DATA ON HOUSING PROBLEMS AND SUPPLY OF AFFORDABLE HOUSING

Table A-3� Housing Conditions of Unassisted Renter Households by Relative Income, 2013 and 2015
Household Income as Percentage of HUD-Adjusted Area Median Family Income
2015 0–30% >30–50% >50–80% >80–120% >120% All Incomes
Total unassisted households (thousands)
7,588 6,853 8,258 6,849 8,823 38,371
Any with severe problems 5,821 2,482 880 258 210 9,651
Rent burden >50% of income 5,756 2,395 740 202 124 9,216
[Rent above FMR] 1,919 1,437 672 202 124 4,354
Severely inadequate housing 234 130 153 59 92 669
Any with nonsevere problems only
779 3,344 3,755 1,684 893 10,455
Rent burden >30–50% of income
615 3,150 3,170 1,258 422 8,616
Moderately inadequate housing 216 376 471 329 372 1,764
Crowded housing 75 325 344 154 121 1,020
Any with no problems 988 1,027 3,623 4,908 7,720 18,265
2013
Total unassisted households (thousands)
7,432 6,310 7,357 6,490 7,155 34,743
Any with severe problems 5,607 2,114 674 279 201 8,874
Rent burden >50% of income 5,530 1,967 473 157 72 8,200
[Rent above FMR] 1,548 1,168 419 157 72 3,366
Severely inadequate housing 301 195 208 126 133 963
Any with nonsevere problems only
779 3,185 3,182 1,370 717 9,233
Rent burden >30–50% of income
613 3,007 2,735 928 304 7,587
Moderately inadequate housing 226 302 382 329 339 1,578
Crowded housing 102 320 276 157 91 946
Any with no problems 1,046 1,011 3,502 4,841 6,236 16,636
FMR = Fair Market Rent Source: HUD-PD&R tabulations of the American Housing Survey
31WORST CASE HOUSING NEEDS 2017 REPORT TO CONGRESS
APPENDIX A. DETAILED DATA ON HOUSING PROBLEMS AND SUPPLY OF AFFORDABLE HOUSING

Table A-4� Incidence of Housing Problems Among Renters by Relative Income, 2013 and 2015
Number Percentage
2013 2015 2013 2015
Renter households (thousands) 40,273 43,930 100�0 100�0
Unassisted with severe problems 8,874 9,651 22.0 22.0
Unassisted with nonsevere problems only 9,233 10,455 22.9 23.8
Unassisted with no problems 16,636 18,265 41.3 41.6
Assisted 5,530 5,559 13.7 12.7
Any with severe problems 10,566 11,509 26�2 26�2
Rent burden >50% of income 9,744 10,988 24.2 25.0
Severely inadequate housing 1,155 828 2.9 1.9
[Rent burden only] 8,743 9,772 21.7 22.2
Any with nonsevere problems only 10,906 12,153 27�1 27�7
Rent burden >30–50% of income 9,022 10,118 22.4 23.0
Moderately inadequate housing 1,840 2,027 4.6 4.6
Crowded housing 1,066 1,120 2.6 2.5
[Rent burden only] 8,088 9,098 20.1 20.7
Any with no problems 18,801 20,269 46�7 46�1
Income 0-30% HAMFI (thousands) 11,104 11,290 100�0 100�0
Unassisted with severe problems 5,607 5,821 50.5 51.6
Unassisted with nonsevere problems only 779 779 7.0 6.9
Unassisted with no problems 1,046 988 9.4 8.8
Assisted 3,672 3,702 33.1 32.8
Any with severe problems 7,116 7,500 64�1 66�4
Rent burden >50% of income 6,937 7,385 62.5 65.4
Severely inadequate housing 445 352 4.0 3.1
[Rent burden only] 6,168 6,500 55.5 57.6
Any with nonsevere problems only 1,809 1,776 16�3 15�7
Rent burden >30–50% of income 1,515 1,511 13.6 13.4
Moderately inadequate housing 373 357 3.4 3.2
Crowded housing 173 122 1.6 1.1
[Rent burden only] 1,278 1,312 11.5 11.6
Any with no problems 2,179 2,014 19�6 17�8
(continued)
32 WORST CASE HOUSING NEEDS 2017 REPORT TO CONGRESS
APPENDIX A. DETAILED DATA ON HOUSING PROBLEMS AND SUPPLY OF AFFORDABLE HOUSING
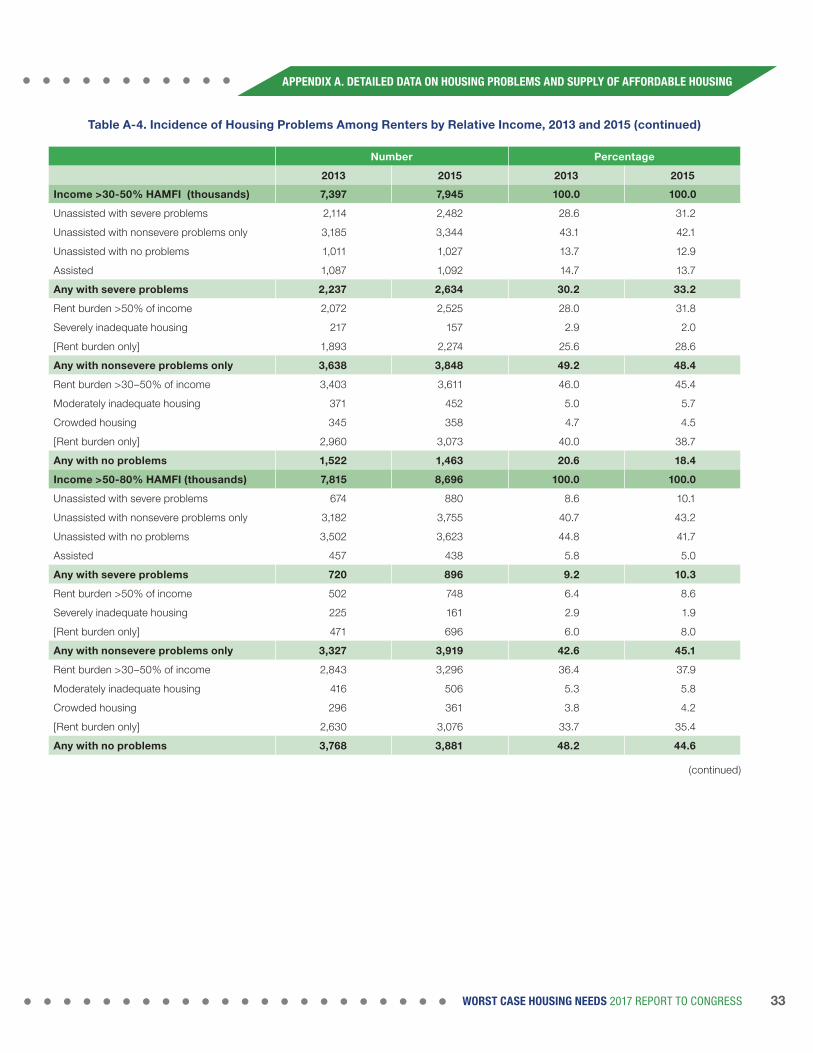
Table A-4� Incidence of Housing Problems Among Renters by Relative Income, 2013 and 2015 (continued)
Number Percentage
2013 2015 2013 2015
Income >30-50% HAMFI (thousands) 7,397 7,945 100�0 100�0
Unassisted with severe problems 2,114 2,482 28.6 31.2
Unassisted with nonsevere problems only 3,185 3,344 43.1 42.1
Unassisted with no problems 1,011 1,027 13.7 12.9
Assisted 1,087 1,092 14.7 13.7
Any with severe problems 2,237 2,634 30�2 33�2
Rent burden >50% of income 2,072 2,525 28.0 31.8
Severely inadequate housing 217 157 2.9 2.0
[Rent burden only] 1,893 2,274 25.6 28.6
Any with nonsevere problems only 3,638 3,848 49�2 48�4
Rent burden >30–50% of income 3,403 3,611 46.0 45.4
Moderately inadequate housing 371 452 5.0 5.7
Crowded housing 345 358 4.7 4.5
[Rent burden only] 2,960 3,073 40.0 38.7
Any with no problems 1,522 1,463 20�6 18�4
Income >50-80% HAMFI (thousands) 7,815 8,696 100�0 100�0
Unassisted with severe problems 674 880 8.6 10.1
Unassisted with nonsevere problems only 3,182 3,755 40.7 43.2
Unassisted with no problems 3,502 3,623 44.8 41.7
Assisted 457 438 5.8 5.0
Any with severe problems 720 896 9�2 10�3
Rent burden >50% of income 502 748 6.4 8.6
Severely inadequate housing 225 161 2.9 1.9
[Rent burden only] 471 696 6.0 8.0
Any with nonsevere problems only 3,327 3,919 42�6 45�1
Rent burden >30–50% of income 2,843 3,296 36.4 37.9
Moderately inadequate housing 416 506 5.3 5.8
Crowded housing 296 361 3.8 4.2
[Rent burden only] 2,630 3,076 33.7 35.4
Any with no problems 3,768 3,881 48�2 44�6
(continued)
33WORST CASE HOUSING NEEDS 2017 REPORT TO CONGRESS
APPENDIX A. DETAILED DATA ON HOUSING PROBLEMS AND SUPPLY OF AFFORDABLE HOUSING
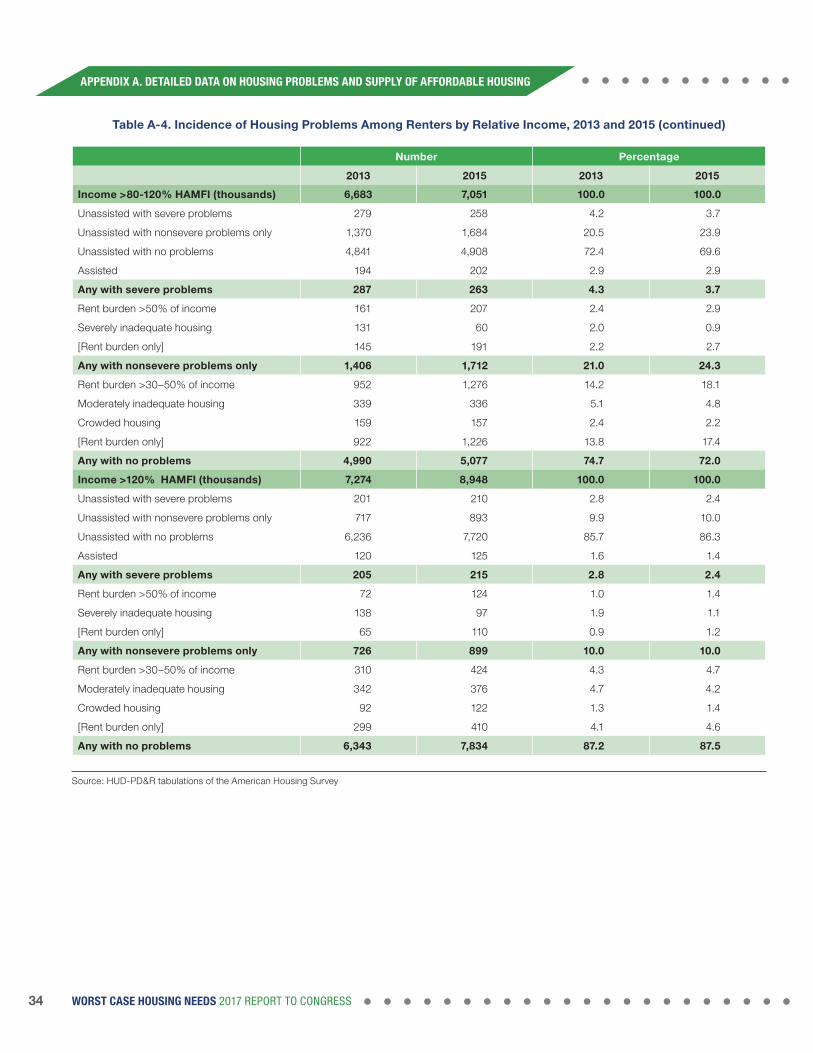
Table A-4� Incidence of Housing Problems Among Renters by Relative Income, 2013 and 2015 (continued)
Number Percentage
2013 2015 2013 2015
Income >80-120% HAMFI (thousands) 6,683 7,051 100�0 100�0
Unassisted with severe problems 279 258 4.2 3.7
Unassisted with nonsevere problems only 1,370 1,684 20.5 23.9
Unassisted with no problems 4,841 4,908 72.4 69.6
Assisted 194 202 2.9 2.9
Any with severe problems 287 263 4�3 3�7
Rent burden >50% of income 161 207 2.4 2.9
Severely inadequate housing 131 60 2.0 0.9
[Rent burden only] 145 191 2.2 2.7
Any with nonsevere problems only 1,406 1,712 21�0 24�3
Rent burden >30–50% of income 952 1,276 14.2 18.1
Moderately inadequate housing 339 336 5.1 4.8
Crowded housing 159 157 2.4 2.2
[Rent burden only] 922 1,226 13.8 17.4
Any with no problems 4,990 5,077 74�7 72�0
Income >120% HAMFI (thousands) 7,274 8,948 100�0 100�0
Unassisted with severe problems 201 210 2.8 2.4
Unassisted with nonsevere problems only 717 893 9.9 10.0
Unassisted with no problems 6,236 7,720 85.7 86.3
Assisted 120 125 1.6 1.4
Any with severe problems 205 215 2�8 2�4
Rent burden >50% of income 72 124 1.0 1.4
Severely inadequate housing 138 97 1.9 1.1
[Rent burden only] 65 110 0.9 1.2
Any with nonsevere problems only 726 899 10�0 10�0
Rent burden >30–50% of income 310 424 4.3 4.7
Moderately inadequate housing 342 376 4.7 4.2
Crowded housing 92 122 1.3 1.4
[Rent burden only] 299 410 4.1 4.6
Any with no problems 6,343 7,834 87�2 87�5
Source: HUD-PD&R tabulations of the American Housing Survey
34 WORST CASE HOUSING NEEDS 2017 REPORT TO CONGRESS
APPENDIX A. DETAILED DATA ON HOUSING PROBLEMS AND SUPPLY OF AFFORDABLE HOUSING

Table A-5A� Incidence of Housing Problems Among Very Low-Income Renters by Household Type, 2013 and 2015
Number Percentage
Household type 2013 2015 2013 2015
All household types (thousands) 18,500 19,235 100�0 100�0
Elderly without children (thousands) 3,955 4,652 100�0 100�0
Unassisted with severe problems 1,471 1,853 37.2 39.8
Unassisted with nonsevere problems only 567 722 14.3 15.5
Unassisted with no problems 510 519 12.9 11.2
Assisted 1,408 1,559 35.6 33.5
Any with severe problems 1,915 2,373 48�4 51�0
Rent burden>50% of income 1,847 2,335 46.7 50.2
Severely inadequate housing 119 86 3.0 1.8
[Rent burden only] 1,696 2,070 42.9 44.5
Any with nonsevere problems only 1,004 1,242 25�4 26�7
Rent burden >30–50% of income 942 1,149 23.8 24.7
Moderately inadequate housing 118 161 3.0 3.5
Crowded housing 1 (s) 0.0 (s)
[Rent burden only] 885 1,075 22.4 23.1
Any with no problems 1,036 1,038 26�2 22�3
Families with children (thousands) 7,023 6,962 100�0 100�0
Unassisted with severe problems 2,833 2,888 40.3 41.5
Unassisted with nonsevere problems only 1,797 1,796 25.6 25.8
Unassisted with no problems 552 552 7.9 7.9
Assisted 1,841 1,726 26.2 24.8
Any with severe problems 3,478 3,614 49�5 51�9
Rent burden >50% of income 3,349 3,534 47.7 50.8
Severely inadequate housing 263 207 3.7 3.0
[Rent burden only] 2,977 3,076 42.4 44.2
Any with nonsevere problems only 2,394 2,340 34�1 33�6
Rent burden >30–50% of income 2,089 2,088 29.7 30.0
Moderately inadequate housing 290 333 4.1 4.8
Crowded housing 513 446 7.3 6.4
[Rent burden only] 1,642 1,607 23.4 23.1
Any with no problems 1,151 1,008 16�4 14�5
(continued)
35WORST CASE HOUSING NEEDS 2017 REPORT TO CONGRESS
APPENDIX A. DETAILED DATA ON HOUSING PROBLEMS AND SUPPLY OF AFFORDABLE HOUSING

Table A-5A� Incidence of Housing Problems Among Very Low-Income Renters by Household Type, 2013 and 2015 (continued)
Number Percentage
Household type 2013 2015 2013 2015
Other family households (thousands) 1,720 1,726 100�0 100�0
Unassisted with severe problems 741 805 43.1 46.6
Unassisted with nonsevere problems only 442 429 25.7 24.9
Unassisted with no problems 194 203 11.3 11.8
Assisted 343 289 19.9 16.7
Any with severe problems 840 922 48�8 53�4
Rent burden >50% of income 808 899 47.0 52.1
Severely inadequate housing 56 57 3.3 3.3
[Rent burden only] 736 801 42.8 46.4
Any with nonsevere problems only 560 527 32�6 30�5
Rent burden >30–50% of income 526 488 30.6 28.3
Moderately inadequate housing 61 79 3.5 4.6
Crowded housing 4 26 0.2 1.5
[Rent burden only] 495 427 28.8 24.7
Any with no problems 320 277 18�6 16�1
Other nonfamily households (thousands) 5,802 5,895 100�0 100�0
Unassisted with severe problems 2,676 2,758 46.1 46.8
Unassisted with nonsevere problems only 1,158 1,176 20.0 19.9
Unassisted with no problems 801 740 13.8 12.6
Assisted 1,167 1,221 20.1 20.7
Any with severe problems 3,119 3,225 53�8 54�7
Rent burden >50% of income 3,005 3,142 51.8 53.3
Severely inadequate housing 223 159 3.8 2.7
[Rent burden only] 2,652 2,827 45.7 48.0
Any with nonsevere problems only 1,489 1,514 25�7 25�7
Rent burden >30–50% of income 1,361 1,397 23.5 23.7
Moderately inadequate housing 274 236 4.7 4.0
Crowded housing 1 (s) 0.0 (s)
[Rent burden only] 1,215 1,277 20.9 21.7
Any with no problems 1,193 1,155 20�6 19�6
(s) = Unweighted counts of 5 or fewer suppressed. Source: HUD-PD&R tabulations of the American Housing Survey
36 WORST CASE HOUSING NEEDS 2017 REPORT TO CONGRESS
APPENDIX A. DETAILED DATA ON HOUSING PROBLEMS AND SUPPLY OF AFFORDABLE HOUSING

Table A-5B� Incidence of Housing Problems Among Very Low-Income Renter Households Containing Persons With Disabilities* by Household Type, 2013 and 2015
Number Percentage
Household type 2013 2015 2013 2015
All household types (thousands) 2,804 3,529 100�0 100�0
Elderly without children (thousands) 110 155 100�0 100�0
Unassisted with severe problems 41 61 37.3 39.7
Unassisted with nonsevere problems only 26 44 23.6 28.2
Unassisted with no problems 14 18 12.7 11.6
Assisted 29 32 26.4 20.6
Any with severe problems 45 75 40�9 48�2
Rent burden>50% of income 44 71 40.0 46.1
Severely inadequate housing 5 (s) 4.5 (s)
[Rent burden only] 37 65 33.6 42.4
Any with nonsevere problems only 39 52 35�5 33�5
Rent burden >30–50% of income 38 50 34.5 32.5
Moderately inadequate housing 6 3 5.5 2.2
Crowded housing 0 0 0.0 0.0
[Rent burden only] 33 48 30.0 31.3
Any with no problems 26 28 23�6 18�3
Families with children (thousands) 1,018 1,295 100�0 100�0
Unassisted with severe problems 397 538 39.0 41.5
Unassisted with nonsevere problems only 192 264 18.9 20.4
Unassisted with no problems 79 68 7.8 5.2
Assisted 350 425 34.4 32.8
Any with severe problems 523 722 51�4 55�7
Rent burden >50% of income 514 682 50.5 52.7
Severely inadequate housing 35 82 3.4 6.3
[Rent burden only] 417 541 41.0 41.8
Any with nonsevere problems only 323 403 31�7 31�1
Rent burden >30–50% of income 278 358 27.3 27.6
Moderately inadequate housing 50 74 4.9 5.7
Crowded housing 65 70 6.4 5.4
[Rent burden only] 224 268 22.0 20.7
Any with no problems 172 170 16�9 13�1
(continued)
37WORST CASE HOUSING NEEDS 2017 REPORT TO CONGRESS
APPENDIX A. DETAILED DATA ON HOUSING PROBLEMS AND SUPPLY OF AFFORDABLE HOUSING

Table A-5B� Incidence of Housing Problems Among Very Low-Income Renter Households Containing Persons With Disabilities* by Household Type, 2013 and 2015 (continued)
Number Percentage
Household type 2013 2015 2013 2015
Other family households (thousands) 420 453 100�0 100�0
Unassisted with severe problems 196 177 46.7 39.1
Unassisted with nonsevere problems only 75 81 17.9 17.9
Unassisted with no problems 34 70 8.1 15.5
Assisted 114 124 27.1 27.4
Any with severe problems 232 227 55�2 50�1
Rent burden >50% of income 224 211 53.3 46.7
Severely inadequate housing 17 36 4.0 8.0
[Rent burden only] 194 175 46.2 38.5
Any with nonsevere problems only 110 126 26�2 27�8
Rent burden >30–50% of income 103 116 24.5 25.6
Moderately inadequate housing 22 22 5.2 4.9
Crowded housing 0 (s) 0.0 (s)
[Rent burden only] 88 101 21.0 22.3
Any with no problems 78 100 18�6 22�0
Other nonfamily households (thousands) 1,257 1,627 100�0 100�0
Unassisted with severe problems 452 614 36.0 37.8
Unassisted with nonsevere problems only 216 234 17.2 14.4
Unassisted with no problems 95 106 7.6 6.5
Assisted 494 673 39.3 41.4
Any with severe problems 639 863 50�8 53�1
Rent burden >50% of income 603 841 48.0 51.7
Severely inadequate housing 60 54 4.8 3.3
[Rent burden only] 518 739 41.2 45.4
Any with nonsevere problems only 354 436 28�2 26�8
Rent burden >30–50% of income 320 408 25.5 25.1
Moderately inadequate housing 51 61 4.1 3.8
Crowded housing 0 (s) 0.0 (s)
[Rent burden only] 302 374 24.0 23.0
Any with no problems 264 327 21�0 20�1
* Elderly persons with disabilities were excluded. (s) = Unweighted counts of 5 or fewer suppressed. Source: HUD-PD&R tabulations of the American Housing Survey
38 WORST CASE HOUSING NEEDS 2017 REPORT TO CONGRESS
APPENDIX A. DETAILED DATA ON HOUSING PROBLEMS AND SUPPLY OF AFFORDABLE HOUSING

Table A-6A� Housing Problems and Characteristics of Very Low-Income Renters by Household Type, 2015
TotalElderly, No
ChildrenFamilies with
Children Other FamiliesOther Nonfamily
Households
Renter households (thousands)
19,235 4,652 6,962 1,726 5,895
Number of children 14,244 0 14,244 0 0
Number of persons 44,257 6,101 26,619 4,289 7,248
Children/household 0.74 0.00 2.05 0.00 0.00
Persons/household 2.30 1.31 3.82 2.48 1.23
Unassisted with severe problems
8,303 1,853 2,888 805 2,758
Unassisted with nonsevere problems only
4,123 722 1,796 429 1,176
Unassisted with no problems
2,015 519 552 203 740
Assisted 4,794 1,559 1,726 289 1,221
Any with severe problems
10,134 2,373 3,614 922 3,225
Rent burden >50% of income
9,910 2,335 3,534 899 3,142
Severely inadequate housing
509 86 207 57 159
[Rent burden only] 8,774 2,070 3,076 801 2,827
Any with nonsevere problems only
5,624 1,242 2,340 527 1,514
Rent burden >30–50% of income
5,121 1,149 2,088 488 1,397
Moderately inadequate housing
809 161 333 79 236
Crowded housing 480 (s) 446 26 (s)
[Rent burden only] 4,385 1,075 1,607 427 1,277
Any with no problems 3,478 1,038 1,008 277 1,155
(continued)
39WORST CASE HOUSING NEEDS 2017 REPORT TO CONGRESS
APPENDIX A. DETAILED DATA ON HOUSING PROBLEMS AND SUPPLY OF AFFORDABLE HOUSING

Table A-6A� Housing Problems and Characteristics of Very Low-Income Renters by Household Type, 2015 (continued)
TotalElderly, No
ChildrenFamilies with
Children Other FamiliesOther Nonfamily
Households
Other characteristics
One person in household 8,283 3,501 (s) 0 4,780
Two spouse household 3,688 648 2,258 782 0
Female householder 12,053 3,077 4,953 973 3,049
Minority householder 10,762 1,892 4,807 1,099 2,963
Welfare/SSI income 3,720 925 1,499 330 967
Social security income 4,814 3,529 496 254 535
Income below 50% poverty 4,671 875 1,973 309 1,514
Income below poverty 10,947 2,265 4,557 868 3,257
Income below 150% of poverty
16,074 3,619 6,392 1,353 4,709
High school graduate 14,251 3,229 4,959 1,300 4,763
Two+ years post high school
3,803 891 1,066 341 1,504
Earnings at minimum wage:
At least half time 8,758 453 4,485 1,057 2,763
At least full time 6,313 282 3,415 767 1,849
Earnings main source of income
9,698 452 4,875 1,120 3,251
Housing rated poor 1,301 205 594 107 396
Housing rated good+ 13,929 3,803 4,740 1,264 4,122
Neighborhood rated poor 1,446 216 662 132 436
Neighborhood rated good+ 13,860 3,683 4,772 1,264 4,141
In central cities 9,513 2,082 3,380 877 3,174
Suburbs, urban 5,775 1,526 2,159 522 1,568
Suburbs, rural 1,459 388 553 149 369
Nonmetro 2,488 656 871 178 783
Northeast 3,983 1,216 1,370 381 1,016
Midwest 4,053 953 1,367 258 1,474
South 6,696 1,419 2,458 631 2,188
West 4,503 1,064 1,767 456 1,217
SSI = Supplemental Security Income. (s) = Unweighted counts of 5 or fewer suppressed. Source: HUD-PD&R tabulations of the American Housing Survey
40 WORST CASE HOUSING NEEDS 2017 REPORT TO CONGRESS
APPENDIX A. DETAILED DATA ON HOUSING PROBLEMS AND SUPPLY OF AFFORDABLE HOUSING

Table A-6B� Housing Problems and Characteristics of Extremely Low-Income Renters by Household Type, 2015
TotalElderly, No
ChildrenFamilies with
Children Other FamiliesOther Nonfamily
Households
Renter households (thousands)
11,290 2,909 3,948 850 3,583
Number of children 8,171 0 8,171 0 0
Number of persons 24,701 3,627 14,766 2,032 4,275
Children/household 0.72 0.00 2.07 0.00 0.00
Persons/household 2.19 1.25 3.74 2.39 1.19
Unassisted with severe problems
5,821 1,294 2,125 499 1,903
Unassisted with nonsevere problems only
779 196 278 76 229
Unassisted with no problems
988 252 231 68 436
Assisted 3,702 1,166 1,313 207 1,015
Any with severe problems
7,500 1,762 2,792 602 2,343
Rent burden >50% of income
7,385 1,743 2,753 596 2,293
Severely inadequate housing
352 55 153 36 109
[Rent burden only] 6,500 1,540 2,365 527 2,068
Any with nonsevere problems only
1,776 557 606 136 477
Rent burden >30–50% of income
1,511 504 509 107 391
Moderately inadequate housing
357 82 120 39 116
Crowded housing 122 (s) 113 (s) 0
[Rent burden only] 1,312 469 386 96 361
Any with no problems 2,014 590 550 112 763
(continued)
41WORST CASE HOUSING NEEDS 2017 REPORT TO CONGRESS
APPENDIX A. DETAILED DATA ON HOUSING PROBLEMS AND SUPPLY OF AFFORDABLE HOUSING

Table A-6B� Housing Problems and Characteristics of Extremely Low-Income Renters by Household Type, 2015 (continued)
TotalElderly, No
ChildrenFamilies with
Children Other FamiliesOther Nonfamily
Households
Other characteristics
One person in household 5,346 2,314 (s) 0 3,029
Two spouse household 1,774 337 1,066 371 0
Female householder 7,357 1,982 2,978 499 1,898
Minority householder 6,587 1,327 2,822 561 1,877
Welfare/SSI income 2,865 742 1,094 206 823
Social security income 2,851 2,083 272 107 390
Income below 50% poverty 4,671 875 1,973 309 1,514
Income below poverty 9,816 2,193 3,724 749 3,151
Income below 150% of poverty
11,197 2,854 3,941 839 3,562
High school graduate 8,002 1,917 2,756 609 2,719
Two+ years post high school
2,058 535 549 158 816
Earnings at minimum wage:
At least half time 3,132 113 1,771 341 907
At least full time 1,242 32 873 146 191
Earnings main source of income
4,305 162 2,255 450 1,437
Housing rated poor 859 145 401 59 254
Housing rated good+ 8,034 2,330 2,587 624 2,494
Neighborhood rated poor 941 145 450 76 270
Neighborhood rated good+ 7,909 2,251 2,560 627 2,470
In central cities 5,747 1,386 1,931 457 1,972
Suburbs, urban 3,361 980 1,198 238 944
Suburbs, rural 783 202 296 72 213
Nonmetro 1,399 341 521 82 454
Northeast 2,494 809 829 195 661
Midwest 2,380 579 783 135 883
South 3,884 889 1,397 294 1,304
West 2,532 631 939 227 735
SSI = Supplemental Security Income. (s) = Unweighted counts of 5 or fewer suppressed. Source: HUD-PD&R tabulations of the American Housing Survey
42 WORST CASE HOUSING NEEDS 2017 REPORT TO CONGRESS
APPENDIX A. DETAILED DATA ON HOUSING PROBLEMS AND SUPPLY OF AFFORDABLE HOUSING

Table A-7� Housing Problems and Characteristics of Very Low-Income Worst Case Renters by Household Type, 2015
TotalElderly, No
ChildrenFamilies with
Children Other FamiliesOther Nonfamily
Households
Renter households (thousands)
8,303 1,853 2,888 805 2,758
Number of children 5,933 0 5,933 0 0
Number of persons 19,274 2,532 11,212 1,974 3,556
Children/household 0.71 0 2.05 0 0
Persons/household 2.32 1.37 3.88 2.45 1.29
Unassisted with severe problems
8,303 1,853 2,888 805 2,758
Unassisted with nonsevere problems only
— — — — —
Unassisted with no problems
— — — — —
Assisted — — — — —
Any with severe problems
8,303 1,853 2,888 805 2,758
Rent burden >50% of income
8,150 1,828 2,842 790 2,690
Severely inadequate housing
364 59 132 40 133
[Rent burden only] 7,212 1,607 2,479 715 2,411
Any with nonsevere problems only
— — — — —
Rent burden >30–50% of income
— — — — —
Moderately inadequate housing
— — — — —
Crowded housing — — — — —
[Rent burden only] — — — — —
Any with no problems — — — — —
(continued)
43WORST CASE HOUSING NEEDS 2017 REPORT TO CONGRESS
APPENDIX A. DETAILED DATA ON HOUSING PROBLEMS AND SUPPLY OF AFFORDABLE HOUSING

Table A-7� Housing Problems and Characteristics of Very Low-Income Worst Case Renters by Household Type, 2015 (continued)
TotalElderly, No
ChildrenFamilies with
Children Other FamiliesOther Nonfamily
Households
Other characteristics
One person in household 3,474 1,333 0 0 2,141
Two spouse household 1,728 293 1,067 368 0
Female householder 4,988 1,186 1,952 458 1,392
Minority householder 4,526 702 1,997 523 1,304
Welfare/SSI income 1,380 292 589 121 378
Social security income 1,886 1,407 215 106 158
Income below 50% poverty 2,418 482 995 182 759
Income below poverty 5,495 1,014 2,272 495 1,714
Income below 150% of poverty
7,342 1,506 2,787 692 2,357
High school graduate 6,345 1,403 2,067 589 2,286
Two+ years post high school
1,962 425 512 178 847
Earnings at minimum wage:
At least half time 3,723 190 1,711 479 1,342
At least full time 2,294 106 1,150 306 733
Earnings main source of income
4,528 213 2,009 547 1,759
Housing rated poor 555 84 250 55 166
Housing rated good+ 5,960 1,494 1,959 583 1,925
Neighborhood rated poor 549 66 237 57 188
Neighborhood rated good+ 5,993 1,472 1,983 581 1,957
In central cities 4,202 836 1,360 427 1,579
Suburbs, urban 2,820 681 1,044 276 818
Suburbs, rural 507 140 177 41 149
Nonmetro 774 196 307 61 211
Northeast 1,593 445 549 125 474
Midwest 1,512 372 457 103 580
South 2,928 543 1,038 321 1,026
West 2,270 493 844 256 677
SSI = Supplemental Security Income. Source: HUD-PD&R tabulations of the American Housing Survey
44 WORST CASE HOUSING NEEDS 2017 REPORT TO CONGRESS
APPENDIX A. DETAILED DATA ON HOUSING PROBLEMS AND SUPPLY OF AFFORDABLE HOUSING

Table A-8� Housing Problems and Characteristics of Extremely Low-Income Worst Case Renters by Household Type, 2015
TotalElderly, No
ChildrenFamilies with
Children Other FamiliesOther Nonfamily
Households
Renter households (thousands)
5,821 1,294 2,125 499 1,903
Number of children 4,433 0 4,433 0 0
Number of persons 13,606 1,695 8,285 1,213 2,414
Children/household 0.76 0 2.09 0 0
Persons/household 2.34 1.31 3.90 2.43 1.27
Unassisted with severe problems
5,821 1,294 2,125 499 1,903
Unassisted with nonsevere problems only
— — — — —
Unassisted with no problems
— — — — —
Assisted — — — — —
Any with severe problems
5,821 1,294 2,125 499 1,903
Rent burden >50% of income
5,756 1,287 2,107 495 1,867
Severely inadequate housing
234 28 96 24 86
[Rent burden only] 5,053 1,123 1,807 448 1,675
Any with nonsevere problems only
— — — — —
Rent burden >30–50% of income
— — — — —
Moderately inadequate housing
— — — — —
Crowded housing — — — — —
[Rent burden only] — — — — —
Any with no problems — — — — —
(continued)
45WORST CASE HOUSING NEEDS 2017 REPORT TO CONGRESS
APPENDIX A. DETAILED DATA ON HOUSING PROBLEMS AND SUPPLY OF AFFORDABLE HOUSING

Table A-8� Housing Problems and Characteristics of Extremely Low-Income Worst Case Renters by Household Type, 2015 (continued)
TotalElderly, No
ChildrenFamilies with
Children Other FamiliesOther Nonfamily
Households
Other characteristics
One person in household 2,478 976 0 0 1,501
Two spouse household 1,170 180 750 240 0
Female householder 3,507 852 1,455 269 931
Minority householder 3,238 527 1,495 318 899
Welfare/SSI income 1,162 246 500 87 328
Social security income 1,272 938 150 47 136
Income below 50% poverty 2,418 482 995 182 759
Income below poverty 5,121 994 2,012 445 1,670
Income below 150% of poverty
5,767 1,266 2,121 490 1,891
High school graduate 4,288 938 1,469 356 1,524
Two+ years post high school
1,264 287 329 107 541
Earnings at minimum wage:
At least half time 2,026 78 1,072 232 644
At least full time 788 13 552 95 129
Earnings main source of income
2,912 111 1,396 320 1,085
Housing rated poor 420 68 191 30 131
Housing rated good+ 4,101 1,020 1,423 363 1,295
Neighborhood rated poor 423 56 197 35 135
Neighborhood rated good+ 4,126 1,013 1,423 369 1,320
In central cities 2,940 595 978 277 1,091
Suburbs, urban 1,899 469 745 149 536
Suburbs, rural 376 95 140 30 110
Nonmetro 606 136 262 43 165
Northeast 1,159 322 417 83 337
Midwest 1,178 276 384 80 438
South 2,039 391 758 195 696
West 1,445 305 566 142 432
SSI = Supplemental Security Income. Source: HUD-PD&R tabulations of the American Housing Survey
46 WORST CASE HOUSING NEEDS 2017 REPORT TO CONGRESS
APPENDIX A. DETAILED DATA ON HOUSING PROBLEMS AND SUPPLY OF AFFORDABLE HOUSING

Table A-9� Incidence of Housing Problems Among Very Low-Income Renters by Race and Ethnicity, 2013 and 2015—Number and Percentage
Number Percentage
2013 2015 2013 2015
Non-Hispanic White (thousands) 8,220 8,473 100�0 100�0
Unassisted with severe problems 3,618 3,778 44.0 44.6
Unassisted with nonsevere problems only
1,770 1,836 21.5 21.7
Unassisted with no problems 1,117 1,072 13.6 12.7
Assisted 1,716 1,787 20.9 21.1
Any with severe problems 4,169 4,379 50�7 51�7
Rent burden >50% of income 4,037 4,302 49.1 50.8
Severely inadequate housing 262 176 3.2 2.1
[Rent burden only] 3,672 3,856 44.7 45.5
Any with nonsevere problems only 2,323 2,417 28�3 28�5
Rent burden >30–50% of income 2,125 2,210 25.9 26.1
Moderately inadequate housing 336 346 4.1 4.1
Crowded housing 83 132 1.0 1.6
[Rent burden only] 1,917 1,950 23.3 23.0
Any with no problems 1,728 1,678 21�0 19�8
Non-Hispanic Black (thousands) 4,666 4,813 100�0 100�0
Unassisted with severe problems 1,657 1,800 35.5 37.4
Unassisted with nonsevere problems only
835 906 17.9 18.8
Unassisted with no problems 377 414 8.1 8.6
Assisted 1,797 1,693 38.5 35.2
Any with severe problems 2,336 2,495 50�1 51�8
Rent burden >50% of income 2,239 2,421 48.0 50.3
Severely inadequate housing 182 151 3.9 3.1
[Rent burden only] 1,936 2,130 41.5 44.2
Any with nonsevere problems only 1,342 1,389 28�8 28�9
Rent burden >30–50% of income 1,225 1,261 26.3 26.2
Moderately inadequate housing 192 246 4.1 5.1
Crowded housing 81 65 1.7 1.3
[Rent burden only] 1,078 1,090 23.1 22.6
Any with no problems 988 929 21�2 19�3
47WORST CASE HOUSING NEEDS 2017 REPORT TO CONGRESS
APPENDIX A. DETAILED DATA ON HOUSING PROBLEMS AND SUPPLY OF AFFORDABLE HOUSING

Table A-9� Incidence of Housing Problems Among Very Low-Income Renters by Race and Ethnicity, 2013 and 2015— Number and Percentage (continued)
Number Percentage
2013 2015 2013 2015
Hispanic (thousands) 4,186 4,441 100�00 100�0
Unassisted with severe problems 1,845 2,104 44.1 47.4
Unassisted with nonsevere problems only
1,092 1,100 26.1 24.8
Unassisted with no problems 391 361 9.3 8.1
Assisted 857 875 20.5 19.7
Any with severe problems 2,129 2,482 50�9 55�9
Rent burden >50% of income 2,038 2,429 48.7 54.7
Severely inadequate housing 168 140 4.0 3.2
[Rent burden only] 1,843 2,119 44.0 47.7
Any with nonsevere problems only 1,397 1,384 33�4 31�2
Rent burden >30–50% of income 1,217 1,263 29.1 28.4
Moderately inadequate housing 173 153 4.1 3.4
Crowded housing 315 248 7.5 5.6
[Rent burden only] 939 1,009 22.4 22.7
Any with no problems 660 575 15�8 12�9
Source: HUD-PD&R tabulations of the American Housing Survey
48 WORST CASE HOUSING NEEDS 2017 REPORT TO CONGRESS
APPENDIX A. DETAILED DATA ON HOUSING PROBLEMS AND SUPPLY OF AFFORDABLE HOUSING

Table A-10� Incidence of Housing Problems Among Very Low-Income Renters by Region, 2013 and 2015—Number and Percentage
Number Percentage
2013 2015 2013 2015
Northeast (thousands) 3,804 3,983 100�0 100�0
Unassisted with severe problems 1,542 1,593 40.5 40.0
Unassisted with nonsevere problems only
641 725 16.9 18.2
Unassisted with no problems 380 393 10.0 9.9
Assisted 1,241 1,271 32.6 31.9
Any with severe problems 1,992 2,092 52�4 52�5
Rent burden >50% of income 1,903 2,015 50.0 50.6
Severely inadequate housing 223 189 5.9 4.8
[Rent burden only] 1,661 1,690 43.7 42.4
Any with nonsevere problems only
1,032 1,143 27�1 28�7
Rent burden >30–50% of income 930 1,035 24.4 26.0
Moderately inadequate housing 148 185 3.9 4.6
Crowded housing 81 70 2.1 1.8
[Rent burden only] 814 898 21.4 22.5
Any with no problems 780 748 20�5 18�8
Midwest (thousands) 3,692 4,053 100�0 100�0
Unassisted with severe problems 1,389 1,512 37.6 37.3
Unassisted with nonsevere problems only
872 1,003 23.6 24.7
Unassisted with no problems 424 453 11.5 11.2
Assisted 1,007 1,085 27.3 26.8
Any with severe problems 1,690 1,901 45�8 46�9
Rent burden >50% of income 1,628 1,854 44.1 45.8
Severely inadequate housing 111 89 3.0 2.2
[Rent burden only] 1,452 1,667 39.3 41.1
Any with nonsevere problems only
1,181 1,335 32�0 32�9
Rent burden >30–50% of income 1,073 1,233 29.1 30.4
Moderately inadequate housing 167 167 4.5 4.1
Crowded housing 56 71 1.5 1.7
[Rent burden only] 963 1,116 26.1 27.5
Any with no problems 822 817 22�3 20�2
(continued)
49WORST CASE HOUSING NEEDS 2017 REPORT TO CONGRESS
APPENDIX A. DETAILED DATA ON HOUSING PROBLEMS AND SUPPLY OF AFFORDABLE HOUSING

Table A-10� Incidence of Housing Problems Among Very Low-Income Renters by Region, 2013 and 2015— Number and Percentage (continued)
Number Percentage
2013 2015 2013 2015
South (thousands) 6,350 6,696 100�00 100�0
Unassisted with severe problems 2,612 2,928 41.1 43.7
Unassisted with nonsevere problems only
1,459 1,456 23.0 21.7
Unassisted with no problems 788 812 12.4 12.1
Assisted 1,491 1,501 23.5 22.4
Any with severe problems 3,164 3,494 49�8 52�2
Rent burden >50% of income 3,065 3,444 48.3 51.4
Severely inadequate housing 176 114 2.8 1.7
[Rent burden only] 2,745 3,093 43.2 46.2
Any with nonsevere problems only
1,895 1,867 29�8 27�9
Rent burden >30–50% of income 1,682 1,682 26.5 25.1
Moderately inadequate housing 309 316 4.9 4.7
Crowded housing 143 142 2.3 2.1
[Rent burden only] 1,463 1,421 23.0 21.2
Any with no problems 1,291 1,335 20�3 19�9
West (thousands) 4,654 4,503 100�0 100�0
Unassisted with severe problems 2,178 2,270 46.8 50.4
Unassisted with nonsevere problems only
991 939 21.3 20.9
Unassisted with no problems 466 357 10.0 7.9
Assisted 1,019 937 21.9 20.8
Any with severe problems 2,507 2,647 53�9 58�8
Rent burden >50% of income 2,414 2,596 51.9 57.7
Severely inadequate housing 151 117 3.2 2.6
[Rent burden only] 2,203 2,324 47.3 51.6
Any with nonsevere problems only
1,339 1,279 28�8 28�4
Rent burden >30–50% of income 1,233 1,172 26.5 26.0
Moderately inadequate housing 120 142 2.6 3.1
Crowded housing 240 198 5.2 4.4
[Rent burden only] 997 950 21.4 21.1
Any with no problems 807 578 17�3 12�8
Source: HUD-PD&R tabulations of the American Housing Survey
50 WORST CASE HOUSING NEEDS 2017 REPORT TO CONGRESS
APPENDIX A. DETAILED DATA ON HOUSING PROBLEMS AND SUPPLY OF AFFORDABLE HOUSING

Table A-11A� Incidence of Housing Problems Among Very Low-Income Renters by Metropolitan Location, 2013 and 2015—Number and Percentage
Number Percentage
2013 2015 2013 2015
Central cities (thousands) 9,131 9,513 100�0 100�0
Unassisted with severe problems 3,878 4,202 42.5 44.2
Unassisted with nonsevere problems only
1,944 1,951 21.3 20.5
Unassisted with no problems 824 872 9.0 9.2
Assisted 2,486 2,489 27.2 26.2
Any with severe problems 4,800 5,202 52�6 54�7
Rent burden >50% of income 4,596 5,080 50.3 53.4
Severely inadequate housing 397 296 4.3 3.1
[Rent burden only] 4,066 4,435 44.5 46.6
Any with nonsevere problems only
2,677 2,739 29�3 28�8
Rent burden >30–50% of income 2,398 2,496 26.3 26.2
Moderately inadequate housing 389 419 4.3 4.4
Crowded housing 240 240 2.6 2.5
[Rent burden only] 2,075 2,116 22.7 22.2
Any with no problems 1,654 1,572 18�1 16�5
Suburbs, urban (thousands) 5,556 5,775 100�0 100�0
Unassisted with severe problems 2,466 2,820 44.4 48.8
Unassisted with nonsevere problems only
1,218 1,157 21.9 20.0
Unassisted with no problems 611 589 11.0 10.2
Assisted 1,261 1,209 22.7 20.9
Any with severe problems 2,891 3,294 52�0 57�0
Rent burden >50% of income 2,799 3,236 50.4 56.0
Severely inadequate housing 153 131 2.7 2.3
[Rent burden only] 2,579 2,913 46.4 50.4
Any with nonsevere problems only
1,641 1,536 29�5 26�6
Rent burden >30–50% of income 1,546 1,426 27.8 24.7
Moderately inadequate housing 145 179 2.6 3.1
Crowded housing 203 155 3.6 2.7
[Rent burden only] 1,314 1,213 23.7 21.0
Any with no problems 1,024 945 18�4 16�4
(continued)
51WORST CASE HOUSING NEEDS 2017 REPORT TO CONGRESS
APPENDIX A. DETAILED DATA ON HOUSING PROBLEMS AND SUPPLY OF AFFORDABLE HOUSING

Table A-11A� Incidence of Housing Problems Among Very Low-Income Renters by Metropolitan Location, 2013 and 2015—Number and Percentage (continued)
Number Percentage
2013 2015 2013 2015
Suburbs, rural (thousands) 1,410 1,459 100�0 100�0
Unassisted with severe problems 522 507 37.0 34.8
Unassisted with nonsevere problems only
312 409 22.1 28.0
Unassisted with no problems 290 239 20.6 16.4
Assisted 286 304 20.3 20.8
Any with severe problems 597 602 42�4 41�3
Rent burden >50% of income 577 584 41.0 40.0
Severely inadequate housing 53 33 3.8 2.3
[Rent burden only] 505 491 35.8 33.7
Any with nonsevere problems only 407 505 28�9 34�6
Rent burden >30–50% of income 364 464 25.8 31.8
Moderately inadequate housing 62 57 4.4 3.9
Crowded housing 27 37 1.9 2.5
[Rent burden only] 318 411 22.6 28.2
Any with no problems 405 352 28�7 24�1
Non-metropolitan (thousands) 2,385 2,488 100�00 100�00
Unassisted with severe problems 838 774 35.1 31.1
Unassisted with nonsevere problems only
489 607 20.5 24.4
Unassisted with no problems 338 315 14.2 12.7
Assisted 719 792 30.2 31.8
Any with severe problems 1,047 1,036 43�9 41�7
Rent burden >50% of income 1,019 1,009 42.7 40.6
Severely inadequate housing 63 48 2.6 1.9
[Rent burden only] 885 936 37.1 37.6
Any with nonsevere problems only 719 843 30�2 33�9
Rent burden >30–50% of income 610 736 25.6 29.6
Moderately inadequate housing 150 154 6.3 6.2
Crowded housing 44 49 1.8 2.0
[Rent burden only] 531 646 22.3 26.0
Any with no problems 618 609 25�9 24�5
(continued)
52 WORST CASE HOUSING NEEDS 2017 REPORT TO CONGRESS
APPENDIX A. DETAILED DATA ON HOUSING PROBLEMS AND SUPPLY OF AFFORDABLE HOUSING

Table A-11A� Incidence of Housing Problems Among Very Low-Income Renters by Metropolitan Location, 2013 and 2015—Number and Percentage (continued)
Number Percentage
2013 2015 2013 2015
U�S� Total (thousands) 18,482 19,235 100�0 100�0
Unassisted with severe problems 7,704 8,303 41.7 43.2
Unassisted with nonsevere problems only
3,963 4,123 21.4 21.4
Unassisted with no problems 2,063 2,015 11.2 10.5
Assisted 4,752 4,794 25.7 24.9
Any with severe problems 9,335 10,134 50�5 52�7
Rent burden >50% of income 8,991 9,910 48.6 51.5
Severely inadequate housing 666 509 3.6 2.6
[Rent burden only] 8,035 8,774 43.5 45.6
Any with nonsevere problems only
5,444 5,624 29�5 29�2
Rent burden >30–50% of income 4,918 5,122 26.6 26.6
Moderately inadequate housing 746 809 4.0 4.2
Crowded housing 514 480 2.8 2.5
[Rent burden only] 4,238 4,385 22.9 22.8
Any with no problems 3,701 3,477 20�0 18�1
Note: Metropolitan location tabulations for 2013 are provided for comparison to 2015 tabulations only and are not comparable to previous reports, which defined metropolitan locations across three categories: central cities, suburbs, and non-metropolitan areas. Source: HUD-PD&R tabulations of the American Housing Survey
53WORST CASE HOUSING NEEDS 2017 REPORT TO CONGRESS
APPENDIX A. DETAILED DATA ON HOUSING PROBLEMS AND SUPPLY OF AFFORDABLE HOUSING

Table A-11B� Housing Conditions of Renter Households by Relative Income, Sampled Metropolitan Areas, 2015
Household Income as Percentage of HUD-Adjusted Area Median Family Income
2015 0–50%All
Incomes
Atlanta-Sandy Springs-Roswell, GA
Total households (thousands) 259 729
Unassisted with severe problems 127
Unassisted with nonsevere problems only 52
Unassisted with no problems 30
Assisted 51
Boston-Cambridge-Newton, MA-NH
Total households (thousands) 300 708
Unassisted with severe problems 93
Unassisted with nonsevere problems only 41
Unassisted with no problems 20
Assisted 146
Chicago-Naperville-Elgin, IL-IN-WI
Total households (thousands) 567 1,289
Unassisted with severe problems 242
Unassisted with nonsevere problems only 112
Unassisted with no problems 57
Assisted 157
Dallas-Fort Worth-Arlington, TX
Total households (thousands) 365 1,019
Unassisted with severe problems 177
Unassisted with nonsevere problems only 112
Unassisted with no problems 22
Assisted 54
Detroit-Warren-Dearborn, MI
Total households (thousands) 251 524
Unassisted with severe problems 115
Unassisted with nonsevere problems only 54
Unassisted with no problems 27
Assisted 57
(continued)
54 WORST CASE HOUSING NEEDS 2017 REPORT TO CONGRESS
APPENDIX A. DETAILED DATA ON HOUSING PROBLEMS AND SUPPLY OF AFFORDABLE HOUSING
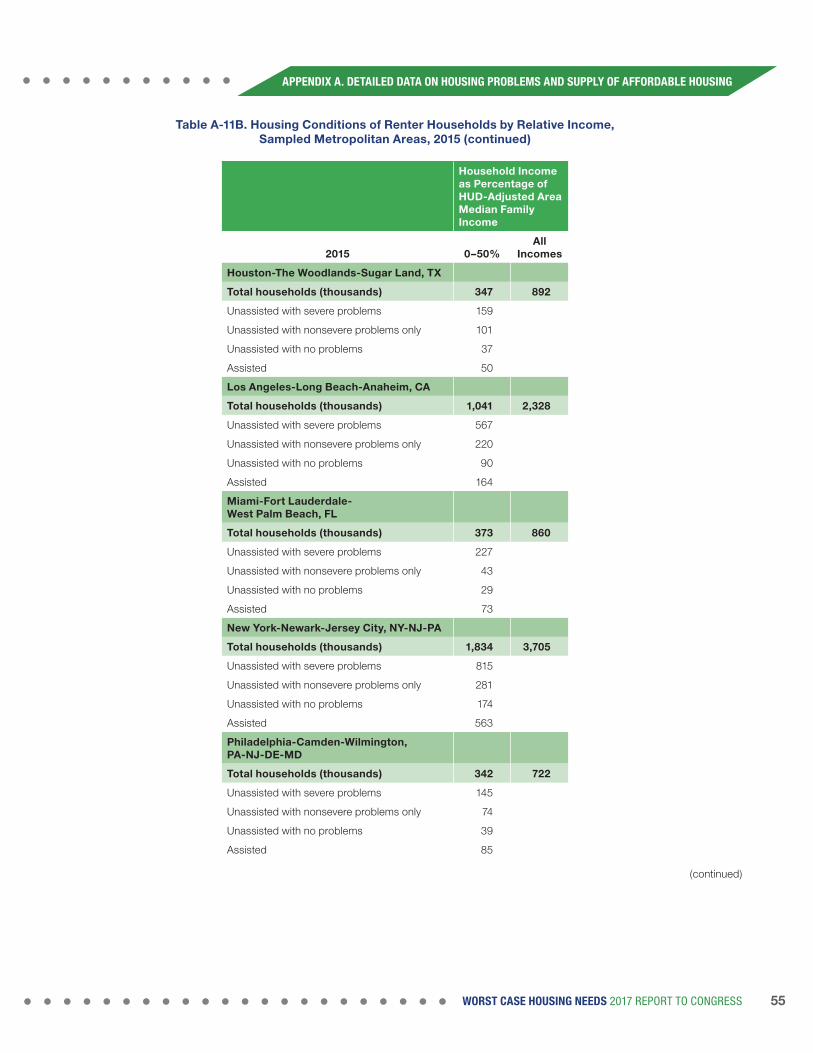
Table A-11B� Housing Conditions of Renter Households by Relative Income, Sampled Metropolitan Areas, 2015 (continued)
Household Income as Percentage of HUD-Adjusted Area Median Family Income
2015 0–50%All
Incomes
Houston-The Woodlands-Sugar Land, TX
Total households (thousands) 347 892
Unassisted with severe problems 159
Unassisted with nonsevere problems only 101
Unassisted with no problems 37
Assisted 50
Los Angeles-Long Beach-Anaheim, CA
Total households (thousands) 1,041 2,328
Unassisted with severe problems 567
Unassisted with nonsevere problems only 220
Unassisted with no problems 90
Assisted 164
Miami-Fort Lauderdale- West Palm Beach, FL
Total households (thousands) 373 860
Unassisted with severe problems 227
Unassisted with nonsevere problems only 43
Unassisted with no problems 29
Assisted 73
New York-Newark-Jersey City, NY-NJ-PA
Total households (thousands) 1,834 3,705
Unassisted with severe problems 815
Unassisted with nonsevere problems only 281
Unassisted with no problems 174
Assisted 563
Philadelphia-Camden-Wilmington, PA-NJ-DE-MD
Total households (thousands) 342 722
Unassisted with severe problems 145
Unassisted with nonsevere problems only 74
Unassisted with no problems 39
Assisted 85
(continued)
55WORST CASE HOUSING NEEDS 2017 REPORT TO CONGRESS
APPENDIX A. DETAILED DATA ON HOUSING PROBLEMS AND SUPPLY OF AFFORDABLE HOUSING

Table A-11B� Housing Conditions of Renter Households by Relative Income, Sampled Metropolitan Areas, 2015 (continued)
Household Income as Percentage of HUD-Adjusted Area Median Family Income
2015 0–50%All
Incomes
Phoenix-Mesa-Scottsdale, AZ
Total households (thousands) 227 622
Unassisted with severe problems 124
Unassisted with nonsevere problems only 63
Unassisted with no problems 15
Assisted 26
Riverside-San Bernardino-Ontario, CA
Total households (thousands) 215 536
Unassisted with severe problems 123
Unassisted with nonsevere problems only 33
Unassisted with no problems 28
Assisted 30
San Francisco-Oakland-Hayward, CA
Total households (thousands) 287 791
Unassisted with severe problems 142
Unassisted with nonsevere problems only 40
Unassisted with no problems 22
Assisted 84
Seattle-Tacoma-Bellevue, WA
Total households (thousands) 199 604
Unassisted with severe problems 83
Unassisted with nonsevere problems only 46
Unassisted with no problems 17
Assisted 54
Washington-Arlington-Alexandria, DC-VA-MD-WV
Total households (thousands) 343 809
Unassisted with severe problems 141
Unassisted with nonsevere problems only 95
Unassisted with no problems 33
Assisted 74
(continued)
56 WORST CASE HOUSING NEEDS 2017 REPORT TO CONGRESS
APPENDIX A. DETAILED DATA ON HOUSING PROBLEMS AND SUPPLY OF AFFORDABLE HOUSING

57WORST CASE HOUSING NEEDS 2017 REPORT TO CONGRESS
SECTION 1. EXTENT AND NATURE OF WORST CASE NEEDSAPPENDIX A. DETAILED DATA ON HOUSING PROBLEMS AND SUPPLY OF AFFORDABLE HOUSING
Table A-11B� Housing Conditions of Renter Households by Relative Income, Sampled Metropolitan Areas, 2015 (continued)
Household Income as Percentage of HUD-Adjusted Area Median Family Income
2015 0–50%All
Incomes
Cincinnati, OH-KY-IN
Total households (thousands) 127 281
Unassisted with severe problems 47
Unassisted with nonsevere problems only 28
Unassisted with no problems 16
Assisted 36
Cleveland-Elyria, OH
Total households (thousands) 159 301
Unassisted with severe problems 62
Unassisted with nonsevere problems only 43
Unassisted with no problems 12
Assisted 42
Denver-Aurora-Lakewood, CO
Total households (thousands) 140 395
Unassisted with severe problems 60
Unassisted with nonsevere problems only 33
Unassisted with no problems 16
Assisted 31
Kansas City, MO-KS
Total households (thousands) 121 293
Unassisted with severe problems 41
Unassisted with nonsevere problems only 34
Unassisted with no problems 14
Assisted 32
Memphis, TN-MS-AR
Total households (thousands) 90 201
Unassisted with severe problems 44
Unassisted with nonsevere problems only 18
Unassisted with no problems 12
Assisted 16
(continued)

Table A-11B� Housing Conditions of Renter Households by Relative Income, Sampled Metropolitan Areas, 2015 (continued)
Household Income as Percentage of HUD-Adjusted Area Median Family Income
2015 0–50%All
Incomes
Milwaukee-Waukesha-West Allis, WI
Total households (thousands) 115 248
Unassisted with severe problems 50
Unassisted with nonsevere problems only 33
Unassisted with no problems 9
Assisted 24
New Orleans-Metairie, LA
Total households (thousands) 76 191
Unassisted with severe problems 31
Unassisted with nonsevere problems only 10
Unassisted with no problems 9
Assisted 28
Pittsburgh, PA
Total households (thousands) 141 313
Unassisted with severe problems 43
Unassisted with nonsevere problems only 33
Unassisted with no problems 21
Assisted 44
Portland-Vancouver-Hillsboro, OR-WA
Total households (thousands) 125 349
Unassisted with severe problems 56
Unassisted with nonsevere problems only 29
Unassisted with no problems 8
Assisted 32
Raleigh, NC
Total households (thousands) 63 166
Unassisted with severe problems 25
Unassisted with nonsevere problems only 19
Unassisted with no problems 9
Assisted 11
Note: Each of the 15 largest metropolitan areas, listed first alphabetically, are part of the AHS longitudinal panel surveyed every 2 years. The remaining 10 metropolitan areas represent a subset of the 16th to 50th largest metropolitan areas surveyed on a rotating basis every 4 years. Source: HUD-PD&R tabulations of the American Housing Survey
58 WORST CASE HOUSING NEEDS 2017 REPORT TO CONGRESS
APPENDIX A. DETAILED DATA ON HOUSING PROBLEMS AND SUPPLY OF AFFORDABLE HOUSING

Table A-12� Households Occupying Rental Units by Affordability of Rent and Income of Occupants, 2013 and 2015
Relative Income of
Households
Occupied and Vacant Rental Units (thousands) by Unit Affordability Category (percent of HAMFI needed to afford the highest rent in the category)
2015 10* 20 30 40 50 60 70 80 90 100 110 120+ Total
Extremely low-income (<30% HAMFI)
818 1,607 1,341 1,132 1,757 1,533 1,040 649 436 246 197 534 11,290
Very low-income (30–50%)
272 437 387 757 1,465 1,612 1,137 634 415 270 164 398 7,945
Low-income (50–80%)
226 371 259 556 1,310 1,726 1,405 1,015 663 348 240 579 8,696
Middle-income or higher (>80%)
278 511 339 431 1,250 1,981 2,405 2,154 1,821 1,234 928 2,667 15,999
Vacant units for rent
89 56 128 319 686 815 692 510 363 230 180 672 4,740
Total units vacant and occupied
1,682 2,982 2,453 3,194 6,468 7,667 6,679 4,962 3,699 2,328 1,708 4,849 48,670
2013
Extremely low-income (<30% HAMFI)
868 1,672 1,367 1,423 1,911 1,718 850 513 252 136 73 321 11,104
Very low-income (30–50%)
219 362 553 895 1,497 1,655 971 557 222 110 77 280 7,397
Low-income (50–80%)
219 259 322 673 1,345 1,853 1,241 886 328 172 135 382 7,815
Middle-income or higher (>80%)
303 368 345 691 1,445 2,174 1,969 2,014 1,282 942 576 1,848 13,958
Total occupied units
1,609 2,660 2,587 3,681 6,198 7,400 5,031 3,970 2,084 1,360 862 2,831 40,273
Vacant units for rent
120 118 133 283 616 668 484 350 235 160 110 429 3,707
HAMFI = HUD-adjusted area median family income. * The 10 percent of HAMFI category includes units occupied with no cash rent. Source: HUD-PD&R tabulations of the American Housing Survey
59WORST CASE HOUSING NEEDS 2017 REPORT TO CONGRESS
APPENDIX A. DETAILED DATA ON HOUSING PROBLEMS AND SUPPLY OF AFFORDABLE HOUSING

Table A-13� Renters and Rental Units Affordable and Available to Them by Relative Income, 2001–2015
2001 2003 2005 2007 2009 2011 2013 2015
Renter households (thousands)
34,042 33,614 33,951 35,054 35,396 38,867 40,294 43,930
Extremely low-income (<30% HAMFI)
8,739 9,077 9,729 9,243 9,961 11,774 11,163 11,290
Very low-income (30–50%)
6,315 6,581 6,342 6,697 7,157 7,492 7,375 7,945
Low-income (50–80%) 7,251 7,460 7,488 7,650 7,168 7,750 7,795 8,696
Middle-income or higher (>80%)
11,737 10,496 10,392 11,464 11,110 11,850 13,961 15,999
Affordable units 37,197 37,577 37,924 39,330 39,744 43,075 43,992 48,670
Extremely low-income (<30% HAMFI)
6,870 7,098 6,747 7,280 6,265 6,854 7,294 7,117
Very low-income (30–50%)
12,366 12,863 12,368 11,071 10,938 10,947 10,727 9,643
Low-income (50–80%) 13,634 13,518 14,044 15,063 16,228 17,995 17,904 19,326
Middle-income or higher (>80%)
4,328 4,099 4,765 5,916 6,313 7,279 8,067 12,584
Affordable and available units
37,197 37,577 37,924 39,330 39,744 43,075 43,992 48,670
Extremely low-income (<30% HAMFI)
3,803 3,996 3,982 4,224 3,665 4,220 4,354 4,278
Very low-income (30–50%)
8,132 8,744 8,549 7,786 8,045 8,225 7,734 7,576
Low-income (50–80%) 11,665 12,396 12,865 13,196 14,004 15,361 14,529 15,862
Middle-income or higher (>80%)
13,597 12,441 12,528 14,123 14,029 15,270 17,375 20,955
HAMFI = HUD-adjusted area median family income. Note: Income categories in this table do not overlap and therefore differ from the standard definitions. Source: HUD-PD&R tabulations of the American Housing Survey
60 WORST CASE HOUSING NEEDS 2017 REPORT TO CONGRESS
APPENDIX A. DETAILED DATA ON HOUSING PROBLEMS AND SUPPLY OF AFFORDABLE HOUSING

Table A-14� Average Income and Average Gross Rent of Renter Households by Relative Income, 2013 and 2015
Household Income as Percentage of HUD-Adjusted Area Median Family Income
2015 0–30% >30–50% >50–80% >80–120% >120% All Incomes
Total households (thousands) 11,290 7,945 8,696 7,051 8,948 43,930
Unassisted with severe problems 5,821 2,482 880 258 210 9,651
Unassisted with nonsevere problems only
779 3,344 3,755 1,684 893 10,455
Unassisted with no problems 988 1,027 3,623 4,908 7,720 18,265
Assisted 3,702 1,092 438 202 125 5,559
Average monthly income $760 $1,988 $3,148 $4,545 $9,731 $3,890
Unassisted with severe problems $806 $1,895 $3,024 $3,901 $7,211 $1,510
Unassisted with nonsevere problems only
$1,072 $2,081 $3,173 $4,477 $8,637 $3,344
Unassisted with no problems $470 $2,004 $3,173 $4,617 $9,934 $6,207
Assisted $699 $1,896 $2,974 $4,197 $9,279 $1,433
Average gross rent $763 $961 $1,014 $1,172 $1,479 $1,060
Unassisted with severe problems $1,038 $1,537 $2,190 $3,344 $3,841 $1,394
Unassisted with nonsevere problems only
$578 $801 $1,091 $1,514 $1,938 $1,100
Unassisted with no problems $388 $364 $682 $953 $1,370 $1,012
Assisted $470 $708 $731 $885 $968 $564
2013 0–30% >30–50% >50–80% >80–120% >120% All Incomes
Total households (thousands) 11,104 7,397 7,815 6,683 7,274 40,273
Unassisted with severe problems 5,607 2,114 674 279 201 8,874
Unassisted with nonsevere problems only
779 3,185 3,182 1,370 717 9,233
Unassisted with no problems 1,046 1,011 3,502 4,841 6,236 16,636
Assisted 3,672 1,087 457 194 120 5,530
Average monthly income $726 $1,961 $3,081 $4,415 $9,232 $3,559
Unassisted with severe problems $794 $1,869 $2,937 $3,977 $8,138 $1,479
Unassisted with nonsevere problems only
$1,039 $2,057 $3,086 $4,346 $9,170 $3,218
Unassisted with no problems $331 $1,983 $3,122 $4,492 $9,277 $5,583
Assisted $670 $1,839 $2,940 $3,628 $9,109 $1,374
Average gross rent $714 $816 $870 $1,006 $1,293 $917
Unassisted with severe problems $863 $1,125 $1,507 $2,297 $2,390 $1,056
Unassisted with nonsevere problems only
$563 $723 $931 $1,243 $1,898 $954
Unassisted with no problems $590 $500 $695 $863 $1,192 $925
Assisted $542 $708 $732 $887 $931 $611
Source: HUD-PD&R tabulations of the American Housing Survey
61WORST CASE HOUSING NEEDS 2017 REPORT TO CONGRESS
APPENDIX A. DETAILED DATA ON HOUSING PROBLEMS AND SUPPLY OF AFFORDABLE HOUSING

Table A-15� Housing Conditions of Households Having Nonelderly People With Disabilities by Disability Type, 2013 and 2015
2015Any
Limitation
Functional Limitations ADL/IADL Limitationsa
Hearing Visual Cognitive Ambulatory Self-CareIndependent
Living
Households (thousands)
12,588 3,060 2,647 5,119 5,626 1,836 3,614
Renter households 5,740 1,077 1,339 2,602 2,746 888 1,755
Owner households 6,849 1,983 1,308 2,517 2,880 948 1,859
Renters (thousands) 5,740 1,077 1,339 2,602 2,746 888 1,755
Unassisted with severe problems
1,507 302 393 745 729 292 476
Unassisted with nonsevere problems only
1,297 246 311 557 578 152 362
Unassisted with no problems
1,567 350 316 603 667 198 387
Assisted 1,369 179 319 698 773 246 529
Very low-income renters (thousands)
1,581 294 416 732 778 227 463
Unassisted with severe problems
387 79 117 189 200 75 123
Unassisted with nonsevere problems only
716 124 182 331 351 94 197
Unassisted with no problems
235 60 54 91 117 21 66
Assisted 243 31 63 122 110 37 78
Any with severe problems
423 88 129 197 217 79 134
Rent burden >50% of income
382 83 117 171 192 69 117
Severely inadequate housing
49 12 13 33 25 S 23
[Rent burden only] 352 73 108 152 179 66 103
Any with nonsevere problems only
808 131 191 386 396 113 233
Rent burden >30–50% of income
742 116 170 343 362 103 217
Moderately inadequate housing
128 21 38 76 57 13 43
Crowded housing 56 9 8 27 27 8 21
[Rent burden only] 630 101 145 290 315 93 173
Any with no problems 351 75 95 149 164 35 96
(continued)
62 WORST CASE HOUSING NEEDS 2017 REPORT TO CONGRESS
APPENDIX A. DETAILED DATA ON HOUSING PROBLEMS AND SUPPLY OF AFFORDABLE HOUSING

Table A-15� Housing Conditions of Households Having Nonelderly People With Disabilities by Disability Type, 2013 and 2015 (continued)
2013Any
Limitation
Functional Limitations ADL/IADL Limitationsa
Hearing Visual Cognitive Ambulatory Self-CareIndependent
Living
Households (thousands)
9,315 2,010 1,699 3,667 5,018 1,524 2,884
Renter households 4,265 767 805 1,788 2,366 675 1,290
Owner households 5,050 1,243 895 1,879 2,653 849 1,594
Renters (thousands) 4,265 767 805 1,788 2,366 675 1,290
Unassisted with severe problems
1,156 190 215 500 686 229 417
Unassisted with nonsevere problems only
910 170 184 367 463 135 267
Unassisted with no problems
1,120 228 211 393 565 127 220
Assisted 1,080 179 194 529 652 184 387
Very low-income renters (thousands)
2,804 481 524 1,281 1,623 474 955
Unassisted with severe problems
1,085 179 199 481 648 221 389
Unassisted with nonsevere problems only
509 79 108 209 257 80 147
Unassisted with no problems
223 59 34 103 118 12 53
Assisted 987 164 184 488 601 161 365
Any with severe problems
1,439 236 277 642 864 286 520
Rent burden >50% of income
1,384 230 260 617 825 274 500
Severely inadequate housing
117 18 32 62 77 24 50
[Rent burden only, adequate housing]
1,166 188 202 512 699 235 406
Any with nonsevere problems only
825 131 158 388 449 130 258
Rent burden >30–50% of income
740 115 130 344 405 118 230
Moderately inadequate housing
129 34 30 73 85 23 43
Crowded housing 65 7 14 24 16 17 24
[Rent burden only] 647 92 114 302 352 98 199
Any with no problems 540 113 89 251 310 58 178
a ADL = Activities of Daily Living. IADL = Instrumental Activities of Daily Living. Source: HUD-PD&R tabulations of the American Housing Survey
63WORST CASE HOUSING NEEDS 2017 REPORT TO CONGRESS
APPENDIX A. DETAILED DATA ON HOUSING PROBLEMS AND SUPPLY OF AFFORDABLE HOUSING

64 WORST CASE HOUSING NEEDS 2017 REPORT TO CONGRESS

Appendix BSupplemental Exhibits
APPENDIX B. SUPPLEMENTAL EXHIBITS
65WORST CASE HOUSING NEEDS 2017 REPORT TO CONGRESS

0
3
4
2
1
10 20 30 40
Source: HUD-PD&R tabulations of American Housing Survey data
Ren
tal u
nits
(milli
ons)
Exhibit B-2. Affordable Rental Units Occupied By Higher Income Renters, 2015
Unit affordability: percent of Area Median Income needed to afford the highest rent in the category
50 60 70 80 90 100 110 120+
5
6
8
7
9
0.270.23
0.44
0.37
0.13
0.390.26
0.32
0.76
0.56
0.69
1.47
1.31
0.82
1.61
1.73
0.69
1.14
1.41
0.51
0.63
1.02
0.36
0.66
0.67
0.58
0.82
0.28
0.09 0.06
1.61
0.510.34
0.43
1.25
1.98
2.41
2.15
1.82
1.23
0.93
2.67
1.34 1.13
1.76 1.531.04
0.65 0.53
Renters with incomes of >80% AMI
Renters with incomes of 50–80% AMI
Renters with incomes of 30–50% AMI
Renters with incomes of 0–30% AMI
Vacant units for rent
0.420.44
0.35
0.40
0.23 0.20
0.25
Exhibit B-3� Rental Stock of Below-FMR Units by Region and Metropolitan Location, 2015
Households (thousands) Housing Units (thousands) Housing Units per 100 Households
AffordableAffordable
and Available
Affordable, Available, and
Adequate AffordableAffordable
and Available
Affordable, Available, and
Adequate
All 26,048 28,381 21,264 19,199 109.0 81.6 73.7
Northeast 5,211 5,499 4,259 3,691 105.5 81.7 70.8
Midwest 4,877 5,631 4,059 3,687 115.5 83.2 75.6
South 9,334 10,440 7,885 7,197 111.9 84.5 77.1
West 6,627 6,810 5,061 4,623 102.8 76.4 69.8
Central cities 12,538 12,960 9,986 8,869 103.4 79.6 70.7
Suburbs, urban 8,296 8,744 6,396 5,890 105.4 77.1 71.0
Suburbs, rural 2,012 2,590 1,893 1,711 128.7 94.1 85.0
Nonmetropolitan areas
3,202 4,087 2,989 2,728 127.6 93.3 85.2
FMR = Fair Market Rent. Source: HUD-PD&R tabulations of American Housing Survey data
APPENDIX B. SUPPLEMENTAL EXHIBITS
66 WORST CASE HOUSING NEEDS 2017 REPORT TO CONGRESS

Appendix C
Federal Housing Assistance and Affordable Housing Programs HUD provides rental housing assistance through three key programs.1
1� Public housing� Provides affordable housing to 1.0 million households through units owned and managed by local public housing agencies. Families are required to pay 30 percent of their incomes for rent.
2� Project-based assisted housing� Provides assistance to 1.2 million households living in privately owned rental housing. The assistance is attached to the units, which are reserved for low-income families who are required to pay 30 percent of their incomes for rent.
3� Tenant-based rental assistance� The Housing Choice Voucher program supplements the rent payments of 2.3 million households in the private rental market. The program is administered through state and local housing agencies. Although 30 percent of income is the rent baseline, families often pay more and use these portable subsidies to locate housing of their choice.
Several other federal housing programs produce affordable housing, typically with shallower subsidies. Although these units are often more affordable than market-rate units, without additional rent subsidies (such as vouchers), extremely low-income families would often have to pay much more than 30 percent of their incomes under these programs.
- Low-Income Housing Tax Credit Program� Tax credits offered to investors by the U.S. Department of the Treasury subsidize the capital costs of units that have rents affordable to households with incomes not exceeding 60 percent of Area Median Income (AMI).
- HOME Investment Partnerships Program� Provides annual formula grants to state and local governments that can be used to assist homeowners, first-time homebuyers, or renters. Qualifying rents must be affordable to households with incomes not exceeding 65 percent of AMI or must be less than the local Fair Market Rent, whichever is less.
1 The number of households assisted by key programs based on HUD administrative records is available through the Picture of Subsidized Households query tool at http://www.huduser.gov/portal/datasets/assthsg.html.
APPENDIX C. FEDERAL HOUSING ASSISTANCE AND AFFORDABLE HOUSING PROGRAMS
67WORST CASE HOUSING NEEDS 2017 REPORT TO CONGRESS

APPENDIX C. FEDERAL HOUSING ASSISTANCE AND AFFORDABLE HOUSING PROGRAMS
68 WORST CASE HOUSING NEEDS 2017 REPORT TO CONGRESS
- Housing Opportunities for Persons With AIDS� Annual formula and competitive grants available to state and local governments and nonprofits for rental assistance targeted to a special-needs population.
- Older rental subsidy programs� Programs named for sections of the National Housing Act, primarily the Section 221(d)(3) Below Market Interest Rate Program and the Section 236 mortgage assistance program, were active from the early 1960s through the early 1970s. They were designed to produce housing affordable for families with incomes greater than the public housing income limits.
For further detail on HUD program requirements, see HUD-PD&R (2016).

APPENDIX D. PREVIOUS REPORTS TO CONGRESS ON WORST CASE NEEDS
69WORST CASE HOUSING NEEDS 2017 REPORT TO CONGRESS
Appendix DPrevious Reports to Congress on Worst Case Needs
- Priority Problems and “Worst Case” Needs in 1989 (June 1991, HUD-1314-PDR).
- The Location of Worst Case Needs in the Late 1980s (December 1992, HUD-1387-PDR).
- Worst Case Needs for Housing Assistance in the United States in 1990 and 1991 (June 1994, HUD-1481-PDR).
- Rental Housing Assistance at a Crossroads: A Report to Congress on Worst Case Housing Needs (March 1996).
- Rental Housing Assistance—The Crisis Continues (April 1998).
- Rental Housing Assistance—The Worsening Crisis: A Report to Congress on Worst Case Housing Needs (March 2000).
- A Report on Worst Case Housing Needs in 1999: New Opportunity Amid Continuing Challenges, Executive Summary (January 2001).
- Trends in Worst Case Needs for Housing, 1978–1999 (December 2003).
- Affordable Housing Needs: A Report to Congress on the Significant Need for Housing (December 2005).
- Affordable Housing Needs 2005: Report to Congress (May 2007).
- Housing Needs of Persons With Disabilities: Supplemental Findings to the Affordable Housing Needs 2005 Report (February 2008).
- Worst Case Housing Needs 2007: A Report to Congress (May 2010).
- Worst Case Housing Needs 2009: Report to Congress (February 2011).
- Worst Case Housing Needs 2011: Report to Congress (August 2013).
- Worst Case Housing Needs: 2015 Report to Congress (April 2015).
These publications are available on line at http://www.huduser.gov.

70 WORST CASE HOUSING NEEDS 2017 REPORT TO CONGRESS

APPENDIX E. DATA AND METHODOLOGY
71WORST CASE HOUSING NEEDS 2017 REPORT TO CONGRESS
Appendix EData and Methodology A report such as this one requires researchers to use a number of specialized concepts, definitions, and assumptions when analyzing and presenting the data. This appendix documents such elements for those who wish to understand the results more fully or replicate and extend the results in their own research.
Using the American Housing Survey DataThis report uses data from the most recently available American Housing Survey (AHS), conducted in 2015. The AHS, which is the only detailed periodic national housing survey in the United States, is sponsored by HUD and conducted by the Census Bureau. It provides nationally representative data on a wide range of housing subjects, including apartments, single-family homes, mobile homes, vacant homes, family composition, income, housing and neighborhood quality, housing costs, equipment, fuel type, size of housing units, and recent moves. National data are collected every 2 years, from a sample of about 84,400 housing units in 2013 (HUD-Census, 2013) and a new redesigned sample of about 85,400 housing units in 2015 (HUD-Census, 2017a). The survey, which started in 1973, sampled the same housing units between 1985 and 2013, with occasional adjustments and supplements, plus samples of newly constructed units to ensure both continuity and timeliness of the data. To address many challenges in maintaining the AHS longitudinal sample for nearly 30 years, including attrition of housing units, response burden, changes in geography, and disclosure avoidance and mitigation, the 2015 AHS underwent a major redesign. The redesign included selecting a new national and metropolitan area longitudinal sample, changes to weighting methodologies and imputation processes, and a reevaluation of variables. Information from the worst case needs reports has helped inform public policy decisions, including decisions on targeting existing resources, determining the need for additional resources, and choosing the form housing assistance should take.
To accurately estimate worst case needs for federal rental assistance from AHS data, it is essential to determine whether household incomes fall below HUD’s official very low-income limits (50 percent of HUD-adjusted area median family income [HAMFI], also termed Area Median Income [AMI]), whether a household already receives housing assistance, and whether an unassisted income-eligible household has one or more of the priority problems that formerly conferred preference in tenant selection for assistance (rent burdens exceeding 50 percent of income, substandard housing, or being involuntarily displaced).
A national data source that is a reasonable alternative to the AHS for measuring housing needs is the American Community Survey (ACS). The ACS has the advantage of a larger sample size that supports estimates for small geographic areas. Disadvantages of the ACS include addressing housing assistance status in a less comprehensive way and providing much less information about housing

72 WORST CASE HOUSING NEEDS 2017 REPORT TO CONGRESS
unit characteristics. For example, the ACS no longer ascertains whether units contain complete plumbing systems.
Weighting� Because the AHS is based on a sample of housing units rather than a census of all housing units, estimates based on the data must be “weighted up” so that totals for each year match independent estimates of the total housing stock and better represent the full housing stock. The Census Bureau weights up responses to account for undercoverage of households and household nonresponse (about 15 percent). The weights for 2001-through-2009 AHS data used in this report are based on the 2000 Census of Housing, with adjustments for estimated change since then. Since 2011, AHS data have been weighted to 2010 census benchmarks.
Exclusions� Households reporting incomes that are zero or negative are excluded from estimates of worst case needs, although they are included in counts of total households. If such households pay rents greater than the Fair Market Rent and report zero or negative incomes, then their income situation is presumably temporary, and so they are included and higher incomes are imputed to them.
Household and Family TypesIn this report, the terms “family” and “household” are not interchangeable, because not all households are families. Families refers only to a subset of households that have one or more people in the household related to the householder (the first household member age 18 years or older who is listed as an owner or renter of the housing unit) by birth, marriage, or adoption.
Families with children� Households with a child younger than age 18 present are presumed to meet the definition of family through relation by birth or adoption (including grandparents as parents).
Elderly households without children� Households in which the householder or spouse is age 62 or older and in which no children are present. Elderly households may be either family or nonfamily households.
Other family households� Households with a nonelderly householder and no children in which either (1) one or more people are related to the householder by birth, marriage, or adoption; or (2) one or more subfamilies reside there who have members related to each other by birth, marriage, or adoption.
Other nonfamily households� Households with a single nonelderly person living alone or with only nonrelatives. Most of these households comprise single people living alone rather than unrelated people sharing housing.
Households with disabilities� Before 2009, no questions in the AHS were designed to ascertain directly whether individuals suffered from disabilities. Worst case needs reports
for 2007 and earlier identified households containing people with disabilities using various forms of income-based proxies. Households with disabilities (1) were not families with children, (2) were not elderly households, and (3) received some form of income or government assistance that is very likely to indicate that an adult with disabilities is present in the household. Beginning with the 2009 AHS, the survey now asks direct questions about impairments and difficulties with activities of daily living about each household member, including children. This report therefore addresses disability on the basis of people identified with these problems. In this report, elderly people with disabilities do not increase the number of households with disabilities because of the prevalence of disabilities associated with aging.
Housing Assistance StatusIn 1997, the AHS questions intended to identify households receiving rental assistance were changed in both content and order from those used previously. After careful review, HUD and the Census Bureau adopted the following procedure to identify assisted units in a way that produces results that are more comparable with pre-1997 data. These questions were further refined in 2007, as a result of additional cognitive research. Therefore, in this report, receipt of rental assistance is based on respondent reports designed to—
- Determine whether the household must recertify to determine the rent it pays.
- Determine whether the rent is less because of a federal, state, or local government housing program.
- Determine whether the household has a housing voucher, and, if so, whether it can be used to move to another location.
- Determine whether the housing authority is the household’s landlord.
- Determine whether the household was assigned to its housing unit or allowed to choose it.
HUD continues to assess an alternative approach of identifying HUD-assisted households using an administrative data match.
Housing ProblemsRent or cost burden� A ratio of housing costs (including utilities) to household income that exceeds 30 percent, which is a conventional standard for housing affordability. To the extent that respondents underreport total income, the AHS estimates may overcount the number of households with a cost burden. A severe cost burden exceeds 50 percent of reported income. A moderate cost burden exceeds 30 percent but is less than or equal to 50 percent of reported income. Cost burdens qualify as potential worst case needs only if they are severe. Households reporting zero or negative income are defined as having no cost burden.
APPENDIX E. DATA AND METHODOLOGY

73WORST CASE HOUSING NEEDS 2017 REPORT TO CONGRESS
APPENDIX E. DATA AND METHODOLOGY
Inadequate housing� Housing with severe or moderate physical problems, as defined in the AHS since 1984 and modified from time to time to reflect changes in the survey. Severe inadequacies constitute potential worst case needs, but moderate inadequacies do not. The 2007 AHS eliminated the questions about hallways (common stairways and light fixtures) in multiunit structures in the section on selected physical problems, which affects the classification of units having severe or moderate physical problems. Briefly, a unit is defined as having severe physical inadequacies if it has any one of the following four problems.
1� Plumbing� Lacking piped hot water or a flush toilet or lacking both bathtub and shower, all for the exclusive use of the unit.
2� Heating� Having been uncomfortably cold during the past winter for 24 hours or more, or three times for at least 6 hours each, because of broken-down heating equipment.
3� Electrical� Having no electricity or having all three of the following electrical problems: exposed wiring, a room with no working wall outlet, and three or more blown fuses or tripped circuit breakers in the past 90 days.
4� Upkeep� Having any five of the following six maintenance problems: leaks from outdoors, leaks from indoors, holes in the floor, holes or open cracks in the walls or ceilings, more than 1 square foot of peeling paint or plaster, and rats in the past 90 days.
A unit has moderate inadequacies if it has any of the following four problems but none of the severe problems listed previously.
1� Plumbing� Having all toilets break down simultaneously at least three times in the past 3 months for at least 3 hours each time.
2� Heating� Having unvented gas, oil, or kerosene heaters as the main source of heat (because these heaters may produce unsafe fumes and unhealthy levels of moisture).
3� Upkeep� Having any three of the six upkeep problems associated with severe inadequacies.
4� Kitchen� Lacking a sink, range, or refrigerator for the exclusive use of the unit.
Overcrowding� The condition of having more than one person per room in a residence. Overcrowding is counted as a moderate problem rather than a severe problem that constitutes a potential worst case need.
“Priority” problems� Problems qualifying for federal preference in admission to assisted housing programs between 1988 and 1996, including paying more than one-
2 For details about how HUD sets income limits, see http://www.huduser.gov/portal/datasets/il.html.
half of income for rent (severe rent burden), living in severely substandard housing (including being homeless or in a homeless shelter), or being involuntarily displaced. These problems informed the original definition of worst case needs. Because the AHS sample tracks housing units and thus cannot count homeless people, AHS estimates of priority problems are limited to the two severe problems described previously: (1) rent burdens greater than 50 percent of income, or (2) severe physical problems. In accordance with the intention to estimate the number of unassisted very low-income renters with priority problems, the tables in appendix A classify households with a combination of moderate problems and severe problems as having severe problems.
Income MeasurementIncome sources� Income means gross income reported by AHS respondents for the 12 months preceding the interview. For each person in the household, the AHS questionnaire collects the amounts of several different types of income. Income includes amounts reported for wage and salary income, net self-employment income, Social Security or railroad retirement income, public assistance or welfare payments, and all other money income before deductions for taxes or any other purpose. Imputed income from equity is not included as income in this report. In accordance with HUD rules for determining income eligibility for HUD programs, the earnings of teenagers age 17 and younger are not counted as income for this report.
Household income� Reported income from all sources for all household members age 18 and older.
Income CategoriesHAMFI and official income limits� HUD is required by law to set income limits each year that determine the eligibility of applicants for assisted housing programs. In 1974, Congress defined “low income” and “very low income” for HUD rental programs as incomes not exceeding 80 and 50 percent, respectively, of HAMFI. HAMFI is more commonly referred to as AMI, although the latter term may be subject to misinterpretation. Note that income limits are based on Median Family Income (MFI), not on median household income. HUD determines base income limits for a household of four. Income limits are further adjusted by household size: one person, 70 percent of base; two people, 80 percent; three people, 90 percent; five people, 108 percent; six people, 116 percent; and so on. Each household is assigned to an income category using the income limit appropriate to its area and the number of household members.2
Income cutoffs in association with AHS geography� To categorize households in relation to local income limits as accurately as possible within the limitations of the geography

74 WORST CASE HOUSING NEEDS 2017 REPORT TO CONGRESS
given on the AHS public use files, HUD compares household incomes with area income limits. Very low-income and low-income cutoffs for a household of four are defined for each unit of geography identified in the AHS national microdata files. For housing units outside these metropolitan areas, the AHS geography identifies only four regions, metropolitan status, and six climate zones. Average income limits were estimated for each of these 48 locations.
Because developing estimates of official income limits for the geography identified in the AHS microdata was time consuming, before the 2003 AHS release, HUD prepared income limits to use with AHS geography for only 3 years—1978, 1986, and 1995. Income cutoffs for the 2003 AHS release and each subsequent data set have been based on HUD’s current income limits for those years, weighted by AHS weights. The Census Bureau included these cutoffs to the AHS public use file through 2013. To protect respondent confidentiality, income limit variables were restricted to the AHS internal use file in 2015. Additional detail about income limits can be found in the housing costs-affordability section of the AHS Codebook Interactive Tool (HUD-Census, 2017b).
Categorizing households by income� For this report, when households are categorized using the extremely low-, very low-, and low-income cutoffs, the cutoffs are adjusted for household size using the same adjustment factors that HUD programs use.
In addition, households reporting negative income are attributed incomes of slightly more than AMI if their monthly housing costs exceed the FMR and they lived in adequate and uncrowded housing. The justification for imputing higher incomes is that many households in this situation live in housing with amenities such as dining rooms, balconies, and off-street parking, and thus may be reporting temporary accounting losses.
- Extremely low income� Income not in excess of 30 percent of HAMFI, as determined by the extremely low-income cutoff.
- Very low income� Income not in excess of 50 percent of HAMFI, as determined by the very low-income cutoff. Very low income thus includes extremely low income, although the term sometimes is used loosely in specific contexts, such as mismatch analysis, to mean incomes of between 30 and 50 percent of HAMFI.
- Low income� Reported income not in excess of 80 percent of HAMFI, as determined by the low-income cutoff.
3 For more detailed information on 2015 AHS metropolitan areas, see https://obamawhitehouse.archives.gov/sites/default/files/omb/bulletins/2013/b13-01.pdf.
- Middle income� For this report, income exceeding 80 percent and less than 120 percent of HAMFI.
- Upper income� For this report, income exceeding 120 percent of HAMFI.
- Poor� Household income of less than the U.S. national poverty cutoff for that household size. As discussed in appendix A of the Census Bureau’s AHS publications, AHS poverty estimates differ from official poverty estimates made from the Current Population Survey. AHS poverty estimates are based on the income of households rather than the income of families or individuals, and AHS income questions are much less detailed and refer to income during the past 12 months rather than during a fixed period. The poverty cutoff for a family of four approximates 33 percent of HAMFI. Comparisons of income limits with poverty thresholds are presented in tables A-6a, A-6b, A-7, and A-8.
- Earnings at minimum wage� Households with incomes from salary or wages totaling at least as much as one could earn working full-time (40 hours per week for 50 weeks per year) at the federal minimum wage of $7.25 per hour are defined as having at least full-time earnings at minimum wage. Thus, the sum of salary and wage income earned by all persons in the household total at least $14,500 annually. Households with incomes from salary or wages totaling at least one-half that amount ($7,250 annually) are defined as having at least half-time earnings at minimum wage. Comparisons of household earnings characteristics are presented in appendix tables A-6a, A-6b, A-7, and A-8.
LocationMetropolitan Statistical Area� From 1973 to 1983, the definitions of metropolitan location in AHS data corresponded to the 243 standard Metropolitan Statistical Areas used in the 1970 census. From 1984 to 2013, metropolitan location in the AHS referred to the metropolitan statistical areas defined in 1983, based on the 1980 census. The 2015 AHS redesign that selected a new national and metropolitan area longitudinal sample for the first time since 1985 brought metropolitan area definitions up-to-date with the most current Office of Management and Budget delineations based on the 2010 census, which at the time 2015 AHS sample design took place, was February 2013.3
Region� The four census regions are the Northeast, Midwest, South, and West.
APPENDIX E. DATA AND METHODOLOGY

75WORST CASE HOUSING NEEDS 2017 REPORT TO CONGRESS
APPENDIX E. DATA AND METHODOLOGY
Mismatch of Supply and Demand for Affordable Rental HousingMismatch� The discrepancy between the number of rental units needed by renters of various income categories and the number provided by the market that are affordable at those income levels.
Affordability� Several federal rental programs define affordable rents as those requiring not more than 30 percent of an income cutoff defined in relation to HAMFI. Under the Low-Income Housing Tax Credit Program (LIHTC), for example, housing units with rents up to 30 percent of 60 percent of HAMFI qualify as affordable and eligible for the credit.
This report generalizes the approach developed to define LIHTC maximum rents for units of different sizes to define three categories of affordability (extremely low income, very low income, and low income) based on the incomes that are sufficient for the rents—at or less than 30 percent of HAMFI, more than 30 and not more than 50 percent of HAMFI, and more than 50 percent of HAMFI. Gross rents for each unit, including payments for utilities, are compared with 30 percent of HUD’s extremely low-income and very low-income cutoffs.
The income limits used to define rent affordability are adjusted for number of bedrooms using the formula codified at 26 U.S.C. 42(g)(2)(C): no bedrooms, 70 percent of base; one bedroom, 75 percent; two bedrooms, 90 percent; three bedrooms, 104 percent; four bedrooms, 116 percent; and plus 12 percent of base for every additional bedroom. This formula assumes that an efficiency unit houses one person, a one-bedroom unit houses 1.5 people, and each additional bedroom houses another 1.5 people. For vacant units, the costs of any utilities that would be paid by an occupant were allocated using a “hot deck” technique based on a matrix of structure type, AHS climate code, and eight categories of gross rent.
Three measures of affordability� HUD uses three measures to analyze the supply of the rental housing stock in relation to the number of renters with household incomes below specified thresholds—affordable units per 100 renters; affordable and available units per 100 renters; and affordable, available, and adequate units per 100 renters.
Categorizing rental units by affordability and households by income� To analyze the mismatch between affordability and income, HUD compares household incomes and housing unit rents with the current income limits (for income and rent categories up to and including 80 percent of HAMFI) and to a ratio of HAMFI (for categories exceeding 80 percent of HAMFI). As in the analysis of household income, households reporting negative income are redefined as having incomes slightly greater than MFI if their monthly housing costs were more than the FMR and they lived in adequate and uncrowded housing. Units with “no cash rent” reported are
categorized solely on the basis of utility costs. Utility costs are allocated to vacant units through hot-deck imputation based on units that are comparable on the basis of cost, number of units, region, and tenure.
Race and EthnicityIn 2003, the AHS began using revised Census Bureau categories of race and ethnicity that are not directly comparable with the categories used in the AHS from 2001 and earlier. Survey respondents may now select more than one racial group, causing slight but meaningful decreases in the size of previously monolithic categories.

76 WORST CASE HOUSING NEEDS 2017 REPORT TO CONGRESS

77WORST CASE HOUSING NEEDS 2017 REPORT TO CONGRESS
LITERATURE CITED
LITERATURE CITED
Econometrica. 2016. American Housing Survey Components of Inventory Change: 2011–2013. Washington, DC: U.S. Department of Housing and Urban Development, Office of Policy Development and Research. https://www.huduser.gov/portal/datasets/cinch/cinch13/cinch11-13.pdf.
Joint Center for Housing Studies of Harvard University (JCHS). 2006. State of the Nation’s Housing: 2006. Cambridge, MA: Joint Center for Housing Studies of Harvard University. http://www.jchs.harvard.edu/sites/jchs.harvard.edu/files/son2006.pdf.
———. 2016. State of the Nation’s Housing: 2016. Cambridge, MA: Joint Center for Housing Studies of Harvard University. http://www.jchs.harvard.edu/sites/jchs.harvard.edu/files/jchs_2016_state_of_the_nations_housing_lowres.pdf.
U.S. Census Bureau and U.S. Department of Housing and Urban Development (HUD-Census). 2013. 2013 AHS National Sample Design and Weighting. Washington, DC: U.S. Department of Commerce, U.S. Census Bureau. https://www.census.gov/programs-surveys/ahs/tech-documentation/def-errors-changes.2013.html.
———. 2017a. 2015 AHS Integrated National Sample: Sample Design, Weighting, and Error Estimation. Washington, DC: U.S. Department of Commerce, U.S. Census Bureau. https://www.census.gov/programs-surveys/ahs/tech-documentation/def-errors-changes.html.
———. 2017b. AHS Codebook Interactive Tool. Washington, DC: U.S. Department of Commerce, U.S. Census Bureau. https://www.census.gov/data-tools/demo/codebook/ahs/ahsdict.html.
U.S. Department of Housing and Urban Development, Office of Community Planning and Development (HUD-CPD). 2016. The 2016 Annual Homeless Assessment Report (AHAR) to Congress: Part 1, Point-in-Time Estimates of Homelessness. Washington, DC: U.S. Department of Housing and Urban Development, Office of Community Planning and Development. https://www.hudexchange.info/resource/5178/2016-ahar-part-1-pit-estimates-of-homelessness.
U.S. Department of Housing and Urban Development, Office of Policy Development and Research (HUD-PD&R). 2008. Housing Needs of Persons With Disabilities: Supplemental Findings to the Affordable Housing Needs 2005 Report. Washington, DC: U.S. Department of Housing and Urban Development, Office of Policy Development and Research. https://www.huduser.gov/portal/publications/affhsg/affhsgneedsdis.html.
———. 2016. Programs of HUD, 2016: Major Mortgage, Grant, Assistance and Regulatory Programs. Washington, DC: U.S. Department of Housing and Urban Development, Office of Policy Development and Research. https://www.huduser.gov/portal/publications/programs-of-hud.html.

U.S. Department of Housing and Urban Development
Office of Policy Development and Research
Washington, DC 20410-6000
August 2017