comprehensive housing market analysis: memphis - hud user
TRANSCRIPT
C O M P R E H E N S I V E H O U S I N G M A R K E T A N A L Y S I S
As of April 1, 2012U.S. Department of Housing and Urban Development Office of Policy Development and Research
Memphis, Tennessee-Mississippi-Arkansas
Shelby
Tate
Fayette
TennesseeMississippi
Arkansas
Marshall
Tipton
Panola
Tunica
DeSoto
Crittenden
Haywood
Lafayette
Lee
Poinsett
Ben
ton
Mississippi
Cro
ss
Lauderdale
St. Fra
ncis
Un
ion
Coahoma
Qui
tmanP
hil
lip
s
Har
dem
an
Housing Market Area
Market DetailsEconomic Conditions ............... 2
Population and Households ..... 4
Housing Market Trends ............ 6
Data Profiles ........................... 11
Summary
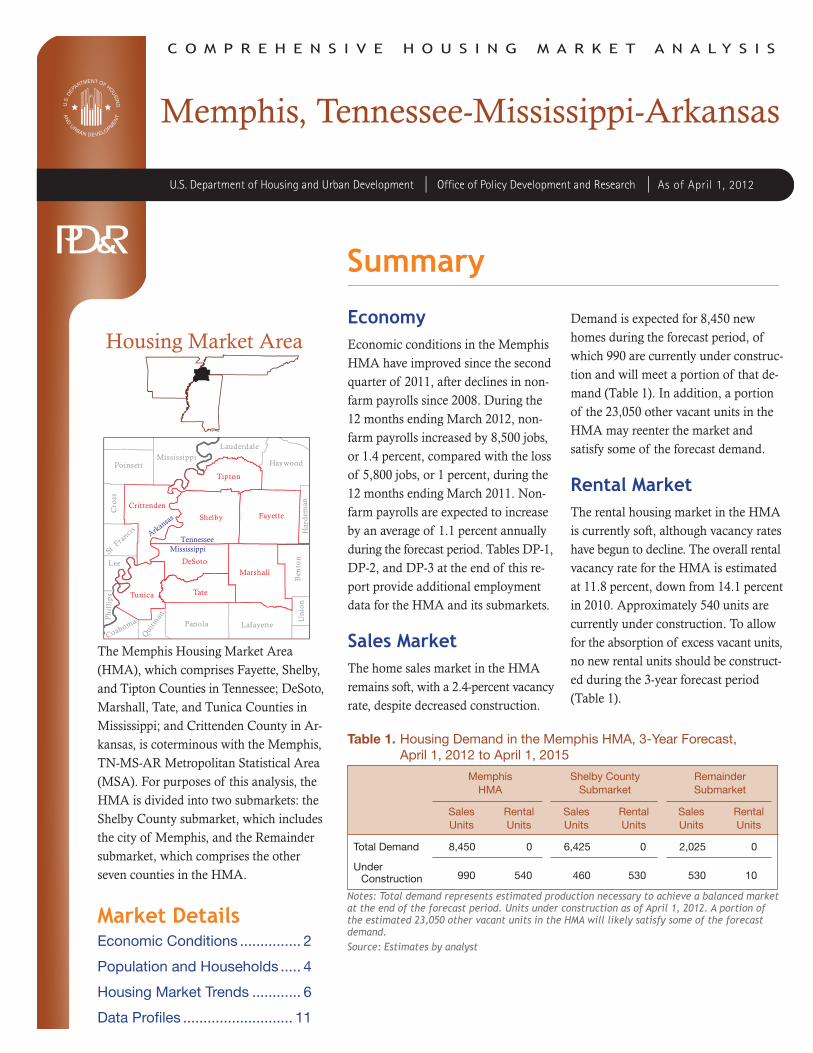
The Memphis Housing Market Area (HMA), which comprises Fayette, Shelby, and Tipton Counties in Tennessee; DeSoto, Marshall, Tate, and Tunica Counties in Mississippi; and Crittenden County in Ar-kansas, is coterminous with the Memphis, TN-MS-AR Metropolitan Statistical Area (MSA). For purposes of this analysis, the HMA is divided into two submarkets: the Shelby County submarket, which includes the city of Memphis, and the Remainder submarket, which comprises the other seven counties in the HMA.
Economy Economic conditions in the Memphis HMA have improved since the second quarter of 2011, after declines in non - farm payrolls since 2008. During the 12 months ending March 2012, non-farm payrolls increased by 8,500 jobs, or 1.4 percent, compared with the loss of 5,800 jobs, or 1 percent, during the 12 months ending March 2011. Non - farm payrolls are expected to increase by an average of 1.1 percent annually during the forecast period. Tables DP-1, DP-2, and DP-3 at the end of this re - port provide additional employment data for the HMA and its submarkets.
Sales MarketThe home sales market in the HMA remains soft, with a 2.4-percent vacancy rate, despite decreased construction.
Demand is expected for 8,450 new homes during the forecast period, of which 990 are currently under construc - tion and will meet a portion of that de - mand (Table 1). In addition, a portion of the 23,050 other vacant units in the HMA may reenter the market and satisfy some of the forecast demand.
Rental MarketThe rental housing market in the HMA is currently soft, although vacancy rates have begun to decline. The overall rental vacancy rate for the HMA is estimated at 11.8 percent, down from 14.1 percent in 2010. Approximately 540 units are currently under construction. To allow for the absorption of excess vacant units, no new rental units should be construct - ed during the 3-year forecast period (Table 1).
Notes: Total demand represents estimated production necessary to achieve a balanced market at the end of the forecast period. Units under construction as of April 1, 2012. A portion of the estimated 23,050 other vacant units in the HMA will likely satisfy some of the forecast demand.Source: Estimates by analyst
Memphis HMA
Shelby County Submarket
Remainder Submarket
SalesUnits
RentalUnits
SalesUnits
RentalUnits
SalesUnits
RentalUnits
Total Demand 8,450 0 6,425 0 2,025 0
Under Construction 990 540 460 530 530 10
Table 1. Housing Demand in the Memphis HMA, 3-Year Forecast, April 1, 2012 to April 1, 2015

Me
mp
his
, T
N-M
S-A
R •
CO
MP
RE
HE
NS
IVE
HO
US
ING
MA
RK
ET
AN
ALY
SIS
2Economic Conditions
Economic conditions in the Memphis HMA have improved
since the second quarter of 2011. During the 12 months ending March 2012, nonfarm payrolls increased by 8,500 jobs, or 1.4 percent, to 598,300, compared with the loss of 5,800 jobs, or 1 percent, during the 12 months ending March 2011 (Table 2). From 2008 through 2010, nonfarm payrolls decreased by an average of 17,000 jobs, or 2.7 percent, annually. Despite recent gains, nonfarm payrolls remain 42,500 jobs below the peak of 640,800 recorded in 2007.
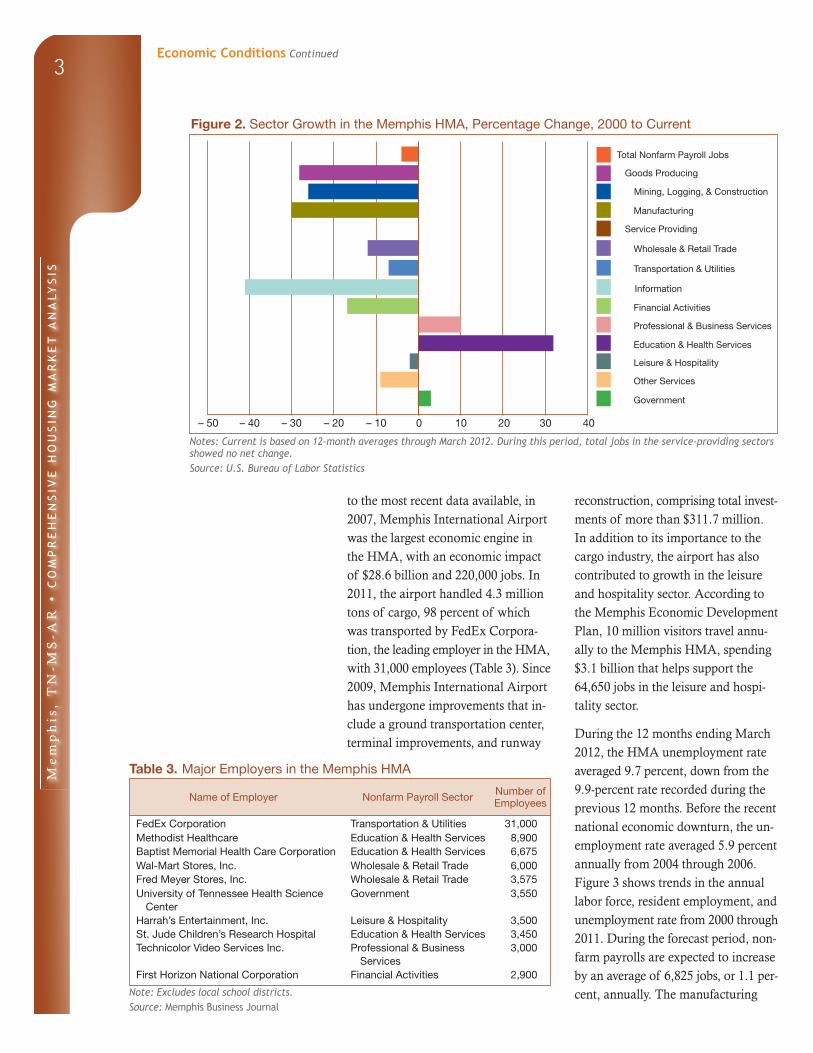
The professional and business ser vices sector led job growth during the 12 months ending March 2012 with an increase of 6,000 jobs, or 7.8 percent, compared with an increase of 1,600 jobs, or 2.1 percent, during the previ-ous 12 months. During the 12 months ending March 2012, job losses were concentrated in the financial activities and the wholesale and retail trade sectors, which decreased by 950 and 800 jobs, or 3.3 and 0.8 percent, re - spectively. The wholesale and retail trade sector, the largest in the HMA (Figure 1), accounts for 16 percent of all nonfarm payroll jobs, down from 17.4 percent in 2000. The education and health services sector has grown the fastest since 2000, increasing 32 percent (Figure 2). During the 12 months ending March 2012, the education and health services sector increased by 2,800 jobs, or 3.5 per-cent, compared with the number of jobs during the previous 12 months. The University of Memphis employs 2,500 faculty and staff, enrolls more than 22,725 students, and has an an - nual economic impact of $1.43 billion on the HMA. Enrollment at the univer - sity is expected to remain stable during the forecast period. The University of Tennessee Health Science Center in Shelby County contributes $2 billion to the local economy each year and employs 3,550 people. In 2011, Meth-odist Healthcare began constructing a $137 million, 100-bed hospital in Olive Branch, DeSoto County, Mississippi, that is expected to create 500 jobs in the HMA.
The HMA is a significant transporta-tion hub, with the largest cargo airport by cargo volume in the nation and second largest in the world. According
Figure 1. Current Nonfarm Payroll Jobs in the Memphis HMA, by Sector
Note: Based on 12-month averages through March 2012.Source: U.S. Bureau of Labor Statistics
Government 14.6%
Leisure & Hospitality 10.8%
Other Services 3.9%
Education & Health Services 14.0%
Professional & Business Services 13.8%
Transportation & Utilities 10.5%
Wholesale & Retail Trade 16.0%
Manufacturing 7.5%
Mining, Logging, & Construction 3.4%
Information 1.0%
Financial Activities 4.6%
Notes: Based on 12-month averages through March 2011 and March 2012. Numbers may not add to totals because of rounding.Source: U.S. Bureau of Labor Statistics
Table 2. 12-Month Average Nonfarm Payroll Jobs in the Memphis HMA, by Sector
12 MonthsEnding
March 2011
12 MonthsEnding
March 2012
Percent Change
Total Nonfarm Payroll Jobs 589,800 598,300 1.4Goods Producing 63,850 64,950 1.7
Mining, Logging, & Construction 19,150 20,300 6.2Manufacturing 44,750 44,600 – 0.3
Service Providing 526,000 533,400 1.4Wholesale & Retail Trade 96,600 95,800 – 0.8Transportation & Utilities 61,600 62,950 2.2Information 6,200 6,050 – 2.7Financial Activities 28,300 27,350 – 3.3Professional & Business Services 76,650 82,650 7.8Education & Health Services 80,850 83,650 3.5Leisure & Hospitality 64,700 64,650 – 0.1Other Services 23,850 23,250 – 2.6Government 87,250 87,150 – 0.1
Me
mp
his
, T
N-M
S-A
R •
CO
MP
RE
HE
NS
IVE
HO
US
ING
MA
RK
ET
AN
ALY
SIS
3Economic Conditions Continued
reconstruction, comprising total invest - ments of more than $311.7 million. In addition to its importance to the cargo industry, the airport has also contributed to growth in the leisure and hospitality sector. According to the Memphis Economic Development Plan, 10 million visitors travel annu-ally to the Memphis HMA, spending $3.1 billion that helps support the 64,650 jobs in the leisure and hospi-tality sector.
During the 12 months ending March 2012, the HMA unemployment rate averaged 9.7 percent, down from the 9.9-percent rate recorded during the previous 12 months. Before the recent national economic downturn, the un-employment rate averaged 5.9 percent annually from 2004 through 2006. Figure 3 shows trends in the annual labor force, resident employment, and unemployment rate from 2000 through 2011. During the forecast period, non - farm payrolls are expected to increase by an average of 6,825 jobs, or 1.1 per - cent, annually. The manufac turing
to the most recent data available, in 2007, Memphis International Airport was the largest economic engine in the HMA, with an economic impact of $28.6 billion and 220,000 jobs. In 2011, the airport handled 4.3 million tons of cargo, 98 percent of which was transported by FedEx Corpora-tion, the leading employer in the HMA, with 31,000 employees (Table 3). Since 2009, Memphis International Airport has undergone improvements that in - clude a ground transportation center, terminal improvements, and runway
Figure 2. Sector Growth in the Memphis HMA, Percentage Change, 2000 to Current
Notes: Current is based on 12-month averages through March 2012. During this period, total jobs in the service-providing sectors showed no net change.Source: U.S. Bureau of Labor Statistics
Total Nonfarm Payroll Jobs
Goods Producing
Mining, Logging, & Construction
Manufacturing
Service Providing
Information
Financial Activities
Professional & Business Services
Education & Health Services
Government
Other Services
Leisure & Hospitality
Transportation & Utilities
Wholesale & Retail Trade
0 10 20 4030– 10– 20– 30– 40– 50
Table 3. Major Employers in the Memphis HMA
Name of Employer Nonfarm Payroll Sector Number of Employees
FedEx Corporation Transportation & Utilities 31,000Methodist Healthcare Education & Health Services 8,900Baptist Memorial Health Care Corporation Education & Health Services 6,675Wal-Mart Stores, Inc. Wholesale & Retail Trade 6,000Fred Meyer Stores, Inc. Wholesale & Retail Trade 3,575University of Tennessee Health Science
CenterGovernment 3,550
Harrah’s Entertainment, Inc. Leisure & Hospitality 3,500St. Jude Children’s Research Hospital Education & Health Services 3,450Technicolor Video Services Inc. Professional & Business
Services3,000
First Horizon National Corporation Financial Activities 2,900
Note: Excludes local school districts.Source: Memphis Business Journal

Me
mp
his
, T
N-M
S-A
R •
CO
MP
RE
HE
NS
IVE
HO
US
ING
MA
RK
ET
AN
ALY
SIS
4Economic Conditions Continued
sector is expected to contribute to job increases during the forecast period because Electrolux, a manufacturer of home appliances, is expected to hire
1,200 people by 2014 to staff a newly constructed, $190 million, 700,000-square-foot manufacturing center.
Population and Households
As of April 1, 2012, the popula -tion of the Memphis HMA
was estimated at 1,331,000, an average annual increase of 7,450, or 0.6 per - cent, since April 1, 2010, down from the average annual increase of 11,100, or 0.9 percent, recorded from 2000 through 2010. Shelby County accounts for 71 percent of the population in the HMA. DeSoto County, the largest of the seven counties in the Remainder submarket, comprises 12 percent of the HMA population. The population in the Shelby County submarket grew by 3,025, or 0.3 percent, annually from 2000 through 2010. In the Remainder submarket, the population increased by 8,075, or 2.4 percent, annually from 2000 through 2010. Since 2010, population growth has increased in the Shelby County submarket to an average 5,825 people, or 0.6 percent, a year, and slowed in the Remainder submarket to an average of 1,675 people, or 0.4 percent, a year.
During the previous decade, out-migration occurred in the Shelby County submarket, but in-migration occurred in the Remainder submarket because of the relatively more afford - able, newer housing in the latter. Since 2010, out-migration has occurred in both submarkets. The Shelby County submarket had an average annual out-migration of 3,900 people from 2000 through 2010, but out-migration has slowed to an average of 800 people annually since 2010. The Remainder submarket had an average annual net in-migration of 5,725 people from 2000 through 2010 but has averaged net out-migration of 250 people annu-ally since 2010. Net natural change (resident births minus resident deaths) accounts for all HMA population growth since 2010 (Figure 4). From 2000 through 2010, net natural in - crease averaged 9,275 people each year, but, since 2010, net natural increase has slowed to an average of
Source: U.S. Bureau of Labor Statistics
Figure 3. Trends in Labor Force, Resident Employment, and Unem-ployment Rate in the Memphis HMA, 2000 Through 2011
Labo
r Fo
rce
&
Res
iden
t Em
ploy
men
t
Une
mpl
oym
ent R
ate
645,000
595,000
545,000
495,000
2000
2002
2004
Labor Force Resident Employment Unemployment Rate
12.0
10.0
8.0
6.0
4.0
2.0
0.0
2006
2001
2003
2005
2007
2009
2010
2011
2008

Me
mp
his
, T
N-M
S-A
R •
CO
MP
RE
HE
NS
IVE
HO
US
ING
MA
RK
ET
AN
ALY
SIS
5Population and Households Continued
8,550 people annually, in part because of an aging population. During the next 3 years, the population is expected to increase by an average of 7,325, or 0.5 percent, annually, and net natural change will account for all population growth. Figure 5 shows population and household growth in the HMA from 2000 through the forecast period.
An estimated 496,800 households currently reside in the HMA, 355,300 in the Shelby County submarket and 141,500 in the Remainder submarket. During the 2000s, household growth in
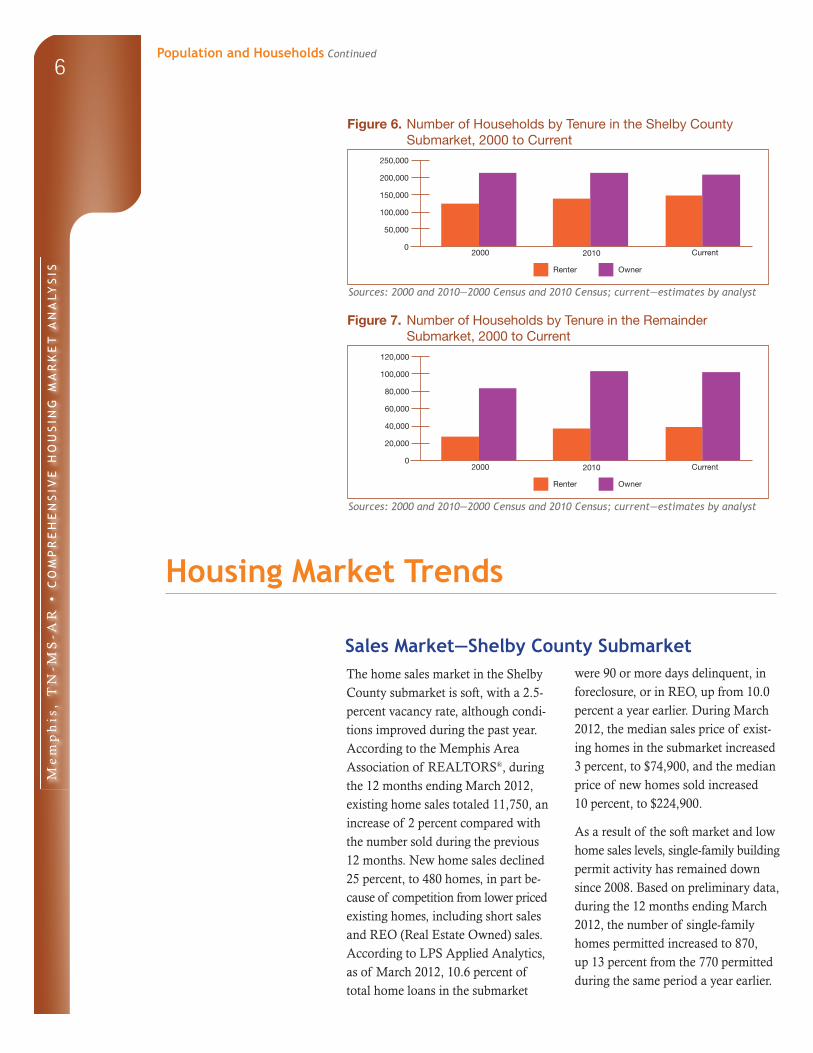
the HMA averaged 4,275 households, or 0.9 percent, a year. An estimated 207,200 households, or 58.3 percent of all households in the Shelby County submarket, are owner households, down from 63.1 percent in 2000 (Figure 6). Of all households in the Remainder submarket, an estimated 102,300, or 72.2 percent, are owner households, down from 74.9 percent in 2000 (Figure 7). The number of households in the HMA is expected to grow by 2,725, or 0.5 percent, annually during the next 3 years, to 505,000 households.
Population Households
Sources: 2000 and 2010—2000 Census and 2010 Census; current and forecast—estimates by analyst
Figure 5. Population and Household Growth in the Memphis HMA, 2000 to Forecast
2000 to 2010 2010 to Current Current to Forecast
Ave
rage
Ann
ual C
hang
e
12,000
10,000
8,000
6,000
4,000
2,000
0
Figure 4. Components of Population Change in the Memphis HMA, 2000 to Forecast
Sources: 2000 and 2010—2000 Census and 2010 Census; current and forecast—estimates by analyst
Net Natural Change Net Migration
2000 to 2010 2010 to Current Current to Forecast
Ave
rage
Ann
ual C
hang
e
10,000
8,000
6,000
4,000
2,000
0
– 2,000
Me
mp
his
, T
N-M
S-A
R •
CO
MP
RE
HE
NS
IVE
HO
US
ING
MA
RK
ET
AN
ALY
SIS
6Population and Households Continued
Housing Market Trends
Sales Market—Shelby County SubmarketThe home sales market in the Shelby County submarket is soft, with a 2.5- percent vacancy rate, although condi - tions improved during the past year. According to the Memphis Area Association of REALTORS®, during the 12 months ending March 2012, existing home sales totaled 11,750, an increase of 2 percent compared with the number sold during the previous 12 months. New home sales declined 25 percent, to 480 homes, in part be - cause of competition from lower priced existing homes, including short sales and REO (Real Estate Owned) sales. According to LPS Applied Analytics, as of March 2012, 10.6 percent of total home loans in the submarket
were 90 or more days delinquent, in foreclosure, or in REO, up from 10.0 percent a year earlier. During March 2012, the median sales price of exist-ing homes in the submarket increased 3 percent, to $74,900, and the median price of new homes sold increased 10 percent, to $224,900.
As a result of the soft market and low home sales levels, single-family building permit activity has remained down since 2008. Based on preliminary data, during the 12 months ending March 2012, the number of single-family homes permitted increased to 870, up 13 percent from the 770 permitted during the same period a year earlier.
Sources: 2000 and 2010—2000 Census and 2010 Census; current—estimates by analyst
Figure 6. Number of Households by Tenure in the Shelby County Submarket, 2000 to Current
Renter Owner
2000 2010 Current
250,000
200,000
150,000
100,000
50,000
0
Sources: 2000 and 2010—2000 Census and 2010 Census; current—estimates by analyst
Figure 7. Number of Households by Tenure in the Remainder Submarket, 2000 to Current
120,000
100,000
80,000
60,000
40,000
20,000
0
Renter Owner
2000 2010 Current

Me
mp
his
, T
N-M
S-A
R •
CO
MP
RE
HE
NS
IVE
HO
US
ING
MA
RK
ET
AN
ALY
SIS
7
The current level of permitting activ-ity is similar to the average of 820 homes permitted annually since 2008 but is significantly less than the 4,275 homes permitted annually during the peak years from 2002 through 2007. Figure 8 illustrates the number of single-family building permits issued in the submarket from 2000 to the current date.
Recent single-family construction activity has occurred throughout 25 subdivisions, with the most activity in Gerland Creek, which is south of Germantown, and Franklin Farms,
which is north of Cordova. Accord-ing to the Chandler Reports, in 2011, Gerland Creek led single-family con - struction activity in the submarket with 60 permits issued and 50 new homes sold at an average price of $140,418. In 2010, Franklin Farms led single-family construction activity with 60 permits issued and 65 new homes sold at an average price of $127,100.
Condominium sales activity contin-ues in downtown Memphis, although sales are down from the peak years of 2006 through 2008. During the 12 months ending March 2012, 100 condominiums sold in downtown Memphis, a decline of 20 homes, or 16 percent, from the previous 12 months. During the peak years from 2006 through 2008, an annual average of 300 condominiums sold, with a peak of 460 in 2006.
During the 3-year forecast period, demand in the submarket is estimated for 6,425 new homes. The 460 homes currently under construction and a portion of the 17,000 other vacant units in the submarket that may re - enter the market will satisfy some of the forecast demand. Table 4 illus-trates the estimated demand for new sales housing in the submarket by price range. Demand is expected to be less in the first year and to increase in the last 2 years of the forecast pe riod as the economy recovers and the in-ventory of unsold homes is absorbed.
Housing Market TrendsSales Market—Shelby County Submarket Continued
2000
2001
2002
2003
2004
2005
2006
Figure 8. Single-Family Building Permits Issued in the Shelby County Submarket, 2000 Through 2012
Notes: Includes townhomes. Includes data through March 2012.Sources: U.S. Census Bureau, Building Permits Survey; estimates by analyst
5,000
4,000
3,000
2,000
1,000
0
2008
2009
2010
2011
2012
2007
Price Range ($) Units of Percent
From To Demand of Total
75,000 99,999 450 7.0100,000 149,999 1,600 25.0150,000 199,999 1,925 30.0200,000 249,999 1,275 20.0250,000 349,999 640 10.0350,000 449,999 320 5.0450,000 549,999 130 2.0550,000 and higher 65 1.0
Note: The 460 homes currently under construction and a portion of the estimated 17,000 other vacant units in the submarket will likely satisfy some of the forecast demand.Source: Estimates by analyst
Table 4. Estimated Demand for New Market-Rate Sales Housing in the Shelby County Submarket, April 1, 2012 to April 1, 2015

Me
mp
his
, T
N-M
S-A
R •
CO
MP
RE
HE
NS
IVE
HO
US
ING
MA
RK
ET
AN
ALY
SIS
8Housing Market TrendsShelby County Submarket Continued
Rental Market—Shelby County Submarket
2012, the area around the university had an apartment vacancy rate of 7.6 percent, down from 11.3 percent in the first quarter of 2011 and the lowest rate within the submarket. In this area, in the first quarter of 2012, the asking rent increased from $610 to $630, or 3 percent, from the first quarter of 2011.
The highest apartment vacancy rates in the submarket are in the area south of downtown Memphis. In this area, during the first quarter of 2012, the apartment vacancy rate was 20 percent, an improvement from the nearly 27- percent vacancy rate recorded in the first quarter of 2011. During the first quarter of 2012, the average asking rent was $410, unchanged from the first quarter of 2011. The area has a large number of older units; 82 per - cent of the 3,900 apartment units surveyed were built before 1970.
Multifamily construction activity, as measured by the number of multifamily units permitted, has declined since 2007, when 2,350 units were permit-ted. Multifamily permitting reached a low of 280 units in 2009 because of high rental vacancy rates and the large number of job losses during the economic recession (Figure 10). Based on preliminary data, during the 12 months ending March 2012, the number of multifamily units per - mitted decreased 10 percent, to 530 units, compared with the number per - mitted during the previous 12 months. An estimated 530 multifamily rental units are currently under construction in the submarket. Orleans Place at Walnut Grove, a 180-unit apartment complex, is under construction and expected to be complete in 2012.
The rental housing market in the Shelby County submarket is currently soft, because a large number of older apartment properties in south Memphis continue to have high vacancy rates. The current estimated 12.3-percent rental vacancy rate is up from the 8.3-percent rate recorded in 2000 but is down from the 15.2-percent rate in 2010 (Figure 9). The market has tight - ened since 2010 because fewer units have entered the market and the num-ber of renter households has grown.
According to Reis, Inc., during the first quarter of 2012, the average apart - ment vacancy rate was 9.7 percent, down from the 11.4-percent rate re - corded during the first quarter of 2011. Asking rents increased 2 percent, to $700, and monthly rents averaged $640, $700, and $910 for one-, two-, and three-bedroom units, respectively.
The submarket is home to the Univer - sity of Memphis, which enrolls 22,725 students and provides on-campus housing for 2,200; most of the remain - ing 20,525 students reside off campus in the area surrounding the university. With stable enrollment over the past decade, no units are under construc-tion or in planning on campus or near the university. In the first quarter of
Sources: 2000 and 2010—2000 Census and 2010 Census; current—estimates by analyst
2000 Current2010
8.3
12.3
15.216.0
14.0
12.0
10.0
8.0
6.0
4.0
2.0
0.0
Figure 9. Rental Vacancy Rates in the Shelby County Submarket, 2000 to Current

Me
mp
his
, T
N-M
S-A
R •
CO
MP
RE
HE
NS
IVE
HO
US
ING
MA
RK
ET
AN
ALY
SIS
9Housing Market TrendsRental Market—Shelby County Submarket Continued
completed 200-unit apartment com -plex on Mud Island in downtown Memphis, has asking rents starting at $940 for a one-bedroom unit, $1,325 for a two-bedroom unit, and $1,600 for a three-bedroom unit.
During the 3-year forecast period, no new market-rate rental units should be constructed in the sub -market. The 530 units currently under construc-tion will satisfy demand for new units beyond the 3-year forecast period.
Sales Market—Remainder Submarket
The home sales market in the Re - mainder submarket is soft, with a 2.2-percent vacancy rate. According to the Northwest Mississippi Associ- ation of Realtors®, during the 12 months ending March 2012, new and existing home sales in DeSoto, Marshall, Tate, and Tunica Counties in Mississippi totaled 2,525 homes, a 1-percent in - crease compared with the number sold during the previous 12 months. DeSoto County is a high-growth area that accounts for 95 percent of sales in the four counties. During March 2012, the median price of single-family homes sold in the submarket decreased by $7,500, or 6 percent, to $118,500. DeSoto County has the greatest percentage of distressed loans, 55 percent, in the submarket, contrib-uting to the recent drop in sales prices in the county. According to LPS Ap - plied Analytics, as of March 2012, 9.5 percent of total home loans in the submarket were 90 or more days delinquent, in foreclosure, or in REO, up from 8.7 percent a year earlier.
According to the Memphis Area As-sociation of REALTORS®, during the 12 months ending March 2012, new and existing home sales in Tipton and Fayette Counties in Tennessee totaled 1,075 homes, virtually unchanged from the previous 12 months. Tipton County accounts for 60 percent of the sales from these counties. During March 2012, the median price of a single-family home sold in Tipton County increased by $7,450, or 7 per - cent, to $112,500, and the median price of a single-family home sold in Fayette County increased by $22,600, or 17 percent, to $159,900, compared with sales prices during the previous 12 months. Higher home sales prices and more rapid price increases in Fayette County are a result of fewer distressed home sales. Fayette County has the fewest distressed loans in the submarket.
Single-family building permitting ac - tivity is increasing in the submarket, but the level of permits issued remains less than levels recorded from 2000
Asking rents at Orleans Place start at approx imately $850 for a one-bedroom unit, $990 for a two-bedroom unit, and $1,200 for a three-bedroom unit. Grand Island Apartments, a recently
2012
2000
2001
2002
2003
2004
2005
2006
Figure 10. Multifamily Building Permits Issued in the Shelby County Submarket, 2000 Through 2012
Notes: Excludes townhomes. Includes data through March 2012.Sources: U.S. Census Bureau, Building Permits Survey; estimates by analyst
3,500
3,000
2,500
2,000
1,500
1,000
500
0
2008
2009
2010
2011
2007

Me
mp
his
, T
N-M
S-A
R •
CO
MP
RE
HE
NS
IVE
HO
US
ING
MA
RK
ET
AN
ALY
SIS
10Housing Market TrendsSales Market—Remainder Submarket Continued
through 2007. Based on preliminary data, during the 12 months ending March 2012, the number of single- family homes permitted in the sub - market increased to 880, up 10 percent
from the 800 homes permitted during the previous 12 months. Permitting activity has declined significantly since 2005, when 4,950 homes were permitted. From 2008 through 2011, an average of 1,025 homes was per - mitted annually. Figure 11 shows the number of single-family building permits issued in the submarket from 2000 to the current date.
During the 3-year forecast period, demand is estimated for 2,025 new homes in the submarket. The 530 homes currently under construction and a portion of the 6,025 other va - cant units in the submarket that may reenter the market will satisfy some of the forecast demand. Table 5 illustrates the estimated demand for new sales housing in the submarket by price range. Demand is expected to be less in the first year and to increase in the last 2 years of the forecast period as the economy recovers and the inven-tory of unsold homes is absorbed.
2000
2001
2002
2003
2004
2005
2006
Figure 11. Single-Family Building Permits Issued in the Remainder Submarket, 2000 Through 2012
Notes: Includes townhomes. Includes data through March 2012.Sources: U.S. Census Bureau, Building Permits Survey; estimates by analyst
5,000
4,000
3,000
2,000
1,000
0
2008
2009
2010
2011
2012
2007
Price Range ($) Units of Percent
From To Demand of Total
75,000 99,999 140 7.0100,000 149,999 510 25.0150,000 199,999 610 30.0200,000 249,999 410 20.0250,000 349,999 200 10.0350,000 449,999 100 5.0450,000 549,999 40 2.0550,000 and higher 20 1.0
Note: The 530 homes currently under construction and a portion of the estimated 6,025 other vacant units in the submarket will likely satisfy some of the forecast demand.Source: Estimates by analyst
Table 5. Estimated Demand for New Market-Rate Sales Housing in the Remainder Submarket, April 1, 2012 to April 1, 2015
Rental Market—Remainder Submarket
up from 6.7 percent in 2000 but is virtually unchanged from 10.0 percent in 2010 (Figure 12).
According to The Source, during 2011, the most recent data available, the average apartment vacancy rate in DeSoto County decreased to 6.1 percent, down from the 6.3-percent rate recorded during 2010. Market rents in DeSoto County increased 1 percent, to approximately $760, and averaged $670 for a one-bedroom unit, $750 for a two-bedroom unit, and $840 for a three-bedroom unit.
The rental housing market in the Re - mainder submarket is currently soft, in part because of out-migration that began in 2010. The current estimated rental vacancy rate of 9.9 percent is
Sources: 2000 and 2010—2000 Census and 2010 Census; current—estimates by analyst
2000 Current2010
6.7
9.910.010.0
8.0
6.0
4.0
2.0
0.0
Figure 12. Rental Vacancy Rates in the Remainder Submarket, 2000 to Current

Me
mp
his
, T
N-M
S-A
R •
CO
MP
RE
HE
NS
IVE
HO
US
ING
MA
RK
ET
AN
ALY
SIS
11Housing Market TrendsRental Market—Remainder Submarket Continued
2012
2000
2001
2002
2003
2004
2005
2006
Figure 13. Multifamily Building Permits Issued in the Remainder Submarket, 2000 Through 2012
Notes: Excludes townhomes. Includes data through March 2012.Sources: U.S. Census Bureau, Building Permits Survey; estimates by analyst
1,400
1,200
1,000
800
600
400
200
0
2008
2009
2010
2011
2007
From 2000 through 2010, the number of renter households in the submarket increased by an average annual rate of 1,025 but, since 2010, the number of renter households has increased by an average annual rate of only 720. The slowing growth rate of renter house-holds has led to increasing vacancy
rates that have induced developers to reduce multifamily construction activity. Based on preliminary data, during the 12 months ending March 2012, the number of multifamily units permitted decreased to 10 units com - pared with the 50 units permitted dur- ing the previous 12 months (Figure 13). By comparison, an average of 380 units was permitted annually from 2004 through 2007. An estimated 10 multi - family rental units are currently under construction and scheduled for com - pletion in 2012.
During the 3-year forecast period, no new market-rate rental units should be constructed in the submarket to allow for the excess supply of vacant available units to be absorbed.
NA = data not available.
Notes: Numbers may not add to totals because of rounding. Employment data represent annual averages for 2000, 2010, and the 12 months through March 2012. Median family incomes are for 2009 and 2010.
Sources: U.S. Census Bureau; U.S. Department of Housing and Urban Development; estimates by analyst
Table DP-1. Memphis HMA Data Profile, 2000 to Current
Average Annual Change (%)
2000 2010 Current 2000 to 2010 2010 to Current
Total Resident Employment 570,963 552,724 565,500 – 0.3 1.8
Unemployment Rate 3.8% 10.1% 9.7%
Nonfarm Payroll Jobs 624,400 589,800 598,400 – 0.6 1.2
Total Population 1,205,204 1,316,100 1,331,000 0.9 0.6
Total Households 448,473 491,198 496,900 0.9 0.6
Owner Households 295,806 314,430 309,500 0.6 – 0.8
Percent Owner 66.0% 64.0% 62.3%
Renter Households 152,667 176,768 187,400 1.5 3.0
Percent Renter 34.0% 36.0% 37.7%
Total Housing Units 480,845 550,896 552,600 1.4 0.2
Owner Vacancy Rate 1.8% 2.7% 2.4%
Rental Vacancy Rate 8.0% 14.1% 11.8%
Median Family Income NA $57,800 $58,100 NA 0.5
Data Profiles

Me
mp
his
, T
N-M
S-A
R •
CO
MP
RE
HE
NS
IVE
HO
US
ING
MA
RK
ET
AN
ALY
SIS
12
Note: Numbers may not add to totals because of rounding.
Sources: U.S. Census Bureau; U.S. Department of Housing and Urban Development; estimates by analyst
Table DP-3. Remainder Submarket Data Profile, 2000 to Current
Average Annual Change (%)
2000 2010 Current 2000 to 2010 2010 to Current
Total Population 307,732 388,456 391,800 2.4 0.4
Total Households 110,107 140,227 141,600 2.4 0.5
Owner Households 82,446 102,414 102,300 2.2 – 0.1
Percent Owner 74.9% 73.0% 72.3%
Rental Households 27,661 37,813 39,250 3.2 1.9
Percent Renter 25.1% 27.0% 27.7%
Total Housing Units 117,891 152,622 154,200 2.6 0.5
Owner Vacancy Rate 1.7% 2.3% 2.2%
Rental Vacancy Rate 6.7% 10.0% 9.9%
Note: Numbers may not add to totals because of rounding.
Sources: U.S. Census Bureau; U.S. Department of Housing and Urban Development; estimates by analyst
Table DP-2. Shelby County Submarket Data Profile, 2000 to Current
Average Annual Change (%)
2000 2010 Current 2000 to 2010 2010 to Current
Total Population 897,472 927,644 939,300 0.3 0.6
Total Households 338,366 350,971 355,300 0.4 0.6
Owner Households 213,360 212,016 207,200 – 0.1 – 1.1
Percent Owner 63.1% 60.4% 58.3%
Rental Households 125,006 138,955 148,100 1.1 3.2
Percent Renter 36.9% 39.6% 41.7%
Total Housing Units 362,954 398,274 398,400 0.9 0.0
Owner Vacancy Rate 1.9% 2.8% 2.5%
Rental Vacancy Rate 8.3% 15.2% 12.3%
Data Profiles Continued
Me
mp
his
, T
N-M
S-A
R •
CO
MP
RE
HE
NS
IVE
HO
US
ING
MA
RK
ET
AN
ALY
SIS
13
Data Definitions and Sources
2000: 4/1/2000—U.S. Decennial Census
2010: 4/1/2010—U.S. Decennial Census
Current date: 4/1/2012—Analyst’s estimates
Forecast period: 4/1/2012–4/1/2015—Analyst’s
estimates
Demand: The demand estimates in the analysis
are not a forecast of building activity. They are
the estimates of the total housing production
needed to achieve a balanced market at the end
of the 3-year forecast period given conditions on
the as-of date of the analysis, growth, losses, and
excess vacancies. The estimates do not account
for units currently under construction or units in
the development pipeline.
Other Vacant Units: In the U.S. Department of
Housing and Urban Development’s (HUD’s)
analysis, other vacant units include all vacant
units that are not available for sale or for rent.
The term therefore includes units rented or sold
but not occupied; held for seasonal, recreational,
or occasional use; used by migrant workers; and
the category specified as “other” vacant by the
Census Bureau.
Building Permits: Building permits do not neces-
sarily reflect all residential building activity that
occurs in an HMA. Some units are constructed
or created without a building permit or are issued
a different type of building permit. For example,
some units classified as commercial structures are
not reflected in the residential building permits.
As a result, the analyst, through diligent fieldwork,
makes an estimate of this additional construction
activity. Some of these estimates are included in
the discussions of single-family and multifamily
building permits.
For additional data pertaining to the housing
market for this HMA, go to www.huduser.
org/publications/pdf/CMARtables_
MemphisTN-MS-AR_12.pdf.
Contact Information
Gareth D. Amon, Economist
Atlanta HUD Regional Office
678–732–2102
This analysis has been prepared for the assistance and
guidance of HUD in its operations. The factual informa-
tion, findings, and conclusions may also be useful to
builders, mortgagees, and others concerned with local
housing market conditions and trends. The analysis
does not purport to make determinations regarding the
acceptability of any mortgage insurance proposals that
may be under consideration by the Department.
The factual framework for this analysis follows the
guidelines and methods developed by HUD’s Economic
and Market Analysis Division. The analysis and findings
are as thorough and current as possible based on informa -
tion available on the as-of date from local and national
sources. As such, findings or conclusions may be modi-
fied by subsequent developments. HUD expresses its
appreciation to those industry sources and state and local
government officials who provided data and information
on local economic and housing market conditions.
For additional reports on other market areas, please go to www.huduser.org/publications/econdev/mkt_analysis.html.