world topographic map contributors - esridownloads.esri.com/esri_content_doc/da/world... · data...
TRANSCRIPT

Data Appliance 6.1
World Topographic Map Contributors The following tables name the current Community Maps Program contributors to the World Topographic Map hosted by Esri and provide information on their specific content. The basemap was compiled to uniform cartography using a variety of best available sources from these data providers.
These tables name the contributors for global, United States, international, and local area data.
Global Data
Contributor Description Coverage Year Scale Range
Food and Agriculture Organization of the United Nations (FAO)
Global Forest Resources Assessment data for forest canopy cover
Global 2005 ~1:584,000,000 down to ~1:1,100,000
National Geophysical Data Center (NGDC)
ETOPO2 data for ocean depth tint Global 2006 ~1:584,000,000 down to ~1:1,100,000
U.S. Geological Survey (USGS) EROS Data Center, National Aeronautics and Space Administration (NASA), and National Geospatial Intelligence Agency (NGA)
SRTM 90m (1 Arc Second) data for hillshade for land
Between 60 degrees south and north
2000 ~1:584,000,000 down to ~1:1,100,000
National Geospatial Intelligence Agency (NGA)
Vmap Level 0, edition 5, for elevation points and labels
Global 1992 ~1:1,150,000 down to ~1:72,000

Data Appliance 6.1
Contributor Description Coverage Year Scale Range
DeLorme
DeLorme World Base Map, including:
• Administrative borders • Land cover • Water bodies • Transportation networks and
airports • Contours and physiographic
features • Cities and place names
Global 2011 ~1:1,150,000 down to ~1:72,000
Environmental Systems Research Institute, Inc. (Esri)
Marine water bodies including labels down to ~1:2.300,000
Physiographic Features
Country boundaries, sub-political units, and cities including labels
Global 2005
2006 -2009
~1:72,000,000 down to ~1:72,000
General Bathymetric Chart of the Oceans (GEBCO)
Bathymetric color tints Global 2010 ~1:591,000,000 down to ~1:1,000,000
MDA Federal NaturalVue land cover and vegetation Global 2012 ~1:591,000,000 down to ~1:9,000

Data Appliance 6.1
United States Data
Contributor Description Coverage Year Scale Range
U.S. Geological Survey (USGS) EROS Data Center
30m (1 arc second) SRTM NED data for:
• Hillshade • Contours beginning at
~1:288,000 • Hillshade at ~1:72,000 where
10m DEM is not available
Lower 48 U.S. States 2003 ~1:577,000 down to ~1:18,000
U.S. Geological Survey (USGS) EROS Data Center
10m DEM data for hillshade Lower 48 U.S. States 2003 ~1:72,000 down to ~1:18,000
U.S. Geological Survey (USGS) EROS Data Center
Hillshade and contours Hawaii 2008 ~1:577,000 down to ~1:18,000
U.S. Geological Survey (USGS) EROS Data Center
30m NLCD data for Forest Canopy Lower 48 U.S. States and Hawaii
1992 ~1:4,500,000 down to ~1:18,000
U.S. Geological Survey - U.S. Board on Geographic Names (BGN)
Named Mountains and Hills with elevation from U.S. Geographic Names Information System Summits (gsummit)
Arkansas 2008 ~1:9,000 down to ~1:4,500
U.S. Environmental Protection Agency (USEPA) and the U.S. Geological Survey (USGS) EROS Data Center
NHD PLus hydrography data for:
• Freshwater hydrography • Ocean/coasts tints for gaps
starting at ~1:577,000 • For ~1:144,000 down to
~1:18,000, ESRI improved the data, adding key missing features, and worked on the attributes
• For smaller scales, ESRI generalized the data; producing one additional edition of the
United States 2005 ~1:72,000,000 down to ~1:18,000
Return to top

Data Appliance 6.1
Contributor Description Coverage Year Scale Range
areas and water bodies feature classes, and two smaller scale editions of the flowlines. These generalized data start appearing at ~1:72,000,000 for the flowlines, and the water bodies and areas begin appearing at ~1:9,000,000.
U.S. Environmental Protection Agency (USEPA) and the U.S. Geological Survey (USGS) EROS Data Center
NHD data for:
• Flowlines, waterbodies, areas, points
Arkansas 2009 ~1:36,000 down to ~1:4,500
U.S. National Park Service (NPS) Data for:
• State Parks, Military Bases, Urban Areas, State and County Boundaries
• Local Parks and National Lands starting at ~1:288,000
• Railroads starting at ~1:36,000 • Building footprints at ~1:4,500
Arkansas 2009 ~1:577,000 down to ~1:4,500
TomTom MultiNet data for:
• Airports • Small city points at ~1:9,000
Arkansas 2008 ~1:9,000 down to ~1:4,500

Data Appliance 6.1
Contributor Description Coverage Year Scale Range
TomTom
MultiNet data for:
• Road data • Local parks • Local landmarks
Various US Cities, Counties and States.
2010
~1:577,000 down to ~1:1,000
Environmental Systems Research Institute, Inc. (Esri)
Data & Maps DVD for roads United States 2007 ~1:4,500,000 down to ~1:1,150,000
Environmental Systems Research Institute, Inc. (Esri)
Data & Maps DVD for U.S. Geographic Names Information System Summits (gsummit) for proper names and locations of points, spot heights, and elevations
United States 1974-2007
~1:577,000 down to ~1:18,000
Environmental Systems Research Institute, Inc. (Esri)
Marine water bodies including labels Physiographic Features including labels City areas
United States
2006-2009
~1:577,000 down to ~1:18,000
Environmental Systems Research Institute, Inc. (Esri)
Contours derived from USGS 1 Arc Second NED
Physiographic Features including labels at ~1:9,000
Arkansas 2003
2009
~1:9,000 down to ~1:4,500
HERE Basemap data from HERE Maps United States 2011 ~1:288,000 down to ~1:1,000
increment P Corp. Buildings and land use United States 2012 ~1:144,000 down to ~1:1,000

Data Appliance 6.1
International Data
Contributor Description Coverage Year Scale Range
Natural Resources Canada (NRCan) CanVec1, 2 data for:
• Coastal water, water bodies, permanent snow and ice, glacial debris, extraction areas, single line water courses, wooded areas, golf courses, residential zones, industrial and commercial areas, and named features
• Operational railways, standard gauge for ~1:72,000
• Railways, trails, and campgrounds for ~1:36,000 down to ~1:18,000
• Summits for ~1:18,000 were derived by ESRI Canada from CanVec spot heights and NRCAN mountain summits
Canada 2009 ~1:72,000 down to ~1:18,000
Natural Resources Canada (NRCan) The Atlas of Canada1, 2 data for First Nations Land, glaciers, lakes, and mountains including annotation for lakes and mountains
Canada 2009 ~1:72,000 down to ~1:18,000
Agriculture and Agri-Food Canada Provincial borders Canada 2009 ~1:72,000 down to ~1:18,000
Ministry of Economy, Trade, and Industry (METI) of Japan and the United States National Aeronautics and Space Administration (NASA)
ASTER Global Digital Elevation Model (G-DEM) for:
• Shaded relief, Contours
Africa, Australia, Central America, Europe, India, Mexico, Middle East, New Zealand, South America
2009 ~1:72,000 down to ~1:18,000
Return to top

Data Appliance 6.1
Contributor Description Coverage Year Scale Range
U.S. National Geospatial-Intelligence Agency (NGA)
Edition 5 of VMAP Level 0 for elevation points
Western Europe 1992 ~1:72,000 down to ~1:18,000
DeLorme • Land cover • Land use • Summits • Hydropoints
Africa, Australia, Central America, Europe, India, Mexico, Middle East, New Zealand, South America
2009-2013
~1:72,000 down to ~1:18,000
Environmental Systems Research Institute, Inc. (ESRI)
Named physiographic features derived from CIA World Factbook and USGS DRGs
Africa, Australia, Central America, Europe, India, Mexico, Middle East, New Zealand, South America
2009 ~1:72,000 down to ~1:18,000
mapwithyou Basemap data Hong Kong and Macau 2012 ~1:72,000 down to ~1:1,000
GISsat Basemap data Suriname 2013 ~1:577,000 down to ~1:1,000
HERE Basemap data from HERE Maps Africa, Australia, Central America, Europe, India, Mexico, Middle East, New Zealand, South America
2011-2012
~1:288,000 down to ~1:1,000
Singapore Land Authority OneMap Singapore 2011 ~1:144,000 down to ~1:1,000
Esri Romania
Basemap data Romania
Cities of Oradea and Galati
2012
2013
~1:577,000 down to ~1:1,000
~1:9,000 down to ~1:1,000
Esri (UK) Ltd. Ordnance Survey Open Data4 Great Britain 2013 ~1:577,000 down to ~1:1,000
Czech Republic – Zememericky urad and ArcData Praha
Basemap data Czech Republic
Albertov Campus, Prague and Massaryk Campus, Brno
2013
~1:577,000 down to ~1:1,000
Terra Mapping the Globe Ltd Basemap data Greece 2011 ~1:577,000 down to ~1:1,000

Data Appliance 6.1
Contributor Description Coverage Year Scale Range
Esri Nederland B.V. Kadaster, the Netherlands
Rijkswaterstaat (RWS)
Netherlands and the City of Rotterdam
2013 ~1:72,000 down to ~1:1,000
Esri Nederland B.V. Kadaster, the Netherlands
GIS4C
Islands of Aruba, Bonaire, Curacao, Sint Maarten, Saba, and Sint Eustatius
2012 ~1:72,000 down to ~1:4,500
Esri Romania Basemap data Romania 2011 ~1:577,000 down to ~1:144,000
SAMBUS CO. LTD – GIS/GPS Section & Spatial Solution & Services
Basemap data Ghana 2011 ~1:577,000 down to ~1:1,000
Ghana Water Company Ltd Basemap data Accra, Tema, Ashanti Region, Ghana
2011 ~1:18,000 down to ~1:1,000
Openware Information System Consulting Company
Basemap data Kuwait 2013 ~1:577,000 down to ~1:1,000
City of Melbourne Basemap data Melbourne, Australia 2011 ~1:9,000 down to ~1:1,000
State Nature Conservancy of the Slovak Republic
National Forest Centre
Basemap data Slovakia 2013 ~1:577,000 down to ~1:1,000
SITG – Geneva’s Territory Information System
Basemap data Geneva, Switzerland 2012 ~1:9,000 down to ~1:1,000
Esri Japan Corporation Basemap data Japan 2012 ~1:577,000 down to ~1:1,000
increment P Corp. (IPC) Basemap data Europe and Japan 2012 ~1:18,000 down to ~1:1,000
Japan Digital Road Map Association Basemap data Japan 2012 ~1:577,000 down to ~1:1,000

Data Appliance 6.1
Contributor Description Coverage Year Scale Range
SAMSYN ehf.
City of Reykjavik LUKR
Basemap data Cities of Akureyri, Borgarnes, Selfoss, Egilsstaoir, Isafjordur, Reykjanesbeer, Stykkisholmur, Akranes, and Reykjavik, Iceland
2012 ~1:9,000 down to ~1:1,000
Grupo Esri de Venezuela, C.A. Basemap data Cities of Maracaibo and San Francisco, Venezuela
2012 ~1:72,000 down to ~1:1,000
Warsaw University of Life Sciences Basemap data Warsaw Campus and Rogow Campus, Poland
2013 ~1:9,000 down to ~1:1,000
University Jaume I of Castellon Basemap data Campus of University Jaume I, Castellon de la Plana, Spain
2012 ~1:9,000 down to ~1:1,000
GIS-Expert sp. Z o.o./Esri Polska Basemap data EuroPark Mielec SSE, Lublin, Poland
2012 ~1:9,000 down to ~1:1,000
Gdi GISDATA LLC. Basemap data Bosnia & Herzegovina 2012 ~1:577,000 down to ~1:1,000
ViennaGIS®, City of Vienna Basemap data Vienna, Austria 2013 ~1:9,000 down to ~1:1,000
University of Agriculture Basemap data University of Agriculture Campus, Krakow, Poland
2012 ~1:9,000 down to ~1:1,000
Royal Jordanian Geographic Center (RJGC) 6
King Abdullah II Design and Development Bureau7
Basemap data Jordan 2012 ~1:577,000 down to ~1:1,000
Farsi Geotech Basemap data – Farsi MAPS Kingdom of Saudi Arabia 2012
~1:577,000 down to ~1:1,000

Data Appliance 6.1
Contributor Description Coverage Year Scale Range
Esri Finland Oy Basemap data – National Land Survey of Finland
Finland 2012 ~1:577,000 down to ~1:1,000
GEOMATIC Basemap data Morocco 2012 ~1:288,000 down to ~1:1,000
L’Institut national de I’information geographique et forestiere (IGN)
Basemap data France 2013 ~1:72,000 down to ~1:1,000
MapmyIndia Basemap data India 2013 ~1:288,000 down to ~1:1,000
BELCO Basemap data Bermuda 2013 ~1:288,000 down to ~1:1,000
© OpenStreetMap contributors Basemap data Africa 2013 ~1:288,000 down to ~1:1,000
Danish Geodata Agency Basemap data – Administrative Boundaries, Building Footprints, Facility Sites, OwnerParcels, Railroads, Roads, Trails, Trees, Waterbody, Waterline
Denmark 2013 ~1:288,000 down to ~1:1,000
Forest Research Institute (IBL) Basemap data Forest Research Institute, Raszyn, Poland
2014 ~1:9,000 down to ~1:1,000
1 Portions of this data originate from GeoBase®. Use of the Data shall not be construed as an endorsement by GeoBase®. All distributed data should be accessed and used relatively to the GeoBase Unrestricted Use Licence Agreement. With this licence, users are granted a non-exclusive, fully paid, royalty-free right and licence to exercise all intellectual property rights in the data. This includes the right to use, incorporate, sublicense (with further right of sublicensing), modify, improve, further develop, and distribute the data; and to manufacture and/or distribute Derivative Products. The Licensee shall identify GeoBase as a data source.
2 Portions of this data originate from © Department of Natural Resources Canada. All rights reserved.
3© Instituto Geografico Nacional De Espana. All rights reserved.

Data Appliance 6.1
4 Contains Ordnance Survey data © Crown copyright and database right 2011
5 The end user may reproduce and redistribute SwissTopo Data displayed through the service solely for its internal use, noncommercial use, or for any purpose expressly authorized under Swiss law without a government-issued commercial use mapping license.
6 © Royal Jordanian Geographic Center (RJGC Copyright Notice)
7 © KADDB (KADDB Copyright Notice)
Local Area Data for North America
Contributor Coverage Scale Range
Ada County Assessor Ada County, Idaho 1:9,000 down to 1:1,000
City of Airdrie Airdrie, Alberta, Canada 1:9,000 down to 1:1,000
Return to top

Data Appliance 6.1
Contributor Coverage Scale Range
Alachua County Property Appraiser (ACPA) Alachua County, Florida 1:9,000 down to 1:1,000
City of Albuquerque Albuquerque/Bernalillo County, New Mexico 1:9,000 down to 1:1,000
City of Amherst
University of Massachusetts, Amherst
Amherst, Massachusetts
University of Massachusetts, Amherst
1:9,000 down to 1:1,000
City of Anaheim
Anaheim, California 1:9,000 down to 1:1,000
Municipality of Anchorage Anchorage, Alaska 1:9,000 down to 1:1,000
City of Anderson Anderson, South Carolina 1:9,000 down to 1:1,000
City of Appleton Appleton, Wisconsin 1:9,000 down to 1:1,000
County of Arapahoe Arapahoe County, Colorado 1:9,000 down to 1:1,000
State of Arkansas State of Arkansas 1:36,000 down to 1:9,000
City of Arlington Arlington, Texas 1:9,000 down to 1:1,000
City of Arvada GeoData Services Arvada, Colorado 1:9,000 down to 1:1,000
City of Ashland Ashland, Wisconsin 1:9,000 down to 1:1,000
City of Aspen and Pitkin County Pitkin County, Colorado 1:9,000 down to 1:1,000
City of Austin Austin, Texas 1:9,000 down to 1:1,000
Austin Community College District Austin Community College Campuses, Texas 1:9,000 down to 1:1,000
City of Bakersfield Bakersfield, California 1:9,000 down to 1:1,000
City of Baltimore Baltimore, Maryland 1:9,000 down to 1:1,000

Data Appliance 6.1
Contributor Coverage Scale Range
Town of Banff Banff, Alberta, Canada 1:9,000 down to 1:1,000
City of Bangor Bangor, Maine 1:9,000 down to 1:1,000
Banning Unified School District – Banning High School GIS Program
Banning High School and Nicolet Middle School, Banning, California
1:9,000 down to 1:1,000
Bay County GIS Bay County, Florida 1:9,000 down to 1:1,000
Town of Beaumont Beaumont, Alberta, Canada 1:9,000 down to 1:1,000
City of Bellevue Bellevue, Washington 1:9,000 down to 1:1,000
City of Bismarck GIS Bismarck, North Dakota 1:9,000 down to 1:1,000
City of Brampton Brampton, Ontario, Canada 1:9,000 down to 1:1,000
County of Bonneville Bonneville, Idaho 1:9,000 down to 1:1,000
City of Boston
Office of Geographic and Environmental Information
Boston, Massachusetts 1:9,000 down to 1:1,000
City of Boulder Boulder, Colorado 1:9,000 down to 1:1,000
City of Brandon Brandon, Manitoba, Canada 1:9,000 down to 1:1,000
Town of Brookline Town of Brookline, Massachusetts 1:9,000 down to 1:1,000
City and County of Broomfield City and County of Broomfield, Colorado 1:9,000 down to 1:1,000
County of Bucks Bucks County, Pennsylvania 1:9,000 down to 1:1,000

Data Appliance 6.1
Contributor Coverage Scale Range
City of Burien Burien, Washington 1:9,000 down to 1:1,000
California University of Pennsylvania of the State System of Higher Education, an agency of the Commonwealth of Pennsylvania
California University of Pennsylvania, Pennsylvania
1:9,000 down to 1:1,000
County of Calumet Calumet County, Wisconsin 1:9,000 down to 1:1,000
City of Cambridge Cambridge, Massachusetts 1:9,000 down to 1:1,000
Campbell County GIS Campbell County, Wyoming 1:9,000 down to 1:1,000
Cape Breton Regional Municipality Cape Breton, Nova Scotia, Canada 1:9,000 down to 1:1,000
City of Camrose Camrose, Alberta, Canada 1:9,000 down to 1:1,000
Town of Canmore Canmore, Alberta, Canada 1:9,000 down to 1:1,000
Town of Carrboro Carrboro, North Carolina 1:9,000 down to 1:1,000
City of Carson Carson, California 1:9,000 down to 1:1,000
County of Cass Cass County, North Dakota 1:9,000 down to 1:1,000
City of Centennial Centennial, Colorado 1:9,000 down to 1:1,000
Regional District of Central Okanagan Central Okanagan, British Columbia, Canada 1:9,000 down to 1:1,000
City of Chandler Chandler, Arizona 1:9,000 down to 1:1,000
City of Charlotte
County of Mecklenburg
City of Charlotte, North Carolina
County of Mecklenburg, North Carolina
1:9,000 down to 1:1,000
Town of Chapel Hill Chapel Hill, North Carolina 1:9,000 down to 1:1,000

Data Appliance 6.1
Contributor Coverage Scale Range
University of North Carolina, Chapel Hill University of North Carolina, Chapel Hill, North Carolina
County of Chatham County of Chatham, Georgia 1:9,000 down to 1:1,000
The Corporation of the Municipality of Chatham-Kent
Chatham-Kent, Ontario, Canada 1:9,000 down to 1:1,000
City of Chesapeake City of Chesapeake, Virginia 1:9,000 down to 1:1,000
County of Chester Chester County, Pennsylvania 1:9,000 down to 1:1,000
City of Chicago City of Chicago, Illinois 1:9,000 down to 1:1,000
Chittenden County Regional Planning Commission
Chittenden County, Vermont 1:9,000 down to 1:1,000
City of Chula Vista Chula Vista, California 1:9,000 down to 1:1,000
Camelia-Maria Kantor, Claflin University Claflin University, South Carolina 1:9,000 down to 1:1,000
County of Clear Creek Clear Creek County, Colorado 1:9,000 down to 1:1,000
City of Clovis Curry County, New Mexico 1:9,000 down to 1:1,000
Corporation of the Town of Cobourg Cobourg, Ontario, Canada 1:9,000 down to 1:1,000
Town of Cochrane Cochrane, Alberta, Canada 1:9,000 down to 1:1,000
Collier County Collier County, Florida 1:9,000 down to 1:1,000
Town of Collierville Collierville, Tennessee 1:9,000 down to 1:1,000
Columbus State Community College
Columbus State Community College, Main Campus and Delaware Campus, Ohio
1:9,000 down to 1:1,000

Data Appliance 6.1
Contributor Coverage Scale Range
City of Commerce City Commerce City, Colorado 1:9,000 down to 1:1,000
City of Coquitlam Coquitlam, British Columbia, Canada 1:9,000 down to 1:1,000
The Corporation of the City of Cornwall Cornwall, Ontario, Canada 1:9,000 down to 1:1,000
City of Cranbrook Cranbrook, British Columbia, Canada 1:9,000 down to 1:1,000
County of Crook Crook County, Oregon 1:9,000 down to 1:1,000
County of Dane Dane County, Wisconsin 1:9,000 down to 1:1,000
City of Dawson Creek Dawson Creek, British Columbia, Canada 1:9,000 down to 1:1,000
Town of Dedham Town of Dedham, Massachusetts 1:9,000 down to 1:1,000
County of Delaware Delaware County, Ohio 1:9,000 down to 1:1,000
City of Des Moines Des Moines, Iowa 1:9,000 down to 1:1,000
City of Des Moines GIS Des Moines, Washington 1:9,000 down to 1:1,000
City and County of Denver1 City and County of Denver, Colorado 1:9,000 down to 1:1,000
County of Douglas Douglas County, Nebraska 1:9,000 down to 1:1,000
City of Dover Dover, Delaware 1:9,000 down to 1:1,000
County of DuPage DuPage County, Illinois 1:9,000 down to 1:1,000
Regional District of East Kootenay East Kootenay, British Columbia, Canada 1:9,000 down to 1:1,000
Rural Municipality of East St. Paul East St. Paul, Manitoba, Canada 1:9,000 down to 1:1,000
Data Appliance 6.1
Contributor Coverage Scale Range
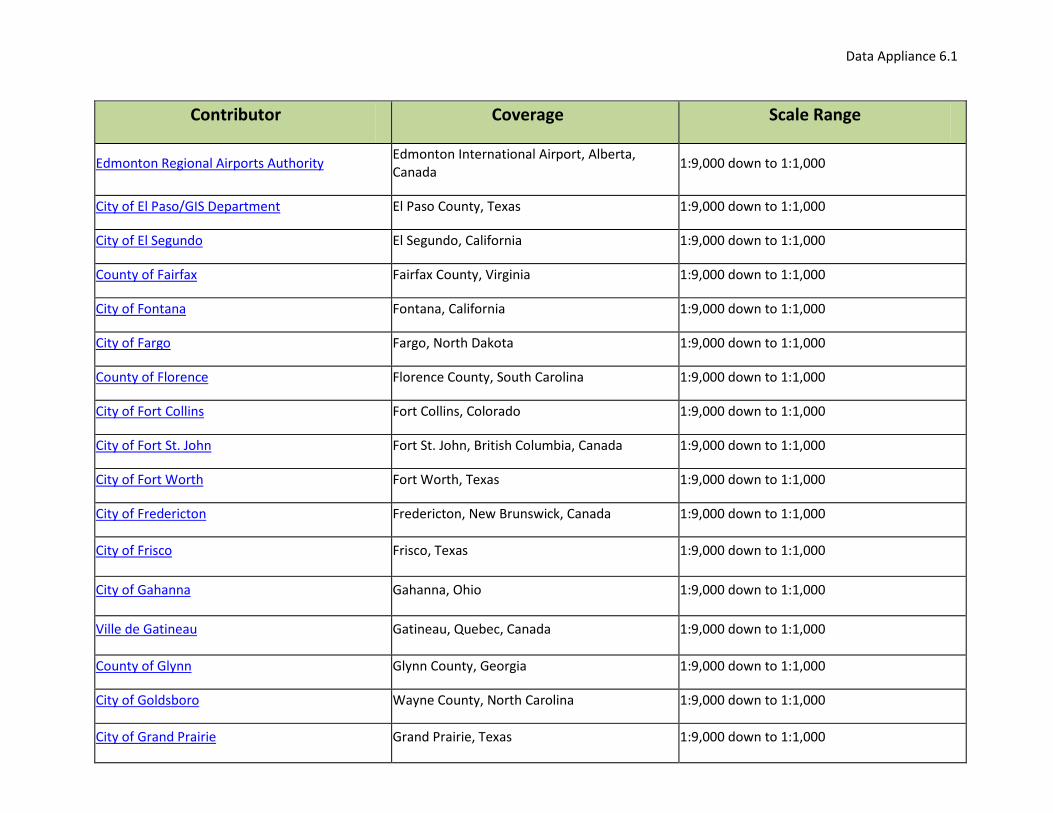
Edmonton Regional Airports Authority
Edmonton International Airport, Alberta, Canada
1:9,000 down to 1:1,000
City of El Paso/GIS Department El Paso County, Texas 1:9,000 down to 1:1,000
City of El Segundo El Segundo, California 1:9,000 down to 1:1,000
County of Fairfax Fairfax County, Virginia 1:9,000 down to 1:1,000
City of Fontana Fontana, California 1:9,000 down to 1:1,000
City of Fargo Fargo, North Dakota 1:9,000 down to 1:1,000
County of Florence Florence County, South Carolina 1:9,000 down to 1:1,000
City of Fort Collins Fort Collins, Colorado 1:9,000 down to 1:1,000
City of Fort St. John Fort St. John, British Columbia, Canada 1:9,000 down to 1:1,000
City of Fort Worth Fort Worth, Texas 1:9,000 down to 1:1,000
City of Fredericton Fredericton, New Brunswick, Canada 1:9,000 down to 1:1,000
City of Frisco Frisco, Texas 1:9,000 down to 1:1,000
City of Gahanna Gahanna, Ohio 1:9,000 down to 1:1,000
Ville de Gatineau Gatineau, Quebec, Canada 1:9,000 down to 1:1,000
County of Glynn Glynn County, Georgia 1:9,000 down to 1:1,000
City of Goldsboro Wayne County, North Carolina 1:9,000 down to 1:1,000
City of Grand Prairie Grand Prairie, Texas 1:9,000 down to 1:1,000

Data Appliance 6.1
Contributor Coverage Scale Range
City of Grapevine Grapevine, Texas 1:9,000 down to 1:1,000
City of Greenville
County of Greenville
Greenville, South Carolina
Greenville County, South Carolina 1:9,000 down to 1:1,000
City of Greenwood Village City of Greenwood Village, Colorado 1:9,000 down to 1:1,000
City of Hartford City of Hartford, Connecticut 1:9,000 down to 1:1,000
Harvard University Planning Office6 Harvard University, Massachusetts 1:9,000 down to 1:1,000
The Rural Municipality of Headingley Headingley, Manitoba, Canada 1:9,000 down to 1:1,000
County of Henrico County of Henrico, Virginia 1:9,000 down to 1:1,000
City of Hermosa Beach Hermosa Beach, California 1:9,000 down to 1:1,000
City of Hesperia Hesperia, California 1:9,000 down to 1:1,000
City of Houston Houston, Texas 1:9,000 down to 1:1,000
County of Hudson Hudson County, New Jersey 1:9,000 down to 1:1,000
Idaho State University Idaho State University, Pocatello, Idaho 1:9,000 down to 1:1,000
County of Indian River
Indian River County Property Appraiser
City of Vero Beach
Indian River County, Florida 1:9,000 down to 1:1,000
Iowa State University Iowa State University, Iowa 1:9,000 down to 1:1,000

Data Appliance 6.1
Contributor Coverage Scale Range
County of Iredell County of Iredell, North Carolina 1:9,000 down to 1:1,000
City of Irvine Irvine, California 1:9,000 down to 1:1,000
County of Jackson Jackson County, Oregon 1:9,000 down to 1:1,000
City of Jacksonville Duval County, Florida 1:9,000 down to 1:1,000
County of Jefferson Jefferson County, Idaho 1:9,000 down to 1:1,000
City of Joplin
County of Jasper County of Jasper, Missouri 1:9,000 down to 1:1,000
City of Kamloops Kamloops, British Columbia, Canada 1:9,000 down to 1:1,000
County of Kane Kane County, Illinois 1:9,000 down to 1:1,000
City of Keller Keller, Texas 1:9,000 down to 1:1,000
City of Kenora Kenora, Ontario, Canada 1:9,000 down to 1:1,000
County of King King County, Washington 1:9,000 down to 1:1,000
The Corporation of the City of Kingston Kingston, Ontario, Canada 1:9,000 down to 1:1,000
County of Kitsap Kitsap County, Washington 1:9,000 down to 1:1,000
County of Kittitas Kittitas County, Washington 1:9,000 down to 1:1,000
Kutztown University, Department of Geography Kutztown University, Pennsylvania 1:9,000 down to 1:1,000
City of Laguna Niguel Laguna Niguel, California 1:9,000 down to 1:1,000
County of Lake - GIS/Mapping Division Lake County, Illinois 1:9,000 down to 1:1,000

Data Appliance 6.1
Contributor Coverage Scale Range
City of Lakewood Lakewood, Colorado 1:9,000 down to 1:1,000
Township of Langley Township of Langley, British Columbia, Canada 1:9,000 down to 1:1,000
City of Las Vegas Las Vegas, Nevada 1:9,000 down to 1:1,000
City of Lawrence Lawrence, Kansas 1:9,000 down to 1:1,000
City of Leduc Leduc, Alberta, Canada 1:9,000 down to 1:1,000
The United Counties of Leeds and Grenville Leeds and Grenville, Ontario, Canada 1:9,000 down to 1:1,000
Tallahassee-Leon County GIS Leon County, Florida 1:9,000 down to 1:1,000
City of Lee’s Summit Lee’s Summit, Missouri 1:9,000 down to 1:1,000
County of Lewis and Clark/City of Helena GIS Lewis and Clark County, Montana 1:9,000 down to 1:1,000
Town of Lexington
Office of Geographic Information (MassGIS), Commonwealth of Massachusetts, Information Technology Division
Lexington, Massachusetts 1:9,000 down to 1:1,000
County of Lincoln County of Lincoln, North Carolina 1:9,000 down to 1:1,000
Town of Little Elm Little Elm, Texas 1:9,000 down to 1:1,000
Little Traverse Conservancy Nature Preserves of Northern Michigan 1:9,000 down to 1:1,000
Loma Linda University Loma Linda University, California 1:9,000 down to 1:1,000
The Corporation of the City of London London, Ontario, Canada 1:9,000 down to 1:1,000
City of Long Beach Long Beach, California 1:9,000 down to 1:1,000

Data Appliance 6.1
Contributor Coverage Scale Range
City of Longview Longview, TX 1:9,000 down to 1:1,000
County of Los Angeles Los Angeles County, California 1:9,000 down to 1:1,000
County of Loudoun Loudoun County, Virginia 1:9,000 down to 1:1,000
Township of Loyalist Loyalist, Ontario, Canada 1:9,000 down to 1:1,000
Madison-Rexburg GIS Madison County, Idaho 1:9,000 down to 1:1,000
Manatee County Government Information Technology Department
Manatee County, Florida 1:9,000 down to 1:1,000
City of Manhattan Beach Manhattan Beach, California 1:9,000 down to 1:1,000
City of Marietta Marietta, Georgia 1:9,000 down to 1:1,000
State of Maryland Maryland 1:577,000 down to 1:18,000
Borough of Matanuska-Susitna Matanuska-Susitna Borough, Alaska 1:9,000 down to 1:1,000
County of McHenry, a body politic McHenry County, Illinois 1:9,000 down to 1:1,000
City of McKinney McKinney, Texas 1:9,000 down to 1:1,000
McMaster University - School of Geography & Earth Sciences
Ministry of Natural Resources
McMaster University, Ontario, Canada 1:9,000 down to 1:1,000
City of Memphis Memphis, Tennessee 1:9,000 down to 1:1,000
City of Mesa Mesa, Arizona 1:9,000 down to 1:1,000
City of Miami Miami, Florida 1:9,000 down to 1:1,000

Data Appliance 6.1
Contributor Coverage Scale Range
County of Miami-Dade Miami-Dade County, Florida 1:9,000 down to 1:1,000
City of Milford Milford, Connecticut 1:9,000 down to 1:1,000
City of Minneapolis
University of Minnesota Minneapolis, Minnesota 1:9,000 down to 1:1,000
City of Missouri City Missouri City, Texas 1:9,000 down to 1:1,000
City of Moncton Moncton, New Brunswick, Canada 1:9,000 down to 1:1,000
County of Monmouth Monmouth County, New Jersey 1:9,000 down to 1:1,000
Montana State University, Facilities Planning, Design and Construction
Montana State University, Bozeman, Montana 1:9,000 down to 1:1,000
Montclair State University
Montclair State University, Montclair, New Jersey
1:9,000 down to 1:1,000
County of Montgomery Montgomery County, Texas 1:9,000 down to 1:1,000
City of Moorhead Moorhead, Minnesota 1:9,000 down to 1:1,000
City of Moreno Valley Moreno Valley, California 1:9,000 down to 1:1,000
Town of Morinville Town of Morinville, Alberta, Canada 1:9,000 down to 1:1,000
Muscatine Area Geographic Information Consortium (MAGIC)
Muscatine County, Iowa 1:9,000 down to 1:1,000
Namgis First Nation
Village of Alert Bay and Cormorant Island, British Columbia, Canada
1:9,000 down to 1:1,000

Data Appliance 6.1
Contributor Coverage Scale Range
City of Nanaimo Nanaimo, British Columbia, Canada 1:9,000 down to 1:1,000
County of Napa Napa County, California 1:9,000 down to 1:1,000
City of Naperville Naperville, Illinois 1:9,000 down to 1:1,000
City of Nashua Nashua, New Hampshire 1:9,000 down to 1:1,000
City of New Braunfels New Braunfels, Texas 1:9,000 down to 1:1,000
State of New Jersey New Jersey 1:577,000 down to 1:4,500
New York City Data Mine2, including data from several agencies:
• Department of City Planning (DCP) • Department of Information Technology
and Telecommunications (DoITT) • Department of Parks and Recreation
(DPR) • Landmarks Preservation Commission
(LPC) • New York City Economic Development
Corp (NYCEDC)
and University of Virginia Library for DEM/hillshade data
New York, New York 1:9,000 down to 1:1,000
Town of Newington
Newington, Connecticut 1:9,000 down to 1:1,000
City of Niagara Falls
Niagara Falls, Ontario, Canada 1:9,000 down to 1:1,000
State of North Carolina North Carolina 1:577,000 down to 1:1,000

Data Appliance 6.1
Contributor Coverage Scale Range
District of North Vancouver North Vancouver 1:9,000 down to 1:1,000
The Government of the Northwest Territories - Department of Municipal and Community Affairs
The Municipalities of: Aklavik, Behchoko, Colville Lake, Deline, Enterprise, Fort Good Hope, Fort Liard, Fort McPherson, Fort Providence, Fort Resolution, Fort Simpson, Fort Smith, Gameti, Hay River, Inuvik, Jean Marie River, Kakisa, Lutselk’e, Nahanni Butte, Norman Wells, Paulatuk, Sachs Harbour, Trout Lake, Tsiigehtchic, Tuktoyaktuk, Tulita, Ulukhatok, Wekweeti, Whati, and Wrigley
1:9,000 down to 1:1,000
District of Oak Bay Oak Bay, British Columbia, Canada 1:9,000 down to 1:1,000
Town of Ocean City Ocean City, Maryland 1:9,000 down to 1:1,000
Old Dominion University Old Dominion University, Norfolk, Virginia 1:9,000 down to 1:1,000
Olds College Olds College, Alberta, Canada 1:9,000 down to 1:1,000
City of Olympia Olympia, Washington 1:9,000 down to 1:1,000
County of Ontario Ontario County, New York 1:9,000 down to 1:1,000
County of Orange Orange County, Florida 1:9,000 down to 1:1,000
State of Oregon
Oregon Department of Transportation (ODOT)
Bureau of Land Management (BLM)
Oregon 1:577,000 down to 1:18,000
Village of Oswego
Oswego, Illinois 1:9,000 down to 1:1,000

Data Appliance 6.1
Contributor Coverage Scale Range
City of Ottawa
Ottawa, Ontario, Canada 1:9,000 down to 1:1,000
County of Outagamie Outagamie, Wisconsin 1:9,000 down to 1:1,000
Pala Band of Mission Indians Pala, California 1:9,000 down to 1:1,000
City of Palm Desert Palm Desert, California 1:9,000 down to 1:1,000
City of Pasadena Pasadena, California 1:9,000 down to 1:1,000
Pennsylvania Spatial Data Access (PASDA) Philadelphia, Pennsylvania 1:9,000 down to 1:1,000
Peoria GIS Peoria County, Illinois 1:9,000 down to 1:1,000
City of Phoenix Phoenix, Arizona 1:9,000 down to 1:1,000
City of Plano Plano, Texas 1:9,000 down to 1:1,000
Oregon Metro3 (Portland Metropolitan Area) Clackamas County, Multnomah County, and Washington County, Oregon
1:9,000 down to 1:1,000
City of Peterborough
Ministry of Natural Resources
Peterborough, Ontario, Canada 1:9,000 down to 1:1,000
County of Polk Polk County, Wisconsin 1:9,000 down to 1:1,000
Port of Los Angeles Port of Los Angeles, California 1:9,000 down to 1:1,000
Pottawattamie County Pottawattamie County, Iowa 1:9,000 down to 1:1,000
City of Prince George Prince George, British Columbia, Canada 1:9,000 down to 1:1,000
PAgis (Pulaski Area Geographic Information Pulaski County, Arkansas 1:9,000 down to 1:1,000

Data Appliance 6.1
Contributor Coverage Scale Range
System)
County of Putnam Putnam County, Tennessee 1:9,000 down to 1:1,000
Ville De Quebec City of Quebec, Quebec, Canada 1:9,000 down to 1:1,000
Town of Queen Creek Queen Creek, Arizona 1:9,000 down to 1:1,000
City of Quesnel Quesnel, British Columbia, Canada 1:9,000 down to 1:1,000
City of Quinte West Quinte West, Ontario, Canada 1:9,000 down to 1:1,000
City of Rancho Cucamonga Rancho Cucamonga, California 1:9,000 down to 1:1,000
City of Redlands, Department of Innovation and Technology, GIS Division
Montessori in Redlands
Redlands, California 1:9,000 down to 1:1,000
City of Regina Regina, Saskatchewan, Canada 1:9,000 down to 1:1,000
Ville de Repentigny Repentigny, Quebec, Canada 1:9,000 down to 1:1,000
County of Riverside
Agua Caliente Band of Cahuilla Indians
Riverside County, California
Agua Caliente/Palm Springs Vicinity, Riverside County, California
1:9,000 down to 1:1,000
Ville de Rouyn-Noranda Rouyn-Noranda, Quebec, Canada 1:9,000 down to 1:1,000
District of Saanich Saanich, British Columbia, Canada 1:9,000 down to 1:1,000
Sacramento Area Council of Governments El Dorado, Placer, Sacramento, Sutter, Yolo, and Yuba Counties
1:9,000 down to 1:1,000

Data Appliance 6.1
Contributor Coverage Scale Range
City of St. Louis
County of St. Louis
Missouri Botanical Garden
City and County of St. Louis, Missouri 1:9,000 down to 1:1,000
City of Salem Salem, Oregon 1:9,000 down to 1:1,000
City of San Antonio San Antonio, Texas 1:9,000 down to 1:1,000
San Diego Geographic Information Source (SANGIS)4 and San Diego Association of Governments (SANDAG)
City and County of San Diego, California 1:9,000 down to 1:1,000
San Diego Mesa College San Diego Mesa College, San Diego, California 1:9,000 down to 1:1,000
City of San Francisco San Francisco, California 1:9,000 down to 1:1,000
Sarpy County Sarpy County, Nebraska 1:9,000 down to 1:1,000
City of Saskatoon Saskatoon, Saskatchewan, Canada 1:9,000 down to 1:1,000
The Corporation of the City of Sault Ste. Marie Sault Ste. Marie, Ontario, Canada 1:9,000 down to 1:1,000
City of Seattle Seattle, Washington 1:9,000 down to 1:1,000
Sequoia and Kings Canyon National Park Sequoia and Kings Canyon National Park, California
1:9,000 down to 1:1,000
City of St. Albert St. Albert, Alberta, Canada 1:9,000 down to 1:1,000
City of St. John's St. John's, Newfoundland and Labrador, Canada 1:9,000 down to 1:1,000
City of Shafter Shafter, California 1:9,000 down to 1:1,000
City of Sioux Falls Sioux Falls, South Dakota 1:9,000 down to 1:1,000

Data Appliance 6.1
Contributor Coverage Scale Range
County of Skagit Skagit County, Washington 1:9,000 down to 1:1,000
District of Sooke Sooke, British Columbia, Canada 1:9,000 down to 1:1,000
City of Sparks Sparks, Nevada 1:9,000 down to 1:1,000
City of Spokane Spokane, Washington 1:9,000 down to 1:1,000
District of Squamish Squamish, British Columbia, Canada 1:9,000 down to 1:1,000
County of Story Story County, Iowa 1:9,000 down to 1:1,000
City of Greater Sudbury Great Sudbury, Ontario, Canada 1:9,000 down to 1:1,000
Sunshine Coast Regional District Sunshine Coast, British Columbia, Canada 1:9,000 down to 1:1,000
City of Surrey Surrey, British Columbia, Canada 1:9,000 down to 1:1,000
County of Sussex County of Sussex, New Jersey 1:9,000 down to 1:1,000
City of Tacoma
University of Washington, Tacoma
Metro Parks Tacoma
Tacoma, Washington
University of Washington
Wright Park
1:9,000 down to 1:1,000
City of Tampa Tampa, Florida 1:9,000 down to 1:1,000
Taney County Taney County, Missouri 1:9,000 down to 1:1,000
County of Teller Teller County, Colorado 1:9,000 down to 1:1,000
County of Teton Teton County, Idaho 1:9,000 down to 1:1,000

Data Appliance 6.1
Contributor Coverage Scale Range
Texarkana Water Utilities Cities of Texarkana, Nash, and Wake Village, Texas
1:9,000 down to 1:1,000
Thompson-Nicola Regional District Thompson Nicola Regional District, British Columbia, Canada
1:9,000 down to 1:1,000
Three Rivers Park District Hennepin County, Minnesota 1:9,000 down to 1:1,000
County of Tift Tift County, Georgia 1:9,000 down to 1:1,000
Tompkins County GIS Tompkins County, New York 1:9,000 down to 1:1,000
City of Toronto Geospatial Competency Centre (GCC)5
Toronto, Ontario, Canada 1:9,000 down to 1:1,000
City of Torrance Torrance, California 1:9,000 down to 1:1,000
City of Tulsa City of Tulsa, Oklahoma 1:9,000 down to 1:1,000
City of Tuscaloosa GIS Tuscaloosa, Alabama 1:9,000 down to 1:1,000
Tuskegee University Tuskegee University, Alabama 1:9,000 down to 1:1,000
County of Union Union County, Pennsylvania 1:9,000 down to 1:1,000
University of Alberta University of Alberta, Alberta, Canada 1:9,000 down to 1:1,000
The University of Waterloo University of Waterloo, Ontario, Canada 1:9,000 down to 1:1,000
University of Wisconsin, Eau Claire University of Wisconsin, Eau Claire, Wisconsin 1:9,000 down to 1:1,000
University of Wyoming University of Wyoming, Wyoming 1:9,000 down to 1:1,000
URS Corporation Port of Oakland, California 1:9,000 down to 1:1,000

Data Appliance 6.1
Contributor Coverage Scale Range
State of Utah State of Utah 1:577,000 down to 1:4,500
Ville de Val-d’Or Ville de Val-d’Or, Quebec, Canada 1:9,000 down to 1:1,000
City of Vancouver Vancouver, British Columbia, Canada 1:9,000 down to 1:1,000
City of Ventura City of Ventura, California 1:9,000 down to 1:1,000
Virginia Information Technologies Agency (VITA) Commonwealth of Virginia 1:577,000 down to 1:1,000
City of Virginia Beach Virginia Beach, Virginia 1:9,000 down to 1:1,000
Wahkiakum County Wahkiakum County, Washington 1:9,000 down to 1:1,000
City of Waltham Waltham, Massachusetts 1:9,000 down to 1:1,000
District of Columbia Geographic Information System (DCGIS)
Washington, DC 1:9,000 down to 1:1,000
County of Waukesha – LIS Division Waukesha County, Wisconsin 1:9,000 down to 1:1,000
Westchester County GIS Westchester County, New York 1:9,000 down to 1:1,000
City of Westerville Westerville, Ohio 1:9,000 down to 1:1,000
City of Westminster Westminster, Colorado 1:9,000 down to 1:1,000
West Parry Sound Geography Network (WPSGN) Township of the Archipelago 1:9,000 down to 1:1,000
City of Wheat Ridge Wheat Ridge, Colorado 1:9,000 down to 1:1,000
City of White Rock White Rock, British Columbia, Canada 1:9,000 down to 1:1,000
City of Wichita Wichita, Kansas 1:9,000 down to 1:1,000

Data Appliance 6.1
Contributor Coverage Scale Range
Will County GIS Will County, Illinois 1:9,000 down to 1:1,000
County of Williamson Williamson, Texas 1:9,000 down to 1:1,000
Regional Municipality of Wood Buffalo Wood Buffalo, Alberta, Canada 1:9,000 down to 1:1,000
City of Woodland Woodland, California 1:9,000 down to 1:1,000
City of Woodstock
Ministry of Natural Resources
Woodstock, Ontario, Canada 1:9,000 down to 1:1,000
City of Worcester Worcester, Massachusetts 1:9,000 down to 1:1,000
Yakima City/County GIS Yakima County, Washington 1:9,000 down to 1:1,000
County of Yavapai Yavapai County, Arizona 1:9,000 down to 1:1,000
City of Yellowknife Yellowknife, Northwest Territories, Canada 1:9,000 down to 1:1,000
The Regional Municipality of York Regional Municipality of York, Ontario, Canada 1:9,000 down to 1:1,000
Town of York York, Maine 1:9,000 down to 1:1,000
City of Yorkton Yorkton, Saskatchewan, Canada 1:9,000 down to 1:1,000
Yosemite National Park Resource Management Division of the U.S. National Park Service (NPS)
Yosemite National Park, California 1:9,000 down to 1:1,000

Data Appliance 6.1
1 If any copying or reproduction of the GIS data is specifically provided for in the license and authorized by the manager of public works or designee, the licensee shall affix a copyright and limitation on use notice, in the form, manner and location as is specified in the license, to all copies or reproductions of the GIS data that the licensee generates: © DenverGIS 2010
2 The City of New York cannot vouch for the accuracy or completeness of data provided by this web site or application or for the usefulness or integrity of the web site or application. This site provides applications using data that has been modified for use from its original source, NYC.gov, the official web site of the City of New York. For more information, see Terms of Use on the New York City Data Mine Web site.
3 Oregon Metro data is provided under their Terms of Use.
4 GIS data derived, modified, reduced, and/or processed from SanGIS downloadable data - www.sangis.org Copyright SanGIS 2009
5 City of Toronto data is provided under their Terms of Use, which are binding for your use of the City of Toronto data in this map.
6 ©2010 The President and Fellows of Harvard College