world rural observations 2011, 3(1) … rural observations 2011, 3(1) ... abdulsalam n. nasir.1, ......
TRANSCRIPT

World Rural Observations 2011, 3(1) http://www.sciencepub.net/rural
1
Identification of Linear Features using continuation Filters Over Koton Karifi area, Nigeria, From Aeromagnetic Data.
Abdulsalam N. Nasir.1, Mallam Abu. 2 Likkason K. Othniel. 3
1 & 2 Department of Physics, University of Abuja, Gwagwalada, FCT PMB117, Nigeria 3 Physics Programme, Abubakar Tafawa Balewa University, Bauchi State, PMB0248, Nigeria
Abstract: Magnetic lineaments over sedimentary basins are zones of gradient interruptions or zones marked by sharp changes of the style of anomalies. These anomalies might be due to the fault affecting the underlying basement alone or both the basement and the sedimentary formations. In this paper, we have applied continuation filters (upward and downward continuations) as processing tools to the aeromagnetic total-field intensity anomaly of the koton-karifi area, Nigeria. The results from these field continuations revealed that as the upward continuation increases the field become broader. The general indication of this is that the linear feature (fault or fracture) might have been hosted in the basement structure and is significant as it was likely an earlier emplaced feature before SE Santonian movements took place . Not much deduction could be drawn from the result of downward continuation as it was generally observed that as we continued the field below source level the contours become clumsy and full of noise.
[Abdulsalam N. Nasir., Mallam Abu. Likkason K. Othniel. Identification of Linear Features using continuation Filters Over Koton Karifi area, Nigeria, From Aeromagnetic Data. World Rural Observations 2011;3(1):1-8]; ISSN: 1944-6543 (Print); ISSN: 1944-6551 (Online). http://www.sciencepub.net/rural.
Keywords: upward continuation, downward continuation, fault, and fracture.
1. Introduction
The aim of a magnetic survey is to investigate subsurface geology on the basis of magnetic anomalies in the Earth’s magnetic field resulting from the magnetic properties of the underlying rocks. Magnetic surveys can be performed on land, at sea and in air. The speed of operation and cost make airborne magnetic surveys very attractive, where the principal objective has been to assist in mineral and groundwater development through improved geologic mapping. In addition, aeromagnetic surveys have traditionally been applied at the early stage of petroleum exploration to determine depth and major structure of crystalline basement rocks underlying sedimentary basins. The methodology for acquiring and compiling data appears to be keeping pace with modern technology so that presently the magnetic method is by far the most widely used of all geophysical survey; both in terms of line-kilometres surveyed annually and in total line-kilometres (Paterson and Reeves, 1985). Thus compared to other geophysical methods, the aeromagnetic data are always readily available and so it is important to exploit the potentialities of these data. This has been the aim of this work. This paper focuses on the analyis of a total-field aeromagnetic data using continuation to the field (upward and downward continuations) over the Koton Karifi area,
central Nigeria. The outcome of the analysis is expected to throw more light on the geology and other linear features of the area.
Fig. 1.1 Geological map of Nigeria, 1 = Cretaceous-Recent sediments; 2=Younger Granites; 3 = Older Granites; 4 = Undifferentiated Metasediments; 5 = quartzite and quartzite schist; 6 = Undifferentiated basement complex and 7 = Tertiary volcanics (From Geological map of Nigeria 1994: compiled by the Geological Survey of Nigeria). Inset is the study area: the Koton Karifi Area of the Nupe Basin, Nigeria
World Rural Observations 2011, 3(1) http://www.sciencepub.net/rural
2
2. Geology of the Koton Karifi Area
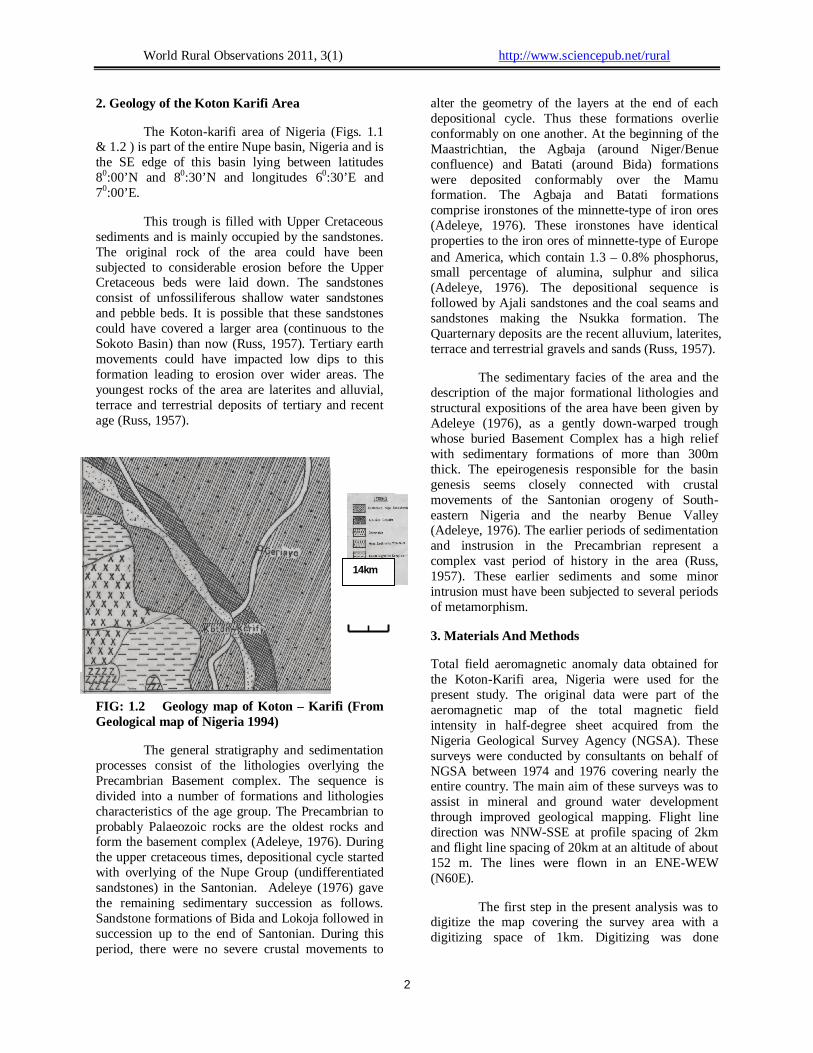
The Koton-karifi area of Nigeria (Figs. 1.1 & 1.2 ) is part of the entire Nupe basin, Nigeria and is the SE edge of this basin lying between latitudes 80:00’N and 80:30’N and longitudes 60:30’E and 70:00’E.
This trough is filled with Upper Cretaceous sediments and is mainly occupied by the sandstones. The original rock of the area could have been subjected to considerable erosion before the Upper Cretaceous beds were laid down. The sandstones consist of unfossiliferous shallow water sandstones and pebble beds. It is possible that these sandstones could have covered a larger area (continuous to the Sokoto Basin) than now (Russ, 1957). Tertiary earth movements could have impacted low dips to this formation leading to erosion over wider areas. The youngest rocks of the area are laterites and alluvial, terrace and terrestrial deposits of tertiary and recent age (Russ, 1957).
FIG: 1.2 Geology map of Koton – Karifi (From Geological map of Nigeria 1994)
The general stratigraphy and sedimentation processes consist of the lithologies overlying the Precambrian Basement complex. The sequence is divided into a number of formations and lithologies characteristics of the age group. The Precambrian to probably Palaeozoic rocks are the oldest rocks and form the basement complex (Adeleye, 1976). During the upper cretaceous times, depositional cycle started with overlying of the Nupe Group (undifferentiated sandstones) in the Santonian. Adeleye (1976) gave the remaining sedimentary succession as follows. Sandstone formations of Bida and Lokoja followed in succession up to the end of Santonian. During this period, there were no severe crustal movements to
alter the geometry of the layers at the end of each depositional cycle. Thus these formations overlie conformably on one another. At the beginning of the Maastrichtian, the Agbaja (around Niger/Benue confluence) and Batati (around Bida) formations were deposited conformably over the Mamu formation. The Agbaja and Batati formations comprise ironstones of the minnette-type of iron ores (Adeleye, 1976). These ironstones have identical properties to the iron ores of minnette-type of Europe and America, which contain 1.3 – 0.8% phosphorus, small percentage of alumina, sulphur and silica (Adeleye, 1976). The depositional sequence is followed by Ajali sandstones and the coal seams and sandstones making the Nsukka formation. The Quarternary deposits are the recent alluvium, laterites, terrace and terrestrial gravels and sands (Russ, 1957).
The sedimentary facies of the area and the description of the major formational lithologies and structural expositions of the area have been given by Adeleye (1976), as a gently down-warped trough whose buried Basement Complex has a high relief with sedimentary formations of more than 300m thick. The epeirogenesis responsible for the basin genesis seems closely connected with crustal movements of the Santonian orogeny of South-eastern Nigeria and the nearby Benue Valley (Adeleye, 1976). The earlier periods of sedimentation and instrusion in the Precambrian represent a complex vast period of history in the area (Russ, 1957). These earlier sediments and some minor intrusion must have been subjected to several periods of metamorphism.
3. Materials And Methods
Total field aeromagnetic anomaly data obtained for the Koton-Karifi area, Nigeria were used for the present study. The original data were part of the aeromagnetic map of the total magnetic field intensity in half-degree sheet acquired from the Nigeria Geological Survey Agency (NGSA). These surveys were conducted by consultants on behalf of NGSA between 1974 and 1976 covering nearly the entire country. The main aim of these surveys was to assist in mineral and ground water development through improved geological mapping. Flight line direction was NNW-SSE at profile spacing of 2km and flight line spacing of 20km at an altitude of about 152 m. The lines were flown in an ENE-WEW (N60E).
The first step in the present analysis was to digitize the map covering the survey area with a digitizing space of 1km. Digitizing was done
14km
World Rural Observations 2011, 3(1) http://www.sciencepub.net/rural
3
8:00N
6:30E 7:00E
8:30N
Total Field Aeromagnetic Map (Sheet 227) of Koton Karifi. Contour interval is 5 nT. Actual values are obtained by adding 25000 nT to contour values. Regional correction based on IGRF (epoch date 1st January 1974) has notbeen made.
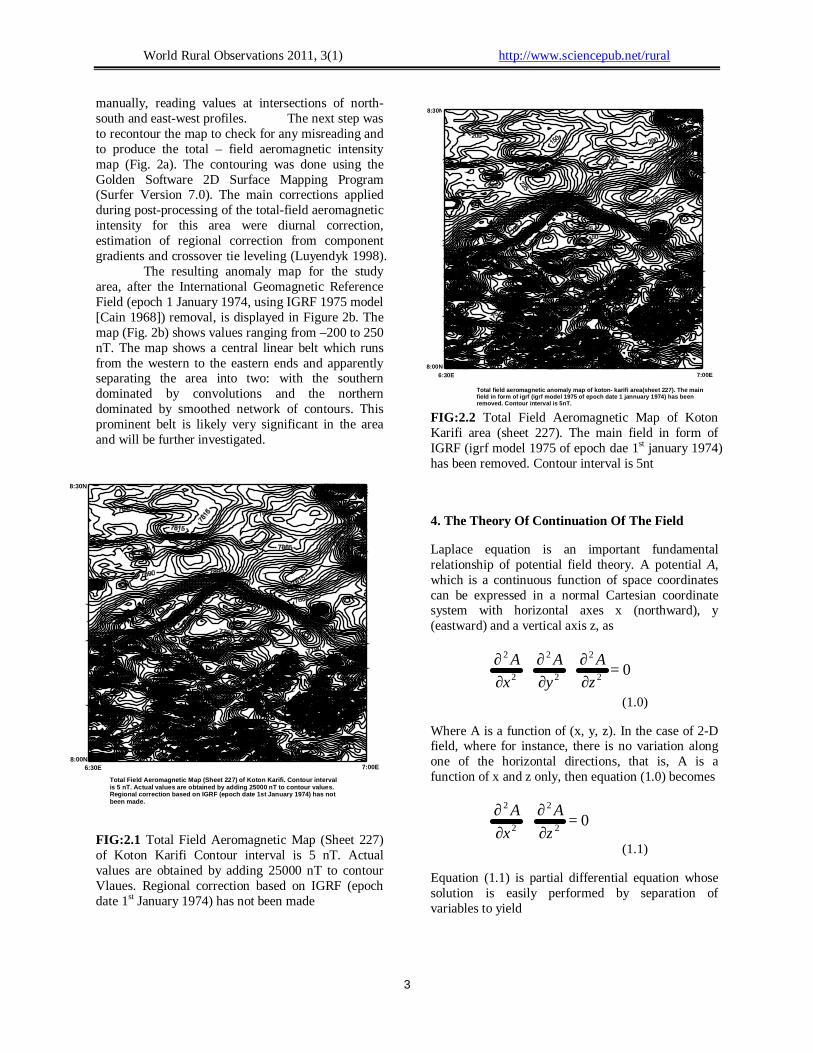
manually, reading values at intersections of north-south and east-west profiles. The next step was to recontour the map to check for any misreading and to produce the total – field aeromagnetic intensity map (Fig. 2a). The contouring was done using the Golden Software 2D Surface Mapping Program (Surfer Version 7.0). The main corrections applied during post-processing of the total-field aeromagnetic intensity for this area were diurnal correction, estimation of regional correction from component gradients and crossover tie leveling (Luyendyk 1998). The resulting anomaly map for the study area, after the International Geomagnetic Reference Field (epoch 1 January 1974, using IGRF 1975 model [Cain 1968]) removal, is displayed in Figure 2b. The map (Fig. 2b) shows values ranging from –200 to 250 nT. The map shows a central linear belt which runs from the western to the eastern ends and apparently separating the area into two: with the southern dominated by convolutions and the northern dominated by smoothed network of contours. This prominent belt is likely very significant in the area and will be further investigated.
FIG:2.1 Total Field Aeromagnetic Map (Sheet 227) of Koton Karifi Contour interval is 5 nT. Actual values are obtained by adding 25000 nT to contour Vlaues. Regional correction based on IGRF (epoch date 1st January 1974) has not been made
FIG:2.2 Total Field Aeromagnetic Map of Koton Karifi area (sheet 227). The main field in form of IGRF (igrf model 1975 of epoch dae 1st january 1974) has been removed. Contour interval is 5nt
4. The Theory Of Continuation Of The Field
Laplace equation is an important fundamental relationship of potential field theory. A potential A, which is a continuous function of space coordinates can be expressed in a normal Cartesian coordinate system with horizontal axes x (northward), y (eastward) and a vertical axis z, as
02
2
2
2
2
2
=∂
∂+
∂
∂+
∂
∂
z
A
y
A
x
A
(1.0)
Where A is a function of (x, y, z). In the case of 2-D field, where for instance, there is no variation along one of the horizontal directions, that is, A is a function of x and z only, then equation (1.0) becomes
02
2
2
2
=∂
∂+
∂
∂
z
A
x
A
(1.1)
Equation (1.1) is partial differential equation whose solution is easily performed by separation of variables to yield
8:00N
8:30N
7:00E6:30E
Total field aeromagnetic anomaly map of koton- karifi area(sheet 227). The main field in form of igrf (igrf model 1975 of epoch date 1 jannuary 1974) has been removed. Contour interval is 5nT.

World Rural Observations 2011, 3(1) http://www.sciencepub.net/rural
4
Ak (x, z) = (B1cos k x + B2sin k x)ekz (1.2)
Where B1 and B2 are constants and k is a positive variable known as spatial (time-series) frequency or wave number. Ak is the magnetic potential amplitude corresponding to the wave number k at z level of observation. Thus the potential field is represented in terms of sine and cosine waves with amplitude moderated exponentially by the level of observation z. The coordinate system employed here uses z with positive values downwards. We also note that if ∆T is the total intensity magnetic anomaly in the direction of the earth’s normal field then
η∂
∆∂−=∆
)( AT
(1.3)
Where ∆A is the anomaly in magnetic potential A and η is a unit vector in the direction of the earth’s magnetic field. It is obvious that ∆T also satisfies Laplace equation of (1.0) and thus can be treated by use of potential field theory.
Equation (1.0) applied on the total field anomaly ∆T gives partial differential equations whose solution (Bhattacharyya 1965) is
.)2sin2cos}()(2exp{),,(0 0
2
1
2
2
2
2
∑∑∞
=
∞
=
++−=∆n m x
m
x
m
yx L
xmB
L
xmA
L
n
L
mzzyxT πππ
)2sin2cos(y
n
y
nL
ynD
L
ynC ππ +
(1.4a)
Where Lx, Ly are the fundamental wavelengths in the x and y directions and Am, Bm, Cn and Dn are the coefficients in the Fourier series expansion. Bhattacharyya (1965) has shown that the fundamental wavelengths Lx and Ly in the two directions are given by
Lx = MSx
And Ly = NSy
Where M and N are number of data values along the x and y directions respectively, while Sx and Sy are the data spacing in these directions. It is obvious that for magnetic anomaly over an area whose sides parallel the x and y axes, Lx, Ly, Sx and Sy will be known. Thus the coefficients Am, Bm, Cn and Dn will have to be calculated in order to represent the data over the area exactly by an analytical expression in
equation (1.4a). The complete analytical representation of the total-field values in a horizontal plane in terms of a double Fourier series (Bhattacharyya 1965) is
( ) ∑∑= =
+=∆
0 0
0 0
2sin.2cos2cos.2cos0,,m
m
n
n yx
mn
yx
mnL
yn
L
xmB
L
yn
L
xmAyxT ππππ
++
yx
mn
yx
mnL
yn
L
xmF
L
yn
L
xmE ππππ 2sin.2sin2cos.2sin
(1.4b)
)
where m0, n0 are the highest harmonics in the x and y directions respectively. Equation (1.4b) is the same form as equation (1.4a) when z ≠ 0. Thus once the coefficients Amn, Bmn, Emn and Fmn are determined, it is quite simple to make upward or downward continuation of the field by inserting different values of z in the exponent of equation (1.4a). The coefficients can be determined by the method of expansion into a series of simultaneous normal equations and solved for the unknown coefficients in exactly the same manner as trend surface equations (James 1966).
The upward continued field leads to result from relatively deep structures and consequently can represent valid regional fields for an area (Jacobsen 1987). Upward continuation is useful in the interpretation of magnetic anomaly field over areas containing many near surface magnetic sources such as dykes and other intrusions (Bott, 1973, Kearey and Brooks, 2000)
Downward continuation is the process whereby from measurement of potential field data on a plane, we can estimate the field closer to the sources. The downward continued field is sharper and consequently allow for better resolution of underground rock distribution. The usefulness of this process is limited by the fact that the operation is extremely sensitive to noise. When down – ward continued, a signal is amplified exponentially, with an exponent proportional to the spectral frequency. With noise – free data, downward continuation is well- defined, provided we do not attempt to continue below the source level. When downward-continued, field closer to the source can be estimated. A good downward continuation process would provide sharper images, allowing an enhanced interpretation.

World Rural Observations 2011, 3(1) http://www.sciencepub.net/rural
5
8:00N
8:30N
6:30E 7:00E
The total field magnetic anomaly map of koton karifi area upward continued to 1km from ground level(contour interval=5nT).
5. Results And Discussion
The total field intensity anomaly over this area was continued to various planes of observation. First, it was upward continued to different levels above flight height. This process highlights the low wave number components in the observed field at this level, which are likely to be the effects of deeper sources. The data were continued upward to an elevation of 1km, with contour values ranging from -80nT to 200nT, 2km, with contour values ranging from -40nT to 180nT, 5km, with contour values ranging from 20nT to 160nT and 10km with contour values ranging from 55nT to 130nT above flight height (Figs. 3, 4, 5 and 6). It was generally observed that as the height increases the field becomes broader and broader (Figs. 3, 4, 5 and 6). The computations of the continued fields were achieved through Hildenbrand’s (1983) FFTFIL: a Fourier-based filtering program. FFTFIL is a Fourier-based (using fast Fourier transform) filtering of grids of magnetic data using linear operators (level-to-level upward and downward continuation; first and second vertical derivatives; high-latitude reduction to pole; trapezoidal high-pass, low-pass and band-pass filters; strike or azimuthal filters with sharp cutoffs; pseudo-magnetic field from gravity field; pseudo-gravity field from magnetic field; and total magnetic field from vertical magnetic field). The program also computes forward or inverse Fourier transform of a grid file for filtering external to the program.
FIG:3 The Total Field magnetic anomaly map of Koton Karifi area upward continued to 1km from ground level(contour interval=5nT)
FIG:3 The Total Field magnetic anomaly map of Koton Karifi area upward continued to 2km from ground level(contour interval=5nT)
FIG:5 The Total Field magnetic anomaly map of Koton Karifi area upward continued to 5km from ground level(contour interval=5nT)
FIG: 3
8:00N
8:30N
6:30E 7:00E
The total field magnetic anomaly map of koton karifi area upward continued to 2km from ground level(contour interval=5nT).
8:00N
8:30N
6:30E 7:00E
The total field magnetic anomaly map of koton karifi area upward continued to 5km from ground level(contour interval=5nT).

World Rural Observations 2011, 3(1) http://www.sciencepub.net/rural
6
FIG:6 The Total Field magnetic anomaly map of Koton Karifi area upward continued to 10km from ground level(contour interval=5nT)
The objective of this anaysis is to observe the progressive influence of the major central dome-shaped linear feature on the maps. These maps are influences of deeper features as the field is continued upward. We see that as the magnetic anomaly is upward continued to 1 and 2 km, the linear feature is still prominent and this prominence gradually fades out, so that at 10 km, this feature cannot be clearly identified (Fig. 6).
The general indication is that this linear feature is of intermediate depth and seems to be hosted in the basement structure and is thought to be a major divide (fault or fracture) marking a boundary. The fact that this structure is close to the Niger-Benue River Confluence makes it even more interesting. Several contour closures south of this lineament indicate shallow basement and thus may be clue to the fact that the Niger-Benue River confluence is an uplifted area, very much similar to a model earlier proposed by Wright (1976) and Likkason (1993).
Studies over the Younger granites provinces in Nigeria indicate that the Younger Granites decrease in age from north to south (Wright 1976). This led to the proposition that the African plate was moving northwards over a mantle plume during Jurassic, but sufficiently slowly for magmas of different complexes to be generated in turn. After the Jurassic, the African plate moved further north and that about 100 Ma ago, the plum lay beneath the
present Niger Delta. Likkason (1993) had also speculated from gravity studies in the Mid-Niger Basin that the plume could have migrated to the present location (Niger-Benue River Confluence) during motional episodes of the lithosphere culminating into the radial fracturing at this confluence, and the down-buckling of the Mid-Niger Basin area. The present results lend support to these speculations.
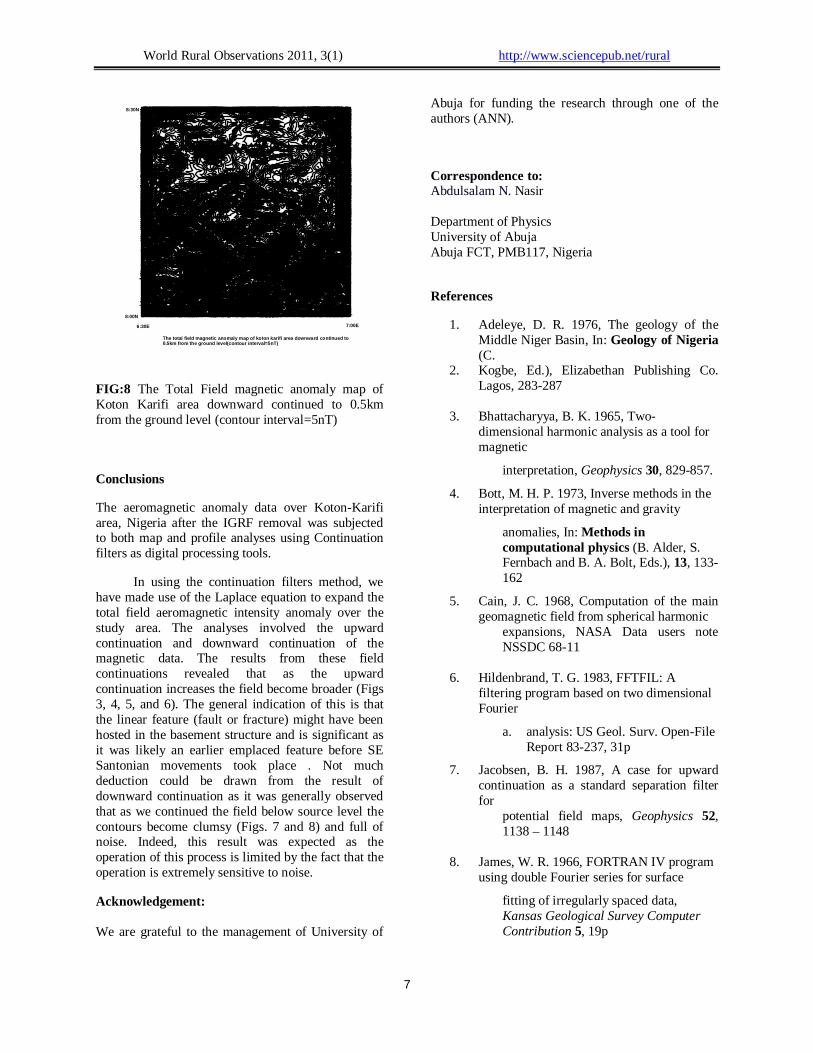
The residual anomaly map was continued downward. When downward continued we can estimate the field closer to the source. A good downward continuation process would provide sharper image, allowing an enhanced interpretation, and should have the potential to provide a more accurate determination of both horizontal and vertical extents of geological sources. The data were continued downward to ground level from the flight height of 152 m. The map shows contour values ranging from -350nT to 350nT (Fig. 7) and then to 0.5km below ground level (Fig. 8). This is aimed at comparing the effects at levels near the sources. It was observed that as we continue below the source level the contours become clumsy. This in fact, is expected as the usefulness of this process is limited by the fact that the operation is extremely sensitive to noise. In the presence of noise, the amplification of high frequencies is so strong that it quickly masks the information in the original profile.
FIG:7 The Total Field magnetic anomaly map of Koton Karifi area upward continued down to the ground at flight height of 152m(contour interval=5nT)
8:00N
8:30N
6:30E 7:00E
The total field magnetic anomaly map of koton karifi area upward continued to 10km from ground level(contour interval=5nT).
8:00N
8:30n
6:30E 7:00e
The total field magnetic anomaly map of koton karifi area continued down to yhe ground at flight height of 152m(contour interval=5nT.
World Rural Observations 2011, 3(1) http://www.sciencepub.net/rural
7
FIG:8 The Total Field magnetic anomaly map of Koton Karifi area downward continued to 0.5km from the ground level (contour interval=5nT)
Conclusions
The aeromagnetic anomaly data over Koton-Karifi area, Nigeria after the IGRF removal was subjected to both map and profile analyses using Continuation filters as digital processing tools.
In using the continuation filters method, we have made use of the Laplace equation to expand the total field aeromagnetic intensity anomaly over the study area. The analyses involved the upward continuation and downward continuation of the magnetic data. The results from these field continuations revealed that as the upward continuation increases the field become broader (Figs 3, 4, 5, and 6). The general indication of this is that the linear feature (fault or fracture) might have been hosted in the basement structure and is significant as it was likely an earlier emplaced feature before SE Santonian movements took place . Not much deduction could be drawn from the result of downward continuation as it was generally observed that as we continued the field below source level the contours become clumsy (Figs. 7 and 8) and full of noise. Indeed, this result was expected as the operation of this process is limited by the fact that the operation is extremely sensitive to noise.
Acknowledgement: We are grateful to the management of University of
Abuja for funding the research through one of the authors (ANN).
Correspondence to: Abdulsalam N. Nasir Department of Physics University of Abuja Abuja FCT, PMB117, Nigeria
References
1. Adeleye, D. R. 1976, The geology of the Middle Niger Basin, In: Geology of Nigeria (C.
2. Kogbe, Ed.), Elizabethan Publishing Co. Lagos, 283-287
3. Bhattacharyya, B. K. 1965, Two-
dimensional harmonic analysis as a tool for magnetic
interpretation, Geophysics 30, 829-857.
4. Bott, M. H. P. 1973, Inverse methods in the interpretation of magnetic and gravity
anomalies, In: Methods in computational physics (B. Alder, S. Fernbach and B. A. Bolt, Eds.), 13, 133-162
5. Cain, J. C. 1968, Computation of the main geomagnetic field from spherical harmonic
expansions, NASA Data users note NSSDC 68-11
6. Hildenbrand, T. G. 1983, FFTFIL: A
filtering program based on two dimensional Fourier
a. analysis: US Geol. Surv. Open-File Report 83-237, 31p
7. Jacobsen, B. H. 1987, A case for upward continuation as a standard separation filter for
potential field maps, Geophysics 52, 1138 – 1148
8. James, W. R. 1966, FORTRAN IV program
using double Fourier series for surface
fitting of irregularly spaced data, Kansas Geological Survey Computer Contribution 5, 19p
FIG: 7
8:00N
8:30N
6:30E 7:00E
The total field magnetic anomaly map of koton karifi area downward continued to 0.5km from the ground level(contour interval=5nT)

World Rural Observations 2011, 3(1) http://www.sciencepub.net/rural
8
9. Kearey, P. and Brooks, M. 2000, An introduction to geophysical exploration (2nd Ed.)
Blackwell Science, pp. 1 – 237
10. Likkason, O. K. 1993, Application of trend surface analysis to gravity data over the Middle
Niger Basin, Nigeria, J. Mining & Geology 29, 2, 11-19
11. Luyendyk, A. P. J. 1998, Processing of airborne magnetic data, AGSO J. Australian
Geol. Geophys. 17, 31-38 12. Paterson, N. R. and Reeves, C. V. 1985,
Applications of gravity and magnetic: The state-
of-the-art in 1985, Geophysics 50, 2558-2594
13. Russ, W. 1957, The geology of parts of Niger, Zaria and Sokoto Provinces: Geol. Surv. of
Nigeria Bull. No. 27 14. Wright J. B. 1976, Fracture systems in
Nigeria and initiation of fracture zones in the south Atlantic, Tectonophysics 34, 43-7
12/14/2010