world economic situation and prospects: key messages · lifting the vat rate in january 2019 may...
TRANSCRIPT
www.bit.ly/wespreport
www.bit.ly/wespreport
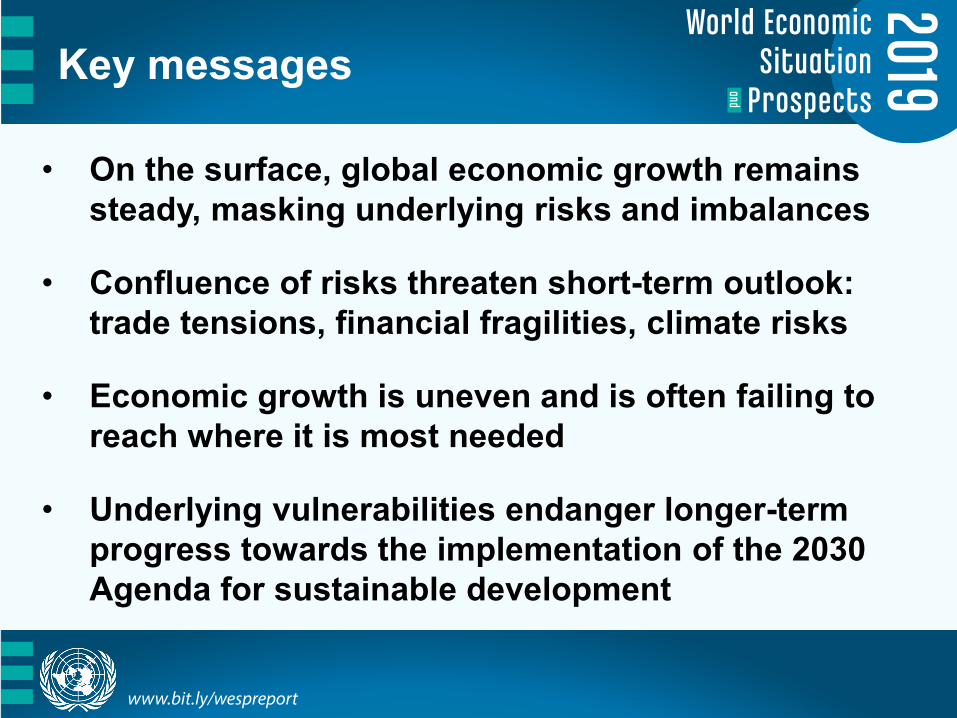
Key messages
• On the surface, global economic growth remains steady, masking underlying risks and imbalances
• Confluence of risks threaten short-term outlook: trade tensions, financial fragilities, climate risks
• Economic growth is uneven and is often failing to reach where it is most needed
• Underlying vulnerabilities endanger longer-term progress towards the implementation of the 2030 Agenda for sustainable development
www.bit.ly/wespreport
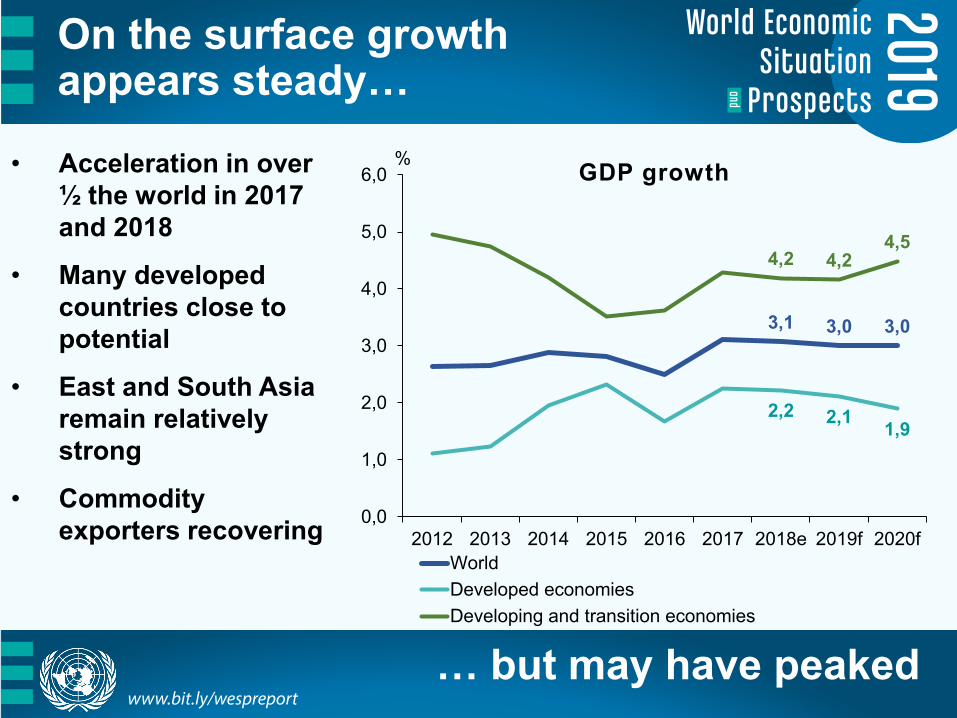
On the surface growth appears steady…
• Acceleration in over ½ the world in 2017 and 2018
• Many developed countries close to potential
• East and South Asia remain relatively strong
• Commodity exporters recovering
3,1 3,0 3,0
2,2 2,1 1,9
4,2 4,24,5
0,0
1,0
2,0
3,0
4,0
5,0
6,0
2012 2013 2014 2015 2016 2017 2018e 2019f 2020f
GDP growth
WorldDeveloped economiesDeveloping and transition economies
… but may have peaked
%
www.bit.ly/wespreport
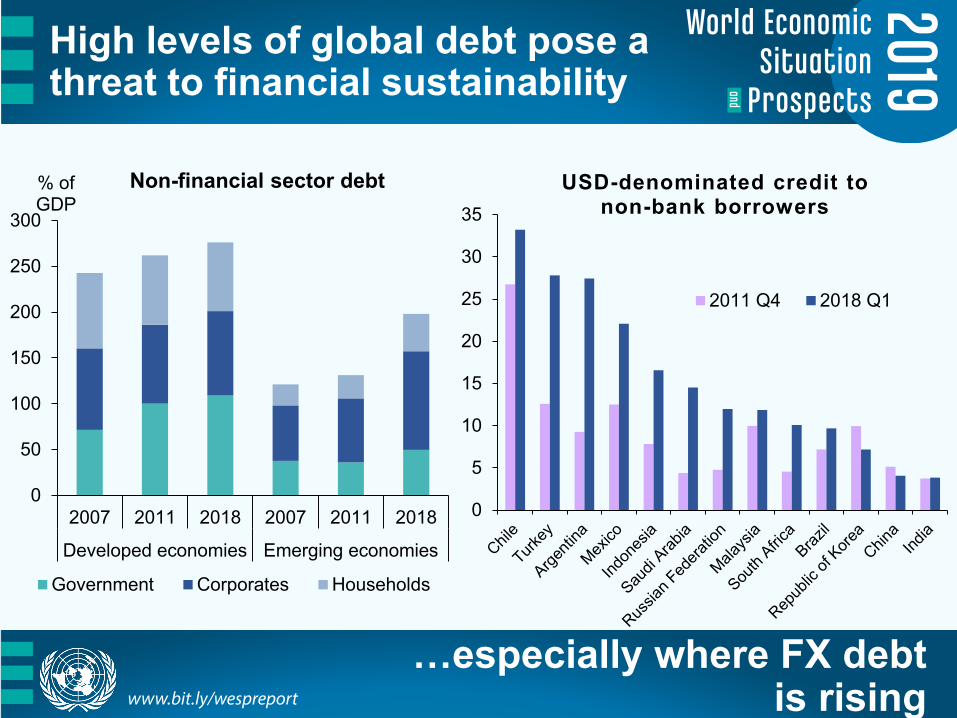
High levels of global debt pose a threat to financial sustainability
0
5
10
15
20
25
30
35USD-denominated credit to
non-bank borrowers
2011 Q4 2018 Q1
…especially where FX debt is rising
0
50
100
150
200
250
300
2007 2011 2018 2007 2011 2018
Developed economies Emerging economies
% of GDP
Non-financial sector debt
Government Corporates Households
www.bit.ly/wespreport
Potential triggers of financial stress
• Global trade tensions• Monetary policy adjustment in developed
economies• Commodity price shocks• Policy disruption in Europe associated with
‘Brexit’• Domestic political or economic disruptions

www.bit.ly/wespreport
Economic growth is uneven…
Disclaimer: The designations employed and the presentation of material on this map do not imply the expression of any opinion whatsoever on the part of the Secretariat of the United Nations concerning the legal status of any country, territory, city or area or of its authorities, or concerning the delimitation of its frontiers or boundaries.
GDP per capita growth, 2018
…and often failing to reach where it is most needed
www.bit.ly/wespreport
Many countries continue to be left behind
• In 2018, 47 developing and transition economies had less than 1% per capita growth
•
• Majority of these (38) have experienced below-average growth since 1980
• Most (41) highly dependent on commodities
• Several face long-standing armed conflict or civil unrest and political instability
www.bit.ly/wespreport
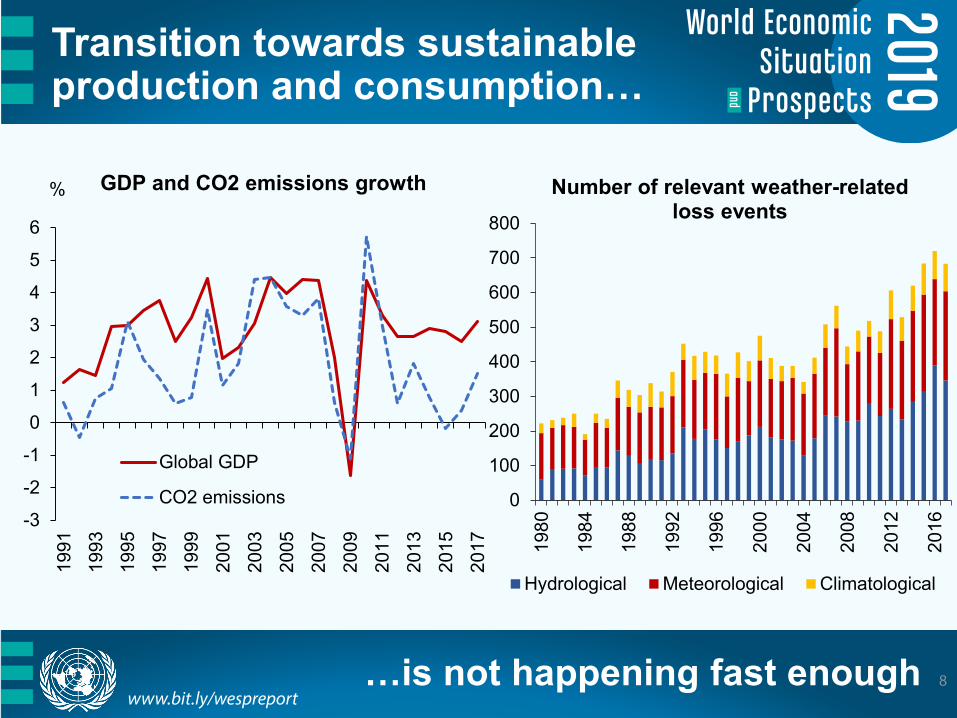
Transition towards sustainable production and consumption…
8…is not happening fast enough
-3
-2
-1
0
1
2
3
4
5
6
1991
1993
1995
1997
1999
2001
2003
2005
2007
2009
2011
2013
2015
2017
% GDP and CO2 emissions growth
Global GDP
CO2 emissions 0
100
200
300
400
500
600
700
800
1980
1984
1988
1992
1996
2000
2004
2008
2012
2016
Number of relevant weather-related loss events
Hydrological Meteorological Climatological
www.bit.ly/wespreport
Regional trends
www.bit.ly/wespreport
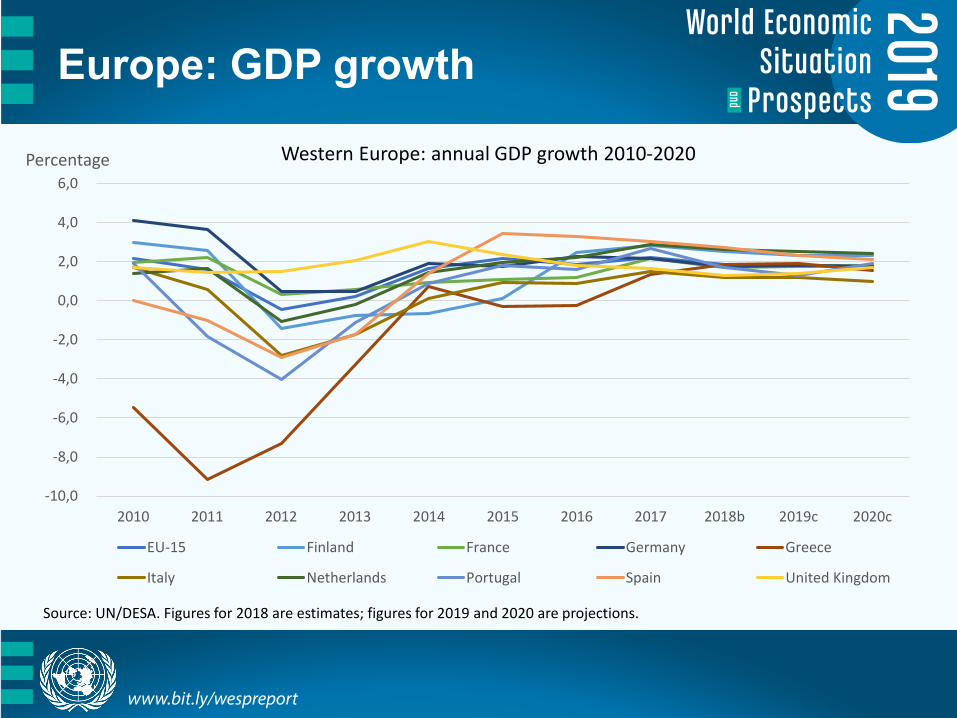
Europe: GDP growth
-10,0
-8,0
-6,0
-4,0
-2,0
0,0
2,0
4,0
6,0
2010 2011 2012 2013 2014 2015 2016 2017 2018b 2019c 2020c
EU-15 Finland France Germany Greece
Italy Netherlands Portugal Spain United Kingdom
Percentage Western Europe: annual GDP growth 2010-2020
Source: UN/DESA. Figures for 2018 are estimates; figures for 2019 and 2020 are projections.
www.bit.ly/wespreport
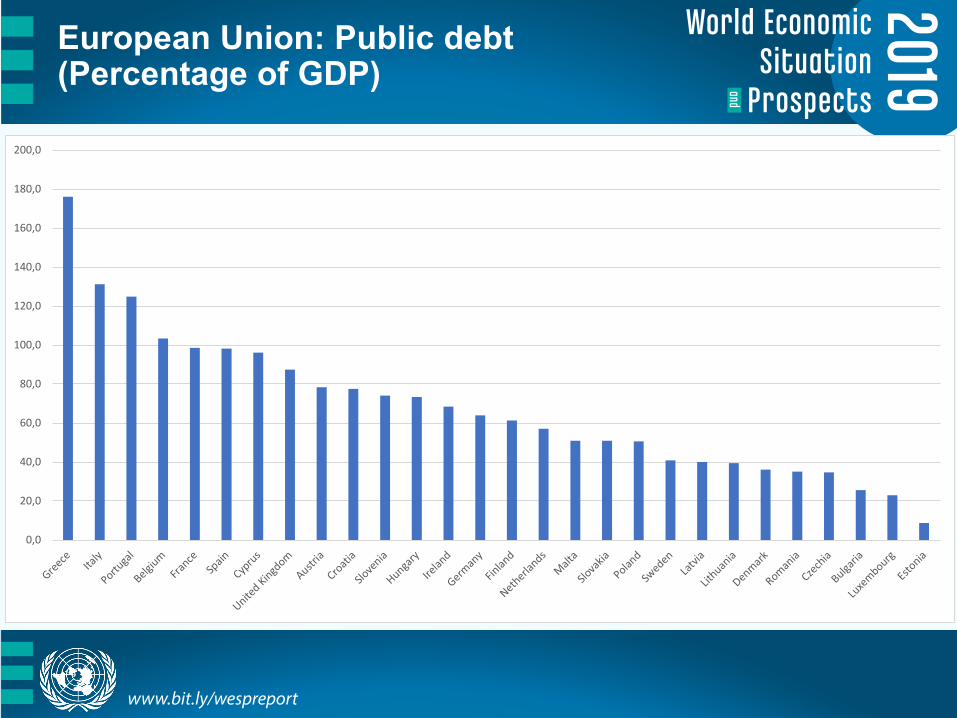
European Union: Public debt(Percentage of GDP)
0,0
20,0
40,0
60,0
80,0
100,0
120,0
140,0
160,0
180,0
200,0
www.bit.ly/wespreport
Economic trends in the Commonwealth of Independent States were broadly positive in 2018
Most CIS economies saw favourable economic outcomes in 2018, with accelerating growth and tapering inflation, as external conditions were generally supportive
Commodity price increases (including not only oil but also other commodities such as aluminium or cotton) and remittances sustained growth
The recovery in the Russian Federation has supported activity across the region via trade and remittance channels
After two years of improvements, however, the dynamics in the terms of trade are likely to be less favourable in 2019
The aggregate CIS growth is expected to decelerate modestly in the outlook, as the strong expansion recorded by some of the smaller economies in 2018 may not be sustainable, fiscal policies are growth-neutral at best and monetary tightening is on its way in several countries
Aggregate GDP of the CIS and Georgia is expected to increase by 2.0 and 2.5 per cent in 2019 and 2020
www.bit.ly/wespreport
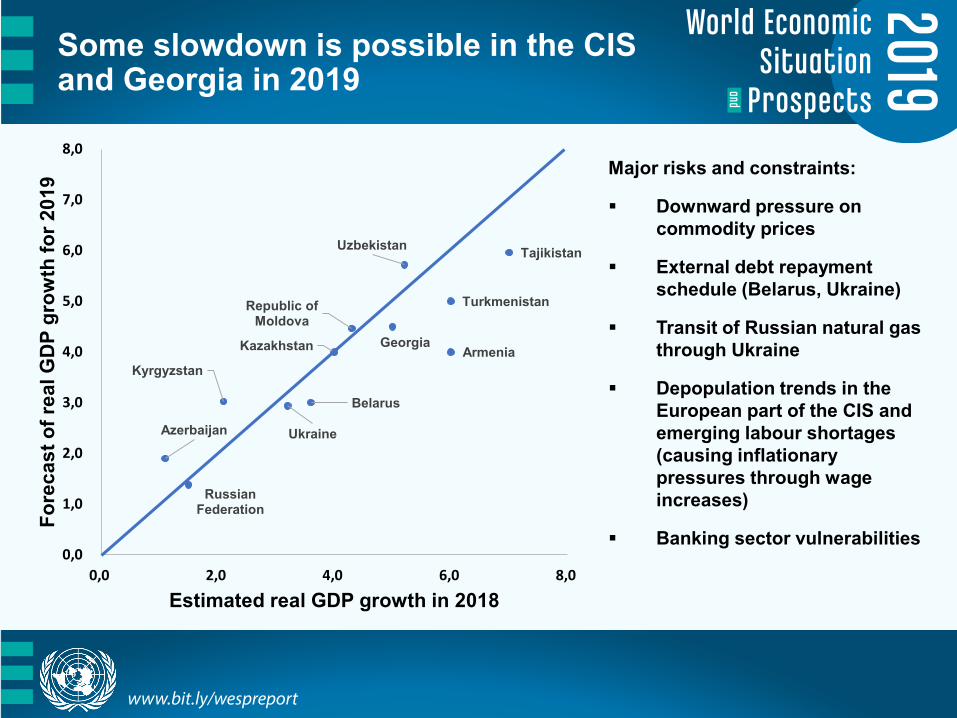
Some slowdown is possible in the CIS and Georgia in 2019
Major risks and constraints:
Downward pressure on commodity prices
External debt repayment schedule (Belarus, Ukraine)
Transit of Russian natural gas through Ukraine
Depopulation trends in the European part of the CIS and emerging labour shortages (causing inflationary pressures through wage increases)
Banking sector vulnerabilities
Armenia
Azerbaijan
Belarus
GeorgiaKazakhstan
Kyrgyzstan
Republic of Moldova
Russian Federation
Tajikistan
Turkmenistan
Ukraine
Uzbekistan
0,0
1,0
2,0
3,0
4,0
5,0
6,0
7,0
8,0
0,0 2,0 4,0 6,0 8,0
Fore
cast
of r
eal G
DP
grow
th fo
r 201
9
Estimated real GDP growth in 2018
www.bit.ly/wespreport
The Russian economy is expected to remain on a low-growth trajectory (1.5 -2 per cent) in 2019-2020
Constraints to growth: insufficient business lending, weak investment; banking sector vulnerabilities and moderately conservative fiscal policy
Prioritizing the build-up of protective buffers
Lifting the VAT rate in January 2019 may add to inflationary pressures in 2019, curb consumer spending, and prevent monetary relaxation
International sanctions remain a source of uncertainty, deterring investment and raising financing costs
Full implementation of the proposed sanctions may push the Russian economy into a protracted stagnation with negative regional spillovers, as the scope for import substitution is largely exhausted.
On the positive side: large current account surplus, low public debt and has massive foreign-exchange reserves
Social and economic development programmes for the period until 2024 should improve infrastructure and add to GDP growth, especially beyond 2019
www.bit.ly/wespreport
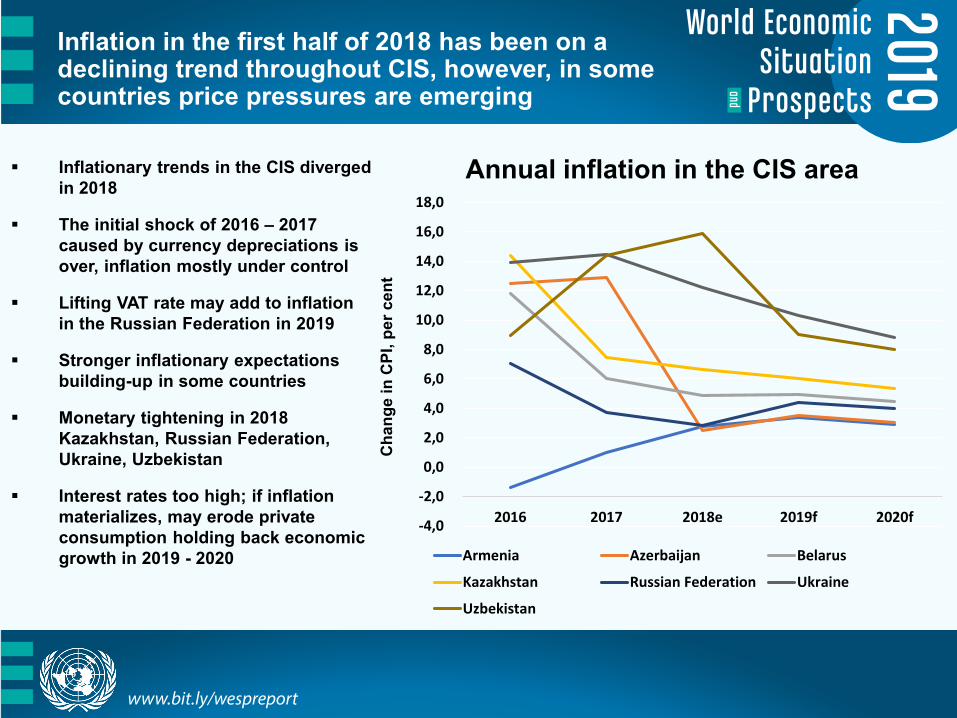
Inflation in the first half of 2018 has been on a declining trend throughout CIS, however, in some countries price pressures are emerging
Inflationary trends in the CIS diverged in 2018
The initial shock of 2016 – 2017 caused by currency depreciations is over, inflation mostly under control
Lifting VAT rate may add to inflation in the Russian Federation in 2019
Stronger inflationary expectations building-up in some countries
Monetary tightening in 2018 Kazakhstan, Russian Federation, Ukraine, Uzbekistan
Interest rates too high; if inflation materializes, may erode private consumption holding back economic growth in 2019 - 2020
-4,0
-2,0
0,0
2,0
4,0
6,0
8,0
10,0
12,0
14,0
16,0
18,0
2016 2017 2018e 2019f 2020f
Cha
nge
in C
PI, p
er c
ent
Annual inflation in the CIS area
Armenia Azerbaijan Belarus
Kazakhstan Russian Federation Ukraine
Uzbekistan
www.bit.ly/wespreport
South-Eastern Europe: positive economic trends set to continue
Accelerated economic growth in South-Eastern Europe in 2018 Robust domestic demand (both consumption and investment)
Favourable external environment
Serbia (the largest economy) bounced back from the past slowdown, with a double-digit growth in investment
Solid economic performance in Albania, growth in the former Yugoslav Republic of Macedonia picking up from nearly zero in 2017
The region’s aggregate GDP is expected to expand by 3.7 per cent in both 2019 and 2020
Prospect of EU accession becoming more credible

www.bit.ly/wespreport
Same challenges in SEE remain, despite the recent progress
The need for reindustrialization
Low labour force participation rate, structural unemployment constraining longer-term capacity expansion
Infrastructure development needs
Dependence on foreign financing (Brexit may impact EU funding)
Still challenging business environment
High levels of outward migration and increasing dependency ratios
A significant part of FDI stock in non-export sectors (financial services, telecommunications, real estate and retail trade)
Investment financed by loans from China has driven up external debt in some countries`

www.bit.ly/wespreport
Thank you!
Media contact: Dan ShepardUN Department of Global [email protected]
More information: http://www.bit.ly/wespreport
Global Economic Monitoring BranchEconomic Analysis and Policy DivisionDepartment of Economic and Social AffairsUnited Nations