world economic context - afcome
TRANSCRIPT

25/10/2013
1
PERSPECTIVE A MOYEN TERME
DE L’OFFRE ET DE LA DEMANDE
MONDIALES EN ENGRAIS
Patrick Heffer et Michel Prud’homme, IFA
13èmes Rencontres internationales de l’AFCOME
23-25 octobre 2013, Beaune, France
WORLD ECONOMIC CONTEXT

25/10/2013
2
-2
0
2
4
6
8
10
12
World
EU
USA
China
India
Brazil
Economic Activity (GDP Growth, %)
Sources: IMF, Oct 2013
2011 2012 2013
(f)
2014
(f)
World +3.9% +3.2% +2.9% +3.6%
Advanced +1.7% +1.5% +1.2% +2.0%
Emerging +6.2% +4.9% +4.5% +5.1%
Risks to the
forecast
remain to the
downside
Commodity and Food Prices
Brent (US$/barrel) January 2002 August 2013
Source: INSEE, Oct 2013
Source: FAO, Oct 2013
FAO Food Price Index (2002-2004 = 100)
IMF projects a 3% contraction
of oil prices in 2014
FAO Food Commodity
Price Indices (2002-2004 = 100)
Source: FAO, Oct 2013

25/10/2013
3
Currency Exchange Rates
India:
16% of world fertilizer consumption
#1 importing country
-30%
GLOBAL AGRICULTURAL SITUATION
25/10/2013
4
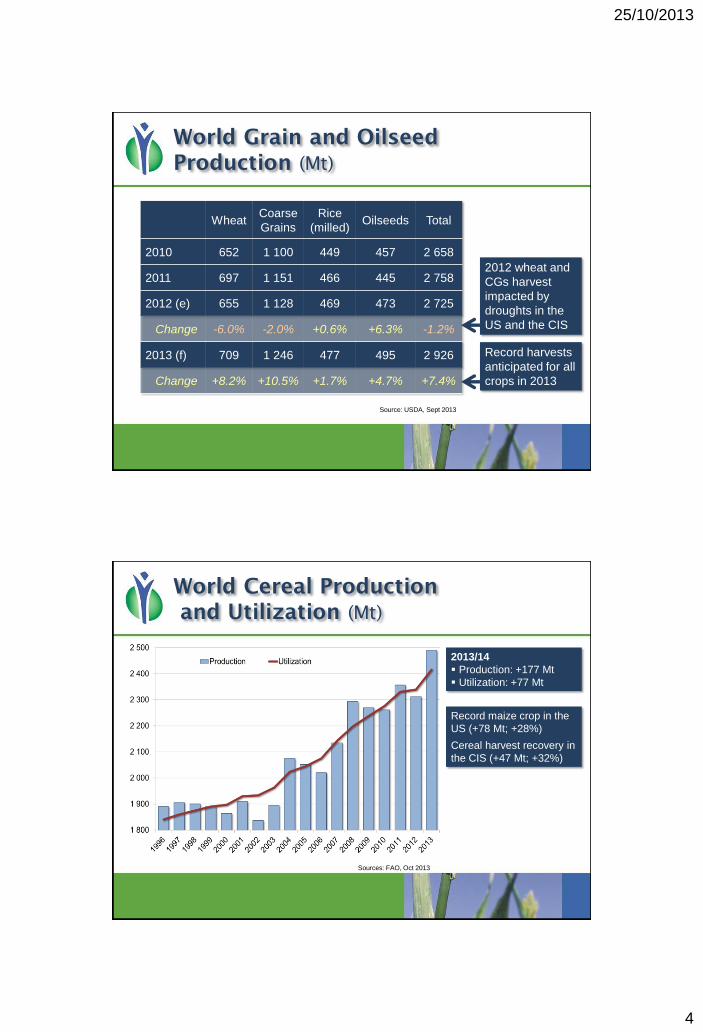
World Grain and Oilseed
Production (Mt)
Wheat Coarse
Grains
Rice
(milled) Oilseeds Total
2010 652 1 100 449 457 2 658
2011 697 1 151 466 445 2 758
2012 (e) 655 1 128 469 473 2 725
Change -6.0% -2.0% +0.6% +6.3% -1.2%
2013 (f) 709 1 246 477 495 2 926
Change +8.2% +10.5% +1.7% +4.7% +7.4%
Source: USDA, Sept 2013
2012 wheat and
CGs harvest
impacted by
droughts in the
US and the CIS
Record harvests
anticipated for all
crops in 2013
World Cereal Production
and Utilization (Mt)
2013/14
Production: +177 Mt
Utilization: +77 Mt
Record maize crop in the
US (+78 Mt; +28%)
Cereal harvest recovery in
the CIS (+47 Mt; +32%)
Sources: FAO, Oct 2013
25/10/2013
5
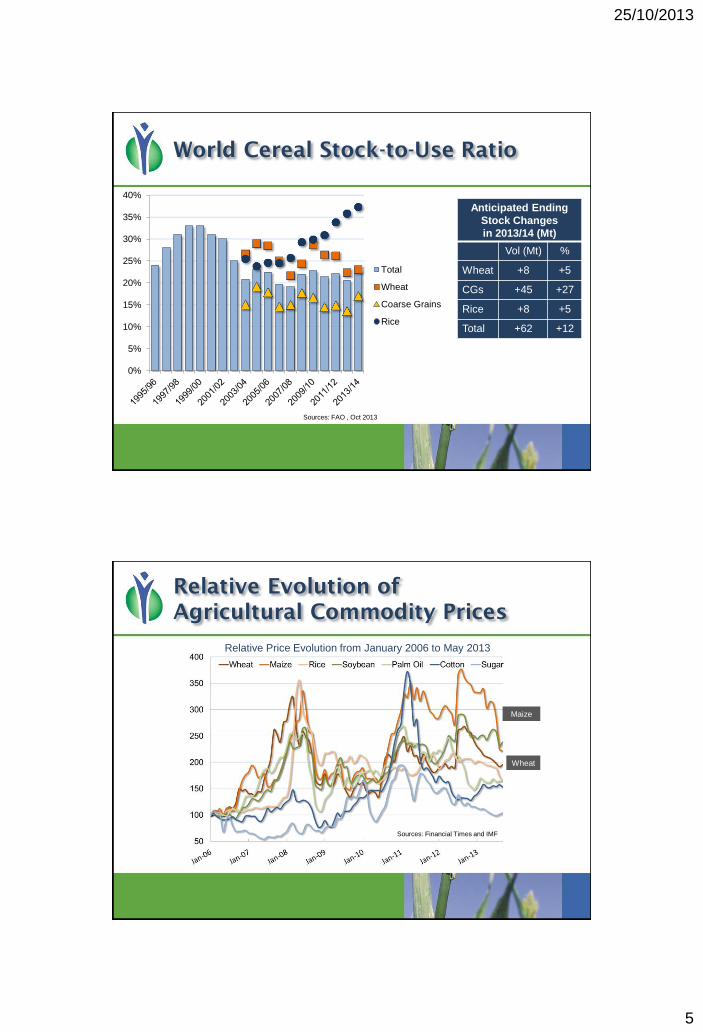
World Cereal Stock-to-Use Ratio
Sources: FAO , Oct 2013
Anticipated Ending
Stock Changes
in 2013/14 (Mt)
Vol (Mt) %
Wheat +8 +5
CGs +45 +27
Rice +8 +5
Total +62 +12
0%
5%
10%
15%
20%
25%
30%
35%
40%
Total
Wheat
Coarse Grains
Rice
Relative Evolution of
Agricultural Commodity Prices
Relative Price Evolution from January 2006 to May 2013
Sources: Financial Times and IMF
Wheat
Maize
25/10/2013
6
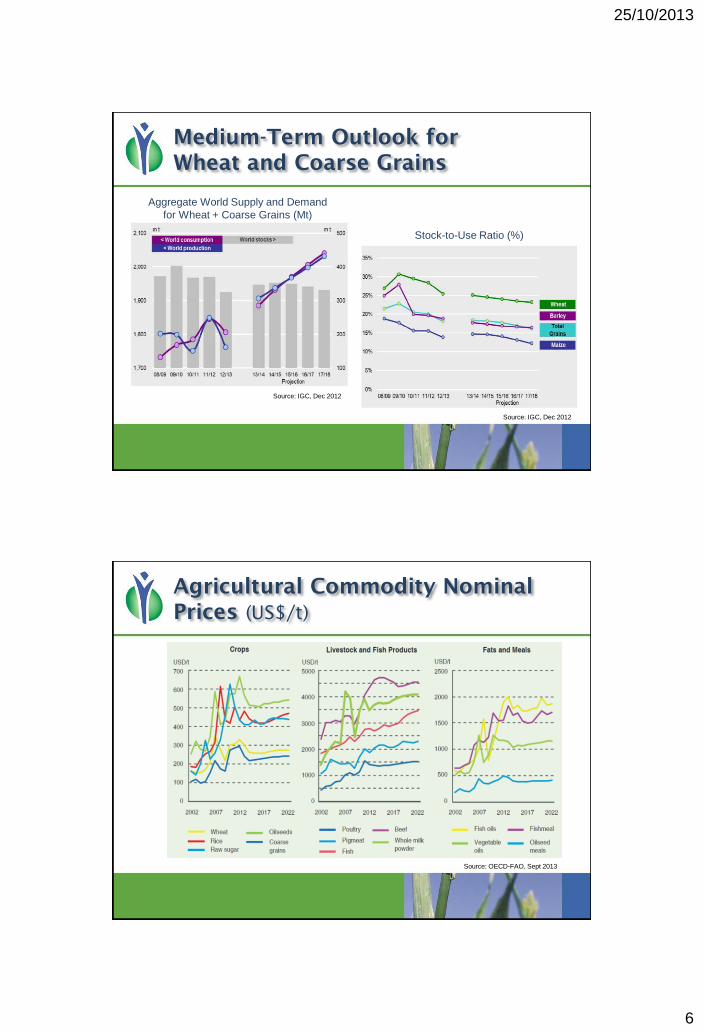
Medium-Term Outlook for
Wheat and Coarse Grains
Stock-to-Use Ratio (%)
Source: IGC, Dec 2012
Aggregate World Supply and Demand
for Wheat + Coarse Grains (Mt)
Source: IGC, Dec 2012
Agricultural Commodity Nominal
Prices (US$/t)
Source: OECD-FAO, Sept 2013
25/10/2013
7
FERTILIZER DEMAND OUTLOOK
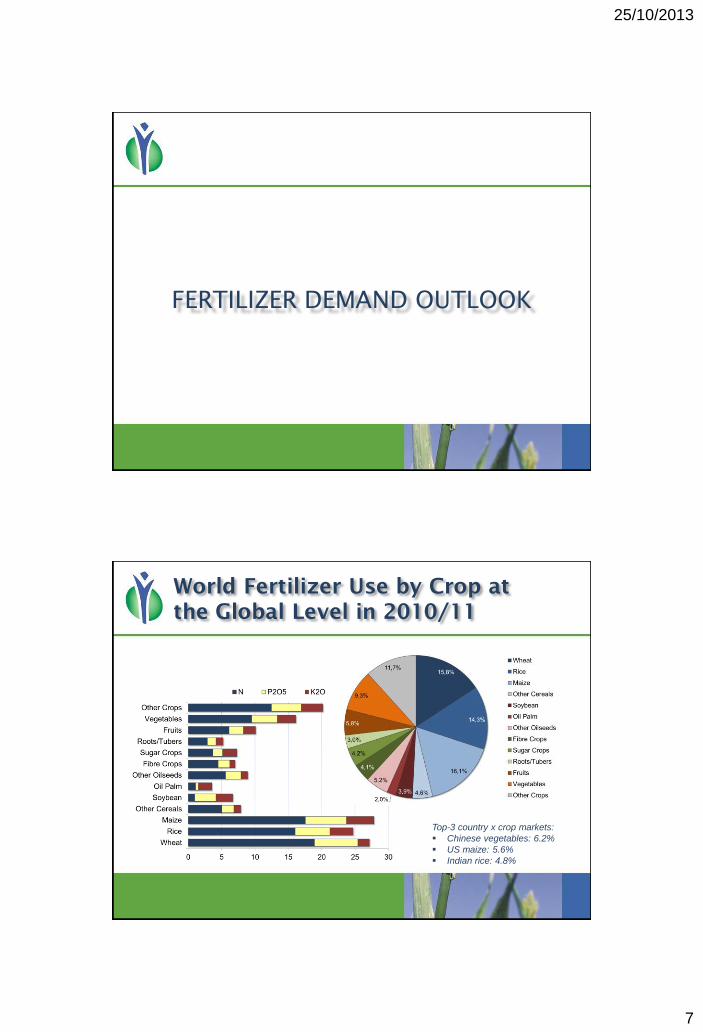
World Fertilizer Use by Crop at
the Global Level in 2010/11
Top-3 country x crop markets:
Chinese vegetables: 6.2%
US maize: 5.6%
Indian rice: 4.8%

25/10/2013
8
Impact of the Nutrient Based
Subsidy (NBS) in India
NBS Rates in India (INR/kg nutrient)
N P2O5 K2O S
2011/12 27.153 32.338 26.756 1.677
2012/13 24.000 21.804 24.000 1.677
Change -11.6% -32.6% -10.3% 0.0%
2013/14 20.875 18.679 18.833 1.677
Change -13.0% -14.3% -21.5% 0%
Subsidy rates revised down
in 2012/13, and again in
2013/14
Evolution of the N:P2O5:K2O Ratio in India
N P2O5 K2O
2009/10 4.3 2.0 1.0
2011/12 6.9 3.1 1.0
2012/13 8.7 3.4 1.0
2013/14 7.6 3.0 1.0
Fast rising retail prices of P
and K fertilizers (due to
reduction of subsidies, firm
international prices and
depreciation of the rupee)
disincentive for use
Widening price differential
between urea and non-urea
fertilizers distorts the
N:P2O5:K2O ratio
Does Fertilizer N Use Efficiency Still
Decline in China and India?
China (29% of world
consumption)
Sources: FAO + IFA, Nov 2012
kg cereals / kg fertilizer N applied
India (16% of world
consumption)

25/10/2013
9
Global Fertilizer Demand
Medium-term Outlook (Mt nutrients)
Source: IFA Agriculture, June 2013
Average Annual Change
Base Year 2017/18
N +1.5% p.a.
P2O5 +1.9% p.a.
K2O +3.0% p.a.
Total +1.8% p.a.
Base year 195
Regional N Fertilizer Demand
Medium-term Outlook (Mt N)
27%
Top-3 = 71% 17%
28%
Source: IFA Agriculture, June 2013
25/10/2013
10
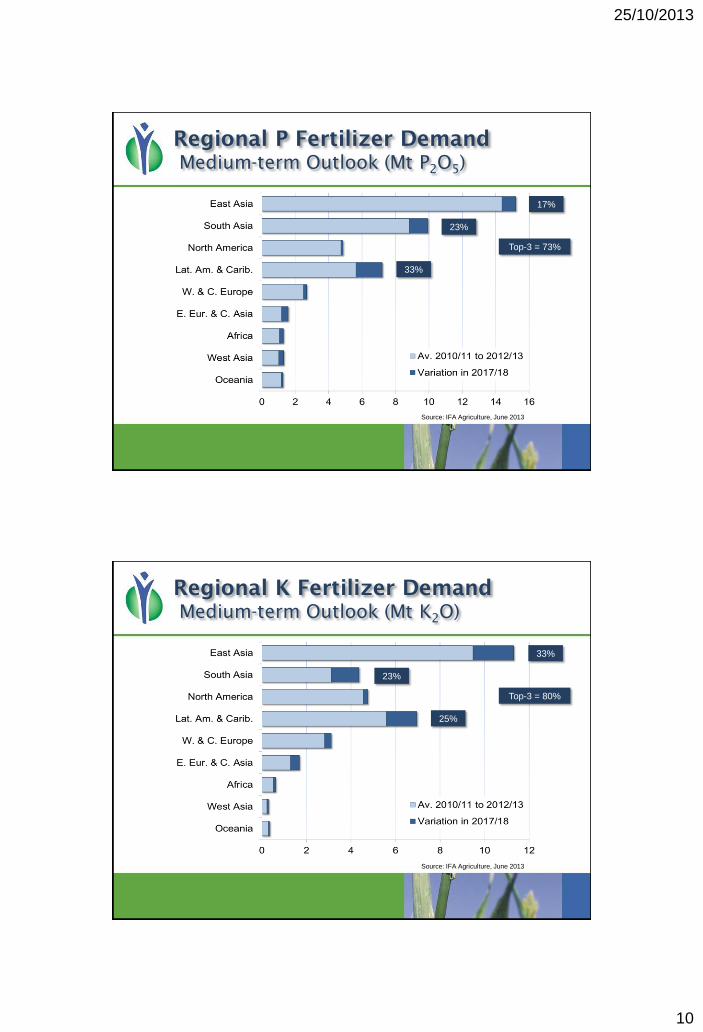
Regional P Fertilizer Demand
Medium-term Outlook (Mt P2O
5)
17%
Top-3 = 73%
33%
23%
Source: IFA Agriculture, June 2013
Regional K Fertilizer Demand
Medium-term Outlook (Mt K2O)
33%
Top-3 = 80%
25%
23%
Source: IFA Agriculture, June 2013

25/10/2013
11
-2 0 2 4 6 8 10 12 14 16
Oceania
West Asia
Africa
E. Eur. & C. Asia
W. & C. Europe
Lat. Am. & Carib.
North America
South Asia
East Asia
K2O
P2O5
N
World Fertilizer Demand Evolution
2017/18 vs. 2007/08 (Mt nutrients)
Source: IFA Agriculture, June 2013
GLOBAL PROSPECTS FOR
FERTILIZER SUPPLY
25/10/2013
12
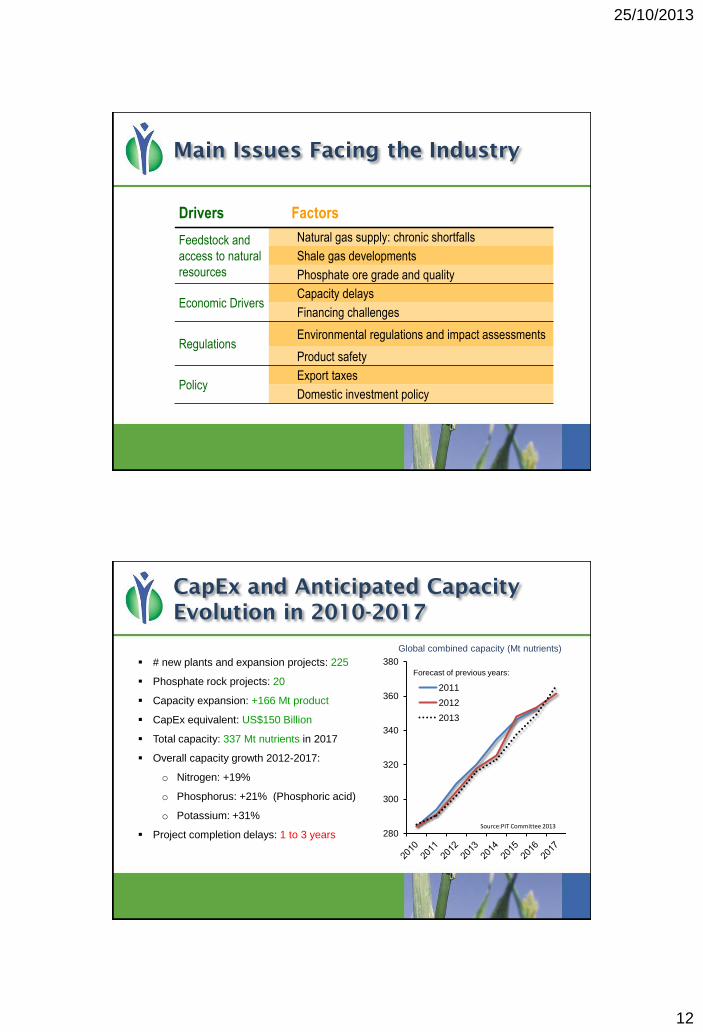
Main Issues Facing the Industry
Drivers Factors
Feedstock and
access to natural
resources
Natural gas supply: chronic shortfalls
Shale gas developments
Phosphate ore grade and quality
Economic Drivers Capacity delays
Financing challenges
Regulations Environmental regulations and impact assessments
Product safety
Policy Export taxes
Domestic investment policy
CapEx and Anticipated Capacity
Evolution in 2010-2017
# new plants and expansion projects: 225
Phosphate rock projects: 20
Capacity expansion: +166 Mt product
CapEx equivalent: US$150 Billion
Total capacity: 337 Mt nutrients in 2017
Overall capacity growth 2012-2017:
o Nitrogen: +19%
o Phosphorus: +21% (Phosphoric acid)
o Potassium: +31%
Project completion delays: 1 to 3 years 280
300
320
340
360
380
2011
2012
2013
Forecast of previous years:
Global combined capacity (Mt nutrients)
Source:PIT Committee 2013
25/10/2013
13
170
142 154
150 165
0
20
40
60
80
100
120
140
160
180
2012 2013 2014 2015 2016 2017
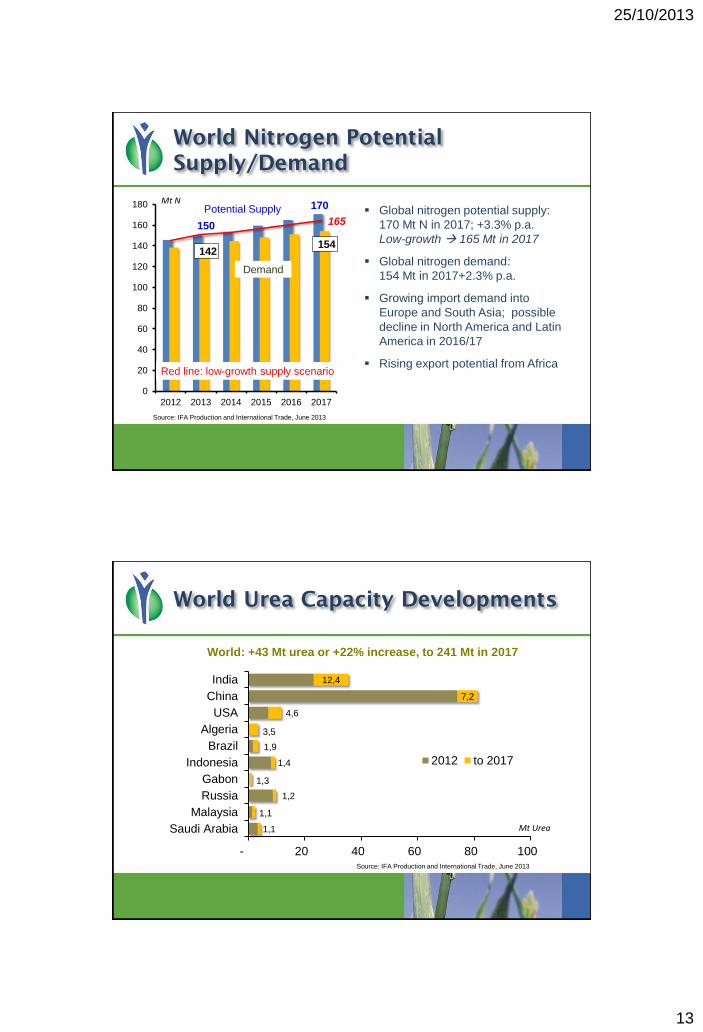
World Nitrogen Potential
Supply/Demand
Source: IFA Production and International Trade, June 2013
Mt N Potential Supply
Demand
Red line: low-growth supply scenario
Global nitrogen potential supply:
170 Mt N in 2017; +3.3% p.a.
Low-growth 165 Mt in 2017
Global nitrogen demand:
154 Mt in 2017+2.3% p.a.
Growing import demand into
Europe and South Asia; possible
decline in North America and Latin
America in 2016/17
Rising export potential from Africa
World Urea Capacity Developments
Source: IFA Production and International Trade, June 2013
Mt Urea 1,1
1,1
1,2
1,3
1,4
1,9
3,5
4,6
7,2
12,4
- 20 40 60 80 100
Saudi Arabia
Malaysia
Russia
Gabon
Indonesia
Brazil
Algeria
USA
China
India
2012 to 2017
World: +43 Mt urea or +22% increase, to 241 Mt in 2017

25/10/2013
14
Global urea potential supply:
207 Mt product in 2017; +4% p.a.
Low-growth 202 Mt in 2017
Global urea demand:
195 Mt in 2017; +3.8% p.a.
Firm import demand into South Asia;
possible decline in North America
and Latin America in late 2016/17
Massive increase of potential
exportable tonnage from Africa; high
tonnage availability from West Asia.
China remains a question mark
207
172
195 182
202
0
20
40
60
80
100
120
140
160
180
200
220
2012 2013 2014 2015 2016 2017
World Urea Potential Demand/Supply
Source: IFA Production and International Trade, June 2013
Mt Urea Potential Supply
Demand
Red line: low-growth supply scenario
3,1
2,7
0,6
2,4
1,4
1,0
- 5 10 15 20 25
EA
NA
AF
EECA
WA
LA
Other
2012 to 2017
Regional Phosphoric Acid Capacity
Changes
Mt P2O5
Source: IFA Production and International Trade, June 2013
World: +11 Mt P2O5 or +21% increase, to 64 Mt in 2017
25/10/2013
15
52
42
46
46 50
0
10
20
30
40
50
60
2012 2013 2014 2015 2016 2017
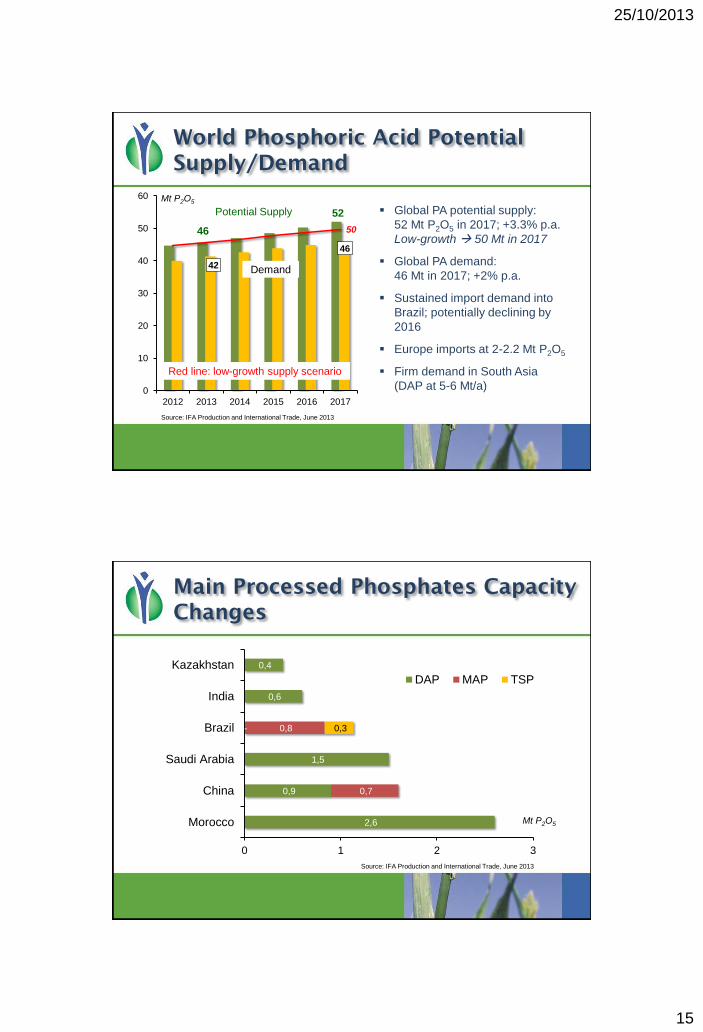
World Phosphoric Acid Potential
Supply/Demand
Source: IFA Production and International Trade, June 2013
Potential Supply
Demand
Red line: low-growth supply scenario
Global PA potential supply:
52 Mt P2O5 in 2017; +3.3% p.a.
Low-growth 50 Mt in 2017
Global PA demand:
46 Mt in 2017; +2% p.a.
Sustained import demand into
Brazil; potentially declining by
2016
Europe imports at 2-2.2 Mt P2O5
Firm demand in South Asia
(DAP at 5-6 Mt/a)
Mt P2O5
Main Processed Phosphates Capacity
Changes
Source: IFA Production and International Trade, June 2013
Mt P2O5 2,6
0,9
1,5
-
0,6
0,4
0,7
0,8 0,3
0 1 2 3
Morocco
China
Saudi Arabia
Brazil
India
Kazakhstan
DAP MAP TSP
25/10/2013
16
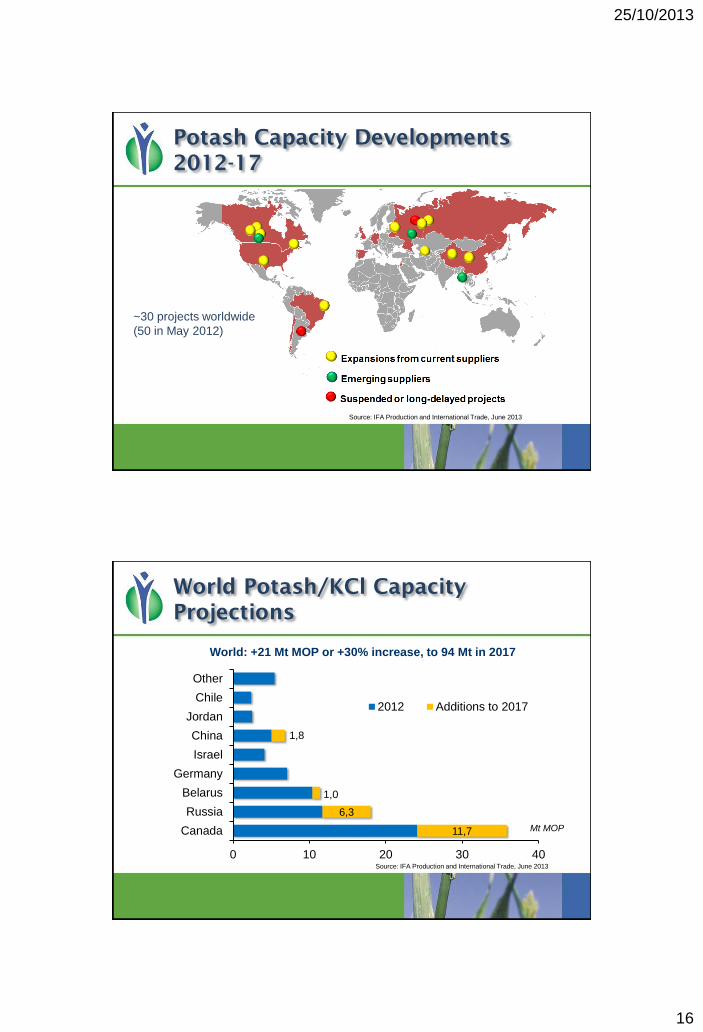
Potash Capacity Developments
2012-17
Source: IFA Production and International Trade, June 2013
~30 projects worldwide
(50 in May 2012)
World Potash/KCl Capacity
Projections
Source: IFA Production and International Trade, June 2013
Mt MOP
World: +21 Mt MOP or +30% increase, to 94 Mt in 2017
11,7
6,3
1,0
1,8
0 10 20 30 40
Canada
Russia
Belarus
Germany
Israel
China
Jordan
Chile
Other
2012 Additions to 2017
25/10/2013
17
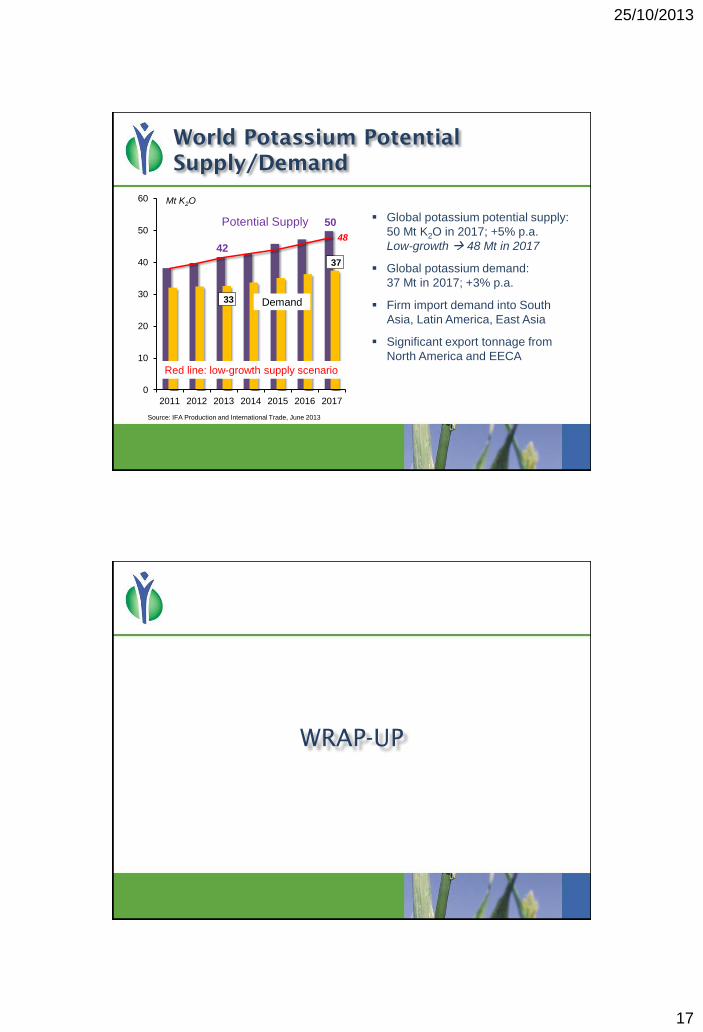
42
50
33
37
48
0
10
20
30
40
50
60
2011 2012 2013 2014 2015 2016 2017
World Potassium Potential
Supply/Demand
Source: IFA Production and International Trade, June 2013
Potential Supply
Demand
Red line: low-growth supply scenario
Global potassium potential supply:
50 Mt K2O in 2017; +5% p.a.
Low-growth 48 Mt in 2017
Global potassium demand:
37 Mt in 2017; +3% p.a.
Firm import demand into South
Asia, Latin America, East Asia
Significant export tonnage from
North America and EECA
Mt K2O
WRAP-UP

25/10/2013
18
Key Messages on the Demand Side
Agricultural commodity prices seen remaining firm in medium
term as markets would remain tight
Market fundamentals provide incentives for increasing
fertilizer demand
However, improvement in fertilizer use efficiency moderate
the prospects
World demand growth for N and P fertilizers seen slowing
down, influenced by China and India
Significant uncertainties: economic activity, weather-related
crop shortfalls, fertilizer subsidies in India, biofuel mandates
in US/EU, etc.
Key Messages on the Supply Side
Fertilizer industry responds to rising demand and invests
heavily in additional capacity
Likely delays in capacity expansion due to technical,
financial, economic, regulatory and other constraints
significant degree of uncertainty on the supply side as
well
Under a realistic low-growth supply scenario, markets are
likely to remain relatively balanced in the medium term,
especially for nitrogen and phosphates

25/10/2013
19
You are an individual fertilizer expert? • You have expertise in project development and
financing; plant design; manufacturing; logistics;
distribution; safety, health and environment in
production; quality assurance; business planning;
marketing; project management, etc…
You are a fertilizer company? • You would like to contribute to building the
knowledge and skills of the African workforce by
sponsoring a new program
• You have an employee engagement program that
you would like to find more purpose for
You want contribute to food security and smallholder access to fertilizers in Sub-Saharan Africa?
INFORMATION Sheila Keino [email protected]
JOIN the African
Fertilizer Volunteers
Program and HELP
the African fertilizer
value chain to develop
SHARING your
expertise or
SUPPORTING the
program you can
make a huge
difference
for questions/comments: