world bank documentdocuments.worldbank.org/curated/en/189581468303532498/pdf/multi... · d'imt...
TRANSCRIPT

ASA 3 AD'imt of
The World Bank
FOR OFFMCIAL USE ONLY
''1!TI'; RepoirtNo. 9470-TH
STAFF APPRAISAL REPORT
THAILAND
DISTRIBUTION SYSTEM UPGRADING PROJECT
AUGUST 6, 1991
Industry and Energy Operations DivisionCountry Department IIAsia Region
This documtnt has a rtestricted distribution and may be used byv recipients only in tbe performance oftheir official duties. Its contents may not otherwise be disclosed wvithout World Bank authorization.
Pub
lic D
iscl
osur
e A
utho
rized
Pub
lic D
iscl
osur
e A
utho
rized
Pub
lic D
iscl
osur
e A
utho
rized
Pub
lic D
iscl
osur
e A
utho
rized
Pub
lic D
iscl
osur
e A
utho
rized
Pub
lic D
iscl
osur
e A
utho
rized
Pub
lic D
iscl
osur
e A
utho
rized
Pub
lic D
iscl
osur
e A
utho
rized
CURRENCY EQUIVALENTS(As of March 1991)
Currency Unit - Thai Baht (B)US$1 - B 25.0Bi - U';$0.04
WEIGHTS AND MEASURES
kV - kilovolt (1,000 volts)kVA - kilovolt-ampe-e (1,000 volt-amperes)MVA - megavolt-ampere (1,000 kilovolt-amperes)kW - kilowatt (1,000 watts)km - kilometerMW - megawatt (1,000 kilowatts)kWh - kilowatt-hour (1,000 watt-hours)GWh - gigawatt-hour (1 million kilowatt-hours)MMt - million metric tonnes
ABBREVIATIONS AND ACRONYMS
EGAT - Electricity Generating Authority of ThailandERR - Economic Rate of ReturnFPO - Fiscal Policy OfficeIFR - Internal Financial Rate of ReturnMEA - Metropolitan Electricity AuthorityMOF - Ministry of FinanceNEA - National Energy AdministrationNEPO - National Energy Policy OfficeNESDB - National Economic and Social Development
Board
OECF - Overseas Economic Cooperation FundPEA - Provincial Electricity AuthorityPDP - Power Development PlanROR - Rate of ReturnRTG - Royal Thai GovernmentSFR - Self-Financing Ratio
FISCAL YEAR
October 1 to September 30

FOR OMCIAL USE ONLY
DISTRIBUTION SYSTEM UPGRADING PROJECT
Loan and Progect Summary
Borrower: Provincial Electricity Authority (PEA)
Guarantor: Kingdom of Thailand
Am2unt: US$40 million equivalent
Lending Terms: Repayable over 17 years, including five yeare ofgrace, at the standard variable interest rate
Project Doscriltiom: The main objectives of the proposed project are:(a) to help meet the growth in power demand in oneof the most rapidly industrializing areas ofThailand at optimum reliability and cost; (b) toimprove PEA's technical and managementcapabilities to face the challenges of rapidgrowth in its franchise area; and (c) to ensurethrough the monitoring of appropriate financialcovenants that PEA's financial strength remainsadequate to support its growth. With the currentindustrialization of portions of PEA's serviceterritory, and particularly in providing serviceto industrial estates which are being establishednear Bangkok, PEA is required to upgrade itssystem to provide the additional supply at thehigher reliability demanded by industry. The;r..ject would provide for the construction oftransmission lines and substations in a U-shapedgeographical area surrounding Bangkok.Specifically, the project would involve: (a)construction of about 18, 115/22 kV substationsand about 500 km of 115 kV transmission lines; and(b) consulting services for: (i) systemreliability improvement; (ii) project engineeringand design; (ili) training of PEA staff in 115 kVsystem planning, design, operation andmaintenance; (iv) improving PEA's capabilities incomputerized distribution planning and design; and(v) strengthening PEA"s organization structure.
Aevtfits and Risks: The continuing surge in electricity demand in thePEA service territory has made it imperative forPEA to expand and upgrade its power distributionsystem to deliver power to new areas whileenhancing the reliability of the system to
rThis document has a restricted distribution and may be used by recipients only in the performance|of their offcial duties. Its contents may not otherwise be disclosed without World Bank authorization.

. {i i
acceptable levels. Through the provision ofreliable power supply, the project would promoteefficient industrial growth which is vital for thecourntry's economic development. Further, itsImplementation would assist the government'sobjective of promoting industrial growth outsidemetropolitan Bangkok. The project forms anImportant part of PEA's least-cost expaasionprogram. Its implementation would achieve thedual objective of reducing losses and improvingreliability and it would set a precedent forsimilar future projocts In high density growthareas of the country. Given PE&'s advanced stateof preparedness generally, as well as specificconsultancy assistance provided in relevanttechnical and management areas, the project facesno substantial risks in implementation. The riskof power demand not materializing as forecast islow; however, the project's return is robustenough to accept ressonable demand shortfalls.

- iii.
Estimated Cost:Local Es3gLLg ,Total
.......- (US$ million) -ThRD-Financed Com2onent
Substations 9.35 15.70 25.05Transmission Lines 16.60 16.70 33.30Consultancy 0.10 0.90/i 1.00Duties and Taxes 5.85 0.00 5.85
Base Cc fl 31.90 33.30 65.20
OECF-Financed QCom2onentSubstations andTransmission Lines 33.00 42.00 75.00
Duties and Taxes 9.50 0.00 9.50BAse Cglt 42.50 42.00 84.50
Total Base Cost 4.40 25 .20 149.70
ContingenciesPhysical 7.40 7.85 15.25Price 9.30 9.75 19.05
Total Cost 91Z10 92!20 184.0Q
Interest during Construction 6.50 9.50 16.00
Total Finncgn Required 9Z.60 102.40 200.00
/A Funded by the Japan Grant Facility.
Financing Plan:FIRAMing Plan: ~~~~~Lgcal Foreig Total
Sources -------- (US$ million) -------
Internal Cash Generation 67.40 - 67.40
OECF - 52.00 52.00
Japan Grant - 0.90 0.90
IBRD - 40.00 40.00
Other Borrowings 30.20 9.50 39.70
Total 27.60 102.40 200.00
Estimated Disbursements:
Bank E=Em F 9a EY M EM------------- (US$ million) -------------
Annual 1.00 4.00 15.00 15.00 5.00Cumulative 1.00 5.00 20.00 35.00 40.00
Economic Rate of Return: 17X
DISTRIBUTION SYSTEM1 UPgRAING PROJECT
STAFF APPRAISAL REPORT
Table of Contents
Loan and Project Summary . . . . . . . . . . . . . . . . . . . . . . .
I. THE ENERGY SECTOR . . . . . . . . 1 . . . . . . . . . . . . . . . .A. Overview . . . .. 1B. Energy Sector Institutions.1C. The Power Sector. . . . . . . . . . . . . . . . . . . . . . . .D. Sectoral Strategy and Issues . . . . . . . . . . . . . . . . . 5E. Bank Lending for the Sector . . . . . . . . . . . . . . . . . . 7
II. THE B.)l.W ........ ............. ..... . 8A. Organization and Management ..... . .. . . . . . . .. . . 9B. Staffing and Training . . . . . . . . . . . . . . . . . . . . . 10C. Operational Performance . . . . . . . . . . . . . . . . . . . . 11D. Financial Management . . . . . . . . . . . . . . . . . . . . . 11
III.3HE PI OJECT . . . . . . . . . . . . . . . . . . . . . . . . . . . . 13A. Project Background . . . . . . . . . . . . . . . . . . . . . . 13B. Project Objectives and Description . . . . . . . . . . . . . . 13C. Implementation . . . . . . . . . . . . . . . . . . . . . . . . 15D. Environment . . . . . . . . . . . . . . . . . . . . . . . . . 16E. Cost Estimates . . . . . . . . . . . . . . . . . . . . . . 16F. Financing Plan ..... . ....... .......... 18G. Procurement .18H. Disbursements .19
IV. FINANCIAL ANALYSIS .. 20A. Past Performance .20B. Financial Outlook .21C. Tariff Levels and Structure .23D. Financing Plan .24
V. PROJECT JUSTIFICATION . . . . . . . . . . . . . . . . . . . . . . . 25A. Economic Analysis . . . . . . . . . . . . . . . . . . . . . . . 25B. Risks.. . .. 25
VI. AGREEMENTS RIEACHED AND RECOMMENDATION . . . . . . . . . . . . . . . 26A. Agreements . . . . . . . . . . . . . . . . . . . . . . . . . . 26B. Recommendation ........................ 27
ANNEUS~~~~~~~ '
1. Highlights of EGAT, MEA and PEA Operations . . . . . . . . . . 282. PEA's Demand Forecast . . . . . . . . . . . . I . . . . . . . 293. PEA's Existing Distribution Facilities . . . . . . . . . . . . 304. PEA's Investment Program . . . . . . . . . . . . . . . . . . . 315. Terms of Reference for Consultancy Study . . . . . . . . . . . 326. Terms of Reference for Consultancy Study . . . . . . . . . . . 357. Project Cost Estimate . . . . . . . . . . . . . . . . . . . . 388. Disbursem3nt Schedule . . . . . . . . . . . . . . . . . . . . 409. PEA's Past Financial Performance . . . . . . . . . . . . . . . 4110. PEA's Financial Projections . . . . . . . . . . . . . . . . . 4411. PEA's Tarlff Structure . . . . . . . . . . . . . 5012. Calculation of Internal Rate of Return .. 5113. List of Documents in Project File . . . . . . . . . . . . . . 52
1. PEA's Organization Chart . . . . . . . . . . . . . . . . . . . 532. Project Implementation Schedule . . . . . . . . . . . . . . . 54
IBRD No. 22868
This report is based on the findings of a pre-appraisal mission to Thailandin October 1990, comprising Margaret Hanson (Financial Analyst) and DarayesMehta (Senior Power Engineer). The appraisal was completed in March 1991.The Peer Reviewers were Mr. John Irving (ASTEG), Mr. Jamil Sopher (AS2IE)and Mr. Hossein Razavi (AS2IE). The Project was cleared by Mr. Gautam Kaji(AS2DR) and Mr. Inder Sud (AS2IE).
ATHAN-
]DISTRIBUTION SYSEM UPGRING PROJECT
I. TAR ENEMRY SECT
A. Overview
1.1 The social and economic transformation of the Thai economy overthe past decade has resulted in rapid growth in energy consumption, withfinal commercial energy consumption growing at an average annual rate of5.5 during the 1980s. Nost of this growth was initially met by energyimports: at the time of the 1979/80 oil crisis, Thailand's dependence onimported oil was in excess of 90X of total primary commercial energy. Inthe ensuing years, however, efforts made by the Royal Thai Government (RTG)to promote the development of indigenous energy resources have had avisible impact on the pattern of commercial energy consumption: the shareof oil has fallen markedly, being reduced from 91X in 1977 to 64X in 1989,with that of imported oil down to 572. Conversely, the shares ofindigenous lignite and natural gas have grown steadily, reaching 10 and24X, respectively. This notwithstanding, the energy situation in Thailandremains characterized by relatively modest commercial energy consumption inrelation to the country's development (369 tonnes of oil equivalent per US$million of GDP), with traditional energy, particularly fuelwood, remainingthe predominant fuel in rural households. The outlook is for rapid growthin commercial energy consumption as the economy continues expanding.
1.2 The sectoral composition of ener&' demand has been marked by aprogressive increase in the share of the traaaport sector, which reached392 in 1989, accounting for 702 of petroleua products consumption.Electricity consumption has increased faster than energy consumption as awhole, averaging 142 per annum in the last three years. As a result, theshare of electricity in final commercial energy consumption has grown from112 to 152 between 1979 and 1989, wi_h a similar increase in the share ofelectricity in primary energy use (from 72 to 11).
1.3 Considerable progress has been made in making electricity widelyavailable throughout the country, especially in provincial urban areas.Industrial consumption has also been growing rapidly. This has resulted ina per capita electricity consumption in Thailand (about 589 kWh in 1989)higher than the average for countries at the same income level. Similartrends are expected to prevail in the future as the country's industrialand socio-economic development accelerates.
B. Energy Sector Institu!ions
1.4 A number of well managed public institutions operate in theenergy sector. The Petroleum Authority of Thailand -- the dominant entityin the petroleum sector -- is responsible, inter alia, for the purchase,transport, processing and sale of natural gas. The power sector is

-2-
organized around three state enterprises: the Electricity GeneratingAuthority of Thailand (EGAT) is responsible for power generation andtransmission, and the Metropolitan Electricity Authority (MEA) and theProvincial Electricity Authority (PEA) are responsible for powerdistribution in the Bangkok metropolitan area and the rest of the country,respectively. Highlights of ths operations of EGAT, MEA and PEA areincluded in Annex 1.
1.5 Energy sector policy and planning involve the National Economicand Social Development Board (NESDB), which is under the Office of thePrime Minister and oversees public investment planning; the National EnergyAdministration (NEA), under the Minisury of Science, Technology and Energy,which is primarily engaged in the promotion of energy conservation and thedevelopment of renewable resources; the Department of Mineral Resources andthe Department of Indust:ies, both under the Ministry of Industry, whichare responsible, respectively, for regulating petroleum and ligniteexploration and production, and industries and private power producers, onbehalf of the government. The National Energy Policy Committee, which actson behalf of the Cabinet on all matters related to energy policy andplanning, with the National Energy Policy Office (NEPO) under the PrimeMinister's Office serving as its secretariat, facilitates the interfacebetween the petroleum, refining and power subsectors.
1.6 While public enterprises engaged in the energy sector enjoy alarge degree of autonomy in the conduct of day-to-day operations, they aresubject to strict government control in all matters related to investmentplanning and financing. In particular, reflecting growing concern overpublic sector indebtedness, recent government reforms have introducedstringent procedures for the control of public debt. All loans made bypublic enterprises requiring government guarantee must now be approved bythe National Debt Policy Committee and by the Cabinet, and subsequentlyendorsed by the Fiscal Policy Office (FPO) of the Ministry of Finance(MOF).
C. The Power Sertor
Electricity Demand
1.7 The electricity market in Thailand has grown at a very rapid paceover the past three decades. Total sales of electricity and per capitaconsumption increased from 467 GWh and 19 kWh, respectively, in 1961 toabout 33,611 GWh and 606 kWh in 1989. Growth since 1980 has averaged 9.5Xp.a. (compared to an average GDP growth rate of 5.01). The industrialsector has bacome the major electricity consumer, accounting for 47X ofelectricity sales in FY89. Recent growth, however, has been fueled largelyby a substantlal expansion in residential consumption both in urban andrural areas.
1.8 A sharp upsurge in economic activity in the late 19809 (GDPgrowth was 10.41 in FY88 and 12.2X in FY89) translated into much higherthan expected growth in electricity demand over the last few years (15.0Xin FY88 and 14.5X in FY89) and the outlook is for continued rapid growthover the medium term. Taking these developments into account, the nationalLoad Forecast Working Group (composed inter laU of NESDB, PEA, NEA, EGATand NEA) recently revised its official demand forecast. This latest

forecast envisages a 14.5X growth rate in electricity consumption through1992. This is reasonable in view of the high GDP growth rate anticipatedfor the same period (8.22) and the high historical elasticity of demand forelectricity in periods of rapid economic growth. The growth rates areexpected to moderate to 8.4X p.a. over 1993-97 and 6.92 p.a. over 1998-02.
1.9 During the past decade, electricity demand in the provincialurban and rural areas, including the areas surrounding Bangkok, has grownmuch more rapidly than in Bangkok. Accordingly, over the last severalyears, PEA has grown more quickly than MEA. While ML.'s sales growth overthe 1980s has been about 72 p.a., PEA's sales growth has averaged about 14Xper year. In 1989, PEA accounted for 44X of total electricity sales,compared with 342 ten years earlier. Due in part to the government'sefforts to stimulate industrial expansion outside of Bangkok, a substantialportion of the expected increase in electricity demand in the 1990s willfall within PEA's territory (par&. 3.1). While electricity sales by KEAare expected to increase on average 9X p.a. over the next decade, sales byPEA will go up by almost 122 p.a., with sales growth averaging 16X p.a. inthe next three years. PEA thus faces a major challenge to upgrade andexpand its system to meet its increasingly large and significant part ofthe power market. PEA's demand forecast is given in Annex 2.
Installed Capacity
1.10 As of September 1990, the total installed generating capacity ofthe Thai power subsector was about 7,762 MW, while another 3,873 MW wereunder construction. The generating facilities consisted of conventionalthermal rlants (562), hydropower (292), combined-cycle plants (122) andcombustion turbines (32). Total generation from EGAT facilities was about36,457 GWh in 1989, accounting for almost 1002 of the Thai total generationwith PEA generating only 17 kWh from its mini-hydco plants. In addition,750 GWh were purchased from Laos and Malaysia. The residential sectoraccounted for 22X of aggregate electricity sales; the commercial sector,222; the industrial sector, 48X; and the government, street lighting andwater supply, 8X.
1.11 Total losses in the systom were approximately 14X of grossgeneration. EGAT's power losses, including both transmission andgeneration losses, amounted to about 82 of electricity produced, withestimated transmission losses being about 42 and auxiliary consumptionbeing 42 of generation. Distribution losses as a percentage of powerreceived were about 6X for NEA and 82 for PEA.
1.12 High and extra-high voltage bulk power transmission lites inThailand, which are owned and operated by EGAT, total 17;770 circuit-kilometers (ckm) of lines, including 326 ckm constructed for 500 kV. Inaddition to the construction of transmission lines and substations requiredto evacuate the output of new generation plants, EGAT is progressivelydeveloping a transmission system to serve various areas of the country.
1.13 The distribution system in Thailand as operated by PEA outside ofBangkok includes 138,000 ckm of distribution lines and 9,672 NVA oftransformer capacity. PEA's distribution facilities are tabulated in Annex3. The bulk of PEA's distribution is carried out at 22 kV and 33 kV, with22 kV constituting almost 832 and 33 kV almost 16X of the total network.At the 115 kV level PEA currently owns about 28 ckm of lines and 120 MVA of
. 4 -
transformer capa3ity. This would increase to almost 500 ckm and 900 NVAunder the proposed project.
Power Cector Investment Proqram
1.14 Meeting increased load demand and improving the electricitytransmission and distribution systems will require heavy Investment,estlmated at about US$23 billion equivalent over the next ten years. Ofthis, investments by EGAT to expard the generation and transmissionfacilities are estimated to be ab^ltt US$15 billion, and investments by PEAand MEA of about US$5 billion and us$3 respectively will be needed, largelyto upgrade and expand their distribution facillities.
1.15 Investment by PEA over the near-term will be used in part tofinance continued distribution of power to the provinces, which began on aplanned basis in the early 1960s with the formation of the company.Central to PEA's rural electrification effort have been the AcceleratedRural Electrification Program, partly financed by the Bank under Loans1527-TH and 1871-TH, and the Normal Rural Electrification Program, underwhich villages requesting electrification had to provide materials (e.g.,wooden poles and cross arms) and half of the labor needed. In later yearsthis practice was discontinued to facilitate compliance with strictertechnical requirements and specifications, and in its place a monetarycontribution amounting to about 25-30X of the cost of villageeletrification was substituted. The balance was first funded fromgovernment budget allocations and subsequently from subsidized local loansto PEA by the Krung Thai Bank and the Ministry of Finance.
1.16 As of 1989, PEA had accomplished electrification of 55,446villages, achieving an electrification ratio of about 89X. At the currentrate of electrification of almost 2000 villages per annum, theelectrification ratio is expected to reach about 96X by the year 1992.Thereafter the pace of village electrification would slow down to a rate ofabout 500 villages per annum, gradually progressing to an electrificationratio near 1001.
1.17 With village electrification achieving its targets, PEA'sinvestments in rural electrification would be substantially reduced in thelatter part of the 1990s. Indeed, much of PEA's investment requirementsover the next ten years will result from the growing demand from industrialenterprises in PEA's service territory. Providing electricity increasinglyto industrial operations will force PEA to upgrade its system, not only tomeet the significantly expanded demand but also specifically to provide thehigher reliability required by industry. The growth and change in itscustomer base is pushing PEA to become a very different utility than it hasbeen in the past. PEA's investments over the medium term would concentrateon: (a) expanding and reinforcing distribution networks servicing largetown centers; (b) implementing distribution system upgrading (to 115 kV) inhigh growth industrial areas; and (c) introducing improvements in systemoperating efficiency through measures such as the introduction of regionallocal dispatch centers. In the near term, the development of industrialestates in a U-shaped geographical area around Bangkok is necessitating asignificant expansion and upgrading of PEA's distribution system in thatarea. It is this neod which underlies the proposed project.
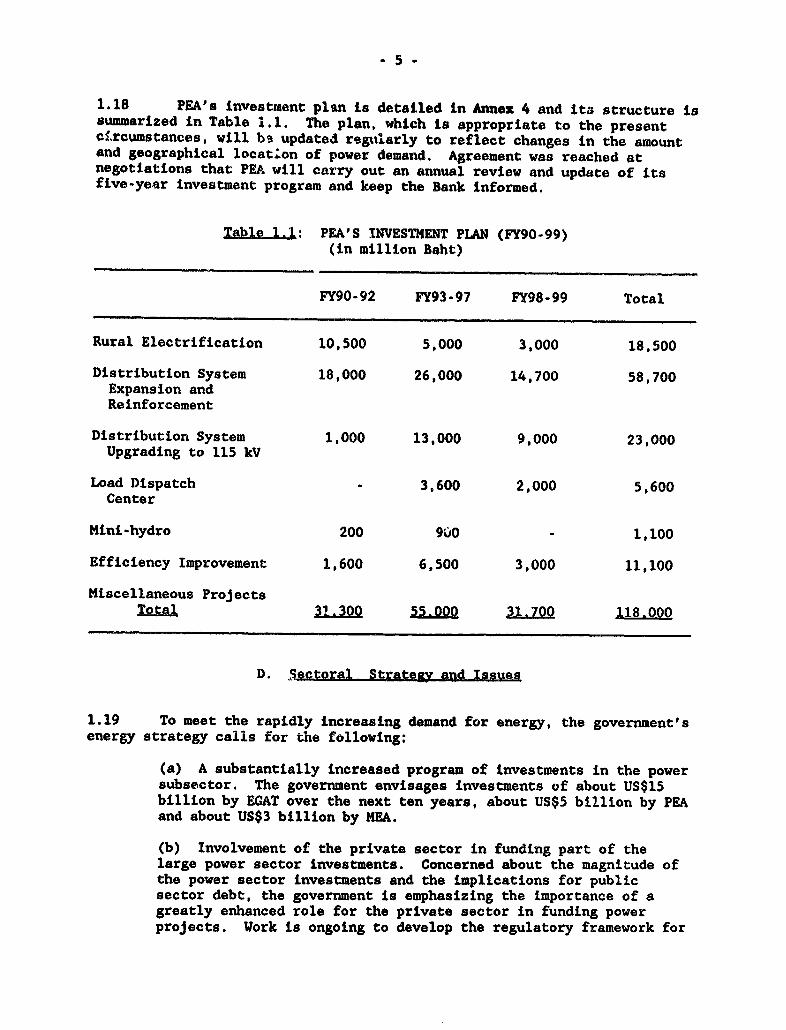
1.18 PEA's investment plan is detailed in Annex 4 and its structure issummarized in Table i.. The plan, which i8 appropriate to the presentclrcumstances, will be updated regularly to reflect changes in the amountand geographical location of power demand. Agreement was reached atnegotiations that PEA will carry out an annual review and update of itsfive-year investment program and keep the Bank informed.
Table 1.1: PEA'S INVESTMENT PLAN (FY90-99)(in million Baht)
FY90-92 FY93-97 FY98-99 Total
Rural Electrification 10,500 5,000 3,000 18,500
Distribution System 18,000 26,000 14,700 58,700Expansion andReinforcement
Distribution System 1,000 13,000 9,000 23,000Upgrading to 115 kV
Load Dispatch - 3,600 2,000 5,600Center
Mini-hydro 200 9ci0 - 1,100
Efficiency Improvement 1,600 6,500 3,000 11,100
Miscellaneous ProjectsTotal 31.300 55.000 31.70Q 118.000
D. Sectoral Strategy) and Issues
1.19 To meet the rapidly increasing demand for energy, the government'senergy strategy calls for the following:
(a) A substantially increased program of investments in the powersubsector. The government envisages investments of about US$15billion by EGAT over the next ten years, about US$5 billion by PEAand about US$3 billion by MEA.
(b) Involvement of the private sector in funding part of thelarge power sector investments. Concerned about the magnitude ofthe power sector investments and the implications for publicsector debt, the government is emphasizing the importance of agreatly enhanced role for the private sector in funding powerprojects. Work is ongoing to develop the regulatory framework for
private participation in the power sector, either through build-own-operate-transfer type operations and/or through a sale of EGATequity on the securities markets. The Bank is working with thegovernment and EGAT in this regardI.
(c) A thrust towards energy conservation, both througheconomically efficient pricing of resources and through othergovernment directives. Concerned with the rapid growth in energyconsumption and its impact on the economy and the environment, thegovernment is making serious efforts towards fostering energyconservation in all sectors of the economy. Some of theinitiatives are described in paras. 1.20-1.21 below.
(d) A stimulation of industrial growth outside of Bangkok, withdevelopment of infrastructure and granting of tax incentives topromote such growth. This would create growth centers in theprovincial areas and relieve the infrastructural strain inBangkok.
(e) Improving the efficiency of the distribution system and up-grading the system to operate at the higher levels of reliabilitynecessary for industry.
Energy Conservation
1.20 The Sixth Economic and Social Development Plan (1988-1992) haslaid out a policy framework for energy conservation which airects: (a) theestablishment of an Energy Conservation Center of Thailand charged withpromoting energy conservation through public awareness, consultingassistance, training, inspection, research and development; (b) theIndustrial Finance Corporation of Thailand and other financing agencies toprovide low-interest loans to industrial factories which adopt energysaving proceses and systems; (c) reduction of taxes and duties on energyefficient equipment and appliances; (d) educational institutes topromulgate energy knowledge to students and the public; (e) considerationfor enacting an Energy Conservation Promotion law mandating energyefficient designs for new industrial and commercial buildings and systems,and improving features of existing ones; (f) government agencies totranslate policy into action plans; and (g) promotion of transfer oftechnology and close cooralnation in its exploitation between thegovernment agencies and the private sector. These directives are currentlybeing implemented by NEA and the newly established Energy ConservationCenter of Thailand. In the electricity subsector. NEA, followingccnsiderable research in energy effie'snt applications of electricity, hasformulated an Electricity Savings Plan for the industrial, commercial andresidential sectors. This plan, cleared by the Nationa'2 Energy PolicyFormulation Committee, and approve; by the Cabinet in January 1990,estimates an overall savings potential of about 600 MW and 1,500 GWh p.a.and proposes a three-year savings target of about 160 MW (of which about 88MW is during the peak -period) and about 400 GWh p.a.
Demand-Side Management and ElectricLty Conservation
1.21 Consumption of electricity in Thailand has hitherto been primarilycontrolled through electricity pricing, which has generally reflected long-run marginal cost. In compliance with agreements under a World Bank loan

- 7 -
to EGAT (Loan 2915-TH), EGAT introdttced in 1990 time-of-day rates for someof its large industrial consumers to discourage use of electricity duringsystem peak hours; it expects to extend these rates to more customers in1991. Government is working with the three utilities to explore furtherdemand-side management possibilities, which could be initiated by eitherutilities or consumers. In the context of a recent loan to -GAT, the Bankis assisting in preparation of a master plan for demand-side management andelectricity conservation by EGAT, MEA and PEA and an ultimate integrationof demand-side planning and management with supply-side least-costexpansion planning. Consultants to undertake the work are to be appointedshortly and the work is expected to be carried out in 1991-92.
E. Bank Lending for the Sector
ExRerience with Past Loans
1.22 The Bank has made 17 loans to Thailand for power, of which threehave been made to PEA for rural electrification and fourteen have been madeto EGAT for expansion of generation and transmission facilities. The loansto PEA have been fully disbursed. Of the fourteen loans to EGAT, elevenhave been fully disbursed; the other three are progressing on schedule.
1.23 During the past ten years, PEA completed three Bank-financedprojects for rural wlectrification: the Accelerated Rural ElectrificationProject (Loan 1527-TH, completed in 1983), the Second Accelerated RuralElectrification Project (Loan 1871-TH, completed in 1987) and theProvincial Power Distribution Project (Loan 2312-TH, completed in 1989).The corresponding project completion reports (dated June 13, 1986, February6, 1989, and July 6, 1990, respectively) and project performance auditreports (PPAR # 6269 dated June 13, 1986, PPAR # 7756 dated April 1, 1989,and PPAR # 9016 dated September 14, 1990) show that the project objectiveswere largely accomplished. Indeed, the third project overachieved itsoriginal elestrification targets by electrifying 2,330 new villages ascompared with the appraisal estimate of 1,500, extending service to 10,021rather than the estimated 1,500 partially electrified villages, andsupplying 224,741 households with electricity, against a forecast of127,500. The larger volume of work was possible within the loan amountbecause of the substitution of locally available materials for imports.The increase in total project cost was about 25X. The main lesson learnedfrom the last project was the need to estimate costs with much greatercccuracy and this has been taken into account in preparing the proposedproject. Consultants have been hired by PEA to do the feasibility studyand to prepare cost estimates in great detail. Lessons learned from otherprojects were not significant and are not applicable to this project.
1.24 Through its continuing dialogue with the power subsectorinstitutions, the Bank has been instrumental in the implementation ofadequate overall electricity tariff levels, ensuring the sector's financialsoundness and the cost effectiveness of power sector investments. Bank-sponsored sector work in investment planning and energy pricing representedsignificant contributions towards improving sector coordination. Overall,the Bank's presence in the rower subsector has helped to ensure that theutilities were soundly managed and has encouraged other lenders to provideinvestment financing for the subsector on favorable terms. With specificregard to PEA, the Bank's association has contributed to PEA's

- 8 -
institutional development, focusing particularly on improving (i) strategicplanning, (ii) project planning and implementation, (iII) materialsmanagement, (iv) distribution system planning, (v) electronic dataprocessing and (vi) manpower developmont. Findings and recommendations ofan institutional development study completed under Loan 2312-TH wereimplemented with good results, with one noteworthy example being PEA'scorporate planning system, which has developed into an effective Pool forarticulating corporate responsibilities and objectives and managingcorporate activities.
Bank strategy in the Secto,
1.25 The Bank has been .lve'y involved with assisting EGAT and thegovernment in planning a-- ?ilmenting a large generation expansionprogram. Its involvemenc -. t. . lanning and implementation of a rapidlygrowing power distribution prc;rea is a logical step. Although Governmenthas the ability to finance PLE's investment from soft funding sources suchas the OECF, it prefers to maint&in a relationship with the Bank in orderto benefit from Bank technical assistance. Through its involvement in thepast with the financing of PEA's rural electrification, the Bank hasassisted in the formulation of sound planning and investment decisions in arapidly changing environment, and it has contributed to the institutionalstrengthening of PEA. The proposed loan would continue this involvement,and is particularly timely with PEA's planned introduction of 115 kV systemvoltage. Through the proposed loan, the Bank would continue its ongoingwork to ensure that optimal investment programs are evolved. It would alsoensure that through adherence with agreed financial covenants, PEA isfinancially able to undertake and operate future system expansionseffectively.
II. THE B
2.1 The Borrower of the proposed loan would be the ProvincialElectricity Authority (PEA), which was established in September 1960 underthe Provincial Electricity Act (BE2503) as a state enterprise reporting tothe Ministry of Interior. PEA is responsible for the distribution ofelectricity throughout the country except in the metropolitan Bangkok area,which is served by MEA. At the end of FY89, PEA had 1340 offices groupedinto 12 regional areas. In FY89, over 99X of PEA's energy requirement waspurchased from EGAT, with the remainder purchased from NEA and generatedfrom diesel plants.
2.2 With the growth in Thailand over the last 10-15 years, PEA hasexpanded and changed as an institution. In 1980, PEA had less than one-third of its current consumers and sold less than one-third of the gigawatthours. It was about half its current size in terms of employees and wasorganized under a different organizational structure. Recent organiza-tional changes have prepared PEA for the significant further expansionanticipated over the next 5-10 years. A fine-tuning of theseorganizational changes is planned under the proposed project.

A. Organization and Management
2.3 PEA's Board of Directors is appointed by the Council of Ministersand consists of a Chairman (currently from the Department of LocalAdministration of the Ministry of Interior) and nine other members whoinclude both senior officials of the government agencies and departmentsconcerned with power distribution, and representatives from the privatesector. The Governor of PEA is an ex-officio member of the Board as wellas the authority's chief executive officer.
2.4 PEA's operations are divided into five functional areas, eachheaded by a Deputy Governor: Corporate Services, Economics and Finance,Operations, Technique, and Planning and Development. In addition, there isa small staff of senior officials who act as assistants to the Governor,and an Auditing Office which reports directly to the Governor (see Chart1). PEA's organizational structure is sound and appropriate to itsoperational needs.
2.5 In the mid-1980s, PEA adopted corporate strategic planning as amanagement tool to enhance performance in the management and administrationof its corporate activities and in the carrying out its electrificationmandate. This development, along with a simultaneous reorganization intoits current structure (para. 2.4) was important in preparing PEA to dealeffectively with the transition from an essentially construction-orientedorganization to a service-oriented organization. The PEA corporatestrategic plans outline specific goals for the functional areas and reflectPEA's long-term goals and strategies in the framework of governmentpolicies and priorities and sectoral objectives. Some notable resultswhich have been achieved under the strategic planning approach include:(a) improved billing and collection procedures, which have reduced PEA'saccounts receivable to 34 days of sales (para. 2.13); (b) an improvedtraining program, which now provides the skills and expertise needed forPEA's operations (para. 2.8); (c) the implementation of materials handlingand inventory control systems, which have alleviated shortages whichpreviously caused construction delays; and (d) the introduction ofinformation and electronic data processing systems which have producedtangible beneftts through increased productivity and improved budget andcost control.
2.6 Under Japan Grant Facility financing administered by the Bank,funding has been provided to PEA and consultants have been appointed toassist PEA in detailed project design (para.3.5). As part of their scope,the consultants would also provide training and assistance in managementand organizational structure as follows: (a) to train PEA staff in 115 kVsystem design, operation and maintenance, and in 115 kV system analysis,database design and database administration; (b) to optimize the use ofthe Distribution System Management program and set up a master plan fordevelopment of Transmission and Distribution System Management in 12regional offices; and (c) to assist PEA executives in strengthening PEA'sorganization structure specifically to meet the challenges of the projectedrapid growth in its franchise area. Terms of reference for the consultingservice are in Annex 5. PEA would also undertake under the proposed
- 10 -
project a consulting study that would review PEA's system reliabillity andrecommend reliability targets for different parts of its system (par&. 3.5and Annex 6).
B. Staffing and Training
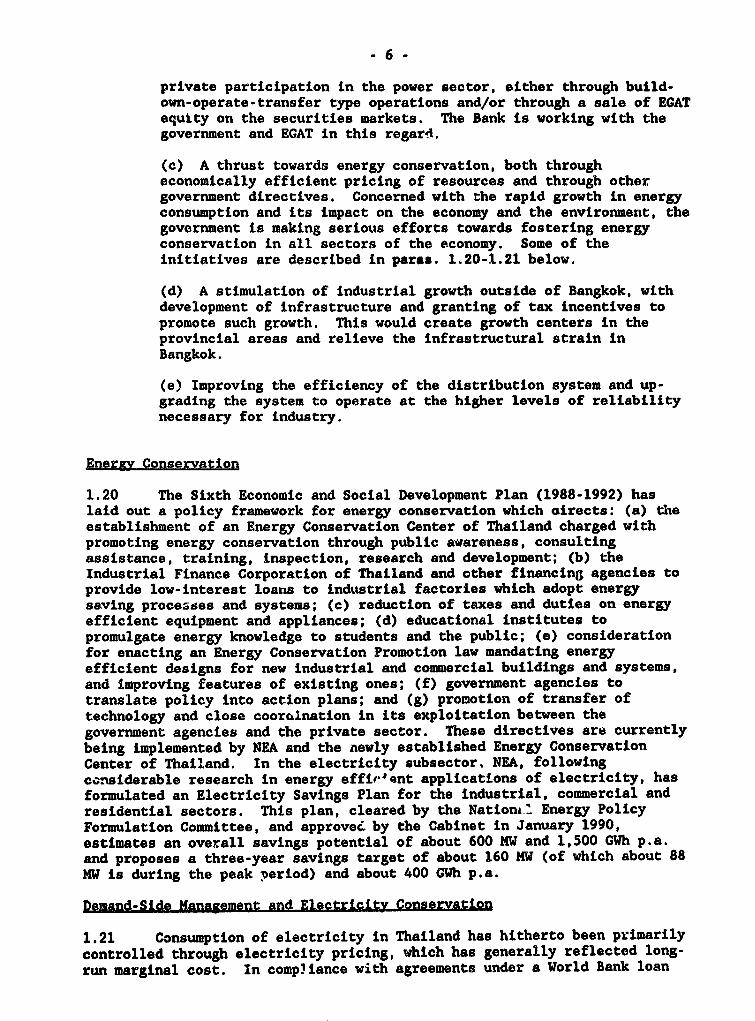
2.7 PEA's management and staff are competent and well qualified. Asof year-end FY89, about 70X of PEA's total staff of 26,116 people hadreceived some form of higher education. The number of university graduatesas a percentage of total staff had increased substantially between FY84 andFY89, rising from 6X to 91. Over the same period, due in large part to therapid growth of PEA in terms of number of customers and electricity sales,the number of consumers per employee consistently increased from 169 inFY84 to 232 in FY89; annual energy sales per employee increased from 348MWh to 567 MWh. With the projected substantial increase in PEA's salesover the near-term, the ratio of sales to staff is expected to continue toincrease over the next five years. Table 2.1 shows the growth of staff andthe breakdown by academic qualifications during FY84-89.
Table 2.:; PEA's STAFFInG EVOLUTION
Increase2984-89
TY84 FY85 FY86 FY87 FY88 FY89 Z p.&.
University graduates 1,350 1,490 1,628 1,827 2,049 2,312 10.6
Technical diploma 3,290 3,569 3,800 4.094 4,314 4,732 7.9Vocational certificate 8,789 9,427 9,912 10,331 10,667 11,099 6.2
Others 7,953 8,098 8,162 8,145 7,987 7,973 0.9
Total 21.382 UIft 23_502 a2_a97 25.017 26.116 id
Custo.mers per eamlovee 169 lE 193 ifnA fam au ttLslap per aMImoveeAS 379 in L au 9.
Source: PEA
2.8 Training falls under the overall responsibility of PEA'sPersonnel Department. PEA has a single training center for technical andmanagerial training; it is located in Central Thailand in NakornchaisriProvince and is attended by approximately 2000 PEA staff members per year.In addition to managerial training, the center provides technical trainingin: (a) the operation and maintenance of the power system; (b) theoperation of substations; (c) the operation of voltage regulators; and (d)the uses and maintenance of equipment and tools. Training within thetraining center is provided completely by in-house staff through regularcourses and special seminars. In addition to the short-term courses heldat the training center, PEA offers a three-year program at its VocationalSchool, where about 38 people per year are trained to work on live
. 11 -
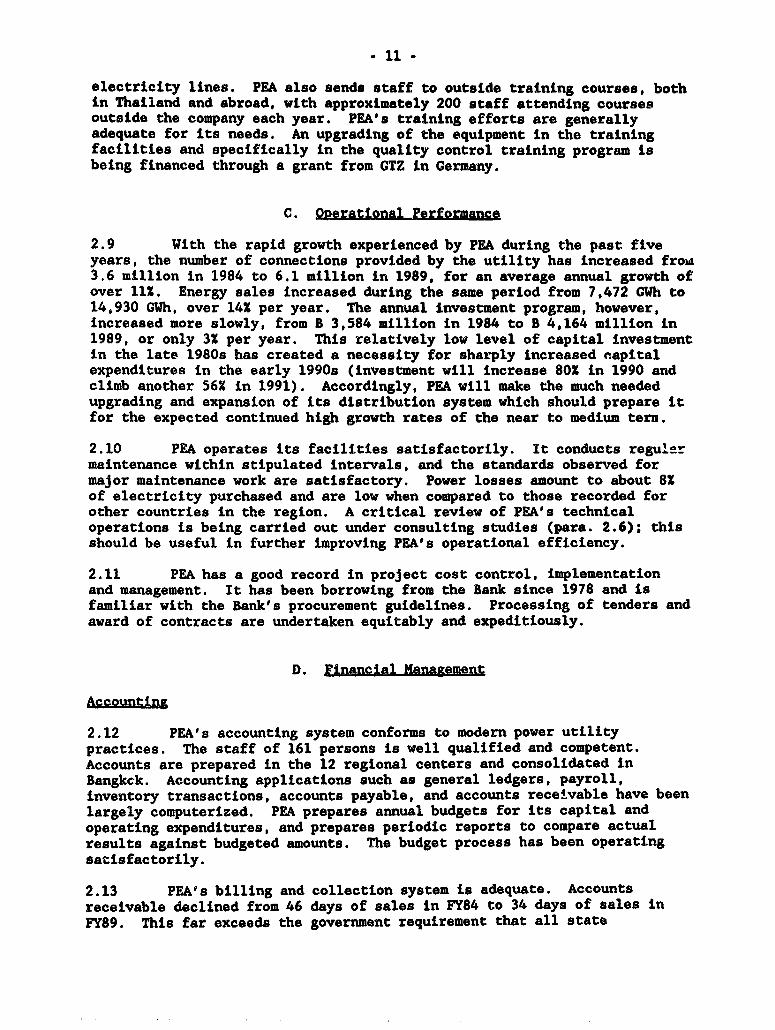
electricity lines. PEA also sends staff to outside training courses, both
in Thailand and abroad, with approximately 200 staff attending coursesoutside the company each year. PEA's training efforts are generallyadequate for its needs. An upgrading of the equipment in the training
facilities and specifically in the quality control training program is
being financed through a grant from GTZ in Germany.
C. Ogerational Performance
2.9 With the rapid growth experienced by PEA during the past five
years, the number of connections provided by the utility has increased froi
3.6 million in 1984 to 6.1 million in 1989, for an average annual growth of
over 111. Energy sales increased during the same period from 7,472 GWh to
14,930 GWh, over 14X per year. The annual investment program, however,
increased more slowly, from B 3,584 million in 1984 to B 4,164 million in
1989, or only 3X per year. This relatively low level of capital investment
in the late 1980s has created a necessity for sharply increased capitalexpenditures in the early 1990s (investment will increase 80X in 1990 and
climb another 56X in 1991). Accordingly, PEA will make the much needed
upgrading and expansion of its distribution system which should prepare it
for the expected continued high growth rates of the near to medium term.
2.10 PEA operates its facilities satisfactorily. It conducts regular
maintenance within stipulated intervals, and the standards observed for
major maintenance work are satisfactory. Power losses amount to about 8X
of electricity purchased and are low when compared to those recorded for
other countries in the region. A critical review of PEA's technicaloperations is being carried out under consulting studies (para. 2.6); thisshould be useful in further improving PEA's operational efficiency.
2.11 PEA has a good record in project cost control, implementationand management. It has been borrowing from the Bank since 1978 and isfamiliar with the Bank's procurement guidelines. Processing of tenders and
award of contracts are undertaken equitably and expeditiously.
D. Financial Management
Accounting
2.12 PEA's accounting system conforms to modern power utilitypractices. The staff of 161 persons is well qualified and competent.Accounts are prepared in the 12 regional centers and consolidated inBangkck. Accounting applications such as general ledgers, payroll,inventory transactions, accounts payable, and accounts receivable have been
largely computerized. PEA prepares annual budgets for its capital andoperating expenditures, and prepares periodic reports to compare actualresults against budgeted amounts. The budget process has been operating
satisfactorily.
2.13 PEA's billing and collection system is adequate. Accountsreceivable declined from 46 days of sales in FY84 to 34 days of sales in
FY89. This far exceeds the government requirement that all state

- 12
enterprises collect receivables within 60 days. PEA accomplishes such anlmpresslve receivableo collection rate by allowing rosidential customersonly 7 days to pay their bill, after which the power supply is interrupted;industrlal and commercial customers are given 15 days to pay, after whichlnterest is charged at the rate of 15 p.a. for the next 7 days, andelectricity cut off thereafter.
AudLt
2.14 PEA has an internal Auditing Office with a staff of 157 people,which reports directly to the Governor. The Auditing Office reviews theaccounts of each reglonal office and of the head office each month,focusing largely on asset management, acccunting for mater' 1s and cash.PEA operating divisions also are audited to ensure that thay follow PEAguidelines.
2.15 PEA's external audit is performed by the Office of the AuditorGeneral, the government organization responsible for auditing all stateenterprises. As provided under previous Bank loans, agreement was reachedduring negotiations that PEA would submit to the Bank audited annualfinanclal statements within six months of the close of each fiscal year.
Insurnce
2.16 PEA carries adequate Lnsurance protection against fire forbuildings and their contents. No third party lLability insurance iscarried. This is the general practice in most public enterprises inThailand and given the characteristics of the risk for PEA it isacceptable. Insurance policies are reviewed and updated once a year.During negotiations, agreement was reached that PEA would continue to makeprovisions satisfactory to the Bank to provide insurance against such risksand in amounts consistent with appropriate practice.
Taxes
2.17 PEA remits a portion of its net income to the government asdetermined by the Ministry of FLnance on a periodic basis. It has inrecent years been remitting taxes each year at a level of 151 of netincome, and this level is expected to continue, subject to PEA's attaininga self-financing ratio of at least 25X (parsa. 4.4).
2.18 Customs duties and business taxes on imported equipment andmaterials for PEA's projects average 52X of the cost of imported materialand equipment. They are met from PEA's own resou._ces.

- 13 -
III. THEl PROJECT
A. Project Bagkground
3.1 Industrial development in Thailand has in the past been centeredin the Bangkok metropolitan area. Recognizing the infrastructurallimitations of Bangkok to support industrial growth indefinitely, thegovernment has established a policy to balance economic growth in the urbanand non-urban areas. As part of this policy, the government has designatedtax benefits for industrial and commercial developments outside Bangkok,with the benefits related directly to the distance from Bangkok as well asto the amount of product exported. The incentives have helped to create a"U-shaped" land area around Bangkok which offers highly desirableopportunities for industrial development. This area of about 33,000 sq.km, encompassing 18 provinces, is projected to register an average growthin demand for electricity of about 141 per annum for the next seven years.In order to determine the optimal distribution system to supply this U-shaped area, PEA commissioned a consulting study in 1988, which inter aliahad the objective of reviewing PEA's current practice of distributing powerat intermediate voltages (predominantly 22 and 33 kV) from EGAT's highvoltage bulk supply points. The study recommended that PEA in this areashould take over from EGAT the distribution of power at 115 kV andconstruct its own 115 kV lines and 115/22 kV substations. Besides beingthe least-cost solution, this proposal would allow PEA greater flexibilityin planning and implementation and at the same time let EGAT concentrate onits assigned role of long-distance bulk power transmittor. Thisrecommendation was accepted by EGAT and was subsequently approved by thegovernment, and forms the basis for the proposed project.
B. Project Objectives and Description
3.2 The main objectives of the proposed project are: (a) to helpmeet the growth in power demand in one of the most rapidly industrializingareas of Thailand at optimal reliability and cost; (b) to improve PEA'stechnical and management capabilities to face the challenges of rapidgrowth in its franchise area; and (c) to ensure through the monitoring ofappropriate financial covenants that PEA's financial strength remainsadequate to support its growth.
3.3 The project would, over four years, provide for:
(a) construction of about 18 new 115/22 kV transformer and switchingsubstations with a total capacity of about 900 MVA (of these,about 8 substations would be financed by the Bank and the restby OECF);
(b) construction of about 19, 115 kV transmission line circuitstotalling a length of about 500 km (of these, about 8transmission circuits totalling about 260 km would be financedby the Bank and the rest by OECF);
- 14 -
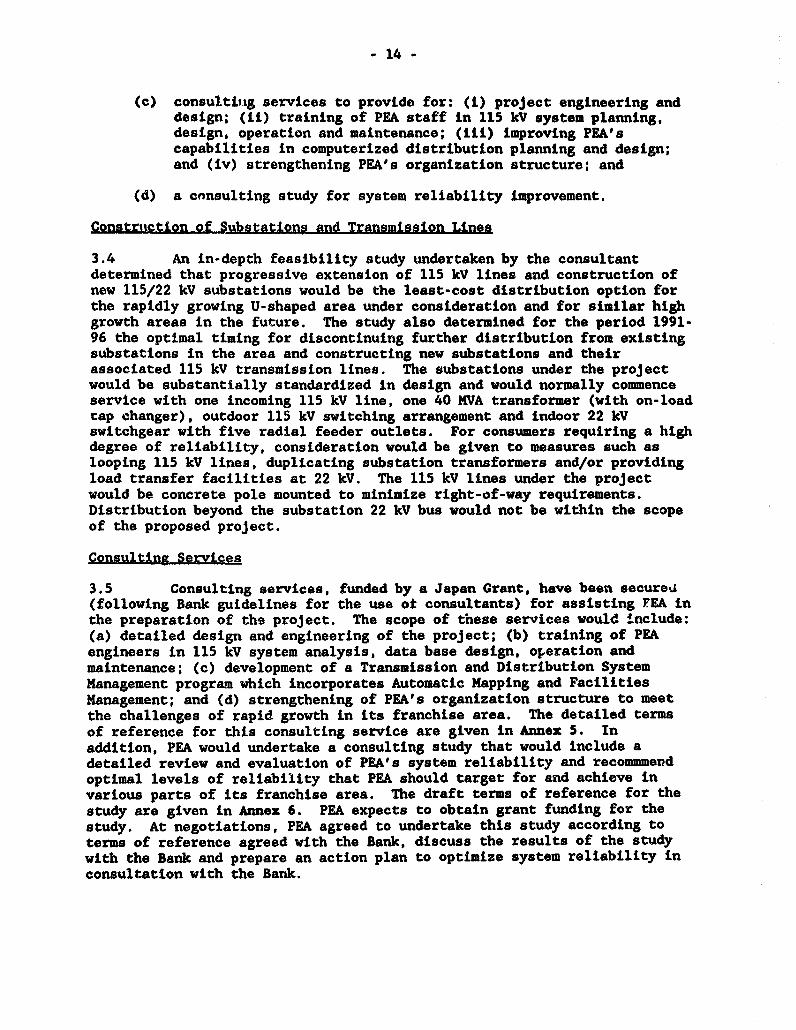
(c) consulting services to provide for: (i) project engineering anddesign; (ii) training of PEA staff in 115 kV system planning,design, operation and maintenance; (iii) improving PEA'scapabilities in computerized distribution planning and design;and (iv) strengthening PEA's organization structure; and
(d) a consulting study for system reliability improvement.
Constnrution of Substationg and Transmission Lines
3.4 An in-depth feasibility study undertaken by the consultantdetermined that progressive extension of 115 kV lines and construction ofnew 115/22 kV substations would be the least-cost distribution option forthe rapidly growing U-shaped area under consideration and for similar highgrowth areas in the future. The study also determined for the period 1991-96 the optimal timing for discontinuing further distribution from existingsubstations in the area and constructing new substations and theirassociated 115 kV transmission lines. The substations under the projectwould be substantially standardized in design and would normally commenceservice with one incoming 115 kV line, one 40 MVA transformer (with on-loadcap changer), outdoor 115 kV switching arrangement and indoor 22 kVswitchgear with five radial feeder outlets. For consumers requiring a highdegree of reliability, consideration would be given to measures such aslooping 115 kV lines, duplicating substation transformers and/or providingload transfer facilities at 22 kV. The 115 kV lines under the projectwould be concrete pole mounted to minimize right-of-way requirements.Distribution beyond the substation 22 kV bus would not be within the scopeof the proposed project.
Consulting Services
3.5 Consulting services, funded by a Japan Grant, have been secured(following Bank guidelines for the use ot consultants) for assisting FEA inthe preparation of the project. The scope of t'nese services would include:(a) detailed design and engineering of the project; (b) training of PEAengineers in 115 kV system analysis, data base design, operation andmaintenance; (c) development of a Transmission and Distribution SystemManagement program which incorporates Automatic Mapping and FacilitiesManagement; and (d) strengthening of PEA's organization structure to meetthe challenges of rapid growth in its franchise area. The detailed termsof reference for this consulting service are given in Annex 5. Inaddition, PEA would undertake a consulting study that would include adetailed review and evaluation of PEA's system reliability and recommmendoptimal levels of reliability that PEA should target for and achieve invarious parts of its franchise area. The draft terms of reference for thestudy are given in Annex 6. PEA expects to obtain grant funding for thestudy. At negotiations, PEA agreed to undertake this study according toterms of reference agreed with the Bank, discuss the results of the studywith the Bank and prepare an action plan to optimize system reliability inconsultation with the Bank.
- 15 -
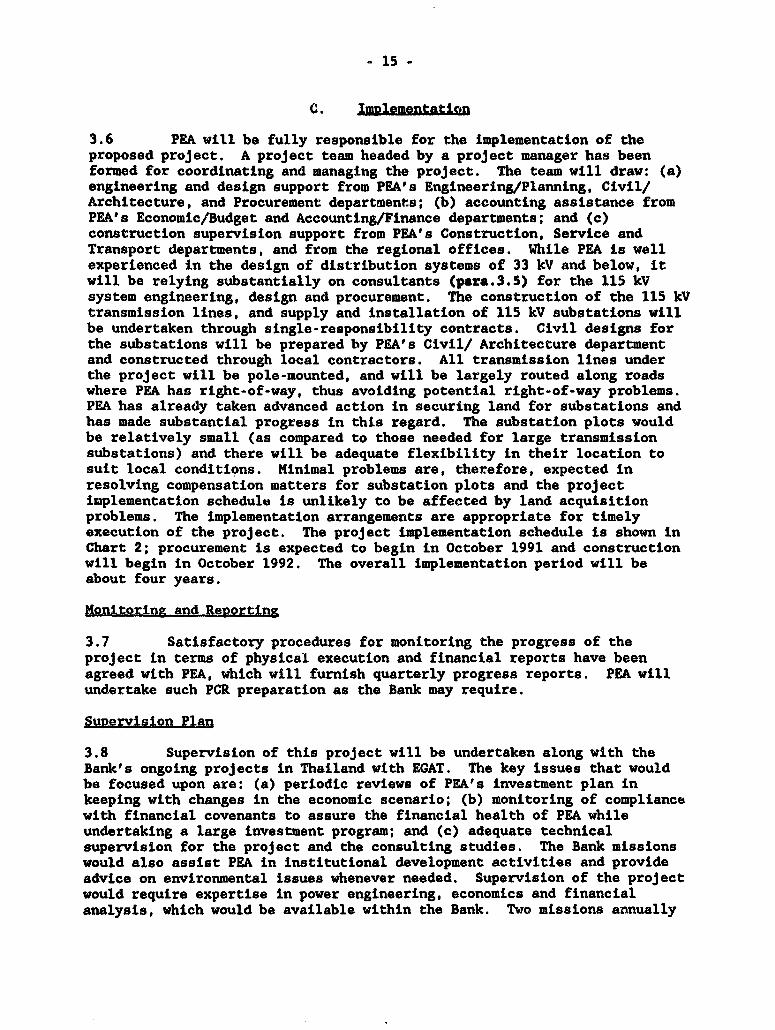
C. Implementation
3.6 PEA will be fully responsible for the implementation of theproposed project. A project team headed by a project manager has beenformed for coordinating and managing the project. The team will draw: (a)engineering and design support from PEA's Engineering/Planning, Civil/Architecture, and Procurement departments; (b) accounting assistance fromPEA's Economic/Budget and Accounting/Finance departments; and (c)construction supervision support from PEA's Construction, Service andTransport departments, and from the regional offices. While PEA is wellexperienced in the design of distribution systems of 33 kV and below, itwill be relying substantially on consultants (para.3.5) for the 115 kVsystem engineering, design and procurement. The construction of the 115 kVtransmission lines, and supply and installation of 115 kV substations willbe undertaken through single-responsibility contracts. Civil designs forthe substations will be prepared by PEA's Civil/ Architecture departmentand constructed through local contractors. All transmission lines underthe project will be pole-mounted, and will be largely routed along roadswhere PEA has right-of-way, thus avoiding potential right-of-way problems.PEA has already taken advanced action in securing land for substations andhas made substantial progress in this regard. The substation plots wouldbe relatively small (as compared to those needed for large transmissionsubstations) and there will be adequate flexibility in their location tosuit local conditions. Minimal problems are, therefore, expected inresolving compensation matters for substation plots and the projectimplementation schedule is unlikely to be affected by land acquisitionproblems. The implementation arrangements are appropriate for timelyexecution of the project. The project implementation schedule is shown inChart 2; procurement is expected to begin in October 1991 and constructionwill begin in October 1992. The overall implementation period will beabout four years.
Monitoring and Reporting
3.7 Satisfactory procedures for monitoring the progress of theproject in terms of physical execution and financial reports have beenagreed with PEA, which will furnish quarterly progress reports. PEA willundertake such PCR preparation as the Bank may require.
Suneision Plan
3.8 Supervision of this project will be undertaken along with theBank's ongoing projects in Thailand with EGAT. The key issues that wouldbe focused upon are: (a) periodic reviews of PEA's investment plan inkeeping with changes in the economic scenario; (b) monitoring of compliancewith financial covenants to assure the financial health of PEA whileundertaking a large investment program; and (c) adequate technicalsupervision for the project and the consulting studies. The Bank missionswould also assist PEA in institutional development activities and provideadvice on environmental issues whenever needed. Supervision of the projectwould require expertise in power engineering, economics and financialanalysis, which would be available within the Bank. Two missions annually

- 16 -
for a period of four years are foreseen for adequate supervision of thisproject. The estimated staff inputs for supervision over the duration ofthe project are 20 staff-weeks (on the basis of sharing with EGAT projectsin Thailand).
D. LLomn
3.9 The project is not expected to have any substantial adverseimpacts on the environment. Using 115 kV transmission lines in place of ahost of lower voltage lines would reduce congestion in the llne routes.Further, since the 115 kV lines would be pole mounted, the right-of-wayrequirements would be lower; since these lines would be routed along roads,encroachment on human habitats and ecologically valuable land would be muchless compared with 115 kV cross-country tower lines. Routes of linessubject to significant environmental impacts, if any, would be reviewed byBank missions and the lines would be re-routed and/or compensation paid asappropriate. The distribu'ion substations developed under the project(with indoor intermediate voltage uwitchgear) would have smaller plotrequirements than normally attributed to main transmission substations.The siting of the substations would be fairly flexible and emphasis wouldbe placed on aesthetic aspects in their siting and design. Line andsubstation designs would follow internationally accepted safety practiceswhich have a proven record in the Thai environment. Currently noresettlement of people is foreseen, but in the event of any resettlement,adequate compensation would be paid for land and resettlement would beaccomplished according to the Bank's requirements. At negotiations, PEAagreed to comply with the Bank's environmental and resettlementrequirements as appropriate for the project.
E. Cost Estimates
3.10 The total financing required by PEA for the proposed project(including capitalized interest during construction) is estimated at aboutUS$200 million, with a foreign exchange component of US$102.4 million.Details of the cost estimate are presented in AMnez 7. Costs are based onMarch, 1991 price levels. Physical contingencies have been assumed atabout 10 of the base cost. Price contingencies are estimated on the basisof escalation factors of 5.0X for the local cost components and 3.61 forthe foreign cost components following Bank guidelines. Table 3.1summarizes the cost estimates for the proposed project.

- 17 -
Table 3.1: SUMMARY OF COSTS /A
Baht Million Zb USS Million Fx X
Local Foreign Total Local Foreign Total TotalCost
IBRD-Financed Component
Substations 234 392 626 9.35 15.70 25.05 63
Transmission 415 417 832 16.60 16.70 33.30 50
Lines
Consultancy 3 23/1 26 0.10 O.90go 1.00 90
Duties and 146 0 146 5.85 0.00 5.85 0
Taxes
Base CoSt£2 1.63 1A ?98 32 13.30 65.20 51
OECF - Financed Comoonent
Substations & 825 1,050 1,875 33.00 42.00 75.00 56
Transm.Lines
Duties and 238 0 238 9.50 0.00 9.50 0
Taxes
Base- cost 1_063 1.050 2.113 42.50 42.00 84.50 IQ
Total Base 1.86 1.U82 .3.743 74.40 75.30 149.70 5)
Contineencies
Physical 185 186 371 7.4C 7.85 15.25 50
Price 232 254 486 9.30 9.75 19.05 52
Total Cost 2,278 2322 4 !600 91.10 92.90 184.00
Int. during 162 238 400 6.50 9.50 16.00 59
constr.
Total2.0 4 2560 5*000 97L60 12,.40 200.00 aFinanc$ng,ReauirKed
/A March 1991 price levels./k Exchange rate US $1 - B 25.0/ Not funded by the IBRD loan but by the Japan Grant Facility.
- 18 -
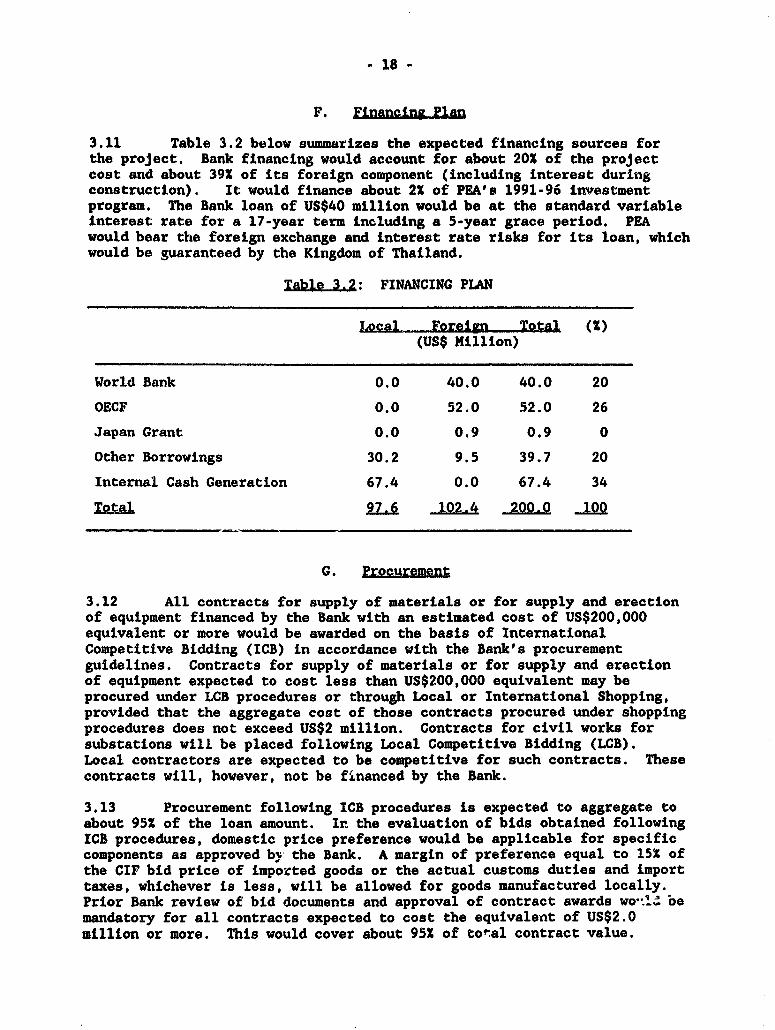
F. Einancing Pla1
3.11 Table 3.2 below summArizes the expected financing sources forthe project. Bank financing would account for about 20X of the projectcost and about 391 of its foreign component (including interest duringconstruction). It would finance about 22 of PEA's 1991-96 investmentprogram. The Bank loan of US$40 million would be at the standard variableinterest rate for a 17-year term including a 5-year grace period. PEAwould bear the foreign exchange and interest rate risks for its loan, whichwould be guaranteed by the Kingdom of Thailand.
Iakal 3.2: FINANCING PLAN
Local Foreign Total (M)(US$ Million)
World Bank 0.0 40.0 40.0 20
OECF 0.0 52.0 52.0 26
Japan Grant 0.0 0.9 0.9 0
Other Borrowings 30.2 9.5 39.7 20
Internal Cash Generation 67.4 0.0 67.4 34
T29-l 927. 102.4 200.0 100
G. Procurement
3.12 All contracts for supply of materials or for supply and erectionof equipment financed by the Bank with an estimated cost of US$200,000equivalent or more would be awarded on the basis of InternationalCompetitive Bidding (ICB) in accordance with the Bank's procurementguidelines. Contracts for supply of materials or for supply and erectionof equipment expected to cost less than US$200,000 equivalent may beprocured under LCB procedures or through Local or International Shopping,provided that the aggregate cost of those contracts procured under shoppingprocedures does not exceed US$2 million. Contracts for civil works forsubstations will be placed following Local Competitive Bidding (LCB).Local contractors are expected to be competitive for such contracts. Thesecontracts will, however, not be financed by the Bank.
3.13 Procurement following ICB procedures is expected to aggregate toabout 952 of the loan amount. Irn the evaluation of bids obtained followingICB procedures, domestic price preference would be applicable for specificcomponents as approved by the Bank. A margin of preference equal to 151 ofthe CIF bid price of imported goods or the actual customs duties and importtaxes, whichever is less, will be allowed for goods manufactured locally.Prior Bank review of bid documents and approval of contract awards wo '' oemandatory for all contracts expected to cost the equivalent of US$2.0million or more. This would cover about 95X of total contract value.
v 19 -
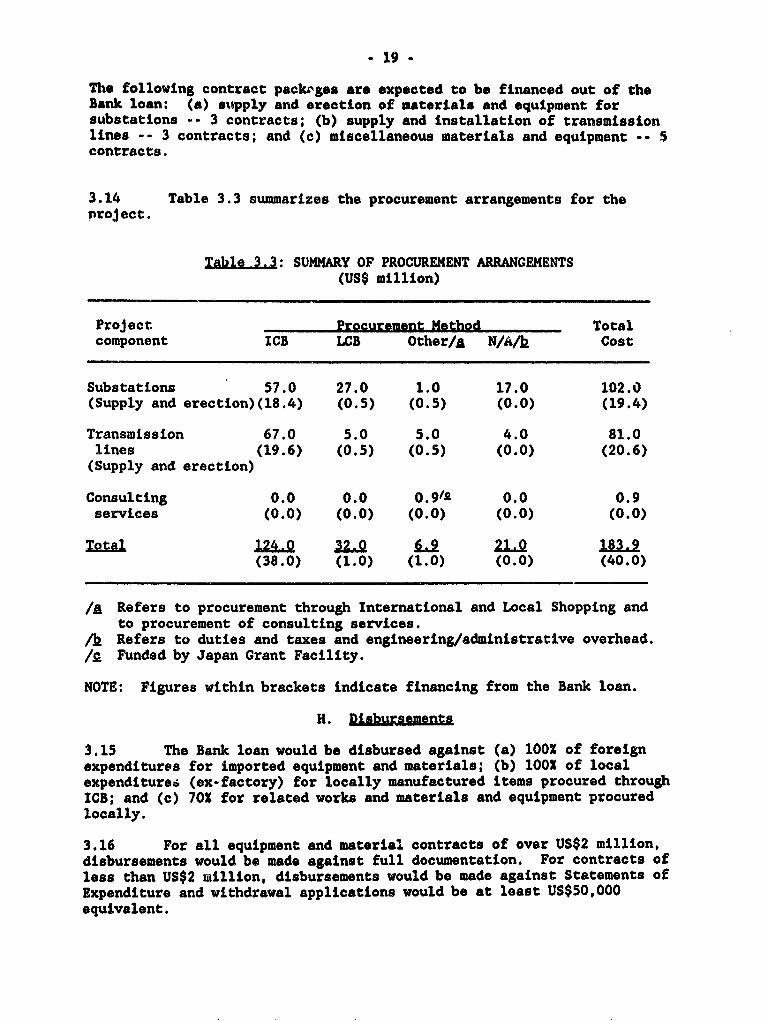
The following contract packrges are expected to be financed out of theBank loan: (a) supply and erection of materials and equipment forsubstations -- 3 contracts; (b) supply and Installation of transmissionlines -- 3 contracts; and (c) miscellaneous materials and equipment -- Scontracts.
3.14 Table 3.3 summarizes the procurement arrangements for theproject.
T&bl 3.L3: SUMMARY OF PROCUREMENT ARRANGEMENTS(US$ million)
Project Procurement Method Totalcomponent ICB LCB Other/A N/A/k Cost
Substations 57.0 27.0 1.0 17.0 102.0(Supply and erection)(18.4) (0.5) (0.5) (0.0) (19.4)
Transmission 67.0 5.0 5.0 4.0 81.0lines (19.6) (0.5) (0.5) (0.0) (20.6)(Supply and erection)
Consulting 0.0 0.0 0. 9/ 0.0 0.9services (0.0) (0.0) (0.0) (0.0) (0.0)
TQtal 124.0 6.9 210 1839(38.0) (1.0) (1.0) (0.0) (40.0)
/A Refers to procurement through International and Local Shopping andto procurement of consulting services.
/h Refers to duties and taxes and engineering/administrative overhead./£ Funded by Japan Grant Facility.
NOTE: Figures within brackets indicate financing from the Bank loan.
H. Disbugteme
3.15 The Bank loan would be disbursed against (a) 100l of foreignexpenditures for imported equipment and materials; (b) 100l of localexpenditurea (ex-factory) for locally manufactured items procured throughICB; and (c) 70X for related works and materials and equipment procuredlocally.
3.16 For all equipment and material contracts of over US$2 million,disbursements would be made against full documentation. For contracts ofless than US$2 million, disbursements would be made against Statements ofExpenditure and withdrawal applications would be at least US$50,000equivalent.
- 20 -
3.17 Annex 8 gives the disbursement schedule for the proposed Bankloan and the standard profile of disbursements for power projects in Asia.Considering the advanced stage of preparation by PEA with consultantsalready in place and PEA's performance on the last Bank project (Loan 2312-TH) the proposed loan is expected to be disbursed faster than indicated bythe standard profile. The project is expected to be completed by March 31,1995 and the closing da-a for the loan would be March 31, 1996.
IV. FINANCIAL ANALYSIS
A. PaIt Pelfomance
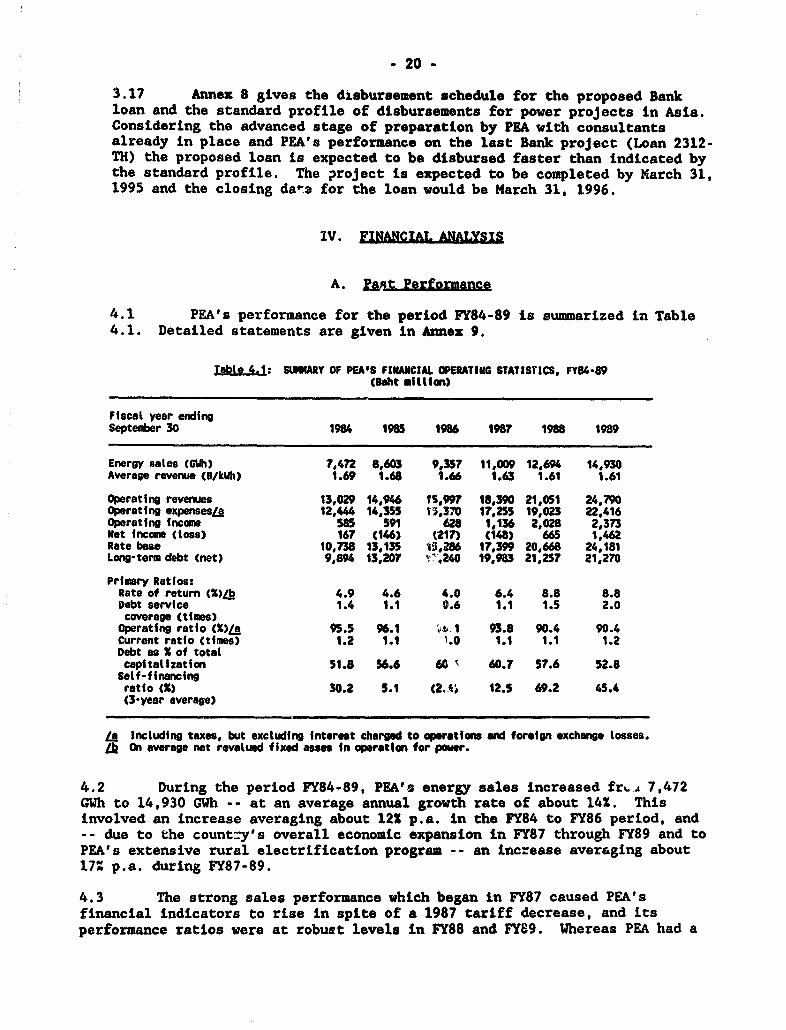
4.1 PEA's performance for the period FY84-89 is summarized in Table4.1. Detailed statements are given in Annex 9.
Table 4.1: SUISARY OF PEA'S FINMACIAL OPERATING STATISTICS, FY84-89CBaht million)
Fiscal year endingSeptember 30 1984 1985 1986 1987 1988 1989
Energy sales CGUh) 7,472 8,603 9,357 11,009 12,694 14,930Average revenue (B/kWh) 1.69 1.68 1.66 1.63 1.61 1.61
Operating revemses 13,029 14,946 I5.997 18,390 21,051 24,790Operating expensesL 12,444 14,355 15,370 17,255 19,023 22.416Operating income 585 591 628 1,136 2,028 2,373Met income (loss) 167 (146) (217) (148) 665 1,462Rate base 10,738 13,135 t5,286 17,399 20,6S8 24,181Long-term debt (net) 9.894 13,207 '7 4240 19,983 21,257 21,270
Primary RatIos:Rate of return (X)Lb 4.9 4.6 4.0 6.4 8.8 8.8Debt service 1.4 1.1 0.6 1.1 1.5 2.0coverage (times)
Operating ratio (%)LA 95.5 96.1 ;. 1 93.8 90.4 90.4Current ratIo (times) 1.2 1.1 1.0 1.1 1.1 1.2Debt as X of totalcapitatization 51.8 56.6 60 60.7 57.6 52.8
Self-financingratio (X) 30.2 5.1 (2.,% 12.5 69.2 45.4(3-year average)
L& Including taxes, but exetuding interest charged to operations wnd foreign exchange tosses.b On average net revalued fixed ase In operation for poe r.
4.2 During the period FY84-89, PEA's energy sales increased frs, 7,472CWh to 14,930 GWh -- at an average annual growth rate of about 14X. Thisinvolved an increase averaging about 12X p.a. in the FY84 to FY86 period, and-- due to the country's overall economic expansion in FY87 through FY89 and toPEA's extensive rural electrification program -- an increase averaging about17% p.a. during FY87-89.
4.3 The strong sales performance which began in FY87 caused PEA'sfinancial indicators to rise in spite of a 1987 tariff decrease, and itsperformance ratios were at robust levels in FY88 and FY89. Whereas PEA had a

* 21 -
net loss in he FY85-87 period, the sizeable sales volume increase of FY87-89enabled it to earn a positive net income in FY88, which then more than doubledin FY89. The rate of return (ROR) on net revalued assets in operation, whichhad averaged 52 in FY84-87, was 92 in FY88 and FY89. Due in part toproportionally low capital investment during the late 1980s when PEA's annualinvestment program increased at only 3X per year (from B 3,584 million ln FY84to B 4,164 million in FY89 (pars. 2.9), the self-financLng ratio, whlch hadranged from -3X to 30X durlng the FY84-87 period, rose to 692 in FY88 and was452 in FY89.
4.4 PEA ls obligated to pay to the Ministry of Flnance a portion of ltsnet income at a level determined at each year's end by the Ministry accordingto the needs of the National Treasury. The remittance level has been 15Xsince 1987 and is expected to continue at that rate. For any year in whichPEA's self-flnancing ratio (SFR) falls below 252, the government wlll, amongother measures, reassess PEA's financial obligations to the State (para.2.17).
4.5 Although PEA's capital structure remained generally satisfactory inthe period, the debt to total capitalization ratio rose slightly above thetargeted 602 ceiling in FY86 and FY87, when it was 60.42 and 60.72,respectively. Debt service coverage ranged between 1.1 and 2.0 times betweenFY84 and FY89, except in FY86 when it fell to 0.6 times. The amount of PEA'sdebt was expanded substantially by the appreciation of the Japanese yen andthe German mark, the currencies in which a significant portion of PEA's debtis denominated. The long-term foreign currency debt is translated into Bahtat the exchange rate effective on September 30 of the year for which thefinancial statements are prepared, and the loss is spread over the remainingterms of the loans. The policy is appropriate since spreading the foreignexchange losses is a far better alternative than affecting the net profit ofone single year by the entire amount of the loss. The deferred exchangeadjustment account enables PEA to reflect the loss in a timely manner and atthe same time smooth out the effect of the exchange rate swings on the netincome of any given year. Even with the substantial increase in PEA's debtcaused by the inclusion of the foreign exchange adjustment component, the debtto total capitalization ratio was only 482 in FY90, well under the 60% ratioagreed with the Bank under previous loans.
4.6 PEA's financial position as of FY90 is healthy, with a self-financing ratio of 552, an ROR of 8.52, and a debt service coverage of 2.3times. Substantial sales increases over the last four years -- including 212in FY90 -- contributed to these robust financial ratios. Operating incomeincreased by 92 over FY89's level; net income went up by 302.
B. Financial Outlook
4.7 PEA's healthy financial performance is projected to continuethroughout the 1990s. The challenge for PEA in the near term will be tofinance the expansion in its capital investment, which is expected toincrease 562 in 1991 (para 2.9). Its current financial strength should allowit to do this without a tariff increase before 1993 s0 long as the EGAT tariffto PEA remains at its present level (para. 4.9).
- 22 -
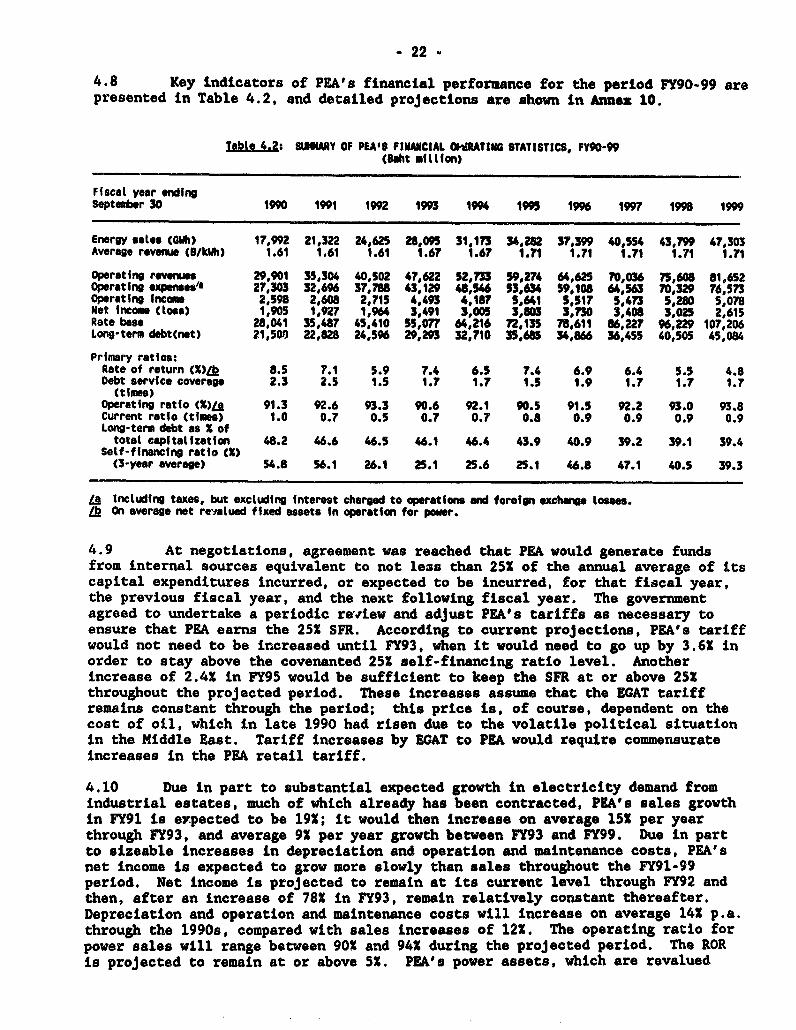
4.8 Key indicators of PEA's financial performance for the period FY90-99 arepresented in Table 4.2, and detailed projections are shown in Annex 10.
robto 4.?s UARY OF P1A4S FINUACIAL CIdRATING STATISTICS, FY90-99(aht n million)
Fiscal year endingSeptember 30 1990 1991 1992 1993 1994 199f 1996 1997 198 1999
Energy satn (CWh) 17,992 21,322 24,625 28,095 31,173 34,282 37,399 40,554 43,799 47,303Averago revenue (B/kWh) 1.61 1.61 1.61 1.67 1.67 1.71 1.71 1.71 1.71 1.71
Operating revenue 29,901 35,304 40,S02 4?,622 52,733 59,274 64,625 70,036 75,608 61,652Operating *xpenses" 27,303 32,696 37,78 43,129 48U546 53,634 59,108 64,563 70.329 76,573Operating income 2,598 2,608 2,715 4,493 4,187 5,"61 5517 5,473 5,280 5,078Net Income (toss) 1,905 1,927 1,964 3,491 3,005 3,803 3,730 3,408 3,025 2,615Rate base 28,041 35,487 45,410 55,077 64,216 72,135 78,611 86,227 96,229 107,206Long-term debt(net) 21,500) 22,828 24,596 29,293 32,710 35,685 34,866 36,455 40,505 45,084
Primary ratios:Rate of return CZ)1k 8.5 7.1 5.9 7.4 6.5 7.4 6.9 6.4 5.5 4.8Debt service coverage 2.3 2.5 1.5 1.7 1.7 1.5 1.9 1.7 1.7 1.7(times)
operating ratio (%)L 91.3 92.6 93.3 90.6 92.1 90.S 91.5 92.2 93.0 93.8Current ratio (times) 1.0 0.7 0.5 0.7 0.? 0.8 0.9 0.9 0.9 0.9Long-term debt as X oftotal capitalization 48.2 46.6 46.5 4.1 4.4 43.9 40.9 39.2 39.1 39.4
Self-financing ratio (X)(3-year average) 54.8 56.1 26.1 25.1 25.6 25.1 46.8 47.1 40.5 39.3
LI Including taxes, but exctuding interest charged to operations and forelgn exchange losses.lb On average net revalued fixed assets In operation for power.
4.9 At negotiations, agreement was reached that PEA would generate fundsfrom internal sources equivalent to not less than 25X of the annual average of itscapital expenditures incurred, or expected to be incurred, for that fiscal year,the previous fiscal year, and the next following fiscal year. The governmentagreed to undertake a periodic rewiew and adjust PEA's tariffs as necessary toensure that PEA earns the 251 SFR. According to current projections, PEA"s tariffwould not need to be increased until FY93, when it would need to go up by 3.6Z inorder to stay above the covenanted 25X self-financing ratio level. Anotherincrease of 2.4X in FY95 would be sufficient to keep the SFR at or above 25Sthroughout the projected period. These increases assume that the EGAT tariffremains constant through the period; this price is, of course, dependent on thecost of oil, which in late 1990 had risen due to the volatile political situationin the Middle East. Tariff increases by EGAT to PEA would require commensurateincreases in the PEA retail tariff.
4.10 Due in part to substantial expected growth in electricity demand fromindustrial estates, much of which already has been contracted, PEA's sales growthin FY91 is expected to be 191; it would then increase on average 151 per yearthrough FY93, and average 91 per year growth between FY93 and FY99. Due in partto sizeable increases in depreciation and operation and maintenance costs, PEA'snet income is expected to grow more slowly than sales throughout the FY91-99period. Net income is projected to remain at its current level through FY92 andthen, after an increase of 781 ln FY93, remain relatively constant thereafter.Depreciation and operation and maintenance costs will increase on average 141 p.a.through the 1990s, compared with sales increases of 121. The operating ratio forpower sales will, range between 901 and 941 during the projected period. The RORis projected to remain at or above 51. PEA's power assets, which are revalued
- 23 -
each year according to an index published by the Ministry of Finance, willincrease at about 13X p.a. from B 41,124 million in FY90 to B 123,365 million inFY99.
4.11 PEA's debt service coverage ratio will range between 1.5 and 2.5 timesthroughout the projected period. The capital structure will remain satisfactory:the debt/total capital ratio is expected to average 43X and remain at or below481. PEA's current debt control test provides for Bank review of borrowings whenthe debt/equity ratio exceeds 60/40; agreement was reached at negotiations thatPEA would maintain a debt/equity ratio not exceeding 60/40 for thb proposed loan.In addition, PEA will be required not to contract short- and medlim-term debt(debt which matures within five years) in excess of 151 of its total debtoutstanding.
C. Tariff Levels and Structure
4.12 Appropriate tariffs which all retail customers -- whether of PEA, MEA orEGAT -- pay are determined according to the same schedule. This tariff structure,which is given in Annez 11, has remained essentially without change during thelast three years, following a small reduction in 1987. A recent study, MarginalCost of Electric Power (December 1990) done by consultants for the governmentindicates tOhat the effective tariffs per kWh are generally close to the marginalcosts of supply. However, the structure of the tariff for large consumers differsfrom the marginal cost, the demand charge being substantially lower and the energycharge substantially higher than the corresponding marginal costs. The go)vernmentintends to look into this issue during the next tariff revision. It was agreed atnegotiations that under the proposed loan, PEA would review by April 30 of everyyear the adequacy of its tariffs to produce the required self-financing ratio(para. 4.9).
4.13 Once the overall tariff schedule has been set, self-financing ratios areset for the individual utilities. Because PEA, with its extensive ruraldistribution system and low density coverage, has costs which exceed those of MEAon a per kWh basis, subsidies to PEA are built into the rates charged by EGAT tothe two utilities (EGAT's tariff to PEA in 1990 is B 1.04 and to MEA B 1.48,compared with its average tariff of B 1.26). The government reviews the relativerates periodically to ensure that they accomplish the required cross-funding amongthe utilities.
- 24 -
D. FLinMng LPflan
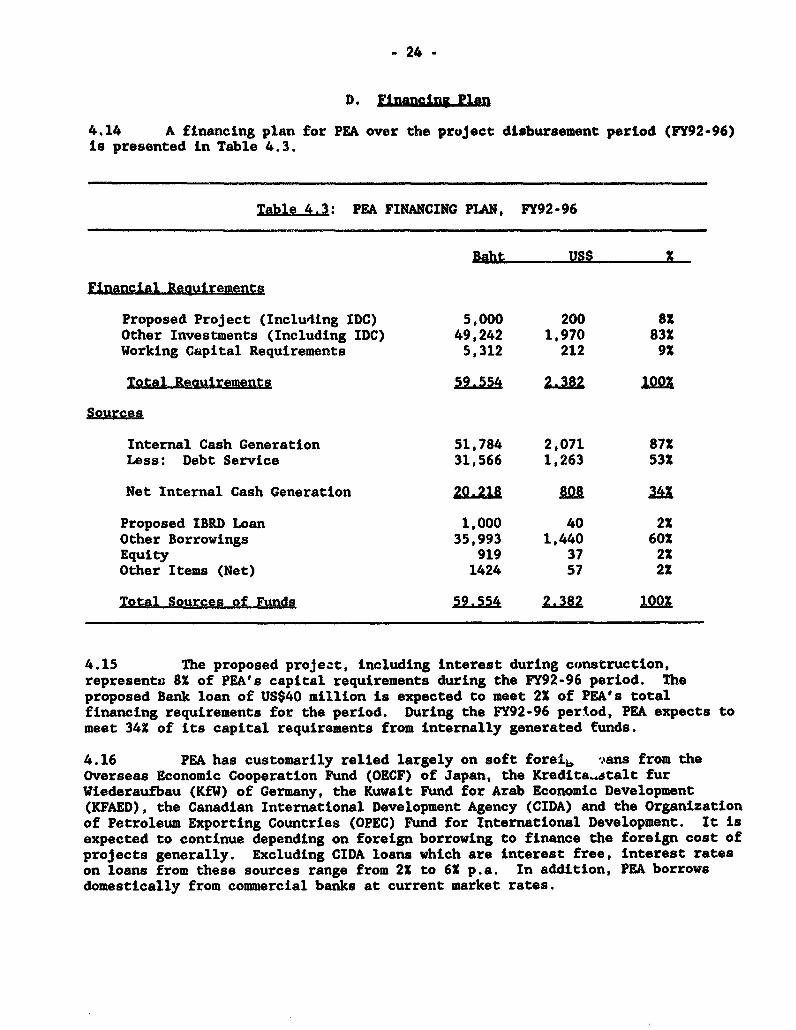
4.14 A financing plan for PEA over the project disbursement period (FY92-96)is presented in Table 4.3.
Table 4.3: PEA FINANCING PLAN, FY92-96
Baht USS X
Financlal Reguirements
Proposed Project (Inclu4ing IDC) 5,000 200 81Other Investments (Including IDC) 49,242 1,970 83XWorking Capital Requirements 5,312 212 9X
Total Requirements 59.554 2.382
Sources
Internal Cash Generation 51,784 2,071 87XLess: Debt Service 31,566 1,263 53X
Net Internal Cash Generation 20.218 8 3
Proposed IBRD Loan 1,000 40 2XOther Borrowings 35,993 1,440 60XEquity 919 37 22Other Items (Net) 1424 57 21
Total Sources of Funds 59.554 2.382 1
4.15 The proposed project, including interest during construction,represents 8X of PEA's capital requirements during the FY92-96 period. Theproposed Bank loan of US$40 million is expected to meet 21 of PEA's totalfinancing requirements for the period. During the FY92-96 period, PEA expects tomeet 341 of its capital requirements from internally generated funds.
4.16 PEA has customarily relied largely on soft fore16 -.ans from theOverseas Economic Cooperation Fund (OECF) of Japan, the Kredita..atalt furWiederaufbau (KfW) of Germany, the Kuwait Fund for Arab Economic Development(KFAED), the Canadian International Development Agency (CIDA) and the Organizationof Petroleum Exporting Countries (OPEC) Fund for International Development. It isexpected to continue depending on foreign borrowing to finance the foreign cost ofprojects generally. Excluding CIDA loans which are interest free, interest rateson loans from these sources range from 21 to 61 p.a. In addition, PEA borrowsdomestically from commercial banks at current market rates.

- 25 -
V. PROJECT JUSTIFICATION
A. Economic Analysis
5.1 The continuing surge in electricity demand in the PEA serviceterritory has made it imperative for PEA to expand and upgrade Its powerdistribution system to deliver power to new areas while enhancing the reliabilityof the system to acceptable levels. Through the provision of reliable powersupply the project would promote efficient industrial growth which is vital forthe country's economic development. Further, its implementation would assist thegovernment's objective of promoting industrial growth outside metropolitanBangkok. The project forms an important part of PEA's least-cost expansionprogram. Its implementation would achieve the dual objective of reducing lossesand improving reliability and it would set a precedent for similar future projectsin high density growth areas of the country.
5.2 A detailed economic analysis has been performed by the feasibilitystudy consultants for the distribution of power subproject-wise in the entire areacovered by the proposed project. The analysis comprised comparison of the costsof the distribution system expansion by constructing new 115 kV lines and step-down 115/22 kV substations as proposed under the project versus the next bestalternative of expanding existing EGAT substations and adding 22 kV feeders; thebenefits -- specifically the sale of incremental energy -- would be the same forboth alternatives. The analysis considered the anticipated growth in demand overthe 1991-96 period and computed the cost streams of the two alternatives (over aproject life of 30 years) in terms of: (a) capital investments over 1991-96excluding duties and taxes; (b) the operation and maintenance costs at 1.51 of thecapital costs; and (c) the cost of losses evaluated at long run marginal cost(based on Thailand Power Tariff Structure Study, July 1986). The equalizingdiscount rates between the two cost streams ranged from 151 to 251 for 7subprojects and were over 251 for the remaining 11 projects. This showed that theproposed project would be the least-cost option for all discount rates up to atleast 151.
5.3 To confirm the economic viability of the project, the economic rate ofreturn (ERR) was calculated on the basis of the incremental economic costs andbenefit streams associated with the (Bank-financed) project component. The coststreams comprised: (a) investment in the the 115 kV line and step-down 115/22 kVsubstations under the project; (b) investments in the downstream distributionnetwork to support the demand growth; (c) cost of energy purchased from EGATevaluated on the basis of long run marginal cost of supply (vide Electric PowerStudy Report of January 1991); and (d) the incremental operation and maintenanceand administrative costs of running the system expansion computed at 2.51 of theincremental capital cost. The benefit was computed in terms of revenues based onPEA's tariff, ignoring consumer surplus. The project ERR was computed at about171. With a 101 increase in capital and operation costs the ERR dropped to 151,while a 101 reduction in energy sales reduced the ERR to slightly less than 151.The appraisal mission considered it unlikely that costs would increase or saleswould decrease more than 101 against project estimates. Details of thecalculation are in Annex 12. The ERR values for the total project (Bank- andOECF-financed) are slightly higher than the aforementioned figures.
B. Riaks
5.4 The project does not pose any significant risks. The basic planningof the distribution system in the area to be served by the project has been

- 26 -
comprehensively carried out durlng the feasibility study stage. Detailed projectdesign, for which consultants are already in place, should, therefore, proceedfairly smoothly. Implementation of the transmission lines and substations isbeing planned on a single responsibility basis, which should result in speedyexecution of the project. In view of advanced action taken by FEA in acquiringland for substations, this activity is not expected to pose problems in projectexecution (para. 3.6). While delay in timely execution of the project could becaused by delays In making decisions on procurement, this activity would beclosely monitored by the Bank. The risk of load growth not materializing asforecast is minimal, given the development potentlal of the area. Furthermore,the project return is robust enough to maintain lts economic vlabllity at slowerthan anticipated growth in energy sales.
VI. AGREEMENTS R D AND ION
A. &g smnts
6.1 During negotlatlons, agreement was reached with PEA that it would:
(a) carry out an annual review and update of its five-year investmentprogram and keep the Bank informed (para. 1.18);
(b) submit to the Bank audited annual financial statements within sixmonths of the close of each fiscal year and continue to have theaccounts audited by Independent auditors (para. 2.15);
(c) continue to make provisions for insurance consistent with appropriatepractice (para. 2.16);
(d) undertake consulting studies according to terms of reference agreedwith the Bank, discuss the results of the studies with the Bank andprepare an action plan to optimize system reliability in consultationwith the Bank (para. 3.5);
(e) comply with the Bank's environmental and resettlement requirements asappropriate for the project (para. 3.9);
(f) generate funds from internal sources equivalent to not less than 25Xof PEA's annual average capital expenditures incurred, or expected tobe incurred, for that fiscal year, the previous fiscal year, and thenext following fiscal year (para. 4.9);
(g) maintain a debt/equity ratio not exceeding 60/40 and short- andmedium-term debt at no more than 15X of all debt (para. 4.11); and
(h) review by April 30 of every year the adequacy of its tariffs toproduce the required self-financing ratio (para. 4.12).
6.2 During negotiations, agreement was reached with the Government that itwould undertake a periodic review and adjust as necessary power rates to ensurethat tariffs are adequate for PEA to generate funds from internal sourcesequivalent to not less than 25X of its annual average capital expendituresIncurred, or expected to be incurred, for that fiscal year, the previous fiscalyear, and the next following flscal year (para. 4.9).

- 27 -
B. BaCninDaU.o
6.3 On the basis of the agreements outlined above, the proposed programis suitable for a Bank loan of US$40 million equivalent to PEA withi the guaranteeof the Kingdom of Thailand at the Bank's standard variable interest rate for a17-year term including a 5-year grace period.
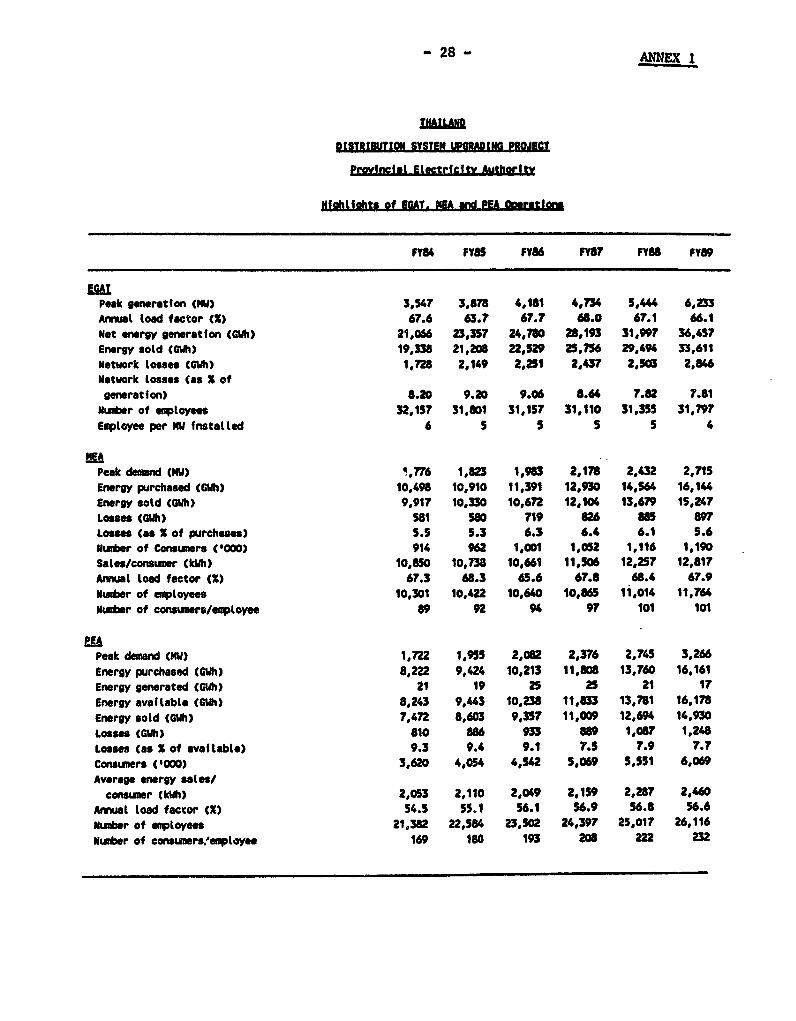
- 28 -
THAILAND
DIsITRlUTIOS SYSTEM UPORADINO PROJECT
Provincial Electricfty Authority
Hfahlfahta of EGAT. NA mnd PEA Ooeratf10
FY84 FY85 FY86 FY87 FYU FY89
'AmPeak g neratfon (NW) 3,547 3,878 4,101 4,734 5,444 6,233Annual toad factor (X) 67.6 63.7 67.7 68.0 67.1 66.1Net enrgy generation (Gwh) 21,066 23,357 24,780 26,193 31,997 36,457Energy sold (MIA) 19,338 21,208 22,529 25,756 29,494 33,611Network losses (GWh) 17'8 2,149 2,251 2,437 2,503 2,846Network Losses (as X ofgenration) 8.20 9.20 9.06 S.64 7.82 7.61
Nuwber of euptoyees 32,157 31,001 31,157 31,110 31,355 31,797Employee per NW fnstatted 6 5 5 5 5 4
Peak demand (NW) 1,776 1,823 1,983 2,178 2,432 2,715Energy purchased (CUh) 10,498 10,910 11,391 12,930 14,564 16,144Energy sold (GWh) 9,917 10,330 10,672 12,104 13,679 15,247Losses CGWh) 581 S80 719 626 885 897Losses (as X of purchses) 5.5 5.3 6.3 6.4 6.1 5.6
NuWber of Consumers ('IO) 914 962 1,001 1,052 1,116 1,190Sales/consumer (kWh) 10,850 10.738 10,661 11,506 12,257 12,817Annual toad factor (X) 67.3 68.3 65.6 67.8 68.4 67.9Nudter of eqptoyses 10,301 10,422 10,640 10,865 11.014 11,764Nuwer of cornuuers/employee 69 92 94 97 101 101
LEAPeak demand (MW) 1,722 1955 2,082 2,376 2,745 3,266Energy purchased (GWh) 8,222 9,424 10,213 11,806 13,760 16.161Energy generated tG¢h) 21 19 25 25 21 17Energy avaflable (GWh) 8,243 9,443 10,238 11,633 13,781 16,178Energy sold (GWh) 7,472 8,603 9,357 11,009 12,694 14.930Losses (GWh) 810 886 933 869 1,087 1,248Losses (as X of available) 9.3 9.4 9.1 7.5 7.9 7.7
Consumers ('000) 3,620 4,054 4,542 5.069 5,551 6,069Average energy "sles/
consumer (kWh) 2,053 2,110 2,049 2,159 2,287 2,460Annual load factor (X) 54.5 55.1 56.1 56.9 56.8 56.6number of employes 21,382 22,584 23,502 24,397 25.017 26,116
Muter of consumers'ewptoye, 169 180 193 206 222 232
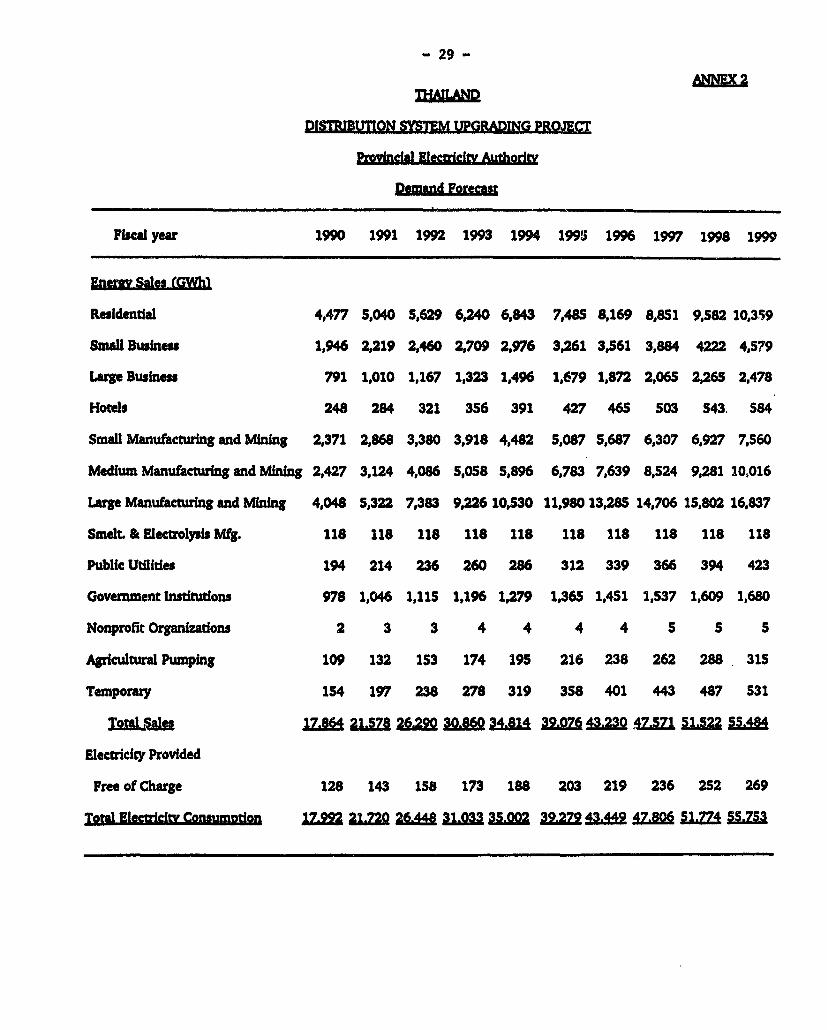
- 29 -
Th~~~&M
~~mniE2L9ac ~ ~ ~ ~ AniS
THAILND
DlSlPUUllO SYX3 UPGRA0DING P&CJlgT
Provincia ectricfit Autihod
Fiscal year 1990 1991 1992 1993 1994 1995 1996 1997 1998 1999
Energv Sales (GWhI
Residental 4,477 5,040 5,629 6,240 6,843 7,485 8,169 8,851 9,582 10,359
SmaU Busine*s 1,946 2,219 2,460 2,709 2,976 3,261 3,561 3,884 4222 4,579
Large Business 791 1,010 1,167 1,323 1,496 1,679 1,872 2,065 2,265 2,478
Hotels 248 284 321 356 391 427 465 503 543. 584
Smll Manufacturing and Mining 2,371 2,868 3,380 3,918 4,482 5,087 5,687 6,307 6,927 7,560
Medium Manufacturing and Mining 2,427 3,124 4,086 5,058 5,896 6,783 7,639 8,524 9,281 10,016
Large Manufacturing and Minn 4,048 5,322 7,383 9,226 10,530 11,980 13,285 14,706 15.802 16,837
Smelt & ElectroIysis Mfg. 118 118 118 118 118 118 118 118 118 118
Public Utilides 194 214 236 260 286 312 339 366 394 423
Government Institutions 978 1,046 1,11S 1,196 1,279 1,365 1,451 1,537 1,609 1,680
Nonprofit Organizadons 2 3 3 4 4 4 4 5 5 5
Agricultural Pumping 109 132 153 174 195 216 238 262 288 31S
Tempora: 154 197 238 278 319 3S8 401 443 487 531
Totalu 17.564 L 21.578 43 4 4751 S1.522 554
Electricity Provided
Free of Charge 128 143 158 173 188 203 219 236 252 269
Igt Meacftlc Qnsumpton um99 2LaQ 26.448 31.033 35.QM 39.279 43.449 47.806. za §5 .L5f73
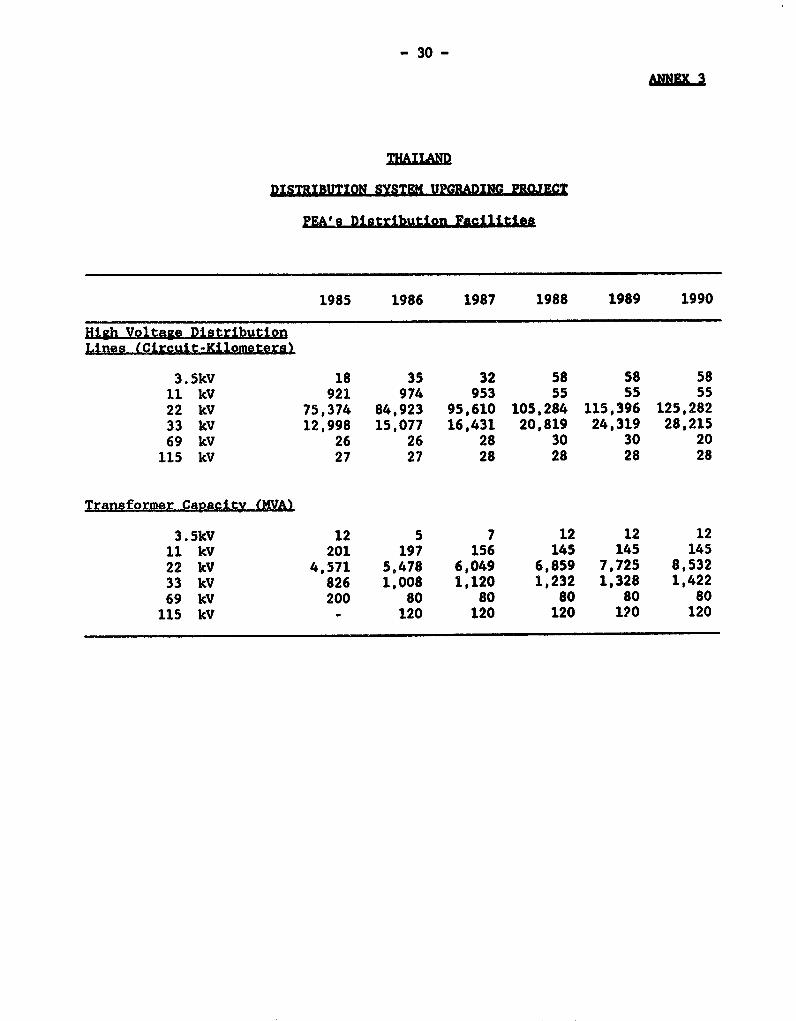
- 30 -
ANNIL3
DISTRIBUTION SYSTEM UPGRADING PROJECT
PEA's Distribution Facilities
1985 1986 1987 1988 1989 1990
High Voltage DistributionLines (Circuit-Kilometers)
3.5kV 18 35 32 58 58 5811 kV 921 974 953 55 55 5522 kV 75,374 84,923 95.610 105,284 115,396 125,28233 kV 12,998 15,077 16,431 20,819 24,319 28,21569 kV 26 26 28 30 30 20115 kV 27 27 28 28 28 28
Trangformer CApacity (N-VA)
3.5kV 12 5 7 12 12 1211 kV 201 197 156 145 145 14522 kV 4,571 5,478 6,049 6,859 7,725 8,53233 kV 826 1,008 1,120 1,232 1,328 1,42269 kV 200 80 80 80 80 80115 kV - 120 120 120 120 120
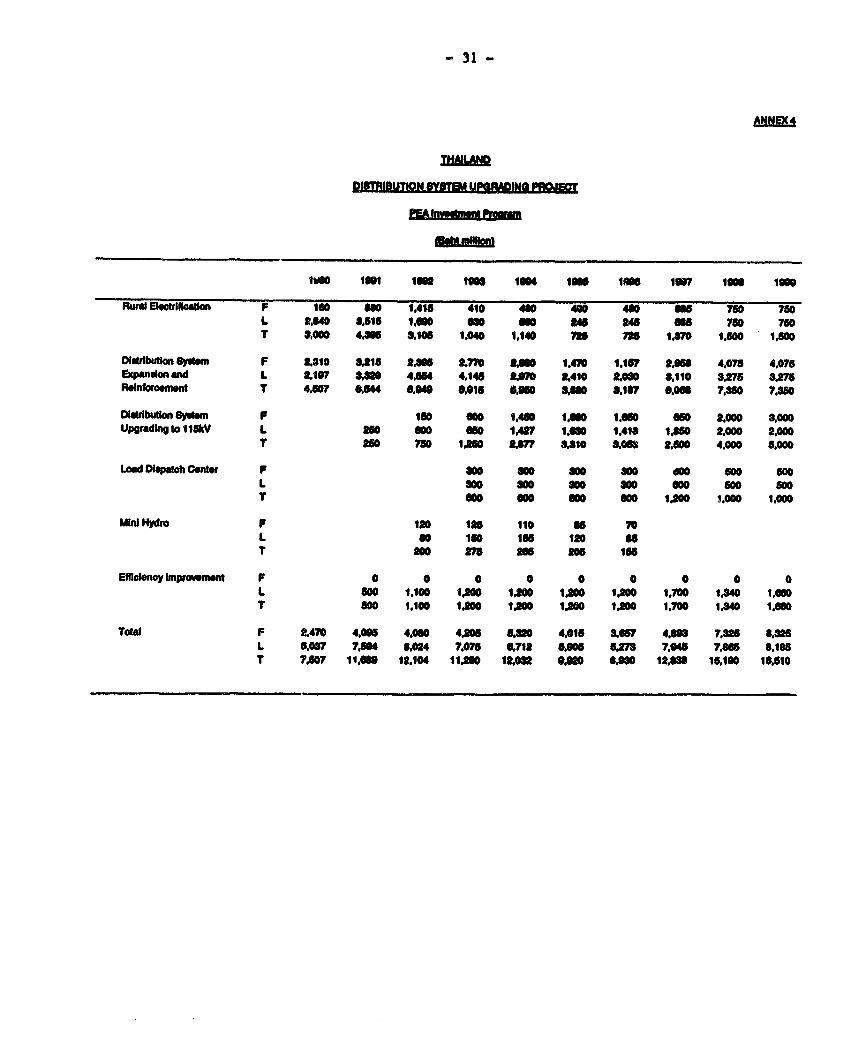
- 31 -
6NNEX4,
RI IDUTONGISI UIM0112PRJEC
~~Imainmai
100 loci 1 wOe Is4 t"rn$ IWs 107 10m Inc
Rural Elcftlbatln F 160 m 1.415 410 460 400 480 OU 780 750L DMU0 8,515 1.060 800 0 345 34 750 7T 8,000 4K 3106 1.040 1.140 73 75 I'm70 1.500 1.600
DsbtrlbutnF Sy staP 3.310 Ws 3.3 UFO DUO 1AN 1.157 23.01 4.075 4.075Expandon nd L 2.107 8.2 454 4.146 570 X3410 30 8j10 . 3,275 837Runforoemont T 4.507 6.44 06.60 0.015 8,O5 &o 38.157 OU 7.360 7.850
OlalbuUon System F 150 6oo S,UO 1.OO0 1.0 050 2.000 8.000Upgradingto 118V L 350 6oo No0 1.487 1. 1.418 1*0 2.000 2.000
T ago 750 1'm0 377 810 s,oes 21.00 4.000 6.000
Load Disatch Center F So0 800 So0 So0 d 500 S00L SOO 800 S00 800 Soo 500 600T a"0 60 Goo 600 1.00 1.000 1.000
Mld Hydro F 120 135 110 K 70L 00 160 165 120 s51 200 375 3m 20 18
Efflonoy lmptrovnwnt F 0 0 0 0 0 0 0 0 0L 00 1.100 1.l00 1*00 1*00 1.200 1.700 1.840 1.60T 600 1.100 100 100 100 1.0 1.700 1.340 1.650
Total F 8.470 4.065 4.000 4*05 8.0 4.016 S.657 4.68 7.826 8.926L 5.087 TA74 5,024 7.075 6.712 5,606 6.278 7.4 7.6 8.18UT 7,507 11.060 13,104 11*30 12.032 0,M0 6.0M0 12aU 18.100 16.510
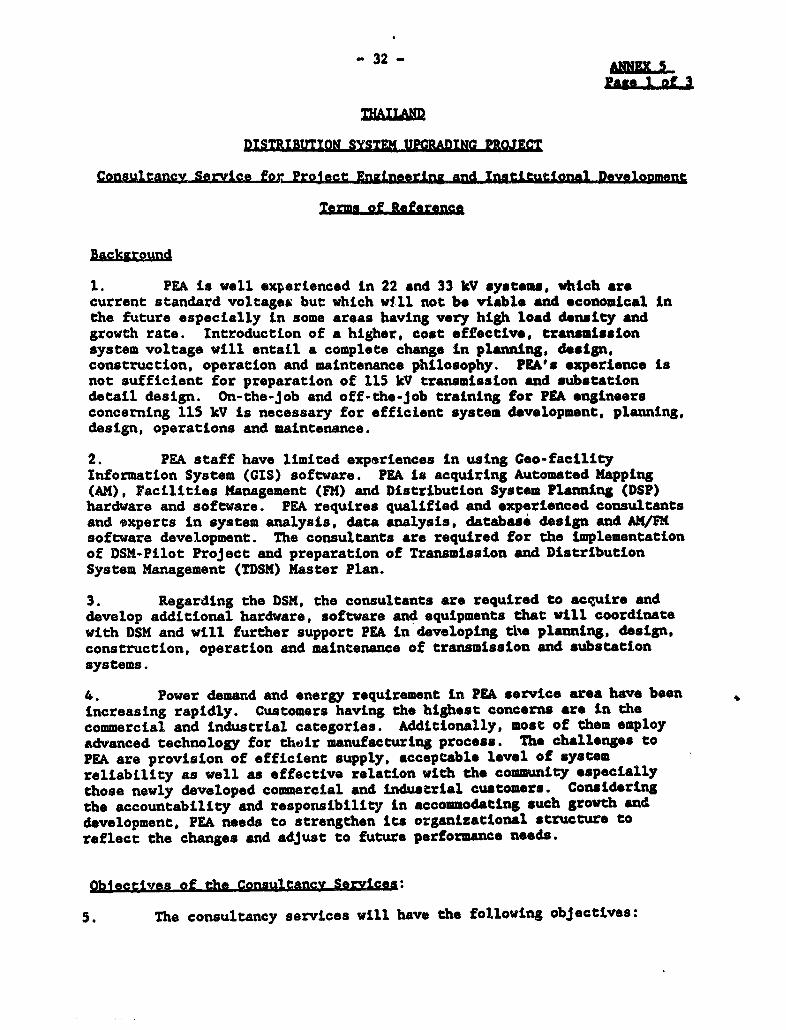
- 32 -
Pag4 I of 3
DISTRIBUTIONl SYSTEM JPORADNO PROJECT
CongultancX Service fog. Project: Enfineeringf and tnnie ginal Develog3ment
T,erms of Referenceg
1. PEA is well experienced in 22 and 33 kV systems. which arecurrent standard voltages but which wfll not be viable and economical inthe future especially in some areas having very high load density andgrowth rate. Introduction of a higber, cost effective, transmissionsystem voltage will entail a complete change in planning, design,construction, operation and maintenance philosophy. PEA's experience isnot sufficient for preparation of 115 kV transmission and substationdetail design. On-the-job and off-the-job training for PEA engineersconcerning 115 kV is necessary for efficient system development, planning,design, operations and maintenance.
2. PEA staff have limited experiences in using Geo-facilityInformation System (GIS) software. PEA is acquiring Automated Napping(AM),* Facilities Management (FM) and Distribution System Plananing (DSP)hardware and software. PEA requires qualified and experienced consultantsand experts in system analysis, data analysis, database design and AN/FNsoftware development. The consultants are required for the Implementationof DSM-Pilot Project and preparation of Transmission and DistributionSystem Management (TDSM) Master Plan.
3. Regarding the DSM, the consultants are required to acquire anddevelop additional hardware.* software and equipments that will coordinatewith DSM and will further support PEA in developing thes planning, design,construction, operation and maintenance of transmission and substationsystems.
4. Power demand and energy requirement in PEA service area have beenincreasing rapidly. Customers having the highest concerns are in thecommercial and industrial categories. Additionally, most of them employadvanced technology for thdir manufacturing process. The challenges toPEA are provision of efficient supply. acceptable level of systemreliability as well as effective relation with the community especiallythose newly developed commercial and industrial customers. Consideringthe accountability and responsibility in accommodating such growth anddevelopment, PEA needs to strengthen its organizational structure toreflect the changes and adjust to future performance needs.
Obiectives of the ConsultaneX Serviues:
5. The consultancy services will have the following objectives:
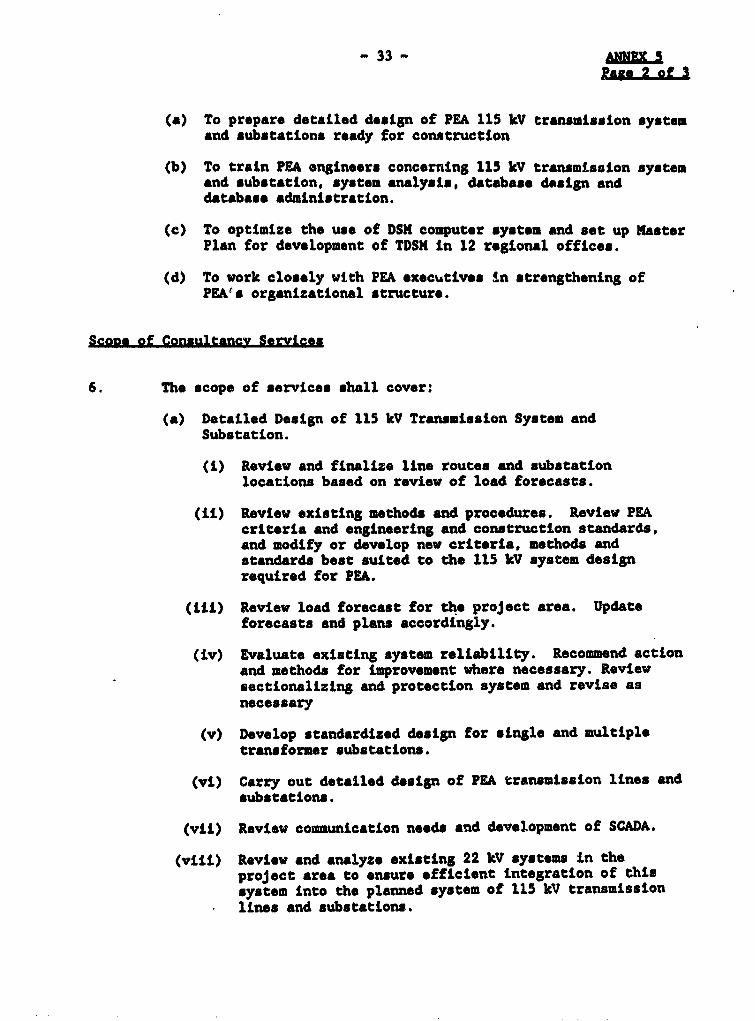
-33 - ANNfh 592 2 Of 3
(a) To prepare detailed design of PEA 115 kV transmission systemand substations ready for construction
(b) To train PEA engineers concerning 115 kV transmission systemand substation, system analysis, database design anddatabase admlnlitration.
(c) To optimlze the use of DSM computer system and set up MasterPlan for development of TDSM in 12 regional offices.
(d) To work closoly with PEA *xecutives in strengthening ofPEAs organizational structure.
Scoge of Consultancv Services
6. The scope of services shall cover:
(a) Detailed Design of 115 kV Transmisslon System andSubstatLon.
(i) Review and finalize line routes and substationlocations based on revlew of load forecasts.
(ii) Review existing methods and procedures. Review PEAcriteria and engineering and constructlon standards,and modLfy or develop new criteria, methods andstandards best sulted to the 115 kV system designrequired for PEA.
(III) Review load forecast for the project area. Updateforecasts and plans accordingly.
(iv) Evaluate exlsting system reliabillty. Recommend actLonand methods for Improvement where necessary. Revlewsectionalizing and protection system and revise asnecessary
(v) Develop standardized design for slngle and multipletransformer substations.
(vi) Carry out detailed design of PEA transmission llnes andsubstations.
(viL) Review communicatLon needs and development of SCADA.
(viii) Review and analyze existing 22 kV systems ln theproject area to ensure efficient integration of thissystem into the planned system of 115 kV transmlssionlLnes and substations.

- 34 - ANNU Sl^g 3 of 3
(ix) Develop adequate protection schemes for the 115 kV and22 kV systems.
(x) Review PEA bidding documents and specifications.
(b) Training of PEA Engineers concerning 115 kV transmissionsystem and substatiotns and TDSM.
(i) Conduct training programs covering planning, design,operation and maintenance for 115 kV transmission andsubstation systems.
(ii) Conduct training programs covering TDSM, including AM,FM applications development, system analysis, databasedesign, database analysis and database administration.
(c) Development of Transmission and Distribution SystemManagement (TDSM).
(i) Review and recommend AM/FM database specification andapplications developed under DSM pilot project toensure that the design meets present and futurerequirements.
(ii) Analyze load characteristics to derive Transformer LoadManagement (TIM) formular appropriate to PEA.
(iii) Analyze economical and time-saving methods forconverting aerial photographic maps and data into aGeo-facilities Information System (GIS) database.
(iv) Evaluate DSM pilot-project and produce evaluationreports.
(v) Prepare TDSM Master Plan
(d) Strengthening of PEA's Organizational Structure.
(i) Carry out external environmental analysis, internalposition audit and future forecast.
(ii) Carry out gap analysis to evaluate alternativeswhich will meet the requirements of changes especiallythose concerned with output objectives, externalenvironment and internal strength and weaknesses.
(Wi) Work towards a strengthened organizational structurewhich is best suited to the changed environment andable to adjust to future performance needs.
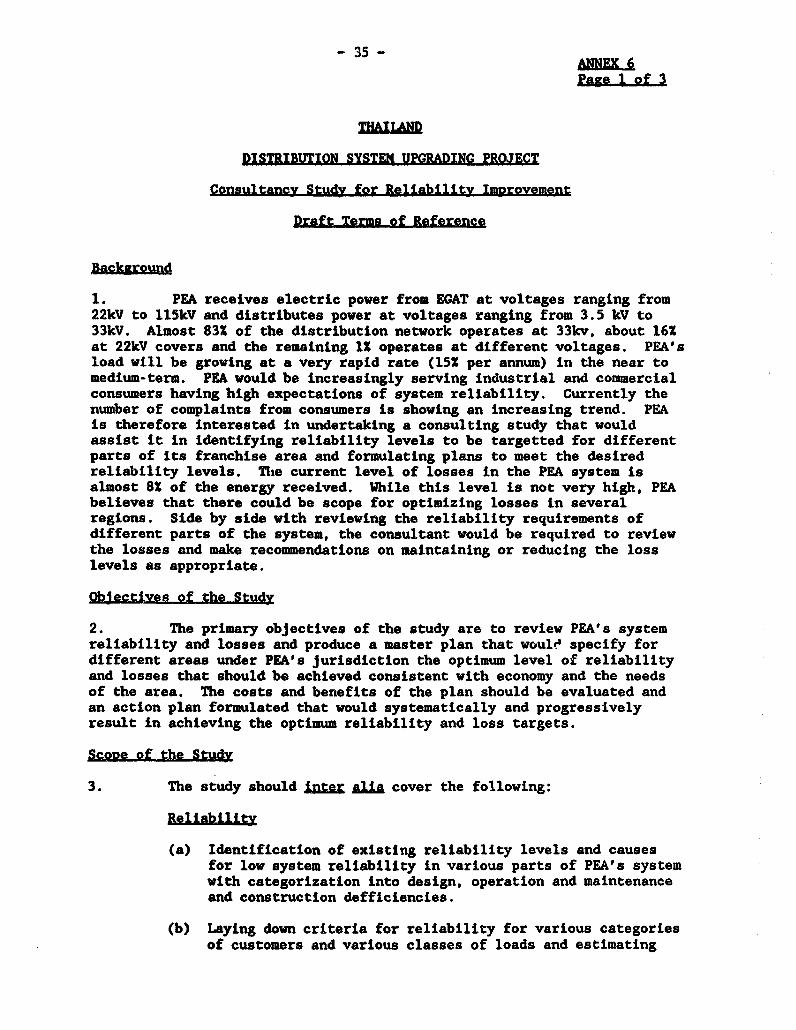
- 35 -ANNEX 6
DISTRIBUTION SYSTEM UPGRADING PROJECT
Consultancy Study for Reliability Improvement
Draft Terms of Reference
1. PEA receives electric power from EGAT at voltages ranging from22kV to 115kV and distributes power at voltages ranging from 3.5 kV to33kV. Almost 83X of the distribution network operates at 33kv, about 16Xat 22kV covers and the remaining 1X operates at different voltages. PEA'sload will be growing at a very rapid rate (151 per annum) in the near tomedium-term. PEA would be increasingly serving industrial and commercialconsumers having high expectations of system reliability. Currently thenumber of complaints from consumers is showing an increasing trend. PEAis therefore interested in undertaking a consulting study that wouldassist it in identifying reliability levels to be targetted for differentparts of its franchise area and formulating plans to meet the desiredreliability levels. The current level of losses in the PEA system isalmost 8X of the energy received. While this level is not very high, PEAbelieves that there could be scope for optimizing losses in severalregions. Side by side with reviewing the reliability requirements ofdifferent parts of the system, the consultant would be required to reviewthe losses and make recommendations on maintaining or reducing the losslevels as appropriate.
Oblectives of the Study
2. The primary objectives of the study are to review PEA's systemreliability and losses and produce a master plan that woule specify fordifferent areas under PEA's jurisdiction the optimum level of reliabilityand losses that should be achieved consistent with economy and the needsof the area. The costs and benefits of the plan should be evaluated andan action plan formulated that would systematically and progressivelyresult in achieving the optimum reliability and loss targets.
Scope of the Study
3. The study should inter ala cover the following:
Reliability
(a) Identification of existing reliability levels and causesfor low system reliability in various parts of PEA's systemwith categorization into design, operation and maintenanceand construction defficiencies.
(b) Laying down criteria for reliability for various categoriesof customers and various classes of loads and estimating

- 36 -ANE
Pac 2 of 3
the costs and benefits of achieving the specifiedreliability targets.
(c) Developing an overall plan and a series of concreteprojects for improving the reliability level of PEA'ssystem.
Losses
(a) Identification of the causes of losses in various parts ofthe system.
(b) Developing computer-based techniques for evaluating lossesbased on system parameters and verifying with actual sitemeasurements.
(c) Considering various techniques for reducing losses andevaluating the costs and benefits of each technique.
(d) Determining the optimum level of losses to be attained anddeveloping an overall plan and a series of concreteprojects for reducing losses.
Conduct of the study
4. It is anticipated that the study will be performed in twophases. d11 work will be done in PEA's office in Thailand. Phase I willbe devoted to data collection, evaluation of previous work by PEA andconsultants, review and establishment of criteria and evaluation ofexisting system losses and reliability and preliminary investigation ofpotential causes of the problems. The objective of Phase I is to narrowthe list of causes for detailed investigation in Phase II, to define theexisting situation and identify preliminary plans for loss optimizationand reliability improvement. The detailed scope of work would be:
heliabiliX
(a) Review and evaluation of methodology used to assess systemreliability, and definition of outage history and outagerates and durations for system components.
(b) Review and evaluation of PEA's reliability criteria anddefinition of revised criteria.
(c) Detailed problem definition and preliminary list ofalternatives to be investigated.
(d) Production of a report summarizing conclusions andrecommendation of alternativse to be considered in PhaseII.

- 37 -
5. Phase II will cover preparation of master plans for theimprovement of system reliab'lity and optimization of losses and a list ofconcrete projects to be undertaken by PEA. The consultant would beexpected to provide the necessary computer programs for evaluation ofreliability and losses to PEA and train PEA engineers to undertake thiswork on their own in the future. This phase would also cover visits toselected utilities overseas. Phase II would end with a Final StudyReport, including summaries, conclusions, recommendations, all supportingdocumentation, attachments, and exhibits to fully describe the existingsituation and recommendations on future achievements.
Ilasses
(a) Review of existing reports, historical data, methods formeasurement of losses, methods for calculation of lossesand work done to date.
(b) Detailed problem definition and preliminary list ofpotential causes to be investigated.
(c) Load flow analysis, detailed review of system changes madeduring the period of loss increase, and review of meteringmethodology.
(d) Analysis to pinpoint the problem to a specific part of thepower system, and possibly to specific lines, linesegments or subbstation areas.
(e) Field inspections when deemed necessary.
(f) Production of a report which will narrow the many possiblecauses of losses and define the most important causes to beinvestigated in detail in Phase II.
PEA furnished Facilities. SuRgort and Data
6. PEA will provide, without cost to the successful Consultant thefollowing:
(a) working space and administrative support in Bangkok.
(b) PEA's staff to assist the consultant and receive concurrenttraining. PEA has already compiled substantial informationand background material. It is anticipated that a teamapproach, utilizing PEA staff familiar with the project,will enhance results and minimize cost.
(c) access to existing plan, maps, billing records, operatingrecords, reports and related data in its files whichpertain to evaluation of system reliability and losses.
(d) access to computers and to PEA' system analysis softwaresuch as CADPAD.

- 38 - AMEXZ 7Page 1 of
THAILANDDISTRIBUTION SYSTEM UPGRADING PROJECT
Cost Estimate(US$ Million)
Local Foreign Total
A. Bank-Financed Comoonent
Substations
Site preparation 4.35 0 4.35Civil works 3.65 0 3.65Transformers 0 4.60 4.60Switchgear 0 4.90 4.90Control, protection and 0 5.50 5.50auxiliary equipmentCommunication equipment 0 0.70 0.70Installation and commissioning 0.70 0 0.70Transport 0.40 0 0.40Engineering and administrative 0.25 0 0.25VehiclesDuties and taxes 4.15 0 4.15
Base Cost 13.50 15.70 29L20
Physical contingencies 1.35 1.60 2.95Price contingencies 1.75 2.10 3.85
Total Sub2roject Cost l6.6Q 19.40 36.00
Transmission Lines
Poles and foundations 13.50 0 13.50Conductors 0 9.20 9.20Insulators and hardware 0 7.50 7.50Labor for erection 2.00 0 2.00Transport 0.55 0 0.55Engineering and administrative 0.55 0 0.55overheadDuties and taxes 1.70 0 1.70
Bagg Coat 12-30 16.70 35.00
Physical contingencies 1.80 1.65 3.45Price contingencies 2.30 2.25 4.55
Total Suboroject Cost 22-40 20.60 43.00
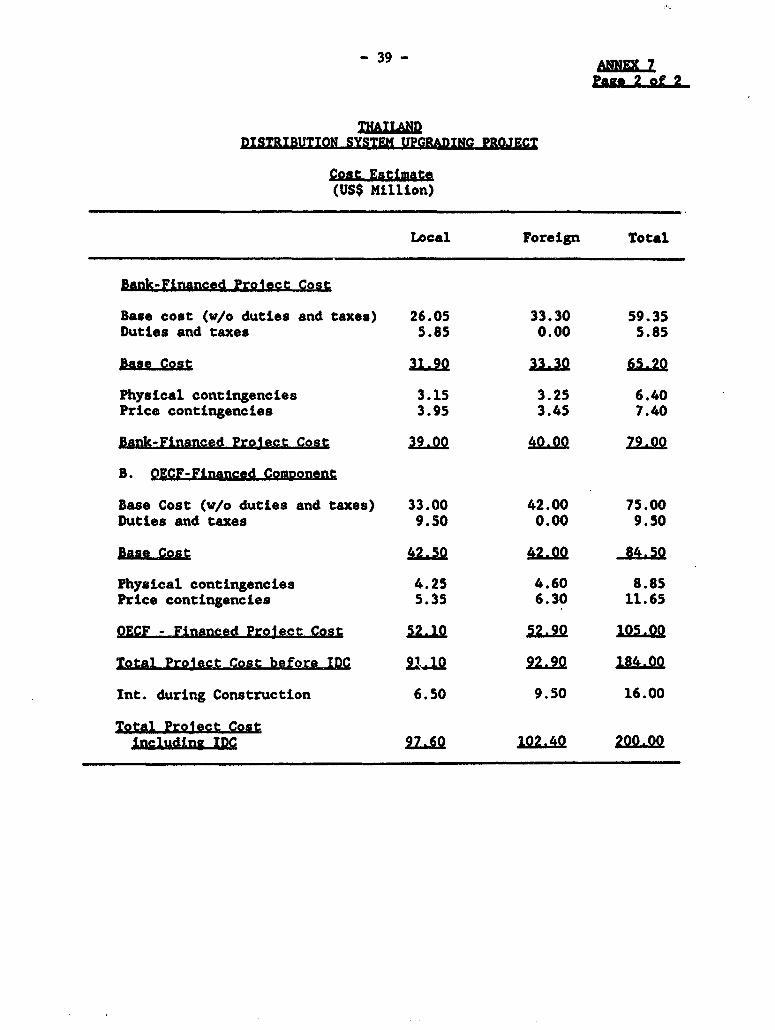
- 39 - ANiKE 7Pag-e o
THANDL~L
DISTRIBUTION SYRTEM UPGRADING PROJECT
Cgst Estim r&(US$ Million)
Local Foreign Total
Bank-Financed Pro1ect Cost
Base cost (w/o duties and taxes) 26.05 33.30 59.35Duties and taxes 5.85 0.00 5.85
ase Cont 31.10 33.30 65.20
Physical contingencies 3.15 3.25 6.40Price contingencies 3.95 3-45 7.40
Bank-Einanced Project Cost 39.QQ 40.QQ 79 00
B. QECF-Financed Comnonent
Base Cost (w/o duties and taxes) 33.00 42.00 75.00Duties and taxes 9.50 0.00 9.50
Base _42.5 42.00 so
Physical contingencies 4.25 4.60 8.85Price contingencies 5.35 6.30 11.65
OECF - Financed Project Cost 2L10 52390 .105.0Q
Total Project Cost before IDC 9iL1 92.9Q 18l4,0Q
Int. during Construction 6.50 9.50 16.00
Total Pro1ect CostinldingLIDC 27.60 102.40 I00.00
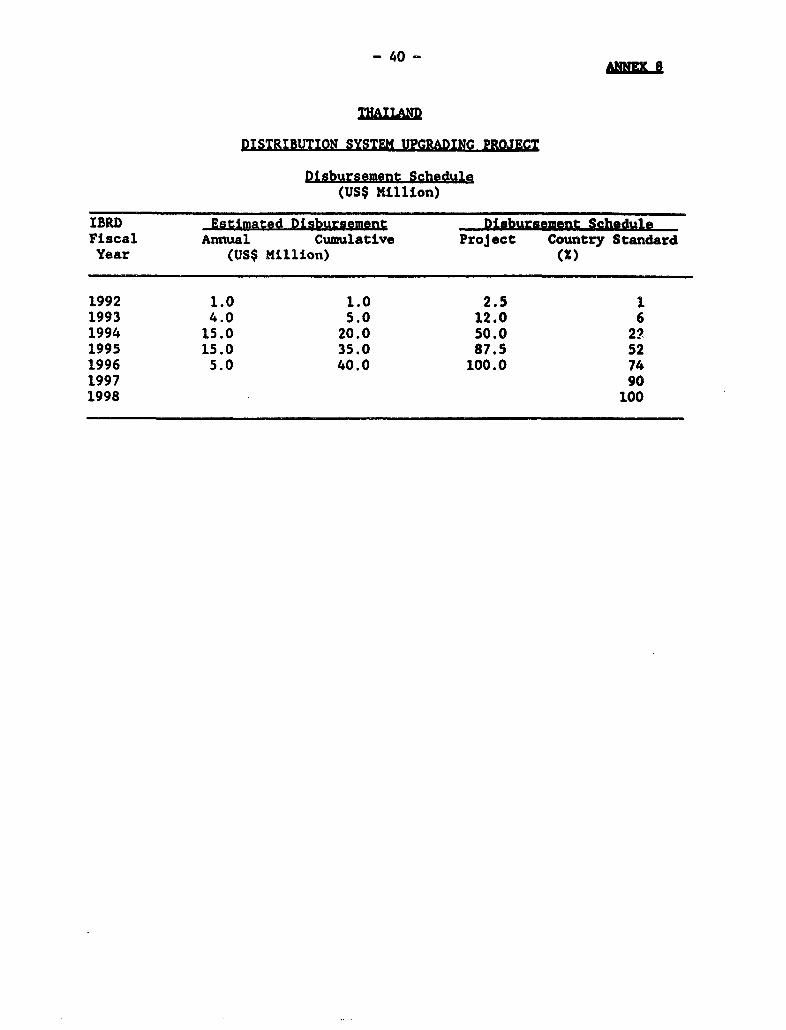
- 40 - A3u
DISTRIBUTION SYSTEM UPGRADING PROJECT
DisLbursement Schedule(US$ Million)
IBRD Estimated Disbursement Disbursement ScheduleFiscal Annual Cumulative Project Country StandardYear (US$ Million) (X)
1992 1.0 1.0 2.5 11993 4.0 5.0 12.0 61994 15.0 20.0 50.0 2?1995 15.0 35.0 87.5 521996 5.0 40.0 100.0 741997 901998 100

- 41 -ANEX 9Page I of 3
DISTRIBUTION SYSTEiMUWORADING PROJECT
PrvovicA fleggg=t Aulgth
Pig FlnncalPofo
IncoS Stotemgnt(Bak nifion)
Yea Endinh Soptember 30 1984 1985 1986 1987 1988 1989
ENERGY SALES (GWh) 7.472 8.603 9.357 11,009 12.694 14.930
SALES INCREASE (%) 11 Is 9 18 IS 18
AVERAGE TARIFF (B/kWh) 1.69 1.68 1.66 1.63 1.61 1.61
OPERATING REVENUEENERGY REVENUE 12.630 14,489 IS.513 17.9S9 20,433 24,028
OTHER OPERATING REVENUE 399 456 484 431 618 761
TOTAL OPERATING REVENUE 13.029 14.946 IS.997 18,390 21,051 24.789
OPERATING EXPENSESPURCHASED POWER 9.529 10,962 11.679 13,056 14.308 16,806
FUEL AND OIL 63 49 45 44 29 18
OPERATING AND MAINTENANCE 1.877 2,056 2,177 2.443 2,649 3,082
DEPRECIATION 975 1.238 1,439 1.666 1,977 2,305
REMITTANCE TO GOVERNMENT - S0 30 45 60 206
TOTAL OPERATING EXPENSES 17,444 14,355 15,369 17,254 19.023 22,416
OPERATING INCOME 585 590 628 1,136 2.028 2,373
NON - OPERATING INCOME 360 440 467 416 SSI 802
NON - OPERATING EXPENSESINTEREST CHARGED TO OPERATIONS 661 909 1.041 1,214 1,310 1.222
FOREIGN EXCHANGE LOSS 12 135 157 374 531 428
OTHER 105 133 11S 113 74 62
TOTAL NON-OPERATING EXPENSES 778 1,176 1,312 1,701 1,914 1,713
NET INCOME (LOSS) 167 (146) (217) (148) 665 1,462
AVERAGE RATE BASE 10,738 13,135 15.286 17,399 20,668 24.181
RATE OF RETURN 4.9 4.6 4.0 6.4 8.7 8.8
OPERATING RATIO(%) * 96 96 96 94 90 90
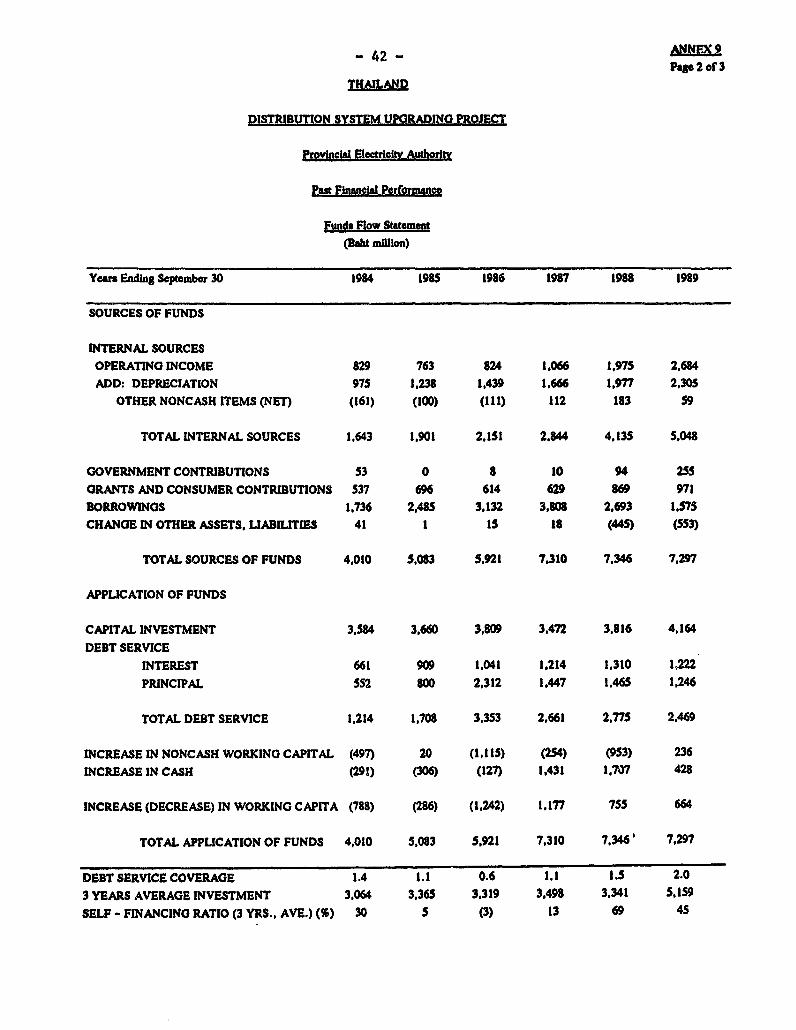
- 42 - AngPope 2 of 3
THALAND
DISTRIBUTION SYSTEM UPGRADING PRO,IEC
Provincial ElctrIcty Authoty
Past FinacnW Peformnce
Funds Flow Statement(Bt milllon)
Years Ending September 30 1984 1985 1986 1987 1988 1989
SOURCES OF FUNDS
INTERNAL SOURCESOPERATING INCOME 829 763 824 1.066 1,975 2.684ADD: DEPRECIATION 975 1,238 1.439 1.666 1,977 2.305
OTHER NONCASH ITEMS (NET) (161) (100) (111) 112 183 59
TOTAL INTERNAL SOURCES 1,643 1.901 2,151 2.844 4,13S 5.048
GOVERNMENT CONTRIBUTIONS 53 0 8 10 94 2SS
GRANTS AND CONSUMER CONTRIBUTIONS 537 696 614 629 869 971BORROWINGS 1.736 2,485 3.132 3.808 2,693 1,575
CHANGE IN OTHER ASSETS. LIABILITIES 41 1 15 18 (445) (553)
TOTAL SOURCES OF FUNDS 4.010 5,083 5.921 7.310 7,346 7,297
APPLICATION OF FUNDS
CAPITAL INVESTMENT 3.584 3.660 3,809 3.472 3.816 4,164
DEBT SERVICEINTEREST 661 909 1,041 1.214 1,310 1,222
PRINCIPAL 5S2 80 2,312 1.447 1,465 1,246
TOTAL DEBT SERVICE 1,214 1,708 3,353 2.661 2,775 2.469
INCREASE IN NONCASH WORKING CAPITAL (497) 20 (1,15) (2S4) (9S3) 236INCREASE IN CASH (291) (306) (127) 1,431 1,707 428
INCREASE (DECREASE) IN WORKING CAPITA (788) (286) (1,242) 1.177 755 664
TOTAL APPLICATION OF FUNDS 4,010 5,083 5.921 7.310 7.346' 7,297
DEBT SERVICE COVERAGE 1.4 1.1 0.6 1.1 1.5 2.03 YEARS AVERAGE INVESTMENT 3.064 3.365 3,319 3.498 3.341 5,159SELF - FINANCING RATIO (3 YRS., AVE.) (%) 30 5 (3) 13 69 45
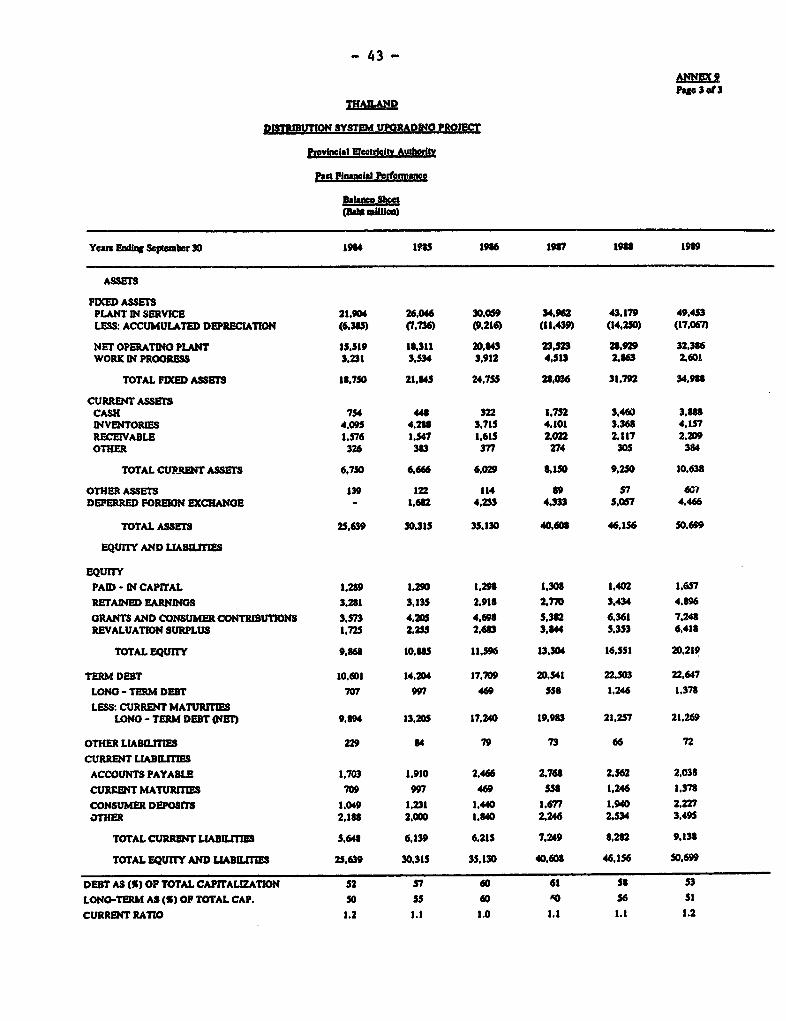
- 43 -
Pap 3.of3THAMArD
ITRiUON SYSTEM UPORADINR PROJECI
Pgwitial Me ectitI AutuitY
hPa Financial Puifosmmn
Yea Endlq Sqopnber 30 1914 1m 1916 191? 19U 19
ASSETS
FXED ASSETSPLANT IN SERVICE 21.904 26,046 30.059 34.92 43.179 49.453LESS: ACCUMULATED DEPRECITION (6,3. (7.736) (9.216) (11.439) (14.250) (17.06
NET OPERATINO PLANT 15.519 1U.311 20,U43 23.,m 24.929 32.3U6WORK IN PROGRESS 3.231 3.534 3.912 4,513 2,63 2,601
TOTAL FDIED ASSETS 15,750 21.U5 24.755 21,036 31.792 34,9S1
CURRENT ASSETSCASH 754 448 322 1,752 3,460 3.18$INVENTORIES 4.095 4.2U 3.715 4.101 3.368 4.157RECEIVABLE 1.576 1,547 1,615 2,022 2.117 2.209OTHEt 326 383 371 74 305 314
TOTAL CURRENT ASSETS 6,750 6,656 6,029 3,150 9.250 10.638
OTHER ASSETS 139 122 114 89 57 6CIDEFERRED FOREIGN EXCIANOE - 1,682 4,23 4.33 5.057 4.466
TOTAL ASSETS 25.639 30,315 35.130 40,608 46,156 50.699
EQUnTY AND LIABILITIES
EQUflyPAID - IN CAPITAL 1.289 1.290 1,298 1.308 1,402 1,657
RETAINED EARNINGS 3.2tl 3,135 2.918 2,770 3.434 4.896
GRANTS AND CONSUMER CONTRIBUTIONS 3.573 4.205 4,698 5.38 6,361 7.248REVALUATION SURPLUS 1.725 2,255 2.683 3.,44 5,353 6,418
TOTAL EQUIrY 9.868 10.85 11.596 13.304 16.551 20.219
TERM DEBT 10.601 14,204 17,709 20.541 22.503 22,647
LONO - TERM DEBT 707 997 469 558 1.246 1,378
LESS: CURRENT MATURITIESLONO - TERM DEBT (NET) 9.894 13,205 17.240 19.9m3 21.257 21.269
OTHER LIABIMI= 229 84 79 73 66 72
CURRENT LIABILITIES
ACCOUNTS PAYABLE 1,703 1.910 2.466 2.768 2.562 2,038
CURKENT MATURIrT 709 997 469 55S 1,246 L.3m
CONSUMER DEPOSITS 1.049 1,231 1.440 1.677 1,940 2.227OTHER 2,1U1 2,000 1.840 2.246 2,534 3.495
TOTAL CURRENT LAILITIS 5.641 6,139 6,215 7.249 S.28 9.138
TOTAL EQUITY AND LIABILIES 25.639 30.315 35.130 40.60, 46,156 50.699
DEBT AS (S) OP TOTAL CAPITALIZATION 52 S7 60 61 5S 53
LONG-TERM AS (S) OP TOTAL CAP. 50 5S 60 50 S6 51
CURRENT RATIO 1.2 1.1 1.0 1.1 1.1 1.2
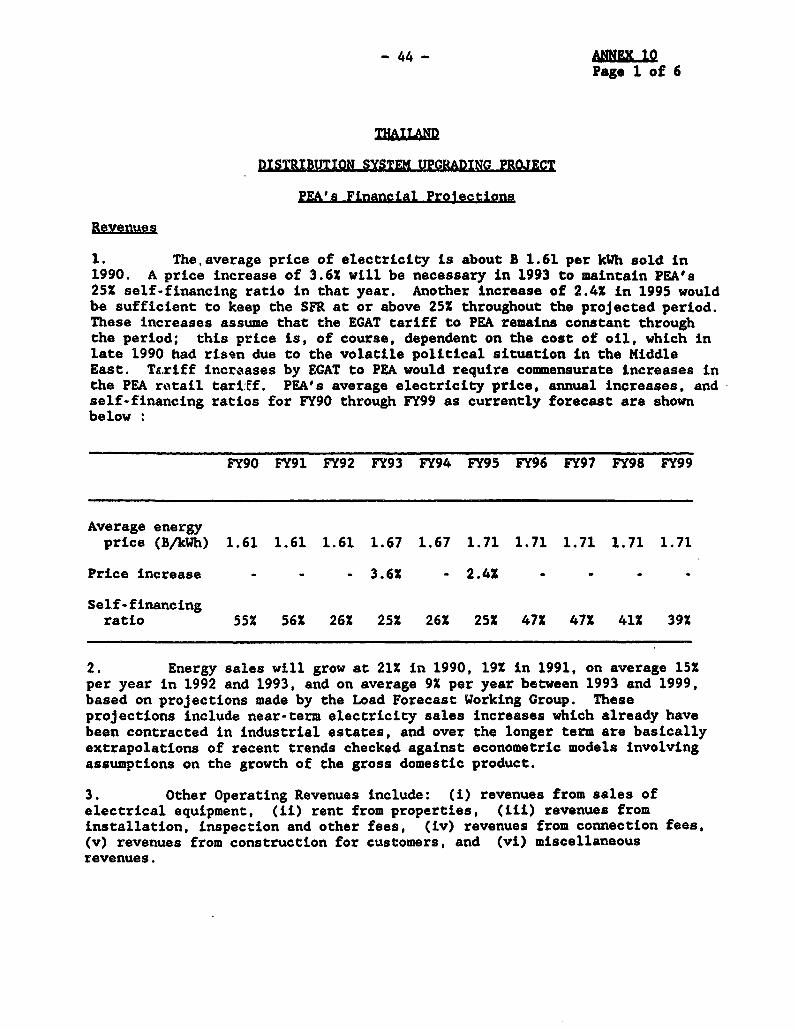
- 44 -Page 1 of 6
DISTRIBUTION SYSTEM UPGEADING PROJECT
PEA'S Financial Projections
1. The,average price of electricity is about B 1.61 per kWh sold in1990. A price increase of 3.6X will be necessary in 1993 to maintain PEA's25X self-financing ratio in that year. Another inerease of 2.4X in 1995 wouldbe sufficient to keep the SFR at or above 25X throughout the projected period.These increases assume that the EGAT tariff to PEA remains constant throughthe period; this price is, of course, dependent on the cost of oil, which inlate 1990 had risen due to the volatile political situation in the MiddleEast. Tariff increases by EGAT to PEA would require commensurate increases inthe PEA retail tariEf. PEA's average electricity price, annual increases, andself-financing ratios for FY90 through FY99 as currently forecast are shownbelow :
FY90 FY91 FY92 FY93 FY94 FY95 FY96 FY97 FY98 FY99
Average energyprice (B/kWh) 1.61 1.61 1.61 1.67 1.67 1.71 1.71 1.71 1.71 1.71
Price increase - - - 3.61 - 2.4X
Self-financingratio 551 56X 26X 25X 26X 25Z 472 471 411 392
2. Energy sales will grow at 212 in 1990, 192 in 1991, on average 15Xper year in 1992 and 1993, and on average 92 per year between 1993 and 1999,based on projections made by the Load Forecast Working Group. Theseprojections include near-term electricity sales increases which already havebeen contracted in industrial estates, and over the longer term are basicallyextrapolations of recent trends checked against econometric models involvingassumptions on the growth of the gross domestic product.
3. Other Operating Revenues include: (i) revenues from sales ofelectrical equipment, (ii) rent from properties, (iii) revenues frominstallation, inspection and other fees, (iv) revenues from connection fees,(v) revenues from construction for customers, and (vi) miscellaneousrevenues.
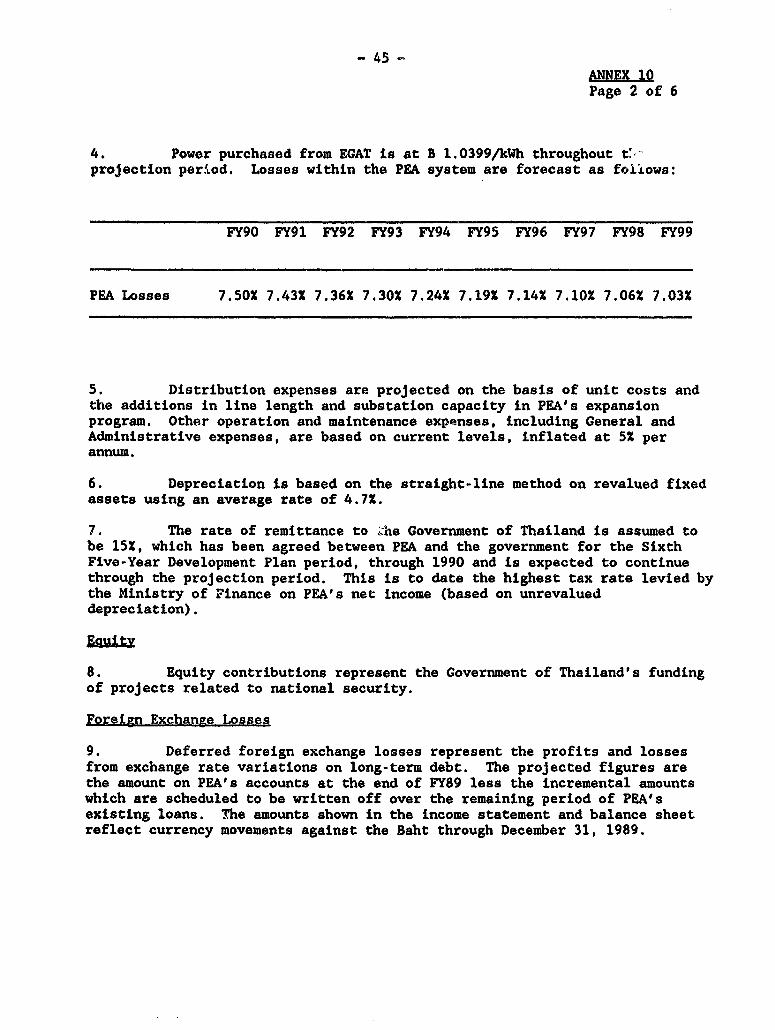
- 45 -
Page 2 of 6
4. Power purchased from EGAT is at B 1.0399/kWh throughout t'>-projection period. Losses within the PEA system are forecast as follows:
FY90 FY91 FY92 FY93 FY94 FY95 FY96 FY97 FY98 FY99
PEA Losses 7.50X 7.431 7.36X 7.30X 7.24X 7.191 7.141 7.10Z 7.061 7.03X
S. Distribution expenses are projected on the basis of unit costs andthe additions in line length and substation capacity in PEA's expansionprogram. Other operation and maintenance expenses, including General andAdministrative expenses, are based on current levels, inflated at 5X perannum.
6. Depreciation is based on the straight-line method on revalued fixedassets using an average rate of 4.71.
7. The rate of remittance to She Government of Thailand is assumed tobe 151, which has been agreed between PEA and the government for the SixthFive-Year Development Plan period, through 1990 and is expected to continuethrough the projection period. This is to date the highest tax rate levied bythe Ministry of Finance on PEA's net income (based on unrevalueddepreciation).
Equ
8. Equity contributions represent the Government of Thailand's fundingof projects related to national security.
Foreign Exchange Losses
9. Deferred foreign exchange losses represent the profits and lossesfrom exchange rate variations on long-term debt. The projected figures arethe amount on PEA's accounts at the end of FY89 less the incremental amountswhich are scheduled to be written off over the remaining period of PEA'sexisting loans. The amounts shown in the income statement and balance sheetreflect currency movements against the Baht through December 31, 1989.
- 46 -ANEX IQPage 3 of 6
Borrowings
10. Future foreign loans have been assumed at annual interest ratesvarying from 2 to 9% and for terms of up to 20 years including from 3 to 10years of grace. Local borrowings have been assumed at the annual interestrate of 5 to 7%, and for terms of 3 to 5 years.
11. Aecounts elivay>lq are projected to be 34 days of revenues.
12. Accounts Dayable are estimated to be 40 days of expenses.

- 47 -
TuajON SYSPlp4*f6
a~~mu%maaR
YeaEnding S3umbur 30 1990 1992 1992 1993 1299 99 1996 1297 1911 19a9
NERMOY SALES (GW4) 17.92 21.322 24,425 2.095 31.173 34.232 37.549 40.554 43.79 47.3SALES NCURA (6) 2 t9 Is 14 II 10 9 * S *
AVERAGE TARF (&tWh) 1.41 1.41 1.41 1.67 1.67 1.71 2.71 1.71 1.71 2.73
OPERATINO REVENUE
ENEROY REVUE 29.037 34.403 9.75 46.767 31.31 S8.437 63.750 49.122 74.660 80.03OTHER OPERATING REV E 4" 901 927 $5 la 37 875 9O 949 1.0I9
TOTAL OPERATING REVENUE 29.901 3304 40.502 47.622 52.733 59.274 64.425 70. 7$.603 1.452
OPERATINO ID3ENIU
PURCHASED POWER 20.208 25.9 27.412 1.456 34.915 .39 41.87S 43.361 48.972 S.t7DUEI AND OIL 16 22 25 29 32 36 40 4S 50 55
OPERATING AND 4ADNTEANCE 3.376 4.732 5,.71 6.350 7342 S.4 9338 W0 11.710 u .n3u4
DEPRECiATION 2.833 3.461 4.020 4.687 5.424 6.103 6.792 757 19 9351
REMITTANCETOGOVERNMENT 369 507 s0 SW 333 852 1012 1.085 1.078 1.058
TOTAL OPERATINO EEN38 2V.33 32.696 37.78 43,129 43346 53.0 59.108 64.563 0.329 7L573
OPERATING INCOME 2.598 260 2.715 4.493 4.187 5.641 5J17 5.473 5.210 5.0
NON - OPERATING INCOME 1.002 1.107 1.074 I.00 911 901 926 654 as 8NON - OPERATING 3P3NSES
INTEREST CHARGED TO OPERATONS 1.242 1.304 1,404 150 I.# 2.167 2J5t 2.9 2,03 3.056
FORP ON EXCHANOE LOSS 374 405 340 us 257 46 267 270 247 225
OTHR 78 so 81 82 34 t6 57 a9 91 92
TOTAL NONOPATWNO EaPNSES 2.695 2.73 1. 2.010 2.161 2.733 2.712 2.913 3.140 338
NCT INCOME (LOSS) 1.9 1.927 .964 3,491 3.005 3.803 3.730 3.403 .025 2.61S
AVEROA RATEASE 28.041 35.437 45.410 $5.077 64.216 72.13 73.611 662 t7 9.229 107.206
RATE OF RN wsL 7.1 5.9 7.4 6S 7.4 6.9 6.4 5. 4.8
OPERATWO tATI (%) 91 93 9 9 92 9D 91 92 93 94
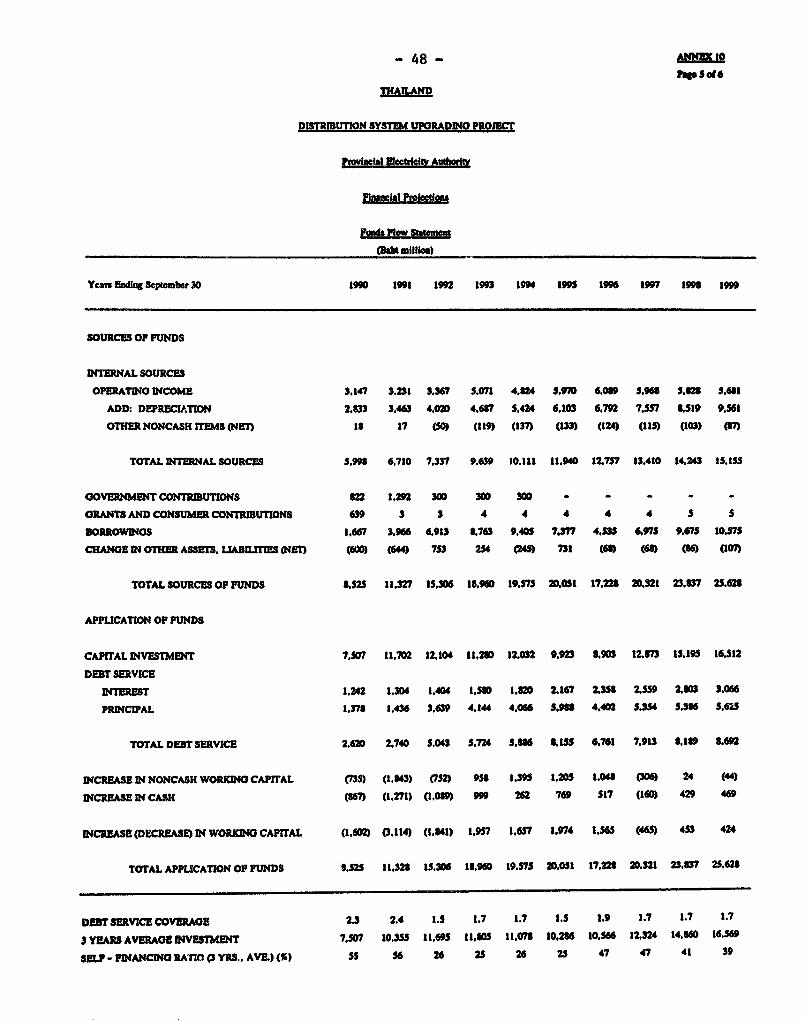
- 48 - A 0
DlSTRIBUTION SYSTrM UPORADINO PROJECT
FPIacial PEIcOlans
FuW l'low stuna
(BaM millice)
Yeas Ending Sepmber 30 90 1991 1992 1993 194 1995 1996 1997 199 1999
SOURCES OF FUNDS
INTERNAL SOURCES
OPERATING INCOMPE 3.147 3,231 3.367 5.071 4.24 S.90 6.069 5.96 5.528 5.61
ADD: DEPREC&ITION 2,333 3.463 4.020 4.697 5.424 6.103 6.792 7.S57 .519 9.561
OTHERNONCASIITEMS (NLT) i8 17 (50 (119) (27 (133) (124) (115) (103) (3
TOTAL INTERNAL SOURCES 5.99 6,710 7.337 9.639 10.111 11.940 12.757 13.410 14.243 t5.t55
GOVERNMENTCONTRBUTIONS 622 1.292 300 300 SW - - - - -
oRANTS AND CONSUMER CONTRIBVTIONS 639 3 3 4 4 4 4 4 5 5
BORROWINGS 1.667 3.966 6.9U3 3.763 9.405 737 4.535 6.975 9.675 10575
CHANGE IN OTHER ASSETS. LIABILIrIES (NET) (600) (64) 753 254 (245) 731 (68) (68) (6 (107
TOTAL SOURCES OF FUNDS 8.525 11.327 15.306 13.969 19.575 2.051 17.223 2.321 23.U37 25.623
APPLICATION OF FUNDS
CAPITAL INVE8TMNT 7.507 11.02 12.104 11,230 12.032 9,923 8903 I2.M73 I5.195 16.512
DEBT SERVICE
U4TEREST 1.242 1.304 1.404 1,530 1.11M 2.167 2.358 2,559 2.80 3.066
PRINCIPAL 1.376 1.436 3.63 4.144 4.066 S.98 4.402 5.354 5.36 5.625
TOTAL DEBT SERVICE 2.620 2.740 5.043 5.724 5.16 3.35 6,761 7.913 8.139 8692
INCREASE IN NONCASH WORlUNO CAPrTAL (735) (1.843) (752) 958 1.395 1.205 1.048 (36 24 (44)
INCREASE IN CASH (867) (1.271) (1.089) 999 262 769 517 (160) 429 469
INCREASE (DECREASE) IN WORKING CAPIrAL (1.60 (3.114) (1.,41) 1,957 1.657 1.974 1.565 (46) 453 424
TOTAL APPLICATION OF FUNDS 3,525 11.328 I.306 13,90 19.575 3,051 17,228 3.321 23.837 25.628
DErBTSERVICECOVERAOE 2.3 2.4 1.5 1.7 1.7 3.5 1.9 1.7 1.7 1.7
3 YEARS AVERAOE INVESTMENT 7.507 10.355 11.695 11,505 13.073 10,216 10.566 12,324 14.860 16.569
SELM - INANCiG RATIO (3 YRS.. AVE.) () 55 56 26 25 26 25 47 47 41 39
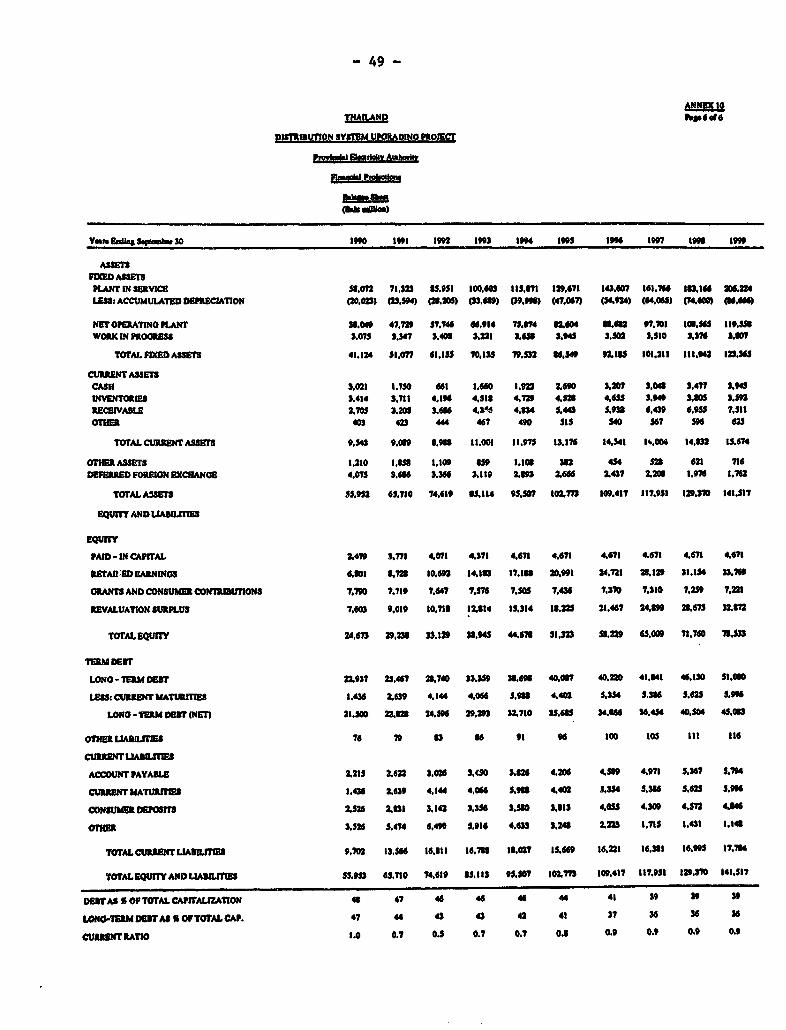
- 49 -
lopE toTHALND %poo(C
D8ilTUT8ON SYSSM1 UPGRDINOG OmCr
YTro 8 Swne 30 8990 I998 92 8995 1994 8995 199 18997 199C 1999
FU8MD ASSETSANT IN SERV8C 5,02 71.323 35.9JI 100.60 815.371 829.671 143.607 8.706 1831.86 2D0.24
LELSS ACCUMULATED D6MECIATION (20.02) (23.59) (23.203) (3.10) (9.901) (47.067) (54.4) (64.065) C7"0) (6.64)
Nt OPERATINO KAr 33.0i 47.729 $7.74 4.914 7S.74 32.40 1.012 97.701 801.565 IM.AM
WORK IN PROGRESS 3.07S 5.347 5.405 3,221 3.6 5.94 3.572 3.510 3.376 3.30?
TOTAL FDX ASSETS 4181.4 $1.077 481.85 70.135 79.532 3" 92.15 101.211 111.94 123.X
CURRENT ASSEWCaSN 3.021 1.750 "4I 1.660 1.9 2.40 3.20?7 .0i 3.477 5.95
INVENTORIES 3.484 3,788 4.189 4,56 4.729 4.52 4.65S 3.949 5.405 3S
RECEVABLE 2.70 3.2S 3SA6W 4.114 4,34 5.443 5.938 6.439 6.95 7,II
O?8M 4" 423 4t4 467 490 1$ 540 567 596 62
TOTAL CURRENT ASSETS 9.545 9,0" 3.93 11.001 11.975 13.175 14.341 14.004 14.332 8674
OTHER, ASSETS 1.210 18.6" 1,109 359 1.103 332 4S4 Su 621 78
DEFE 0tED 1FOREM EXCCANAB 4.07S 3.6A6 3.3 3.1189 235 2.666 2437 2.203 1.974 1.742
TatALAMSET 55.952 64780 74.619 65.114 9U.07 102. 109.417 117.951 129.3 141.517
EQUIY AND LIAU1lIES
ffQurry
IPAD - IN CQ%AL 247 5.771 4.071 4.371 4.671 4.467 4.671 4.671 4.671 4.67
REWTARED EARNINGS 4.401 3.72 10.92 14.13 17.181 20.991 4.72t 2.8129 38I.IS4 33.79
GRANSANDCONSUMERCONiaUTIONS 7.790 t.719 7.607 7,576 7.505 7.436 7.370 7.310 7.25 7.2
REVALUATION SULWUS 7.,6 9.019 10.718 ns .34 85.314 IL3.2 21.467 24.399 2a67s 32.
TOTALEQUrTY 24.673 29.238 35.129 S9IM 44.678 S8.32 58.229 65.009 78.760 71I.33
7TER DEIrT
LONO -IM 1 2.93? 25,467 2.0 33.35109 l69l 40.037 40.220 41.341 4L.30 S.030
LESS: CURWRT EATUIMES 8.434 2.6s9 4.844 4.094 591 4.402 S.54 S.386 5.62 .99"
LONG -TERMOM (NEtn 2I.50 22.3 24.599 29.29) 32.710 35.6115 34.166 36.454 40.S64 45.03
OTnR LIAILn'S 76 79 33 36 98 ff 800 8Os III 116
CURWaufLAULmrEs
ACCOUNT PAYALE 2.215 2.622 3.026 3(50 3.126 4.206 419 4.971 5.367 5764
CURRENT mATuanU 8.436 2.L69 4.44 4.064 5.913 4.402 ,34.334 5,426 56 5.906
CONSUM 0630688s 2,526 2.381 3.142 3,356 S.S3o 5.138 4.055 4.309 4.S72 4.366
oTHER 3.S3 5.474 6.49 S.984 4.63 3.,24 2223 1.78S 8.431 1.148
TOTALCURRENTrL3ITIES 9,702 3,54" 16.111 16.73U 8302?7 IS.659 16.221 16.381 16.995 17.7J4
TOTALEQUANDILTIES SS.953 65,710 74.619 81,.83 95.S07 I027m 109.417 887.9S8 129.70 848,587
OMAS OF TOTALCAPITALIZATION 46 47 46 44 4d 44 481 9 39 59
LON-TMRMD ATl A OF TOrALCAP. 47 4 43 43 42 48 S7 36 33 36
CUrR3W ATIO 8.0 0.7 01 0.7 0.7 0.3 0.9 0.9 0.9 0.9

- 50 -
THALAND
DISW1i1UTION == TQl>DKOnoJ
alrs" _ma A. 1990)
1. i*swaL 7. LAMG MAMWACTUR14O AND bliN045. dsnd2 aooo kw sd o
beip Chagtl Demand Q p 170mo DhaoiwFIM $ kWh 5.00 SAMt aMV QP 1.22 hBakgibWNext 10 kWh 0.70 UahzIkWNext 10 kWh 0.90 aWkWb (m. de_nd of 2000 kW and evNext 10kWb 1.17 BahukWh @14acsseewl o mis )Next 65 kWh 3J6 SahukWh DMea CheepNext 50 kWb 1.68 3aWkWb Peak Ald 15.00 W ahUhWNext 150 kWh 1.76 ShhWkIt PiW Peak ?ade 90.00 Uaok wNext 100 kWh 2.02 DshlkWh OnPut Veid dumnedebeNS 400 kWb 2.11 tahikWh ia p Qup 1.22 Del/ikWlOver 600 kWb 243 DhhukWh
Wmum Qp 5.00 atema L ECTROLYSIS MANUVAC1URO
2 SMALL BU3RE3S Demand ChQp 165.00 Babt/kWOML Demad ltn Om 30 kW) qpChr 1.20 BaaWb
laMp Quige: 9. PUBUC UTWESFir 40 kW 6.12 BaldNon 260 kWb 1.77 BabhukWh 4Ma demad ka dha 30 kW)Next 200 kWb l.U SBskWh ViM10 kwL10 DeftNext S0 kWb 2.21 dikW Ove 10 kWh LIZ BDaUWNext 2000 kWh 2.43 Daht/kWb Mimum QCup 1t20 DltlkWh.Ov 3000 kWI 2J.20 DahikWh
Wd_um Quip 66.12 8Dawb Wm demand 30 kW ad ewaD.mand Quip 167.00 BDkW
3. LARE BUSDISS blAq Qp 1-.3 DahUkWb(Ma De_md 30kw ad over)
At vwltae of lets I 11 CV: 10. GOVHMEDNT OmCEDemand ChQp 239.00 OahtlkW1!r Quip 1.26 DBskWh. EIMt 10 kWh 1t20 Oak
Over 10 kWh 1.#2 BatkWhA voltae o t eql or ve-r 111CV: M m Qu Ci 16.20 WDaBhWbDmand Clae 229.00 BAbVkWEadv Chare 1.23 DabskWb 11. NONPROFITOROAN=ATION
4. ROTELS Firt 10 kWh 16.40 DahtOvew 10 kWh 1.U6 BDeb/kWh
At volutae of ls tbha ICK: MVnmum Chap t.40 BD"IkWbDelma Quep 233.00 Bab/kWley Quipe 1.26 DB/Wh
12. AGRICULTURAL PU0MINAt voltge of equal or over 11 KV:Deand CbQup 216.00 DebaW VM 100 kWh 117.00 DbsEncu Chap 1.23 BsasWb Ovet 100 kWh 1.17 DabkWh
Mlnun Qup 16.40 aBWkWbS. SMALL MNUFACTURING & MININO
&ax. Demand 30.499 kW) NOM6. 1. Numben 5.6.7 adI an euneotly dtamftd4lOx beah Demad ad EMyp QAus
Dema_d Chage 177.00 BahUWnariy Chae 1.23 DabskWh 2. The mIinimu dhag r ambeue 3.4
S.6.7 mad 9 on caleulat d ie 30% of tbe6. MEDIUM MANUFACUVINO &lW N higbe maximum demand of I pt 12 mon_h
(Max. Demand 500-199 kW)
Dcnund Cuip 174.00 DShlkW!Mzu Cui 1.23 Das/kwbh

- SA -NNE 12
DISTR18UTION SYSTEM UPGRADINO PRO
Calculation of Inernal Rto of Retum
(All codain Dah MiHle)
'eb -Capital Jaeatmenta-
Fiscal lucr. Energy her. Electr. Project Dist,. Subst. Oper. Total Net
Year Enersy Codt Sales Reeue nvent. Pcil. Added Coat Cost Bceefit
(Owb) (wb)_
1991 - - - - _ - _ _ _ _
1992 - - - - 618 - - 9 627 (627)
1993 - - - - 930 - - 23 9S3 (9S3)
1994 - - - - 168 - - 25 193 (193)
1995 - - - - 0 - - 25 25 (25)
1996 147 153 138 220 0 63 0 54 270 (50)
1997 927 964 871 1.3S6 332 166 201 1.663 (c7)
1998 1,658 1.724 1.558 2.479 308 413 342 2,787 (308)
1999 2,488 2,5S7 2.338 3,720 345 413 503 3.,48 (128)
2000 3,343 3,476 3,142 5.000 3S7 413 668 4,914 a5
2001 4,230 4,399 3,976 6,326 364 436 839 6.038 2S8
2002 5.144 5,349 4.836 7.693 369 471 1,016 7.20S 4S8
2Q03 6.104 6,347 5,738 9,129 388 471 1,201 8,407 721
2C04 7.113 7.397 6.686 10,637 405 471 1.395 9.668 970
2005 8,172 8,498 7,681 12,221 422 494 1,599 11,013 1,208
2006 9.282 9.653 8.725 13,882 442 530 1.813 12,438 1,444
2007 10.454 10,872 9,827 15.63S 458 317 2,035 13,682 1.953
2008 10.454 10,872 9,827 15,635 0 0 2.035 12,907 2,728
2009 10,454 10.872 9,827 15.635 0 0 2,035 12.907 2,728
2DIO 10,454 10.872 9,827 15.635 0 0 2,035 12,907 2,728
2011 10,454 10,S72 9,827 15,635 0 0 2.035 12,907 2.728
2012 10,454 10.872 9,827 15,635 0 0 2,035 12,907 2,728
2013 10.454 10,872 9,827 15,63S 0 0 2,035 12.907 2,728
2014 10,454 10,872 9,827 15,635 0 0 2,035 12,907 2,728
2015 10,454 10,872 9,827 15,635 0 0 2,035 12.907 2,728
2016 10.454 10,872 9,827 15.635 0 0 2,035 12,907 2,728
2017 10.454 10,72 9,827 15,635 0 0 2.035 12.907 2.728
'4018 10,454 10,872 9,827 15,635 0 0 2,03S 12,907 2,728
2019 10,454 10,872 9,827 15,635 0 0 2.035 12,907 2,728
2020 10,454 10.872 9,927 15.635 (89) (1,410) (1,425) 2.035 10.072 5.563
*a Evaluated at 1.04 B/kWh
*b Evaluated at 1.59 B/kWh
Intenal Rate of Return
Btu Can 17.3%
Capital and opeat cm
Ineeaad by 30% - 15.3%
Eewy smale reduced by 10% 14.8%

D21SIRIBU1N MM=l 92RIN P86=C
List of Docuw its In Project PFe
Al. PEXs lnvestment Program
A.2. PEKs Load Forecast
A.3. List of PEA Board Members
B. Einanial Remort
B.1. PEKs Annual Report FY88
B2. PEA:s Annual Report, FY89
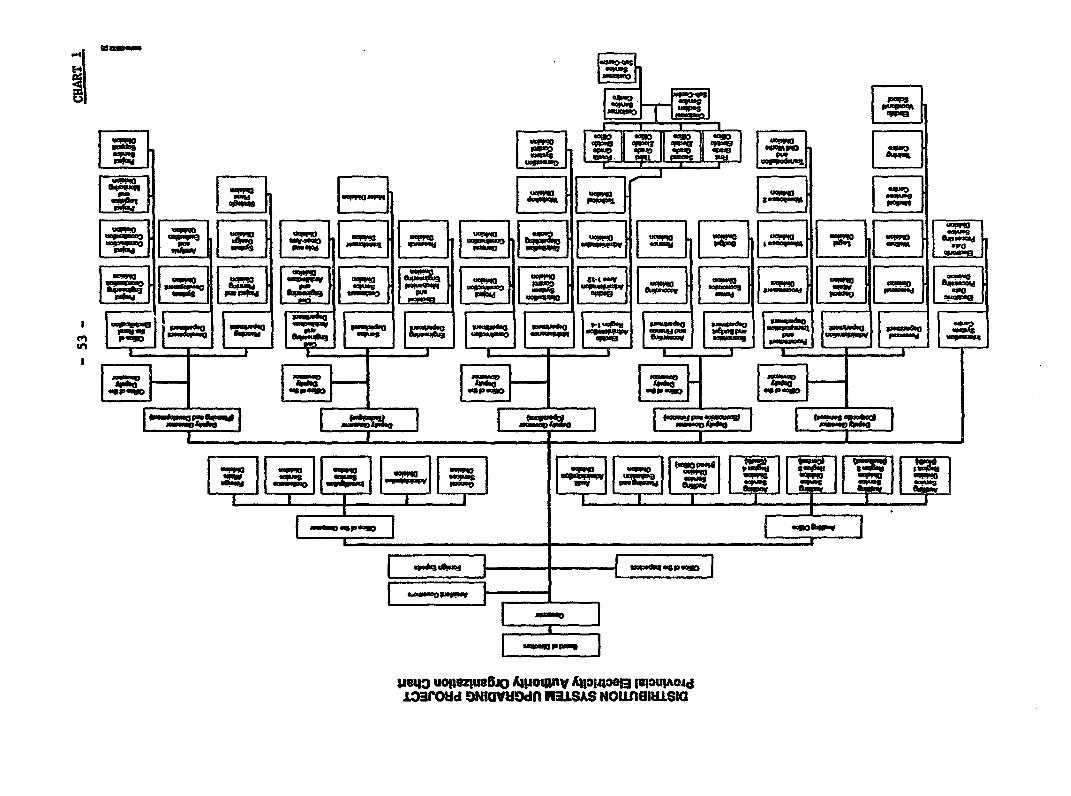
~~~~~~~~~~~4j ~ ~ ~ ~ ~ ~ ~ ~ ~ ~ ~ ~ ~ ~ ~ ~ ~ ~ C
ORIM 0*00~~~~~~~~~~~~~~~03
11 i Hj S i ' ' Et=E3 X11
in
[ffi1~~~~~~~~~Laru DNOUtf RI.A NOIJflUI&LL H SIO[ 1
' X ~~~~~~~~LM
I~~~~~~ I
t uogez|ue0o 41loqln AU*14*98l8 {quIuo-133roud uNavwdn ras Nouninuisto
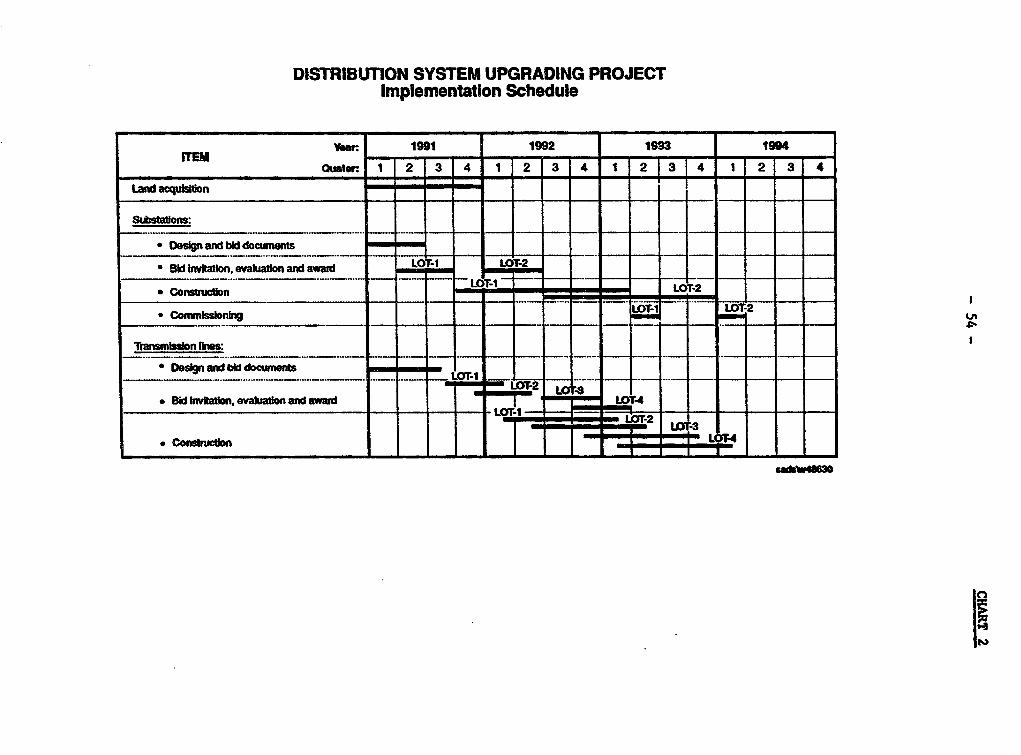
DISTRIBUTION SYSTEM UPGRADING PROJECTImplementation Schedule
Year. 1991 1992 1993 1994
Ouateq 1 2 3 34 -1 -2 34 1 1 2 13 14 1 2 3 4
Ladacqu-ion --
Substaions:
* Design and bid docmnents
* kwiwaton, evaon ialon and award .. - LCT-2
Corns_uction - - LOT2* Cwnmi s slonirg _ , _._ = = LOT-1i...... _ LOT-2 _ ....................T
Tranismissin Orues:
* Design and bid domet_
* Bid wfmaon. eva_aton and awad _LOT
• _nst - ru _ r- _ Lon* Consnclin __ - _ m -13 r-
6S~~~~~I
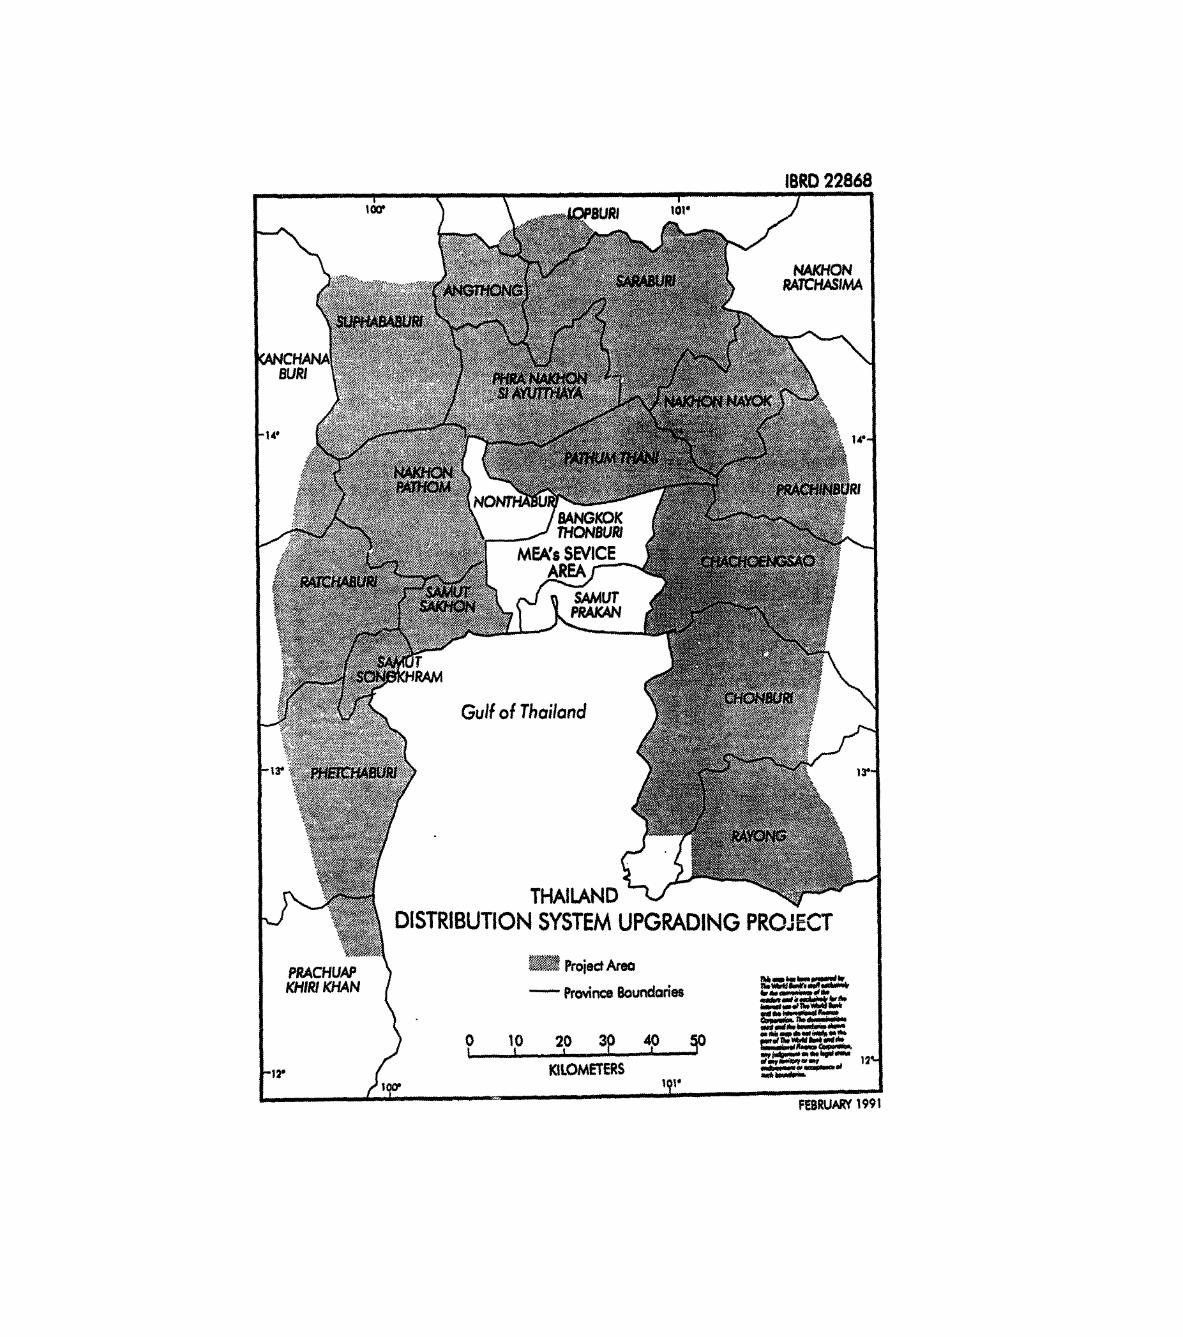
IBRD 22868
PRACHUAP 6 w ProjedAreoRATHMIM
lf40lN 14N 1 -Pr>inx BouRl 1O
d'~~~~~~~~~~ +
)~~Gl of Thilond
-12@ f K~~THILANDTR '
t1t~~~~~~. ._
.
49 ./0 2044
IBUTION ILSYSTEMRPRAIGPRJC
FEPRUARYj les