working together.* - pwc · for both internal management of all business taxes and transparency...
TRANSCRIPT
Working together.*Energy Sector Income Tax Benchmarking Study
IndustriesEnergy, Utilities and Mining
2
Income taxes are a significant cost to a corporation. Tax professionals must control and manage this cost in the quest to create shareholder value but also be aware of the increasing scrutiny and public debate over income taxes.
3
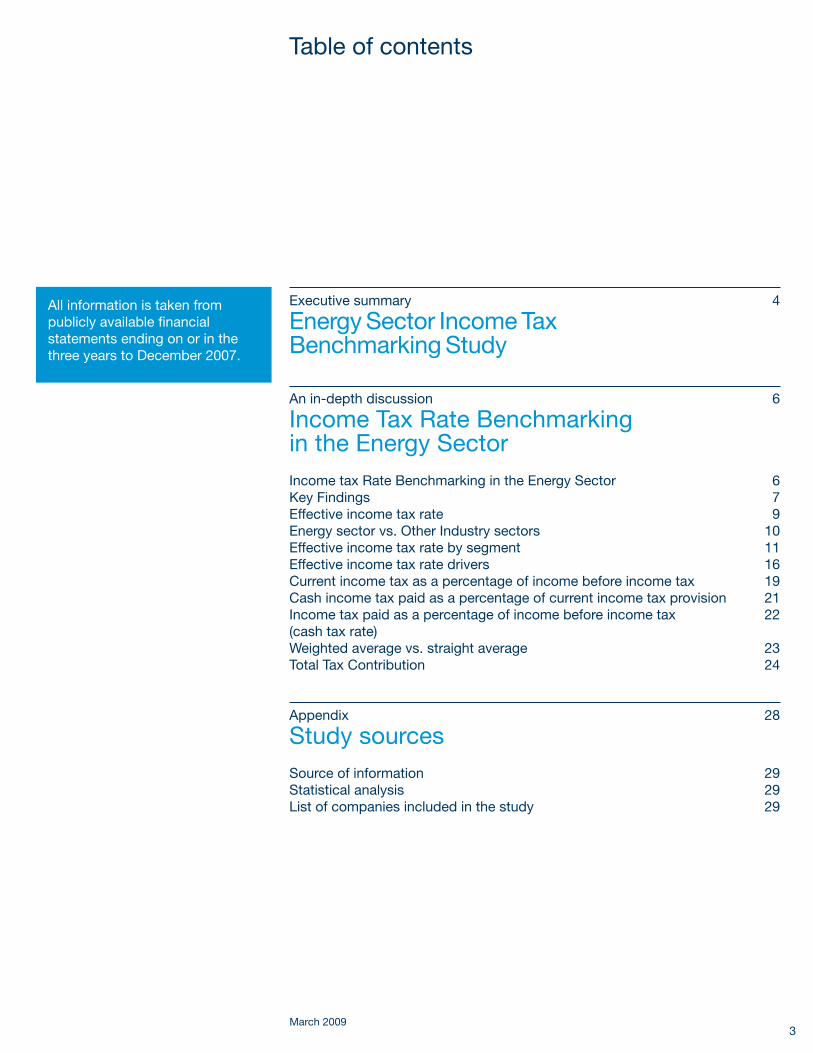
Table of contents
Executive summary 4
Energy Sector Income Tax Benchmarking Study
An in-depth discussion 6
Income Tax Rate Benchmarking in the Energy SectorIncome tax Rate Benchmarking in the Energy Sector 6Key Findings 7Effective income tax rate 9Energy sector vs. Other Industry sectors 10Effective income tax rate by segment 11Effective income tax rate drivers 16Current income tax as a percentage of income before income tax 19Cash income tax paid as a percentage of current income tax provision 21Income tax paid as a percentage of income before income tax 22 (cash tax rate)Weighted average vs. straight average 23Total Tax Contribution 24
Appendix 28
Study sourcesSource of information 29Statistical analysis 29List of companies included in the study 29
March 2009
All information is taken from publicly available financial statements ending on or in the three years to December 2007.

4
Executive summary
Energy Sector Income Tax Benchmarking Study

5
A current challenge for the tax professional is to identify the right balance when planning for income taxes. On one side of the balance, income taxes are a significant cost to the corporation and should be controlled and managed in the quest to create shareholder value and maximise earnings per share. On the other side, the amount of income tax paid by large corporations is coming under increasing scrutiny and public debate.
Income tax disclosures in annual reports are an important insight into a company’s tax affairs with the effective income tax rate (ETR) being the headline rate commonly quoted by chief financial officers when discussing their company’s income tax affairs in the annual report. Tax is increasingly found on Board Room agendas with directors taking a greater interest in their company’s tax strategy and how it is being identified and managed. This study will give some insight to tax departments as they review their income tax strategy, provide information on where they stand compared to their peer group and allow them to compare the drivers of their effective income tax rate with other companies. A bespoke presentation can be prepared for any company on request.
Our financial analysis was based on a number of income tax ratios which could be derived from publicly available information. The use of information that was publicly available meant that we could include any listed company, giving us a good overview from which to draw our conclusions. It is important to note that our study shows a high level picture of key income tax ratios. The data is sourced from a data provider and checked to annual reports for quality assurance. We have not adjusted for one-off distorting items or losses. (Our in-depth Income Tax Rate Benchmarking studies, carried out on smaller peer groups, drill down to underlying or adjusted ETR). In this study for any particular year, losses, income tax refunds, exceptional items can be drivers of the individual company ETR, although by taking a statistically trimmed sample, the impact of these on the study conclusions are minimised. Profit sharing agreements are common in this sector and it is important to note that this study does not take account of payments to government under such agreements.
In this report, we present the results of the survey. Our population comprises 37 of the largest Energy companies. The companies can be split into the following segments: Integrated Oil & Gas (13 companies), Exploration & Production (11 companies) and Energy Services (13 companies). The location of the companies (by country of incorporation) in the study can be seen from the chart below.
Num
ber
of c
omp
anie
s
Integrated Oil and Gas Exploration and Production Energy Services
Bermuda Cayman Islands Australia Japan Thailand India Hong Kong Norway Netherlands Spain Brazil Russia Italy France UK Canada US
Location of place of incorporation of companies in the study
0
2
4
6
8
10
12
14
Executive summary
• PricewaterhouseCoopers(PwC)have carried out a study of key tax ratios derived from publicly available information for 37 of the largest global Energy companies.
• Thepurposeofthestudyistoprovidedata on key tax ratios of these Energy companies for use both by individual companies in benchmarking and strategy discussions and by the industry as a whole.
• ThestudyshowsthattheaverageETR of the thirty seven companies reviewed was 33.6%. This average falls at the top of all industry sectors we have studied.
• TheIntegratedOil&Gascompaniesreviewed had the highest ETRs (average 41.7%) followed by Exploration & Production companies (average ETR 33.8%). Foreign operations were a significant unfavourable driver of these rates. Integrated Oil & Gas companies, with a more international nature, are subject to high income tax rates specifically applicable to oil companies in many jurisdictions on profits that are not portable. Exploration & Production companies reviewed tended to have a smaller foreign footprint with a lower ETR resulting.
• Bycontrast,EnergyServicescompanies generate profits that are more portable and these companies are generally not subject to the incremental income taxes often imposed on Integrated Oil & Gas and Exploration & Production companies. As a result, ETRs were lower (average 27.7%).
• Theaveragecashtaxrateincreasedby 4.2 percentage points over the last three years for the companies reviewed, emphasising an increasing tax cost for these companies
• Energycompaniespaymanytaxesother than corporation tax and there is often little transparency around these other taxes. Industry taxes such as excise duties, employment taxes, property taxes and environmental taxes can be significant. This has implications for both internal management of all business taxes and transparency over reporting of all business taxes paid.
• Abespokestudycanbepreparedfor any company on request to allow company tax departments to benchmark themselves against a relevant peer group.

6
An in-depth discussion
Income Tax Rate Benchmarking in the Energy Sector
7
In this study, we analyzed four key income tax ratios:
• Effectiveincometaxrate(ETR):Thisistheincometaxprovisionasapercentage of income before tax taken from the face of the income statement. It gives a basic analysis of the impact of income tax on results.
• Currentincometaxrate:Thisisthecurrentincometaxprovisionasapercentage of income before tax where current income tax is that element of the total income tax charge that is not deferred. Comparing this ratio to the effective income tax rate gives an indication of the impact of deferred income tax.
• Cashincometaxrate:Thisisthecashincometaxpaidasapercentageofincome before tax, where cash income tax paid is the amount of income tax paid during the period. It gives an indication of the true cost of income tax to the company.
• Cashincometaxpaidasapercentageofcurrentincometaxprovision:this
ratio may give an indication of the level of income tax reserves included in the current period income tax provision. Assuming fairly constant profits, cash income tax paid during the year should be approximately equal to the current income tax provision recorded during the same period. A lower ratio indicates that the current income tax provision is higher than the cash income tax paid during the year and, as a result, there may be an element of income tax reserves within the current income tax provision.
Key Findings
• Ofthe37companiesinthestudy,allcompanieswereprofitableandpaidincome tax in all three years. The ETR of the companies averaged over the three year period covered by the study was 33.6%.
• IncomeTaxRateBenchmarkingstudieshavebeencarriedoutforanumber of industry sectors. An average of 33.6% for the Energy sector falls at the top of all industry sectors we have studied. We found the Telecom sector to have the lowest ETR, perhaps as a result of the losses in this industry and the Retail & Consumer sector to have the highest ETR apart from Energy. The high ETR of the Retail & Consumer sector can be partly attributed to the domestic nature of these companies and the resulting limitations on some elements of cross border tax structuring.
• Thecompaniesinthestudywerefurtherdividedintothreesegments.companies within the Integrated Oil & Gas segment had the highest ETRs, followed by companies in the Exploration & Production segment. The lowest ETRs were seen in the Energy Services segment. The ETR in the Integrated Oil & Gas segment is the highest of any industry we have studied, and the Energy Services ETR was among the lowest.
• Asignificantdifferencebetweenthesegmentswasforeignoperations.This was an unfavourable driver for the companies operating in the Integrated Oil & Gas and Exploration & Production segments but a favourable driver for Energy Services companies. This reflects the more international nature of the Integrated Oil & Gas companies, which are subject to high income tax rates specifically applicable to oil companies in many jurisdictions, on profits that are not portable. The Exploration & Production segment tended to have a smaller foreign footprint when contrasted to the Integrated segment, with a lower ETR resulting.
An in-depth discussion

8
• TheEnergyServicessegmentprovidesservicesinthesamecountriesthat the Exploration & Production and Integrated Oil & Gas companies operate in, but their ETRs are lower as a segment. This is driven by several factors. Services companies are, in many countries, subject to simpler withholding income tax regimes, gross receipts income tax or a deemed profit regime at rates lower than those imposed on the Integrated and Exploration & Production companies. The incremental income taxes often imposed on exploration and production activities are generally not imposed on the activities of Energy Services companies. In addition, the Services sector generates profits that are more portable, and thus more income tax planning opportunities exist. Finally, many Services companies are located in low income tax jurisdictions.
• BoththeCurrentIncomeTaxRateandCashIncomeTaxRateincreasedbya few percentage points over the last three years, the current income tax rate rose by 2.6% and the cash income tax rate by 4.2%. This is in contrast to the ETR which decreased marginally by 0.4% over the three years.
• Corporateincometaxisonlypartofthetotaltaxcontributionmadebycompanies. Other business taxes include property taxes, employment taxes, environmental taxes and industry taxes. This has implications for both internal management of all business taxes and transparency over reporting of all business taxes paid.
9
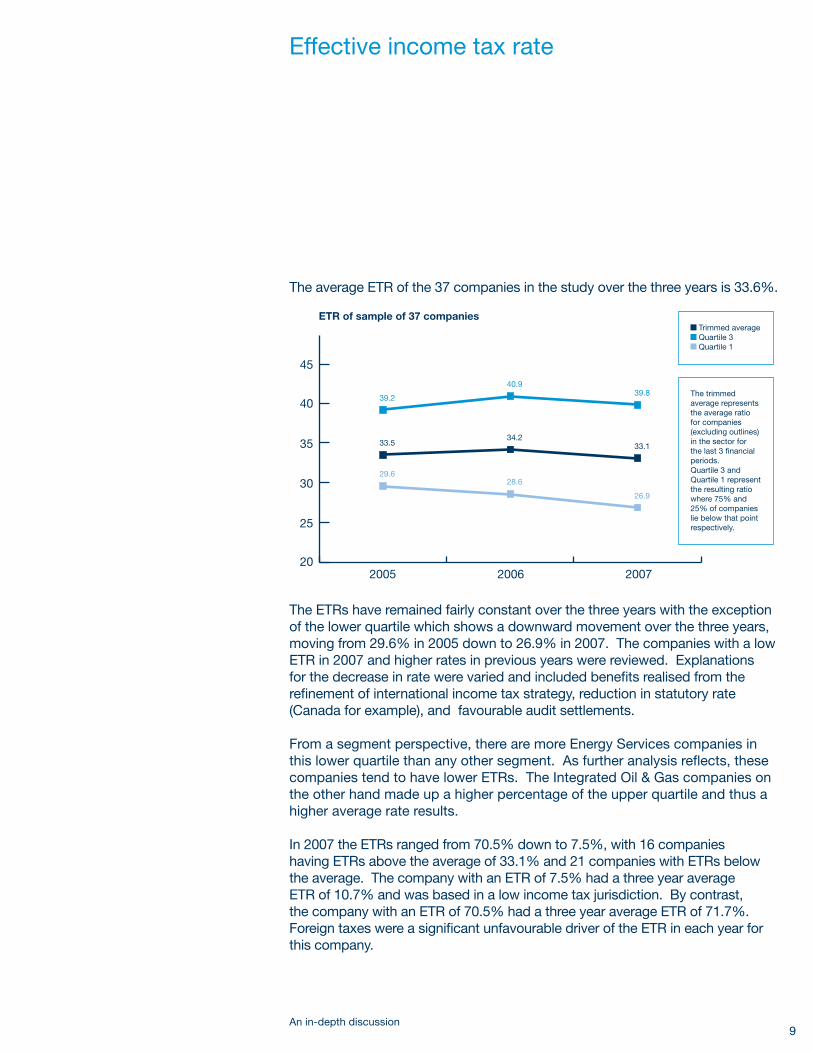
The average ETR of the 37 companies in the study over the three years is 33.6%.
2005 2006 2007
40
45
35
30
25
20
The trimmed average represents the average ratio for companies (excluding outlines) in the sector for the last 3 financial periods.Quartile 3 and Quartile 1 represent the resulting ratio where 75% and 25% of companies lie below that point respectively.
ETR of sample of 37 companies Trimmed average Quartile 3 Quartile 1
39.2
33.5
29.6
40.9
34.2
28.6
39.8
33.1
26.9
The ETRs have remained fairly constant over the three years with the exception of the lower quartile which shows a downward movement over the three years, moving from 29.6% in 2005 down to 26.9% in 2007. The companies with a low ETR in 2007 and higher rates in previous years were reviewed. Explanations for the decrease in rate were varied and included benefits realised from the refinement of international income tax strategy, reduction in statutory rate (Canada for example), and favourable audit settlements.
From a segment perspective, there are more Energy Services companies in this lower quartile than any other segment. As further analysis reflects, these companies tend to have lower ETRs. The Integrated Oil & Gas companies on the other hand made up a higher percentage of the upper quartile and thus a higher average rate results.
In 2007 the ETRs ranged from 70.5% down to 7.5%, with 16 companies having ETRs above the average of 33.1% and 21 companies with ETRs below the average. The company with an ETR of 7.5% had a three year average ETR of 10.7% and was based in a low income tax jurisdiction. By contrast, the company with an ETR of 70.5% had a three year average ETR of 71.7%. Foreign taxes were a significant unfavourable driver of the ETR in each year for this company.
Effective income tax rate
An in-depth discussion
10
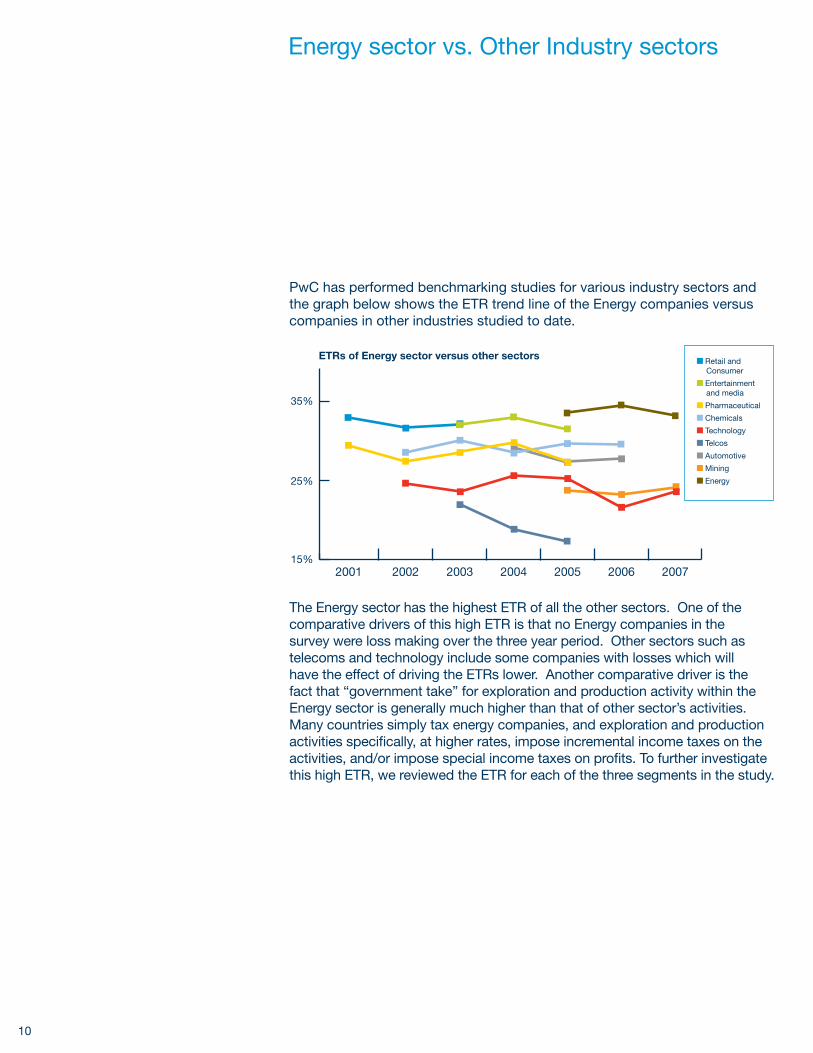
PwC has performed benchmarking studies for various industry sectors and the graph below shows the ETR trend line of the Energy companies versus companies in other industries studied to date.
2001 2002 2004 20062003 2005 2007
35%
25%
15%
ETRs of Energy sector versus other sectors Retail and Consumer
Entertainment and media
Pharmaceutical
Chemicals
Technology
Telcos
Automotive
Mining
Energy
The Energy sector has the highest ETR of all the other sectors. One of the comparative drivers of this high ETR is that no Energy companies in the survey were loss making over the three year period. Other sectors such as telecoms and technology include some companies with losses which will have the effect of driving the ETRs lower. Another comparative driver is the fact that “government take” for exploration and production activity within the Energy sector is generally much higher than that of other sector’s activities. Many countries simply tax energy companies, and exploration and production activities specifically, at higher rates, impose incremental income taxes on the activities, and/or impose special income taxes on profits. To further investigate this high ETR, we reviewed the ETR for each of the three segments in the study.
Energy sector vs. Other Industry sectors
11
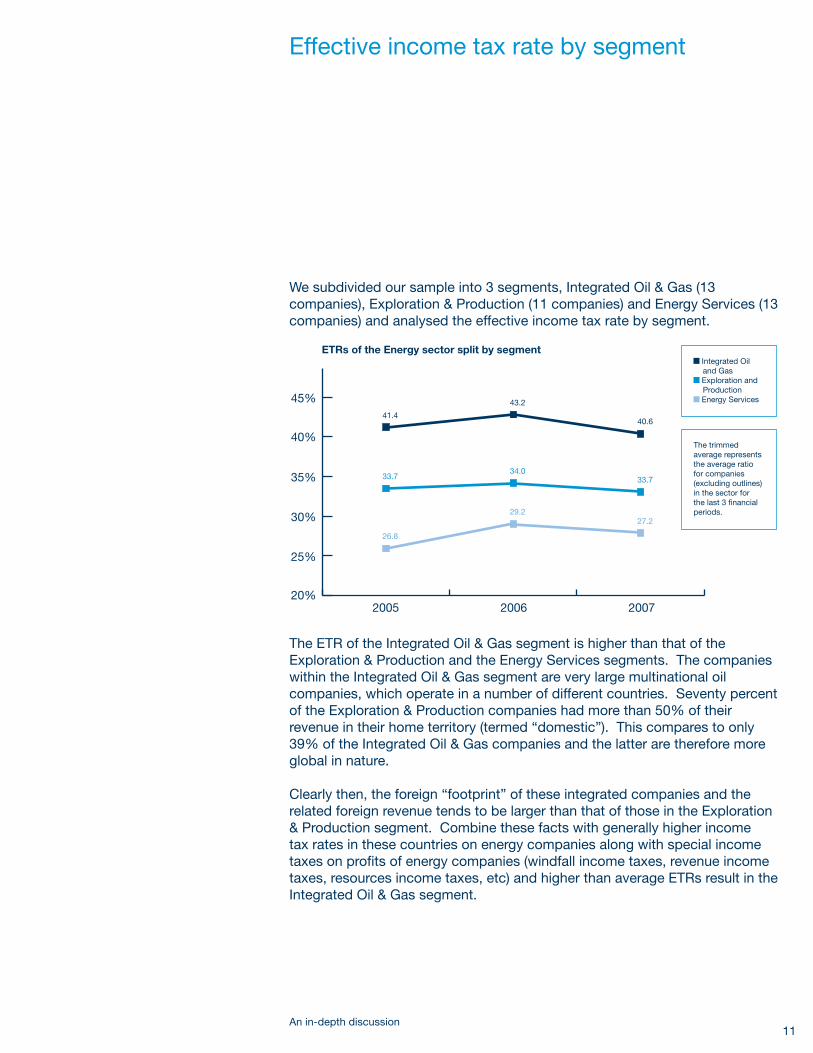
We subdivided our sample into 3 segments, Integrated Oil & Gas (13 companies), Exploration & Production (11 companies) and Energy Services (13 companies) and analysed the effective income tax rate by segment.
2005 2006 2007
40%
45%
35%
30%
25%
20%
The trimmed average represents the average ratio for companies (excluding outlines) in the sector for the last 3 financial periods.
ETRs of the Energy sector split by segment Integrated Oil and Gas
Exploration and Production
Energy Services
41.4
33.7
26.8
43.2
34.0
29.2
40.6
33.7
27.2
The ETR of the Integrated Oil & Gas segment is higher than that of the Exploration & Production and the Energy Services segments. The companies within the Integrated Oil & Gas segment are very large multinational oil companies, which operate in a number of different countries. Seventy percent of the Exploration & Production companies had more than 50% of their revenue in their home territory (termed “domestic”). This compares to only 39% of the Integrated Oil & Gas companies and the latter are therefore more global in nature.
Clearly then, the foreign “footprint” of these integrated companies and the related foreign revenue tends to be larger than that of those in the Exploration & Production segment. Combine these facts with generally higher income tax rates in these countries on energy companies along with special income taxes on profits of energy companies (windfall income taxes, revenue income taxes, resources income taxes, etc) and higher than average ETRs result in the Integrated Oil & Gas segment.
Effective income tax rate by segment
An in-depth discussion

12
We reviewed the individual ETRs of the Integrated Oil & Gas and Exploration & Production companies. Each line on the following chart represents a company. It can be seen that while some companies have very high ETRs in both the Exploration & Production and Integrated Oil & Gas segments, the range (eliminating the outliers) in 2007 for the Exploration & Production companies (19.4% to 40.9%) is smaller than for the integrated companies (15.3% to 53.6%). Three of the companies in the Integrated Oil & Gas segment with a higher ETR have less than 50% of their revenue in their home territory (ie are “global”), although a further two are “domestic” in nature.
2005 20052006 20062007 2007
Integrated Oil and Gas Exploration and Production
80%
10%
20%
30%
40%
50%
60%
70%
0%
ETRs of Exploration and Production and Integrated Oil and Gas companies by company
In benchmarking studies for other sectors, we have found that global companies tend to have a greater ability to lower their income tax rate using international and cross-border planning. Profits may be earned in territories that have statutory income tax rates lower than the statutory income tax rate in the parent company’s location. As opportunities arise to undertake cross-border income tax planning, a benefit can be taken from differences in income tax regimes and specific operations can be located in income tax efficient locations. However, since energy companies have to operate in the countries where the oil and gas is located, they are required to pay the rates of income tax levied in these territories as often times there is little income tax planning feasible. As noted above, these rates are often in excess of the general income tax rates in the country. Further, the energy companies generally require large multiyear capital investments in exploration, as well as refining and chemical operations. These investments also tend to result in less cross border planning opportunities.

13
A more detailed analysis of the Energy Services segment, compared to the Integrated Oil & Gas and Exploration & Production segments yields some interesting observations. All the energy services companies had more than 50% of their revenue outside their home territory. While these companies obviously provide services in the same countries that the exploration and production and integrated companies operate in, their ETRs are clearly lower as a segment. This is driven by several factors. Services companies are, in many countries, subject to simpler withholding income tax regimes, gross receipts income tax or a deemed profit regime at rates lower than those imposed on the integrated and exploration and production companies. The incremental income taxes often imposed on exploration and production activities are generally not imposed on the activities of energy services companies. In addition, the services sector generates profits that are more portable, and thus more income tax planning opportunities exist. Finally, many service companies are located in low income tax jurisdictions.
Further detail on the three segments and the range of ETRs in each segment is shown below:
2005 2006 2007
40%
45%
50%
35%
30%
25%
20%
ETRs of the Integrated Oil and Gas segment
Trimmed average Quartile 3 Quartile 1
46.8
41.4
37.5
51.8
43.2
35.6
46.0
40.6
33.0
An in-depth discussion

14
2005 2006 2007
40%
45%
50%
35%
30%
25%
20%
ETRs of the Exploration and Production segment
Trimmed average Quartile 3 Quartile 1
39.3
33.7
28.2
43.3
34.0
27.3
40.4
33.7
26.7
2005 2006 2007
40%
45%
50%
35%
30%
25%
20%
ETRs of the Energy Services segment
Trimmed average Quartile 3 Quartile 1
31.6
26.8
22.7
32.0
29.2
25.9
32.1
27.2
21.9
15An in-depth discussion
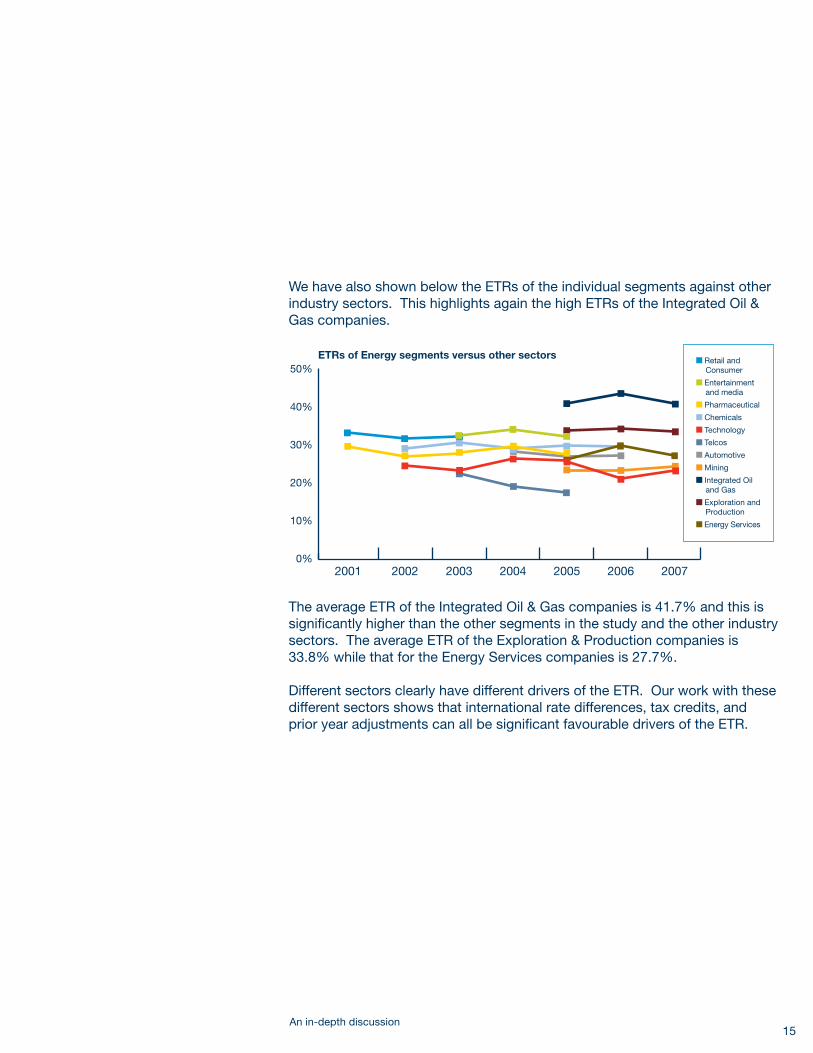
We have also shown below the ETRs of the individual segments against other industry sectors. This highlights again the high ETRs of the Integrated Oil & Gas companies.
2001 2002 2004 20062003 2005 2007
50%
10%
20%
30%
40%
0%
ETRs of Energy segments versus other sectors Retail and Consumer
Entertainment and media
Pharmaceutical
Chemicals
Technology
Telcos
Automotive
Mining
Integrated Oil and Gas
Exploration and Production
Energy Services
The average ETR of the Integrated Oil & Gas companies is 41.7% and this is significantly higher than the other segments in the study and the other industry sectors. The average ETR of the Exploration & Production companies is 33.8% while that for the Energy Services companies is 27.7%.
Different sectors clearly have different drivers of the ETR. Our work with these different sectors shows that international rate differences, tax credits, and prior year adjustments can all be significant favourable drivers of the ETR.
16
Effective income tax rate drivers
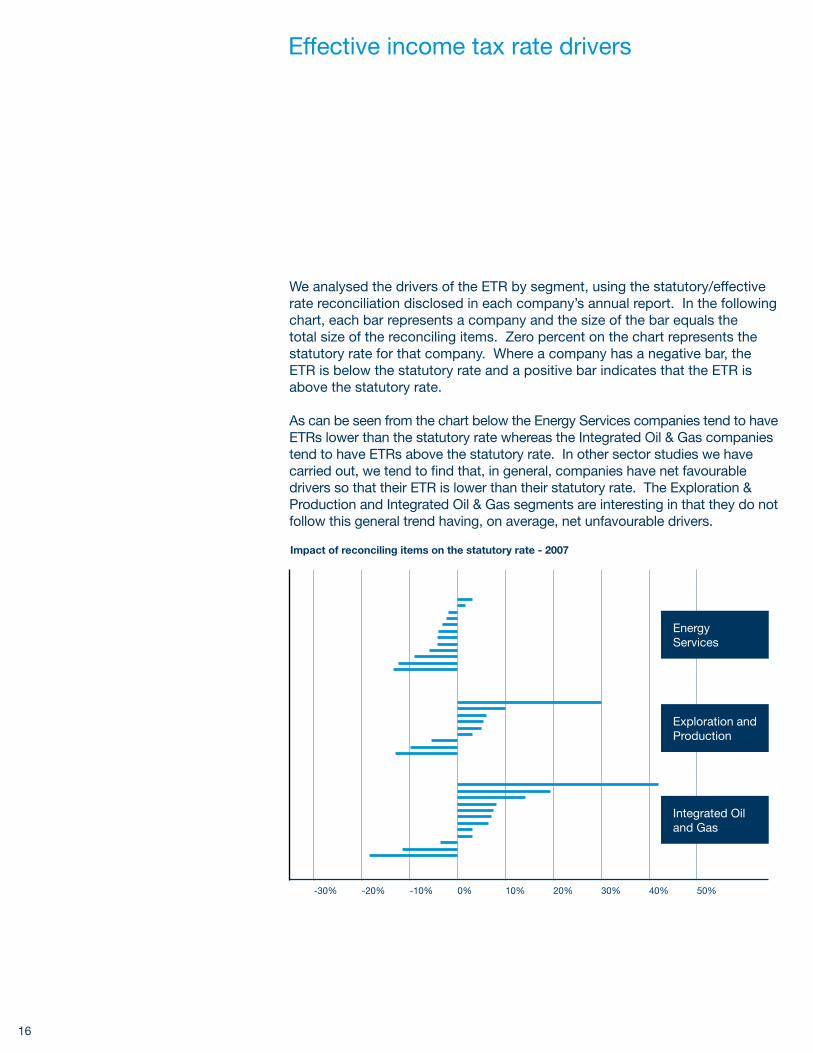
We analysed the drivers of the ETR by segment, using the statutory/effective rate reconciliation disclosed in each company’s annual report. In the following chart, each bar represents a company and the size of the bar equals the total size of the reconciling items. Zero percent on the chart represents the statutory rate for that company. Where a company has a negative bar, the ETR is below the statutory rate and a positive bar indicates that the ETR is above the statutory rate.
As can be seen from the chart below the Energy Services companies tend to have ETRs lower than the statutory rate whereas the Integrated Oil & Gas companies tend to have ETRs above the statutory rate. In other sector studies we have carried out, we tend to find that, in general, companies have net favourable drivers so that their ETR is lower than their statutory rate. The Exploration & Production and Integrated Oil & Gas segments are interesting in that they do not follow this general trend having, on average, net unfavourable drivers.
Impact of reconciling items on the statutory rate - 2007
-30% -20% -10% 0% 10% 20% 30% 40% 50%
Energy Services
Exploration and Production
Integrated Oil and Gas

17
The reconciling items, as disclosed in the statutory/effective rate reconciliation were analyzed, collated and averaged over the sample. In the chart below, the statutory rate is along the 0% line and the bars show how favourable (positive) or unfavourable (negative) each driver is. The impact of each driver has been averaged over all companies in the segment.
15%
-5%
0%
5%
10%
-10%
Analysis of reconciling items - 2007 Foreign operations
Tax credits
Other
Change in tax law
Unrecognized losses / Benefits
Other, PwC description
Equity accounting
Permanent differences
Valuation allowance
State and Local Income tax
Integrated Oil and Gas Exploration and Production Energy Services
Foreign operationsBy operating in foreign jurisdictions companies are subject to foreign rates of corporate income tax. For most industry sectors this is a benefit as certain jurisdictions tax income at lower rates than the parent location and it is therefore potentially beneficial for companies to set up and concentrate operations in these lower income tax jurisdictions. However oil and gas reserves are situated in specific locations and if companies want to extract the reserves, they usually have to pay higher income taxes. These two situations are seen clearly above, where the oil producers (Integrated Oil & Gas and Exploration & Production) suffer an adverse income tax driver by operating in foreign jurisdictions but the Energy Services companies, which seem to have more freedom in where they locate and clearly more favourable income tax regimes in those locations, have a favourable income tax driver from operating in foreign jurisdictions. An Energy Services company operating in the Cayman Islands where the statutory rate is 0% will show an unfavourable driver due to foreign operations outside the Cayman Islands. Removing such companies from the chart above increases the foreign operations driver for the Energy Services companies from -1.5% to -3.2%.
An in-depth discussion

18
Change in the income tax lawJurisdictions are looking to become more competitive in terms of their general income tax rates to ensure they continue to attract investment. On the previous page, the chart shows that companies in the Integrated Oil & Gas segments and the Exploration & Production segments benefited from these income tax law changes. After reviewing the accounts of the companies with these benefits it was found that declining income tax rates in Canada was one of the main jurisdictions that influenced this driver.
Equity accountingCompanies operating joint ventures account for these operations under equity accounting rules. This results in an after income tax item being brought into the consolidated profit and loss account above the profit before income tax line, resulting in a reconciling item to remove this from the effective rate. Three Integrated Oil & Gas companies are responsible for the significant favourable driver seen here. By contrast, although two Exploration & Production companies also report an equity accounting reconciling item, the percentage impact is much smaller.
Income tax credits Credits are offered by jurisdictions as incentives and may affect a company’s economic decision making. Income tax credits are present in all segments but are most significant for the Integrated Oil & Gas segment. Descriptions of the income tax credits included Research and Development Credit, Domestic Manufacturer’s deduction, Income tax incentive, Federal abatement credits, and Uplift (an investment type income tax credit).
19
Current income tax as a percentage of income before tax
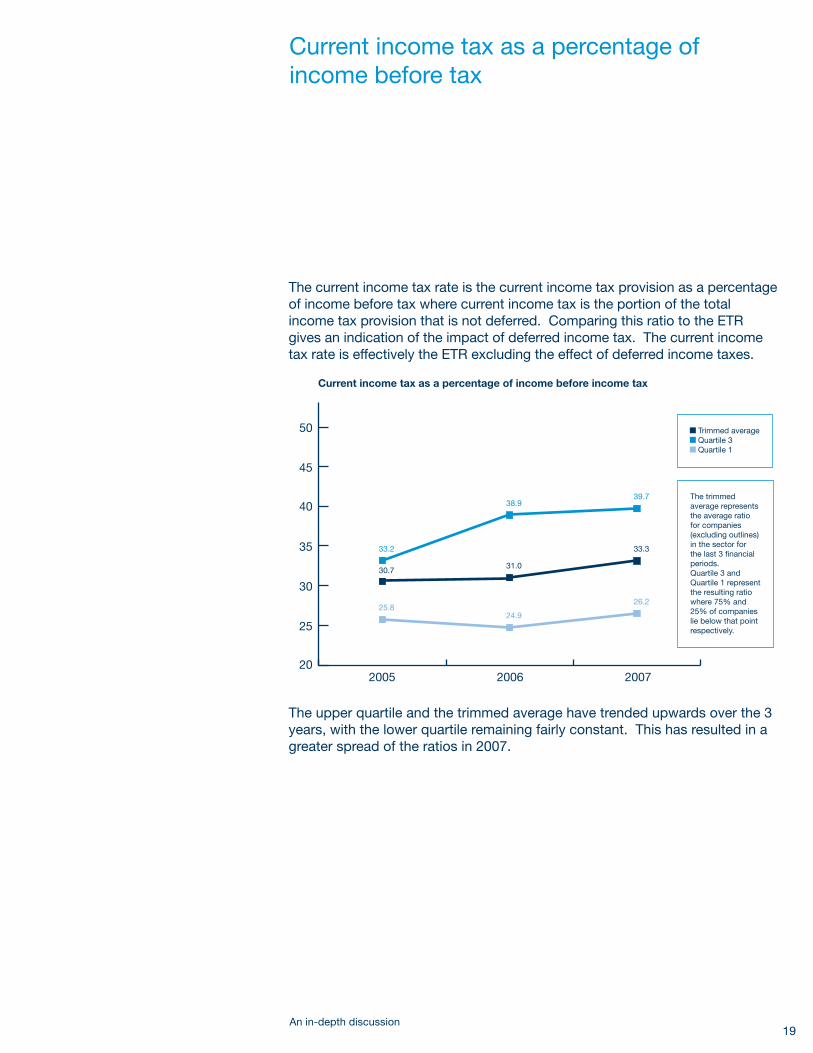
The current income tax rate is the current income tax provision as a percentage of income before tax where current income tax is the portion of the total income tax provision that is not deferred. Comparing this ratio to the ETR gives an indication of the impact of deferred income tax. The current income tax rate is effectively the ETR excluding the effect of deferred income taxes.
2005 2006 2007
40
45
50
35
30
25
20
Current income tax as a percentage of income before income tax
Trimmed average Quartile 3 Quartile 1
33.2
30.7
25.8
38.9
31.0
24.9
39.7
33.3
26.2
The trimmed average represents the average ratio for companies (excluding outlines) in the sector for the last 3 financial periods.Quartile 3 and Quartile 1 represent the resulting ratio where 75% and 25% of companies lie below that point respectively.
The upper quartile and the trimmed average have trended upwards over the 3 years, with the lower quartile remaining fairly constant. This has resulted in a greater spread of the ratios in 2007.
An in-depth discussion

20
30%
32%
34%
Current income tax rate versus effective income tax rate
The trimmed average represents the average ratio for companies (excluding outlines) in the sector for the last 3 financial periods.
2005 2006 2007
33.9%
30.7%
34.2%
31.0%
33.1%
33.3%
Current income tax rate
Effective income tax rate
In 2005 companies had, on average, net deferred income taxes contributing approximately three percentage points to the effective income tax rate. This widened slightly in 2006 and the ratios converged in 2007.
This convergence could indicate that deferred income tax liabilities are decreasing or deferred income tax assets are increasing. In this capital intensive sector, the likely explanation is that deferred income tax liabilities are decreasing.
The difference between the current income tax rate and the effective income tax rate was reviewed by segment. It can be seen that while the Energy Services segment and Integrated Oil & Gas segments are reasonably constant year on year, the Exploration & Production ratios are more volatile indicating more movement of deferred income tax.
45%
30%
35%
40%
25%
Current tax rate vs effective tax rate by segment Current Energy Services
Current Integrated
Current E&P
Effective Energy Services
Effective Integrated
Effective E&P
21
Cash income tax paid as a percentage of current income tax provision
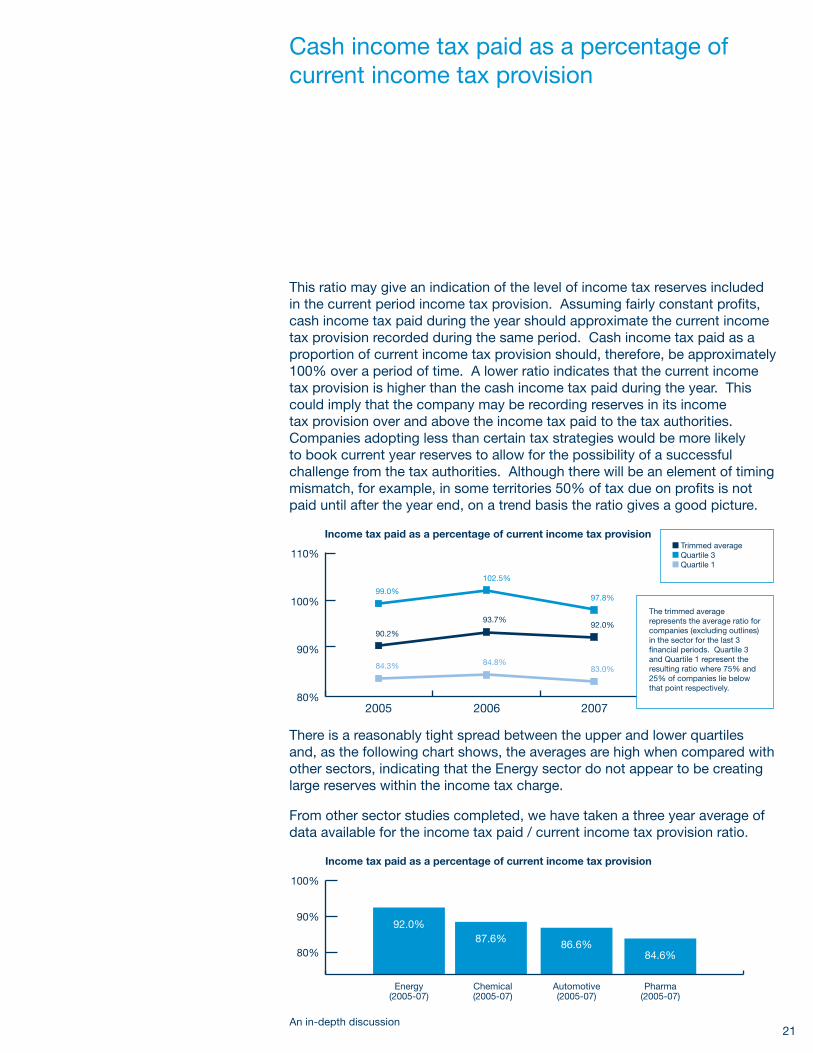
This ratio may give an indication of the level of income tax reserves included in the current period income tax provision. Assuming fairly constant profits, cash income tax paid during the year should approximate the current income tax provision recorded during the same period. Cash income tax paid as a proportion of current income tax provision should, therefore, be approximately 100% over a period of time. A lower ratio indicates that the current income tax provision is higher than the cash income tax paid during the year. This could imply that the company may be recording reserves in its income tax provision over and above the income tax paid to the tax authorities. Companies adopting less than certain tax strategies would be more likely to book current year reserves to allow for the possibility of a successful challenge from the tax authorities. Although there will be an element of timing mismatch, for example, in some territories 50% of tax due on profits is not paid until after the year end, on a trend basis the ratio gives a good picture.
2005 2006 2007
100%
110%
90%
80%
Income tax paid as a percentage of current income tax provision Trimmed average Quartile 3 Quartile 1
99.0%
90.2%
84.3%
102.5%
93.7%
84.8%
97.8%
92.0%
83.0%
The trimmed average represents the average ratio for companies (excluding outlines) in the sector for the last 3 financial periods. Quartile 3 and Quartile 1 represent the resulting ratio where 75% and 25% of companies lie below that point respectively.
There is a reasonably tight spread between the upper and lower quartiles and, as the following chart shows, the averages are high when compared with other sectors, indicating that the Energy sector do not appear to be creating large reserves within the income tax charge.
From other sector studies completed, we have taken a three year average of data available for the income tax paid / current income tax provision ratio.
84.6%86.6%87.6%
92.0%
100%
90%
80%
Energy(2005-07)
Chemical(2005-07)
Automotive(2005-07)
Pharma(2005-07)
Income tax paid as a percentage of current income tax provision
An in-depth discussion

22
Income tax paid as a percentage of income before income tax
This ratio (also known as the cash income tax rate) compares the cash income tax paid as a percentage of income before tax where cash income tax paid is the amount of corporation income tax paid during the period. By using income tax paid, rather than current income tax, the impact of reserves is excluded.
2005 2006 2007
40%
50%
60%
30%
20%
10%
0%
Income tax paid as a percentage of income before income tax
Trimmed average Quartile 3 Quartile 1
31.1
26.2
20.5
39.1
29.6
24.5
37.3
30.4
26.5
The trimmed average represents the average ratio for companies (excluding outlines) in the sector for the last 3 financial periods.Quartile 3 and Quartile 1 represent the resulting ratio where 75% and 25% of companies lie below that point respectively.
This ratio has trended upwards over the 3 years with the trimmed average moving from 26.2% in 2005 to 30.4% in 2007. The average ratio over the three years is 28.7% which can be compared to the effective income tax rate of 33.6%.

23
Weighted average vs. straight average
It is possible to calculate the ETR based on total income taxes of all companies in the study as a percentage of total income before taxes of all companies. This has the effect of weighting the ratio towards the larger companies in the study but it can be said that this is a better reflection of the energy industry as a whole.
Tax charge
Income before tax
ETR
There is no trimming in this chart
2005 2006 20070 35%
50,000,000 36%
100,000,000 37%
150,000,000 38%
200,000,000 39%
250,000,000 40%
300,000,000 41%
350,000,000 42%
400,000,000 43%
450,000,000 44%
500,000,000
$’00
0
ET
R
45%
Income before tax and income tax charge
41.4%
43.7%
40.3%
The average ETR based on the weighted ETRs is 41.8% which is substantially higher than the average ETR based on the trimmed average of 33.6%. This methodology weights the ETRs towards the large Integrated Oil & Gas companies and as shown earlier in the study, these companies have the highest ETRs of the three segments included in this study.
This analysis has been impacted by the weight of the largest companies in the industry. The largest 5 companies in this study account for over half of the entire income before income tax and income tax charge of all 37 companies included.
An in-depth discussion

24
Total Tax Contribution
This study has focused entirely on corporate income tax. However, companies pay many other business taxes although these are not generally visible from their financial statements. Greater transparency over all taxes paid (the company’s Total Tax Contribution) will help disclose the impact of tax on the business and its stakeholders. More companies are seeing tax as an important part of their Corporate Social Responsibility (CSR) reporting, including commenting on their general stance on taxation.
To help companies improve transparency around of all of the business taxes that they pay, both for the cost of the taxes themselves and the administrative cost of compliance, PricewaterhouseCoopers have developed the Total Tax Contribution (“TTC”) framework. The aim of TTC was to develop a standard framework for improving tax reporting – standard in terms of how taxes should be categorised rather than laying down a rigid way of reporting. The thesis was that better reporting would lead to a better understanding of what companies were doing, by all the various interested stakeholders. The TTC framework was developed within PwC by tax specialists, economists and a major input from our sustainable business solutions team. While the framework was initially UK-focussed, it has now been developed and is in use in nine other countries around the World, with the prospect of expansion into additional countries. The Framework is built around two simple criteria: firstly, the definition of a tax and secondly, the distinction between taxes that are the company’s cost (the taxes borne) and taxes which the company collects. Not all payments made by companies to Government will meet the definition of a tax. Consider the royalties and licence payments paid by natural resources companies for the right to extract minerals or hydrocarbons, or the licence fee paid by a telecoms company for a licence to operate. These payments may be significant but each needs to be looked at individually to see if it meets the definition of a tax.

25
A tax is a payment to Government, at any level (federal, state or local) which is mandatory, for no return of value and which is used by government as part of public finances to fund social expenditure. In most cases this definition leaves the licence fee type of payment not qualifying as a tax as there is a return of value (the right to exploit). A royalty per barrel will normally rank as a tax, on the other hand. The TTC framework does include provision for disclosing the ‘other payments to government’ which can be significant. The framework is careful to make a distinction between taxes borne and taxes collected. Taxes borne are those that are a real cost to the company, such as corporation tax, employers’ national insurance contributions (NIC) and irrecoverable VAT. Taxes collected are those such as PAYE, employees’ NIC and net VAT (output tax less input tax), where the company is collecting and administering taxes on behalf of Government with no immediate cost to the company other than the administrative burden.
Studies of the Total Tax Contribution of companies in different territories around the world have highlighted the importance of other taxes borne and how these vary by industry sector as many of the other taxes are sector specific. The Energy Sector bears a high level of such taxes. We currently have extensive Total Tax Contribution data for the Energy Sector in the UK and the following commentary relates to this UK data.
From the data gathered by the annual survey which we conduct for The Hundred Group of finance directors in the UK (the largest companies in the UK), we were able to identify the high level of taxation borne and collected by the Energy sector in the UK. The Energy Sector companies in the group contributed total taxes borne in 2006 of over £7bn, including £1.3bn of Petroleum Revenue Tax and £1.5bn of supplementary charge, making it the industry sector within the Hundred Group that is contributing the largest amount of taxes borne. The story for taxes collected was the same, with £14.2bn being collected by the Energy participants. The trend data showed that corporation tax paid by the sector had increased by over 78% since the supplementary charge was increased at the beginning of 2006. We believe that, if similar studies were performed for other jurisdictions, a similar story would be told. Note that “Energy Sector” with respect to the Hundred Group survey refers only to the Integrated Oil & Gas and Exploration & Production companies and excludes the Energy Services companies.
An in-depth discussion

26
PwC have also completed a study in relation to the upstream exploration and production activities of the energy industry in the UK for the years 2006 and 2007 “Upstream Study”. The Upstream Study generated a number of interesting findings which have been reported in two parts. The first deals with the Exploration & Production members of Oil & Gas UK (OGUK - the association of Oil & Gas companies in the UK), where we secured the participation of companies accounting for 87% of the total barrels of oil produced in the UK. The second covers the Energy Services companies of OGUK where the participation level was also good with 57% of members making returns covering a broad spectrum of the activities undertaken by these companies.
For the Exploration & Production companies, the upstream oil and gas industry is confirmed as a major contributor to UK public finances, with participants bearing £6.1bn in taxes, equivalent to 1.2% of total UK government receipts. Interestingly, however, the level of taxes borne in value terms is seen to have peaked in the year to 31 December 2006, falling back in 2007 reflecting a change in the method of collection of corporation tax in these years and more importantly, perhaps, a reduction in the profitability of the UK operations of Exploration & Production companies in 2007 when compared with 2006. The recent movement in oil prices in 2008 will likely have a significant impact on Total Tax Contribution from these companies going forward.
For the Energy Services companies, the study emphasised the significantly different tax profile of these companies when compared to the Exploration & Production companies. National insurance contributions make up 74% of their taxes borne and corporation tax is only 18% of the total. This compares with the Exploration & Production companies where corporation tax and the supplementary charge account for almost 75% for the total taxes borne. The Energy Services companies employ a significant proportion of the upstream oil and gas work force and consequently have an important economic footprint in the UK. The wage bill of participating Energy Services companies was just over £1bn and the number of people employed and the profitability of these companies also increased between 2006 and 2007.
The charts overleaf show the different profile of the taxes borne by Energy Services companies and Exploration & Production companies.

27
Energy Services
Employers NIC74.0%
Corporationtax17.8%
Business rate4.4%
Other3.8%
Other taxes2.4%
Stamp duties0.7%
Environmental taxes0.7%
Exploration & Production
PRT21.1%
SCT29.0%
Corporation tax45.6%
Employers NIC2.9%
Other taxes0.3%
Stamp duties0.1%
Business rates1.0%
Environmental taxes0.02%
Other1.4%
For internal management, Total Tax Contribution information is important to ensure that investment decisions are taken on the basis of full information considering all business taxes borne and collected. Many other business taxes are significant in size, and if not adequately controlled they can represent a material risk.
Externally, increased transparency around the full amount of the Total Tax Contribution made by the sector can help to meet the needs of a variety of stakeholders, such as investors, governments and consumers. These different stakeholders have different needs, for example, clarity on tax risk position (investors), attracting and retaining investment (governments) and understanding of the contribution made by companies (NGOs). Total Tax Contribution is a relatively straightforward and easy to understand Framework to communicate to stakeholders what a company contributes in taxes.
Total Tax offers the potential for a more constructive conversation facilitated by a standard method of measurement that can be consistently applied globally.
An in-depth discussion

28
Appendix
Study sources
29
Source of information
Our financial analysis was based on a number of ratios, which could be derived from publicly available information. The use of information that was publicly available meant that we could include a large sample size of 37 companies without the need to contact each company, giving us a good overview from which to draw our conclusions.
Statistical analysis
• Mean Our conclusions are based on a statistical analysis of the ratios. In an
income tax benchmarking exercise of this nature, particular ratios may be distorted due to one off, nonrecurring items. Exceptional items, for example, often attract associated income tax at rates far from the statutory rate.
It was necessary to exclude these extreme values, and this was done on a consistent basis by taking a trimmed mean of a particular sample. The trimmed mean is the average result of the data, set by excluding 15% of the data points from both the top and bottom of the data set. It is a robust estimate of the location of a sample, excluding outlying data points.
• Quartiles These record the ratio where 75% and 25% of the sample companies
lie below that point respectively. By displaying results in this manner, it is possible to identify the range in which the results of the majority of companies fall.
The terms used in the charts to represent the upper (above the mean) and lower (below the mean) quartiles are Quartile 3 and Quartile 1.
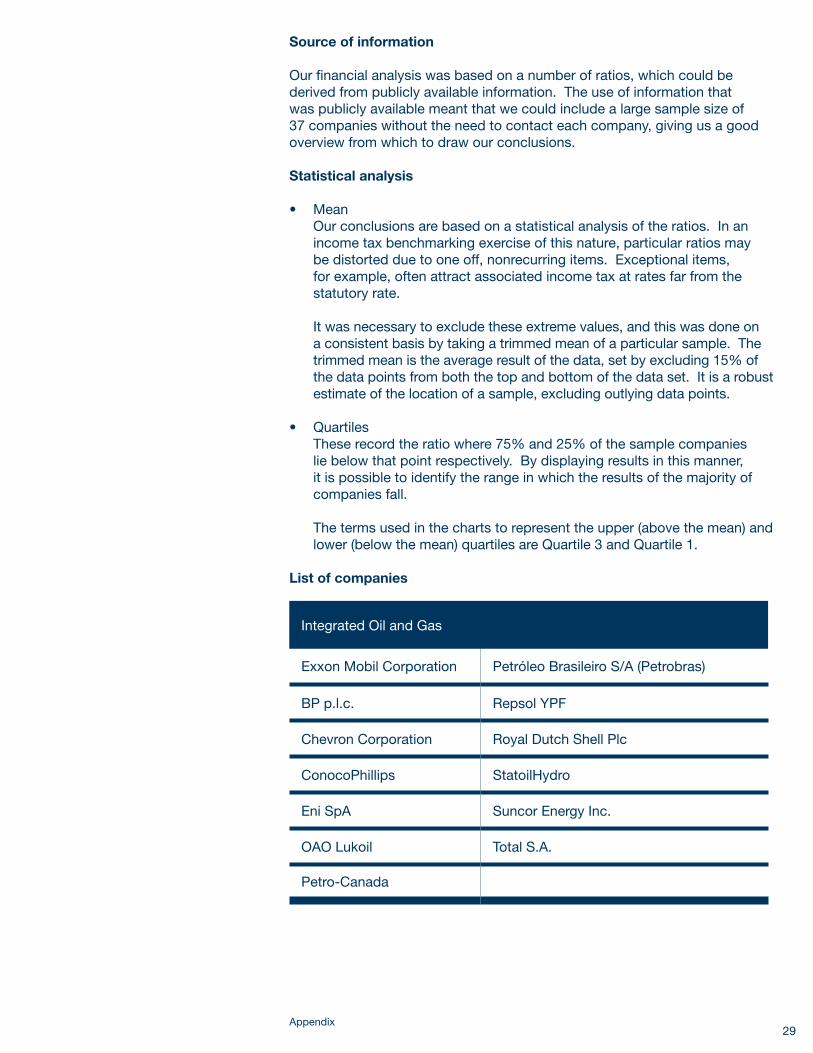
List of companies
Integrated Oil and Gas
Exxon Mobil Corporation Petróleo Brasileiro S/A (Petrobras)
BP p.l.c. Repsol YPF
Chevron Corporation Royal Dutch Shell Plc
ConocoPhillips StatoilHydro
Eni SpA Suncor Energy Inc.
OAO Lukoil Total S.A.
Petro-Canada
Appendix
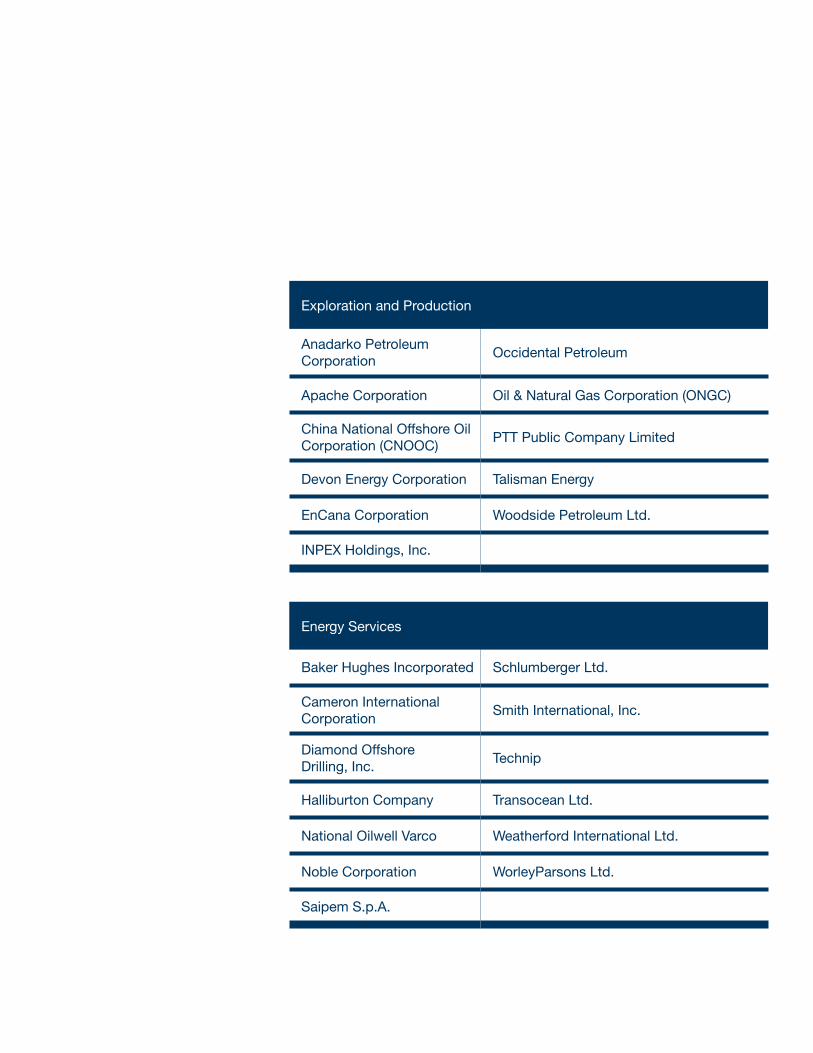
Exploration and Production
Anadarko PetroleumCorporation
Occidental Petroleum
Apache Corporation Oil & Natural Gas Corporation (ONGC)
China National Offshore Oil Corporation (CNOOC)
PTT Public Company Limited
Devon Energy Corporation Talisman Energy
EnCana Corporation Woodside Petroleum Ltd.
INPEX Holdings, Inc.
Energy Services
Baker Hughes Incorporated Schlumberger Ltd.
Cameron InternationalCorporation
Smith International, Inc.
Diamond OffshoreDrilling, Inc.
Technip
Halliburton Company Transocean Ltd.
National Oilwell Varco Weatherford International Ltd.
Noble Corporation WorleyParsons Ltd.
Saipem S.p.A.


This document, Working together* Energy Sector Income Tax Benchmarking Study, and the Appendix are are available online at www.pwc.com/energy under the Publications tab. The Appendix is a compilation of the financial statements used in our research.
To have a deeper conversation on the topic mentioned, please contact:
James KochGlobal Energy, Utilities & Mining Tax [email protected] +1 (713) 356 4626
Janet KerrTotal Tax Contribution [email protected]+44 (0) 20 7804 7134
This publication (“Report”) has been prepared as general information on benchmarking issues. PwC makes no representations or warranties with respect to the accuracy of the information contained in this Report, and in no event will PwC, its related partnerships or entities, or the partners, agents or employees thereof be liable to the user (subject to any agreement with the user to the contrary) or to any third party (including any of the user’s clients) for any inaccuracy of information contained in this Report (including any errors or omissions in its content, regardless of the cause of such inaccuracy, error or omission), for any usage of, decision made or action taken in reliance on the Report, or for any consequential, special or similar damages even if advised of the possibility of such damages. This Report is not intended to give legal, income tax, accounting or other professional advice. No user should act on the basis of any matter contained in this Report without considering and, if necessary, taking appropriate professional advice on their individual requirements.
This Report and its data are strictly confidential and (save to the extent required by applicable law and/or regulation) must not be released to any third party nor copied, reproduced or transmitted in any form or by any means without PwC’s prior written consent. This Report, any section of it and any of its data must not be placed on any intranet, extranet, shared work areas nor on the Internet except with prior written permission of PricewaterhouseCoopers.
© 2009 PricewaterhouseCoopers LLP. All rights reserved. “PricewaterhouseCoopers” refers to PricewaterhouseCoopers LLP or, as the context requires, the PricewaterhouseCoopers global network or other member firms of the network, each of which is a separate and independent legal entity. DH 09 0346
pwc.com/energy