corporation income and business franchise taxes
TRANSCRIPT

North Carolina
Corporation Income and Business
Franchise Taxes
Statistics and Trends
Tax Year 2018
February 2021
Revenue Research Section
Financial Services Division
______________________________________________________________________________
-i-
CONTENTS
INTRODUCTION ...................................................................................................................................... 1
OVERVIEW OF TAXES COVERED BY THIS REPORT .................................................................. 2
SECTION I - FRANCHISE TAX
C Corporation ....................................................................................................................................... 5 Table 1.1: C Corporation Returns by Tax Base Utilized
Table 1.2: C Corporation Net Franchise Tax Liability by Tax Base Utilized
Figure 1.3: C Corporation Returns and Net Franchise Tax Liability by Tax Base
Table 1.4: C Corporation Returns and Net Franchise Tax Liability by Franchise Taxable Amount
Figure 1.5: C Corporation Returns and Net Franchise Tax Liability by Franchise Taxable Amount
Table 1.6: C Corporation Returns Claiming Franchise Tax Credits and Amount of Credits Taken
Figure 1.7: C Corporation Returns Claiming Franchise Tax Credits and Amount of Credits Taken
Table 1.8: C Corporation Franchise Tax Credits Taken by Credit Type and Franchise Taxable Amount
S Corporation ...................................................................................................................................... 10 Table 1.9: S Corporation Returns by Tax Base Utilized
Table 1.10: S Corporation Net Franchise Tax Liability by Tax Base Utilized
Figure 1.11: S Corporation Returns and Net Franchise Tax Liability by Tax Base
Table 1.12: S Corporation Returns and Net Franchise Tax Liability by Franchise Taxable Amount
Figure 1.13: S Corporation Returns and Net Franchise Tax Liability by Franchise Taxable Amount
Table 1.14: S Corporation Returns Taking Franchise Tax Credits and Amount of Credits Taken
Figure 1.15: S Corporation Returns Taking Franchise Tax Credits and Amount of Credit Taken
Table 1.16: S Corporation Franchise Tax Credits Taken by Credit Type and Franchise Taxable Amount
C and S Corporations Combined ...................................................................................................... 14 Figure 1.17: C & S Corporation Returns and Net Franchise Tax Liability by Tax Base Figure 1.18: C & S Corporation Returns and Net Franchise Tax Liability by Franchise Taxable Amount
Figure 1.19: C & S Corporations Returns Claiming Franchise Tax Credits and Amount of Credits Taken
SECTION II - INCOME TAX
C Corporation ..................................................................................................................................... 16
Table 2.1: C Corporation Returns and Net Income Tax Liability by NC Taxable Income
Figure 2.2: C Corporation Returns and Net Income Tax Liability by NC Taxable Income
Figure 2.3: C Corporation Returns and Net Income Tax Liability by Federal Taxable Income (Before NOL)
Table 2.4: C Corporation Returns by Federal Taxable Income (Before NOL) and Apportionment Percentage
Table 2.5: C Corporation Net Income Tax Liability by Federal Taxable Income (Before NOL) and
Apportionment Percentage
Figure 2.6: C Corporation Returns and Net Income Tax Liability by Apportionment Percentage
Table 2.7: C Corporation Income Tax Calculation Detail by Federal Taxable Income (Before NOL)
Table 2.8: Number of C Corporation Returns Taking Credits as a Percentage of Tax Liability
Table 2.9: Amount of C Corporation Tax Credits Taken as a Percentage of Tax Liability
Figure 2.10: C Corporation Income Tax Credits as a Percentage of Tax Liability
Table 2.11: C Corporation Income Tax Credits by Credit Type
S Corporation ........................................................................................................................................ 24 Table 2.12: S Corporation Returns and Net Income Tax Liability by NC Taxable Income
Figure 2.13: S Corporation Returns and Net Income Tax Liability by NC Taxable Income
Figure 2.14: S Corporation Returns by NC Taxable Income and Nonresident Shareholder Status
Table 2.15: S Corporation Income Tax Calculation Detail

______________________________________________________________________________
-ii-
SECTION III – TRENDS
C Corporation ....................................................................................................................................... 27
Figure 3.1: C Corporation Returns by Tax Year
Figure 3.2: C Corporation Net Franchise and Income Tax Liabilities by Tax Year
Table 3.3: C Corporation Net Income Tax Liability by NC Taxable Income – Tax Years 2013 & 2018
Figure 3.4: C Corporation Net Income Tax Liability by NC Taxable Income – Tax Years 2013 & 2018
Table 3.5: Various Tax Credits Available to Corporations in Recent Years
Figure 3.6: C Corporation Tax Credits Taken by Tax Year – Tax Years 2013 to 2018
S Corporation ........................................................................................................................................... 31
Figure 3.7: S Corporation Returns by Tax Years
Figure 3.8: S Corporation Net Franchise and Income Tax Liabilities by Tax Year
Figure 3.9: S Corporation Returns by NC Taxable Income – Tax Years 2013 & 2018
SECTION IV – FISCAL YEAR STATISTICS
C and S Corporations Combined ........................................................................................................ 33
Table 4.1: C Corporation Statistics by Fiscal Year Start Month
SECTION V – INDUSTRY SECTORS
C Corporation ....................................................................................................................................... 34
Table 5.1: C Corporation Franchise Tax and Income Tax Liability by Industry Sector
Table 5.2: C Corporation Income Tax Calculation Detail for Certain Industry Sectors
S Corporation ........................................................................................................................................... 36
Table 5.3: S Corporation Franchise Tax and Income Tax Liability by Industry Sector
Table 5.4: S Corporation NC Net Taxable Income by Industry Sector
Table 5.5: S Corporation NC Net Taxable Income (Positive Values Only) by Industry Sector

______________________________________________________________________________
-1-
INTRODUCTION
This report contains statistics concerning business franchise and income taxes imposed on corporations and
limited liability companies under the Revenue Laws of North Carolina. It is designed to provide legislators,
public officials, tax professionals, researchers, and other interested citizens of North Carolina with
information about the characteristics of corporate taxpayers and how these taxpayers contribute to the
State’s tax revenues. The report includes both historical series of data and detailed reports for tax year 2018
(TY18)1.
This report is based upon data submitted by corporations and limited liability companies filing as corpo-
rations on the CD-405, CD-401S, and CD-425 forms. The data were retrieved from the Department’s In-
tegrated Tax Administration System (ITAS) in December 2020. All returns may not have been audited by
this date. As such, the data may reflect errors made by taxpayers. The Revenue Research staff did examine
the downloaded data in order to correct errors that were determined to have resulted from scanning the
returns into ITAS.
Corporate tax returns are included in this report if they were filed for calendar year 2018 or for a tax year
beginning sometime in 2018. Short-year returns are included if their tax period begins in 2018.
The relevant 2018 corporate tax forms and instructions are available for review on the following
Department of Revenue website: www.ncdor.gov/taxes/corporate-income-franchise-tax/corporate-tax-
forms-and-instructions
This report is divided into five sections. Section I presents information related to the business franchise tax;
Section II has information related to the corporation income tax; Section III presents data on the trends in
these tax returns from tax year 2013 through tax year 2018; Section IV compares tax liabilities by the start
month of the corporations’ tax years; and Section V breaks out key statistics by major industry sectors.
The following table presents key summary statistics for the business franchise and corporation income taxes
for TY18.
Note: Net tax liability is tax liability minus tax credits. Taxpayers may have negative net franchise tax liability due to the usage
of certain refundable tax credits. Note that S corporations only report income tax liability for nonresident shareholders who
allow the company to file a composite return on their behalf.
1 Franchise tax statistics in this report are referred to as tax year 2018 because they are reported on 2018 corporate
income tax returns. However, they are technically tax year 2019 liabilities.
C corporations S corporations
Number of returns 81,657 171,753
Number of returns with nonzero net franchise tax 69,158 164,210
Amount of net franchise tax $648,230,396 $86,039,466
Number of returns with nonzero net income tax 28,136 9,990
Amount of net income tax $736,027,797 $104,537,744

______________________________________________________________________________
-2-
OVERVIEW OF TAXES COVERED BY THIS REPORT
The following descriptions of the General Business Franchise Tax and Corporation Income Tax reflect the
tax law in effect for tax periods beginning in 2018 (2019 for Franchise Tax). These descriptions are not
official interpretations of the Revenue Laws and should not be relied upon as representing the position of
the Department of Revenue.
FRANCHISE TAX
The general business franchise tax is levied on business corporations doing business in the State (including
those electing S corporation status). The tax is imposed on the largest of three alternative asset bases. These
bases are (a) the amount of the corporation’s net worth, apportioned to the State (using the apportionment
formula for corporation income); (b) 55% of the appraised value of property in the State subject to local
taxation; or (c) the amount of investment in real and tangible personal property in the State, less
accumulated depreciation, depletion, and amortization with respect to N.C. tangible property. The tax is
$1.50 per $1,000 of taxable assets. Beginning with tax periods starting on or after Jan. 1, 2019, S
corporations are subject to a $200 tax on the first $1 million in taxable assets and $1.50 per $1,000 of the
amount over $1 million.
Limited Liability Companies (LLC’s) that elect to be taxed as corporations for federal income tax purposes
became liable for franchise tax beginning in 2007 (as reported on TY2006 returns). LLC’s that choose to
file as S corporations in North Carolina became liable for tax beginning in 2009. Partnerships that elect to
be taxed as corporations for federal income tax purposes became liable for franchise tax beginning in 2019.
The minimum franchise tax is $200. The tax on holding companies that receive more than 80% of their
gross income from subsidiaries is capped at $150,000 if the company uses the net worth base. (The taxpayer
must ensure this amount is not less than the tax calculated using the alternative bases.)
CORPORATION INCOME TAX
The corporation income tax applies to corporations that do business in North Carolina and that do not elect
S corporation status. The calculation of taxable income begins with Federal Taxable Income before Net
Operating Loss. Additions to income are required for items including taxes based on income, capital loss
carry-over, certain royalties paid to related members, contributions, and expenses attributable to income
not taxed. Deductions from income are allowed for items including U.S. obligation interest, capital loss not
deducted on the Federal return, and certain royalty payments received from related members.
Beginning in tax year 2016, a new statute limited the deduction for the amount of net interest paid or accrued
to a related member to the greater of (1) 15% of the taxpayer’s adjusted taxable income and (2) the
taxpayer’s proportionate share of interest ultimately paid to an unrelated entity. This limitation does not
apply if the related member is taxed on the interest income in North Carolina or another jurisdiction or if
the related member is a bank.
Also effective for tax years beginning in 2016 and after, the adjustment for expenses related to the
dividends-received deduction has been simplified. For all corporate taxpayers, the adjustment for expenses
may not exceed an amount equal to 15% of the dividends. In prior years, bank holding companies and
electric power holding companies were eligible to receive a credit against the increased tax liability as a
result of this adjustment.2
2 In general, any expenses related to non-taxed income should be added back to N.C. taxable income.

______________________________________________________________________________
-3-
Decoupling from federal bonus depreciation and Section 179 expensing. A taxpayer must add back
85% of the amount of bonus depreciation taken for federal income tax purposes during the tax year. This
amount can then be deducted in equal installments over the next 5 tax years. Similar provisions existed for
tax years 2008 through 2017. The State also adopted lower limits on Section 179 expensing for TY18,
requiring an 85% addback of excess federal expensing over State limits.
Decoupling from federal Tax Cut and Jobs Act (TCJA) provisions. In addition to the decoupling related
to bonus depreciation and Section 179 expensing, North Carolina also decoupled from several other TCJA
provisions for tax year 2018 and forward. Among these are the Opportunity Zone Fund adjustments and
provisions related to foreign-sourced income of multinational corporations. Also, North Carolina de-
coupled from the provision that would require certain nonprofits to treat income from parking facilities as
unrelated business income.
Effective for tax years beginning in 2017 and after, there is a deduction from federal taxable income for
amounts paid from the State Emergency Response and Disaster Relief Reserve Fund for hurricane relief or
assistance to the extent included in federal taxable income.
Apportionment of multi-state business income. The portion of adjusted income that is subject to
apportionment, less contributions to donees in other States, is apportioned to North Carolina based upon
North Carolina’s share of the corporation’s sales.3 Special apportionment rules apply to interstate carriers,
railroads, and air and water transportation corporations. The Secretary of Revenue has the authority to
approve an alternative method of apportionment if the taxpayer can establish evidence that the statutory
formula operates to subject a greater portion of the corporation’s income to tax than is attributable to its
business in the State. Income not subject to apportionment is allocated to North Carolina if the business
activity generating the income is located in North Carolina.
Total income allocated and apportioned to North Carolina may be reduced by the value of a corporation’s
State net loss, percentage depletion over cost depletion, and qualified contributions to North Carolina
donees. The net taxable income is taxed at a rate of 3.0%.4
Several business incentive tax credits had been repealed in recent years. Tax credits remaining include a
credit for investing in a major recycling facility, a credit for constructing a cogenerating power plant, a
credit for constructing a railroad intermodal facility, and historic rehabilitation tax credits.
Under NCGS 105-130.5(a)(10), if a C corporation takes a tax credit against the income tax, it must add this
amount to its taxable income.
S corporations must file returns at the corporation level, but the income tax is paid by shareholders through
the individual income tax. S corporations do sometimes make payments on behalf of nonresident
shareholders, and these payments are treated as corporation income tax5. As a result, information
concerning the income and tax liabilities of S corporations is included in this report.
3 In prior years, the apportionment factor was based on a combination of sales, property and payroll shares. The
sales-only apportionment factor was phased in between 2016 and 2018. 4 The corporate income tax rate was 4.0% in Tax Year 2016, 5.0% in Tax Year 2015, 6.0% in Tax Year 2014, and
6.9% in prior tax years. 5 The tax rate applicable to S corporations is the individual income tax rate (5.499% in 2018), not the corporate
income tax rate.

______________________________________________________________________________
-4-
FRANCHISE AND CORPORATE INCOME TAXES AS A SHARE OF TOTAL STATE TAX
REVENUES
The following chart illustrates the relative importance of corporation tax revenues to overall State tax
collections. State tax revenues in Fiscal Year 2018-19 were $29.3 billion. (Licenses and fees are included
in this amount, but unemployment insurance contributions are not.)6 Net collections for the corporation
income tax and the business franchise tax accounted for $1.6 billion (5.4%) of the total.
The corporation taxes included in this report comprise the fourth largest category of revenues for the State
government, surpassing motor vehicle licenses, highway use taxes, the insurance gross premium tax,
alcoholic beverage taxes and tobacco products taxes. Only the individual income tax, the sales & use tax,
and the motor fuels tax generated more revenue.
Composition of Net State Tax Revenues by Tax Category, Fiscal Year 2018-2019
Note: The “other” category includes the highway use tax (2.9% of total), motor vehicle licenses
(3.0%), insurance premiums tax (2.0%), alcoholic beverage tax (1.5%), and tobacco products
tax (1.0%), among others. Unemployment insurance contributions are not included in this
graph.
6 Source: U.S. Census Bureau, Annual Survey of State Government Tax Collections
SECTION I
FRANCHISE TAX ______________________________________________________________________________
-5-
C CORPORATIONS
Overall, the net franchise tax liability for the C corporation returns in this report totaled $648.2 million.
(Net tax liability is the amount of tax liability after deducting tax credits.) After excluding filers that were
not liable for franchise tax (12,482 returns), the average amount due from the remaining 69,175 returns was
$9,371. Sixty percent of these taxpayers owed $200 or less; and 99% of taxpayers owed $157,145 or less.
In order to provide a distributional analysis for the franchise tax, returns have been broken out into 8
brackets based on their franchise taxable amount. The first two brackets ($0 to $23,667; $34,668 to
$133,667) represent those taxpayers that would have the minimum $200 amount of tax due before credits
or were exempt from the franchise tax. The highest bracket ($100,000,001+) includes taxpayers whose tax
liability before credits would be at least $150,000.
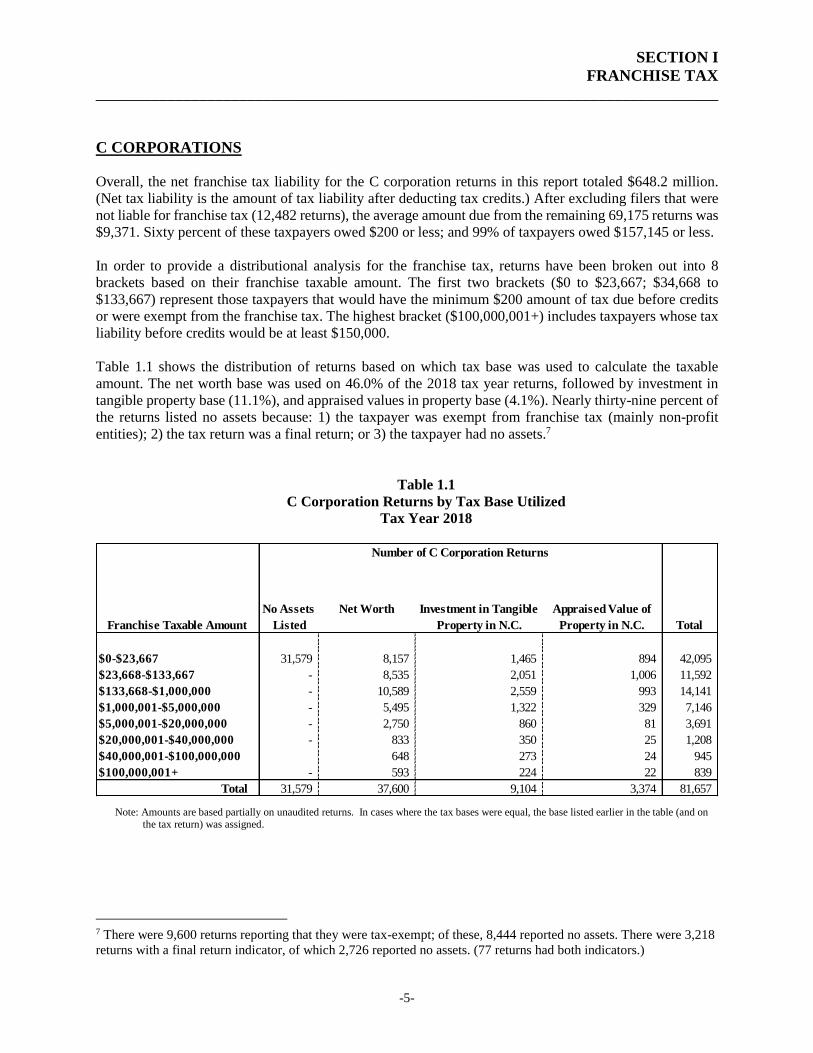
Table 1.1 shows the distribution of returns based on which tax base was used to calculate the taxable
amount. The net worth base was used on 46.0% of the 2018 tax year returns, followed by investment in
tangible property base (11.1%), and appraised values in property base (4.1%). Nearly thirty-nine percent of
the returns listed no assets because: 1) the taxpayer was exempt from franchise tax (mainly non-profit
entities); 2) the tax return was a final return; or 3) the taxpayer had no assets.7
Table 1.1
C Corporation Returns by Tax Base Utilized
Tax Year 2018
Note: Amounts are based partially on unaudited returns. In cases where the tax bases were equal, the base listed earlier in the table (and on the tax return) was assigned.
7 There were 9,600 returns reporting that they were tax-exempt; of these, 8,444 reported no assets. There were 3,218
returns with a final return indicator, of which 2,726 reported no assets. (77 returns had both indicators.)
Franchise Taxable Amount
No Assets
Listed
Net Worth Investment in Tangible
Property in N.C.
Appraised Value of
Property in N.C. Total
$0-$23,667 31,579 8,157 1,465 894 42,095
$23,668-$133,667 - 8,535 2,051 1,006 11,592
$133,668-$1,000,000 - 10,589 2,559 993 14,141
$1,000,001-$5,000,000 - 5,495 1,322 329 7,146
$5,000,001-$20,000,000 - 2,750 860 81 3,691
$20,000,001-$40,000,000 - 833 350 25 1,208
$40,000,001-$100,000,000 648 273 24 945
$100,000,001+ - 593 224 22 839
Total 31,579 37,600 9,104 3,374 81,657
Number of C Corporation Returns

SECTION I
FRANCHISE TAX ______________________________________________________________________________
-6-
Table 1.2 compares the net franchise tax liability by tax base utilized. The greatest share of tax paid (75.9%)
was under the net worth base. Taxpayers using the investment in tangible property base paid 21.3% of the
franchise tax, while the appraised value in property base represented only 2.1% of the net tax liability.
Table 1.2
C Corporation Net Franchise Tax Liability by Tax Base Utilized
Tax Year 2018
Note: Figures are based partially on unaudited returns.
Figure 1.3 illustrates graphically the summary data in Tables 1.1 and 1.2 as a percentage of total tax
liability.
Franchise Taxable Amount
No Assets
Listed
Net Worth
Investment in
Tangible Property in
N.C.
Appraised Value of
Property in N.C. Total
$0-$23,667 4,014,723 1,537,276 280,537 174,997 6,007,533
$23,668-$133.667 - 1,591,185 389,826 197,825 2,178,836
$133,668-$1,000,000 - 6,271,264 1,544,338 562,474 8,378,076
$1,000,001-$5,000,000 - 18,824,614 4,417,094 997,268 24,238,976
$5,000,001-$20,000,000 - 40,606,233 12,656,364 1,132,683 54,395,280
$20,000,001-$40,000,000 - 34,278,494 14,166,104 915,786 49,360,384
$40,000,001-$100,000,000 58,739,784 24,104,067 1,949,383 84,793,234
$100,000,001+ - 311,984,501 98,574,796 8,318,780 418,878,077
Total 4,014,723 473,833,351 156,133,126 14,249,196 648,230,396
Net Tax Liability ($)

SECTION I
FRANCHISE TAX ______________________________________________________________________________
-7-
Table 1.4 and Figure 1.5 provide the distribution of C corporation returns and net franchise tax liability by
taxable amount. Taxpayers with franchise taxable amount of at least $40 million made up only 2.2% of the
returns, but paid 77.7% of net franchise tax.
Table 1.4
C Corporation Returns and Net Franchise Tax Liability by Franchise Taxable Amount
Tax Year 2018
Note: Figures are based partially on unaudited returns. Breakout percentages may not add to totals due to rounding.
Franchise Taxable Amount
Number of
Returns Percent
Net Franchise Tax
Liability ($) Percent
$0-$23,667 42,095 51.6% 6,007,533 0.9%
$23,668-$133,667 11,592 14.2% 2,178,836 0.3%
$133,668-$1,000,000 14,141 17.3% 8,378,076 1.3%
$1,000,001-$5,000,000 7,146 8.8% 24,238,976 3.7%
$5,000,001-$20,000,000 3,691 4.5% 54,395,280 8.4%
$20,000,001-$40,000,000 1,208 1.5% 49,360,384 7.6%
$40,000,001-$100,000,000 945 1.2% 84,793,234 13.1%
$100,000,001+ 839 1.0% 418,878,077 64.6%
Total 81,657 100.0% 648,230,396 100.0%

SECTION I
FRANCHISE TAX ______________________________________________________________________________
-8-
Table 1.6 and Figure 1.7 compare the number of C corporation returns taking franchise tax credits and
amount of credits taken by taxable amount brackets. Only 1,168 (1.7%) of the taxable returns took credits.8
Returns with franchise taxable amount greater than $100 million comprised only 10.4% of the returns taking
credits, but these taxpayers had 87.5% of the credit amount claimed.
Table 1.6
C Corporation Returns Taking Franchise Tax Credits and Amount of Credits Taken
Tax Year 2018
Note: Figures are based partially on unaudited returns. Breakout percentages may not add to totals due to rounding.
8 There were 25 returns with no tax liability but were claiming $4,881 in short-period credits. These taxpayers are
included in Table 1.6
Franchise Taxable Amount
Number of Returns
Taking Credits Percent
Amount of Credits
Taken ($) Percent
$0-$23,667 259 22.2% 94,467 0.1%
$23,668-$133,667 107 9.2% 35,964 0.1%
$133,668-$1,000,000 169 14.5% 86,461 0.1%
$1,000,001-$5,000,000 183 15.7% 568,070 0.9%
$5,000,001-$20,000,000 167 14.3% 1,677,383 2.6%
$20,000,001-$40,000,000 80 6.8% 1,540,304 2.4%
$40,000,001-$100,000,000 82 7.0% 4,149,177 6.4%
$100,000,001+ 121 10.4% 57,079,953 87.5%
Total 1,168 100.0% 65,231,779 100.0%

SECTION I
FRANCHISE TAX ______________________________________________________________________________
-9-
Table 1.8 shows the amount of franchise tax credits by credit type and franchise taxable amount. On
average, credits offset 9.6% of tax liability for taxpayers whose taxable amount was above $5 million and
1.9% for those with lower taxable amounts.
Table 1.8
C Corporation Franchise Tax Credits Taken by Credit Type and Franchise Taxable Amount
Tax Year 2018
Income Tax Credits Number
of
Credits
Amount Claimed
($)
Number
of
Credits
Amount
Claimed ($)
Number
of
Credits
Amount
Claimed
($)
Short Period Credit for Change in Income Year 515 12,607,657 330 638,338 185 11,969,319
+ MIscellaneous Credits Claimed* 299 2,124,327 269 59,056 30 2,065,271
- Misc. Credits Not Taken ** -- (418,857) -- (2,539) -- (416,318)
+ Credits Subject to 50% Limit Taken 371 50,918,652 121 90,107 250 50,828,545
= Credits Taken 1,168 65,231,779 718 784,962 450 64,446,817
* Misc. credits include Renovating an Historic Mill Facility, Rehabilitating an Historic Property, Recycling Facilities,
and Additional Annual Report Fee Paid.
** Credits were not taken against tax because a taxpayer's liability was less than the amount of credits claimed.
Note: Confidentiality prevents the disclosure of the individual credits and credit amounts. Figures are based on both audited
and unaudited returns.
All Returns
Taxable Amount
≤$5,000,000
Taxable Amount
$5,000,001+

SECTION I
FRANCHISE TAX ______________________________________________________________________________
-10-
S CORPORATIONS
Table 1.9 shows the distribution of S corporation returns by franchise tax base. The net worth base was
used on 50.0% of 2018 tax year returns, followed by investment in tangible property base (17.1%), and
appraised values in property (9.3%). Twenty-four percent of the returns listed no assets because: 1) the
taxpayer was exempt from franchise tax; 2) the tax return was a final return; or 3) the taxpayer had no
assets. There were 165,259 S corporations with tax liability before tax credits were applied.9
Table 1.9
S Corporation Returns by Tax Base Utilized
Tax Year 2018
**Not shown to maintain taxpayer confidentiality. These amounts are included in the totals. Note: Figures are based partially on unaudited returns. In cases where the bases were equal, the base listed earlier in the table (and on the
return) was assigned.
Table 1.10 and Figure 1.11 provide net franchise tax liability by tax base utilized. The greatest share of tax
paid (50.3%) was under the net worth base.
Table 1.10
S Corporation Net Franchise Tax Liability by Tax Base Utilized
Tax Year 2018
**Not shown to maintain taxpayer confidentiality. These amounts are included in the totals.
Note: Figures are based partially on unaudited returns.
9 In addition, 22 nontaxable returns claimed $2,699 in short-period tax credits.
Franchise Taxable Amount
No Assets
Listed
Net Worth Investment in Tangible
Property in N.C.
Appraised Value of
Property in N.C. Total
$0-$23,667 40,399 33,783 7,183 5,772 87,137
$23,668-$133,667 - 27,958 9,726 5,584 43,268
$133,668-$1,000,000 - 19,204 9,141 3,690 32,035
$1,000,001-$5,000,000 - 4,102 2,504 844 7,450
$5,000,001-$20,000,000 - 747 670 130 1,547
$20,000,001-$40,000,000 - 94 ** ** 200
$40,000,001+ - 47 ** ** 116
Total 40,399 85,935 29,379 16,040 171,753
Number of S Corporation Returns
Franchise Taxable
Amount
No Assets
Listed
Net Worth Investment in Tangible
Property in N.C.
Appraised Value of
Property in N.C. Total
$0-$23,667 6,683,506 6,303,444 1,341,907 1,057,633 15,386,490
$23,668-$133,667 - 5,249,747 1,819,397 1,036,752 8,105,896
$133,668-$1,000,000 - 3,657,728 1,708,916 702,800 6,069,444
$1,000,001-$5,000,000 - 7,318,767 4,686,671 1,455,084 13,460,522
$5,000,001-$20,000,000 - 9,030,569 8,074,479 1,413,913 18,518,961
$20,000,001-$40,000,000 - 3,641,493 ** ** 7,913,860
$40,000,001+ - 8,067,378 ** ** 16,584,293
Total 6,683,506 43,269,126 28,910,853 7,175,981 86,039,466
Net Tax Liability ($)

SECTION I
FRANCHISE TAX ______________________________________________________________________________
-11-
Table 1.12 and Figure 1.13 compare the distribution of S corporation returns and net franchise tax liability.
The average tax was $271 for taxable returns, although 94.4% of taxable returns had a tax liability of $200
or less. Fifty-three taxpayers had a net tax liability above $100,000.
Table 1.12
S Corporation Returns and Net Franchise Tax Liability by Franchise Taxable Amount
Tax Year 2018
Note: Figures are based partially on unaudited returns. Breakout percentages may not add to totals due to rounding.
Franchise Taxable
Amount
Number of
Returns Percent
Net Franchise Tax
Liability ($) Percent
$0-$23,667 87,137 50.7% 15,386,490 17.9%
$23,668-$133,667 43,268 25.2% 8,105,896 9.4%
$133,668-$1,000,000 32,035 18.7% 6,069,444 7.1%
$1,000,001-$5,000,000 7,450 4.3% 13,460,522 15.6%
$5,000,001-$20,000,000 1,547 0.9% 18,518,961 21.5%
$20,000,001-$40,000,000 200 0.1% 7,913,860 9.2%
$40,000,001+ 116 0.1% 16,584,293 19.3%
Total 171,753 100.0% 86,039,466 100.0%

SECTION I
FRANCHISE TAX ______________________________________________________________________________
-12-
Table 1.14 and Figure 1.15 show the number of returns taking franchise tax credits and amount of credits
taken. Returns with a franchise taxable amount greater than $20 million comprised 0.2% of the returns
taking credits and 38.6% of the credits taken.
Table 1.14
S Corporation Returns Taking Franchise Tax Credits and Amount of Credits Taken
Tax Year 2018
Note: Figures are based partially on unaudited returns. Breakout percentages may not add to totals due to rounding.
Franchise Taxable
Amount
Number of Returns
Taking Credits Percent
Amount of Credits
Taken ($) Percent
$0-$23,667 4,480 46.3% 789,310 26.4%
$23,668-$133,667 2,929 30.2% 515,904 17.3%
$133,668-$1,000,000 1,847 19.1% 326,851 10.9%
$1,000,001-$5,000,000 357 3.7% 102,347 3.4%
$5,000,001-$20,000,000 58 0.6% 101,570 3.4%
$20,000,001+ 15 0.2% 1,152,887 38.6%
Total 9,686 100.0% 2,988,869 100.0%

SECTION I
FRANCHISE TAX ______________________________________________________________________________
-13-
Table 1.16 shows the amount of franchise tax credits by credit type and franchise taxable amount.
Table 1.16
S Corporation Franchise Tax Credits Taken by Credit Type and Franchise Taxable Amount
Tax Year 2018
* This category includes LLC Additional Annual Report Fee and Historic Rehabilitation Credits
** Credits were not taken against tax because taxpayer’s liability was less than the amount of credits claimed or because of taxpayer
error.
Note: Confidentiality prevents the disclosure of the individual credits and credits amount. Figures are partially based on unaudited returns.
Income Tax Credits Number
of
Credits
Amount
Claimed
($)
Number
of
Credits
Amount
Claimed
($)
Number
of
Credits
Amount
Claimed
($)
Short Period Credit for Change in Income Year 195 329,232 172 21,100 23 308,132
+ Miscellaneous Credits Claimed* 9,509 1,835,627 9,129 1,619,912 380 215,715
- Misc. Credits Not Taken ** -- (9,947) -- (9,947) -- --
+ Credits Subject to 50% Limit Taken 38 833,957 11 1,000 27 832,957
= Credits Taken 9,686 2,988,869 9,256 1,632,065 430 1,356,804
All Returns
Taxable Amount
≤$1,000,000
Taxable Amount
$1,000,001+

SECTION I
FRANCHISE TAX ______________________________________________________________________________
-14-
C & S CORPORATIONS COMBINED
Figure 1.17 compares the number of returns and net franchise tax liability for all C and S corporations
combined by tax base used. Twenty-eight percent of the returns listed no assets because: 1) the taxpayer
was exempt from franchise tax; 2) the tax return was a final return; 3) or the taxpayer had no assets. The
net worth base was used by the largest number of corporations.
Figure 1.18 shows the number of C and S corporation returns and net franchise tax liability. Taxpayers with
franchise taxable amount over $20 million made up 1.3% of the returns, but incurred 78.7% of net franchise
tax liability.

SECTION I
FRANCHISE TAX ______________________________________________________________________________
-15-
Figure 1.19 shows the distribution of C and S corporation returns that took franchise tax credits and the
amount of credits taken. Only 10,807 of the 234,434 taxable corporations took credits in tax year 2018.10
Corporations with over $20 million as their franchise tax base took over 93% of all credits.
10 The 234,434 taxable corporations include 42 C corporations and 1,071 S corporations that had zero net franchise
tax because their tax credits exactly offset their tax liability. In addition, there were 47 nontaxable returns claiming
the short-period tax credit.

SECTION II
INCOME TAX ______________________________________________________________________________
-16-
C CORPORATIONS
Of the 81,657 tax returns that were filed for tax year 2018, only 28,136 (34.5%) of them had a net tax
liability (i.e., a positive tax liability after credits were applied).
Table 2.1 and Figure 2.2 show the distribution of C corporation returns and net income tax liability by North
Carolina net taxable income (as calculated on Line 25 of Form CD-405).
Table 2.1
C Corporation Returns and Net Income Tax Liability by NC Net Taxable Income
Tax Year 2018
Note: Figures are partially based on unaudited returns. Breakout percentages may not add to totals due to rounding.
Net Income
NC Net Number Cumulative Tax Liability Cumulative
Taxable Income of Returns Percent Percent [$] Percent Percent
$0 or less 53,137 65.1% 65.1% 0 -- --
$1-$15,000 11,204 13.7% 78.8% 1,527,554 0.2% 0.2%
$15,001-30,000 3,159 3.9% 82.7% 2,056,055 0.3% 0.5%
$30,001-$50,000 2,325 2.8% 85.5% 2,712,101 0.4% 0.9%
$50,001-$100,000 2,814 3.4% 89.0% 6,035,267 0.8% 1.7%
$100,001-$500,000 4,983 6.1% 95.1% 34,423,927 4.7% 6.4%
$500,001-$1,000,000 1,395 1.7% 96.8% 29,384,215 4.0% 10.3%
$1,000,001-$10,000,000 2,242 2.7% 99.5% 195,196,554 26.5% 36.9%
$10,000,001+ 398 0.5% 100.0% 464,692,124 63.1% 100.0%
Total 81,657 100.0% -- 736,027,797 100.0% --

SECTION II
INCOME TAX ______________________________________________________________________________
-17-
As shown in Table 2.1 and Figure 2.2 on the previous page, C corporations with a North Carolina Taxable
Income of over $1 million were liable for 89.7% of the C corporation income tax liability, but made up
3.2% of the corporations filing returns. Approximately 63% of the total C corporation net income tax
liability was attributable to the 398 corporations with North Carolina Taxable Income of over $10 million.
Figure 2.3 provides the distribution of returns and tax liability by federal taxable income before Net
Operating Loss carryforwards and also before subtracting income apportionable or allocable to other states.
Therefore, this distribution gives a break-down of income based on a company’s current-year national
taxable income.
As shown in Figure 2.3, corporations with federal taxable income (before NOL) over $25 million paid over
seventy-five percent of North Carolina net income tax.
.

SECTION II
INCOME TAX ______________________________________________________________________________
-18-
Table 2.4 compares the distribution of returns by apportionment percentage and federal taxable income. A
corporation’s apportionment percentage is used to determine how much of the corporation’s total
apportionable income may be taxed by North Carolina. For most types of companies, the percentage is
based on how much of the corporation’s property, payroll, and sales are in North Carolina, with sales being
given a quadruple weight.
Table 2.4
C Corporation Returns by Federal Taxable Income (Before NOL) and
Apportionment Percentage
Tax Year 2018
Note: Figures are based partially on unaudited returns.
Table 2.5 and Figure 2.6 show the net income tax liability by apportionment percentage and federal taxable
income.
Table 2.5
C Corporation Net Income Tax Liability by Federal Taxable Income (Before NOL) and
Apportionment Percentage
Tax Year 2018
Note: Figures are based partially on unaudited returns.
NC Apportionment Percentage
Federal Taxable Income
(before NOL) <5% 5% - 24% 25% - 49% 50% - 99% 100% Total
$0 or less 13,692 2,194 507 641 25,230 42,264
$1 - $20,000 851 202 62 175 10,048 11,338
$20,001- $100,000 1,366 345 128 286 4,881 7,006
$100,001 - $ 1,000,000 3,940 939 234 458 2,305 7,876
$1,000,001 - $10,000,000 5,503 1,093 172 201 364 7,333
$10,000,001-$25,000,000 1,910 284 24 23 22 2,263
$25,000,001+ 3,144 366 25 23 19 3,577
Total 30,406 5,423 1,152 1,807 42,869 81,657
NC Apportionment Percentage
Federal Taxable Income <5% 5% - 24% 25% - 49% 50% - 99% 100% Total
(before NOL) [$] [$] [$] [$] [$] [$]
$0 or less 23,655,154 6,038,651 1,424,021 4,614,554 1,545,259 37,277,639
$1 - $20,000 18,216 18,988 10,833 55,239 1,757,076 1,860,352
$20,001- $100,000 66,425 102,137 74,877 556,625 5,544,244 6,344,308
$100,001 - $ 1,000,000 1,500,426 1,406,481 942,485 4,008,119 15,783,710 23,641,221
$1,000,001 - $10,000,000 12,194,905 12,077,464 6,565,646 14,179,525 21,701,249 66,718,789
$10,000,001-$25,000,000 14,318,518 11,968,248 3,295,596 6,912,918 7,043,676 43,538,956
$25,000,001+ 344,091,745 156,731,811 19,512,636 24,860,808 11,449,532 556,646,532
Total 395,845,389 188,343,780 31,826,094 55,187,788 64,824,746 736,027,797

SECTION II
INCOME TAX ______________________________________________________________________________
-19-
C corporations that operated exclusively within North Carolina, and so apportion all of their income to the
state, made up 52.5% of the returns filed for tax year 2018. However, these corporations accounted for only
8.8% of the corporation income tax liability.
The State receives a significant portion of its corporation income taxes from a small number of large multi-
state firms. Sixty-eight percent of corporation income tax was attributable to corporations with Federal
Taxable Income of over $25 million that apportioned less than 25% of their income to North Carolina. The
economic success, sales patterns, and tax planning decisions of this relatively small number of large, multi-
state companies can significantly affect North Carolina’s corporation income tax revenues.

SECTION II
INCOME TAX ______________________________________________________________________________
-20-
Table 2.7 on the next page shows statistics on the calculation of net tax liability at various steps, starting
with federal taxable income. Returns are divided into taxable and nontaxable returns, where taxable returns
are defined as those with a positive tax liability before credits are applied. The taxable returns are further
broken out by federal taxable income brackets.
Out of 81,657 returns, 34.5% were taxable returns and 65.5% were nontaxable returns. Taxable returns
with a federal taxable income over $25 million made up 3.2% of the returns but accounted for 75.6% of the
tax liability.
Of the 42,264 returns with federal taxable income of zero or less, 1,860 had a North Carolina tax liability
as a result of adjustment to income or the allocation of nonapportionable income to North Carolina. Of the
remaining 39,393 returns that did show a federal taxable income, 13,115 did not have a North Carolina
liability. One can trace through the calculations in Table 2.7 to see what factors contributed to the
elimination of tax liability for these latter companies. From federal taxable income of $377.3 billion, there
was a reduction of $97.1 billion due to NC adjustments, a decrease of $2.7 billion due to nonapportionable
income, a reduction of $272.6 billion due to apportioning income to North Carolina, and a reduction of $6.0
billion due to State Net Loss carryforwards.11
Some corporations have negative federal taxable income but pay North Carolina taxes because provisions
of the State tax code require that they add back certain amounts. One of those addbacks in 2018 was for the
bonus depreciation allowances at the federal level. The Tax Cuts and Jobs Act (TCJA) of 2017 increased
bonus depreciation to 100% for property acquired and placed in service after September 27, 2017. As such,
these addbacks are only a temporary addition to tax, as they will be offset by future deductions.12
Finally, North Carolina tax credits for businesses reduced overall C corporation tax liabilities by $49.0
million.
11 Eligible contributions have been deducted by taxpayers in determining their federal taxable income. For the
calculation of NC taxable income on Form CD-405, these contributions are added back under adjustments to federal
income. Then, contributions are deducted on separate lines of the return using the State’s rules. A similar procedure
is used for depletion adjustments. 12 Under the provisions of NCGS § 105-130.5B, taxpayers taking a special accelerated depreciation deduction under
section 168(k) or 168(n) of the IRS Code must add back 85% of the amount to their NC taxable income. In each of
the succeeding 5 taxable years, the taxpayer may deduct 20% of the add-back amount.

SECTION II
INCOME TAX ____________________________________________________________________________________________________________
-20-
Table 2.7
C Corporation Income Tax Calculation Detail by Federal Taxable Income (Before NOL)
Tax Year 2018
**Not shown to maintain taxpayer confidentiality. Amounts are included in totals. Note: Amounts are based on both audited and unaudited returns.
(+) (-) (-) (-) (=)
Number of
Federal Taxable
Income, Before NOL
Adjustments to
Federal Income
Contributions to
Donees Outside NC Nonapportionable Income
Reduction Due To
Apportionment
Income Apportioned
to NC
FTI of Corporation Returns [$] [$] [$] [$] [$] [$]
Taxable Returns
$0 or less 1,860 (32,927,343,191) 82,670,704,215 144,985,556 (467,010,034) 48,691,214,101 1,374,171,401
$1-$20,000 7,267 47,286,296 47,131,483 219,920 (2,512,198) 30,978,292 65,731,765
$20,001-$100,000 4,802 234,402,117 91,349,546 1,046,950 4,454,847 93,400,628 226,849,238
$100,001-$1,000,000 5,134 1,943,933,911 1,111,528,362 9,834,293 94,010,447 2,121,990,030 829,627,503
$1,000,001-$10,000,000 4,916 18,735,513,515 13,684,349,177 351,894,020 577,409,928 29,190,967,756 2,299,590,988
$10,000,001-$25,000,000 1,561 24,823,603,902 5,618,826,953 113,381,073 445,209,882 28,366,705,933 1,517,133,967
$25,000,001+ 2,598 841,333,371,716 54,987,363,793 5,567,960,025 2,987,106,155 866,283,815,044 21,481,854,285
Total, Taxable 28,138 854,190,768,266 158,211,253,529 6,189,321,837 3,638,669,027 974,779,071,784 27,794,959,147
Nontaxable Returns
$0 or less 40,404 (347,151,302,120) 106,767,687,130 148,764,079 (1,227,103,170) (229,826,498,972) (9,478,776,927)
More than $0 13,115 377,267,753,888 (97,078,543,839) 1,934,143,011 2,687,888,707 272,633,245,195 2,933,933,136
Total, Nontaxable 53,519 30,116,451,768 9,689,143,291 2,082,907,090 1,460,785,537 42,806,746,223 (6,544,843,791)
(+) (-) (-) (-) (=) (-) (=)
Nonapportion-
able Income
Allocated to NC
Percentage Depletion
Over Cost Depletion Net Economic Loss
Contributions to NC
Donees Net Taxable Income Computed Income Tax Tax Credits Net Tax Liability
FTI of Corporation [$] [$] [$] [$] [$] [$] [$] [$]
Taxable Returns
$0 or less ** ** 140,055,469 2,066,916 1,260,104,248 37,803,146 525,507 37,277,639
$1-$20,000 ** ** 3,911,652 257,759 62,010,521 ** ** 1,860,352
$20,001-$100,000 ** ** 16,051,604 1,105,914 211,623,873 ** ** 6,344,308
$100,001-$1,000,000 ** ** 52,546,050 4,562,816 790,328,542 23,709,906 68,685 23,641,221
$1,000,001-$10,000,000 ** ** 114,882,545 6,812,243 2,250,588,682 67,517,671 798,882 66,718,789
$10,000,001-$25,000,000 ** ** 70,467,425 4,625,651 1,466,218,196 43,986,557 447,601 43,538,956
$25,000,001+ ** ** 1,286,541,717 97,028,388 20,127,234,616 603,817,068 47,170,536 556,646,532
Total, Taxable ** ** 1,684,456,462 116,459,687 26,168,108,678 776,834,348 49,011,211 736,027,797
Nontaxable Returns
$0 or less ** ** 4,859,178,593 35,677,617 (13,830,697,291) - - -
More than $0 ** ** 5,993,555,378 1,279,605 (3,102,019,366) - - -
Total, Nontaxable ** ** 10,852,733,971 36,957,222 (16,932,716,657) - - -
- 21
-

SECTION II
INCOME TAX ______________________________________________________________________________
-22-
Income Tax Credits: Table 2.8 shows the number of taxpayers taking income tax credits, broken out by
the percentage of income tax offset by the credits. Over 99% of the 28,138 returns with positive tax liability
before credits did not take any income tax credits. Over eighty-one percent of the 175 returns taking credits
had over 40% of their tax liability offset by income tax credits. As shown in Table 2.9, these returns
accounted for 97.3% of the total credits taken.
Table 2.8
Number of C Corporation Taxable Returns Taking Credits as a Percentage of Tax Liability
Tax Year 2018
**Not shown to maintain taxpayer confidentiality. Amounts are included in totals. Note: Figures are based partially on unaudited returns. The table does not include returns that had zero or negative taxable income.
.
Table 2.9
Amount of C Corporation Tax Credits Taken as a Percentage of Tax Liability
Tax Year 2018
**Not shown to maintain taxpayer confidentiality. Amounts are included in totals.
Note: Figures are based partially on unaudited returns.
NC Taxable Income
0% 0.1% -9.9% 10% -19.9% 20% -39.9% 40% + Total
$1-$100,000 19,085 ** ** ** ** 19,120
$100,001-$500,000 4,957 ** ** ** ** 4,983
$500,001-$1,000,000 1,383 ** ** ** ** 1,395
$1,000,001-$10,000,000 2,181 ** ** ** 48 2,242
$10,000,001+ 357 ** ** ** 30 398
Total 27,963 19 ** ** 143 28,138
Income Tax Credits as a Percentage of Tax
NC Taxable Income 0.1% -9.9% 10% -19.9% 20% -39.9% 40% + Total
[$] [$] [$] [$] [$]
$1-$100,000 ** ** ** ** 17,474
$100,001-$500,000 ** ** ** ** 90,739
$500,001-$1,000,000 ** ** ** ** 121,292
$1,000,001-$10,000,000 ** ** ** 2,456,782 2,653,193
$10,000,001+ ** ** ** 45,036,405 46,132,938
Total 523,505 ** ** 47,704,819 49,015,636
Income Tax Credits as a Percentage of Tax

SECTION II
INCOME TAX ______________________________________________________________________________
-23-
Figure 2.10 shows the average amount of tax liability offset by tax credits for the various taxable income
groups. The offset was greater for taxpayers with at least $50 million in federal taxable income.
.
Table 2.11
C Corporation Income Tax Credits by Credit Type
Tax Year 2018
*A given taxpayer may be counted in more than one category. ** Most C corporation income tax credits are reduced due to NCGS § 105-130.5(a)(10).
Note: Calculations are based partially on unaudited returns.
Income Tax Credits Number of
Credits*
Amount
($)
Non-Limited Credits and Carryforwards 21 17,113,936
Tax Credit Subject to 50% of Tax Limit 166 33,352,695
C-Corporation adjustment** 168 (1,450,995)
Credits Taken 175 49,015,636
All Returns

SECTION II
INCOME TAX ______________________________________________________________________________
-24-
S CORPORATIONS
S corporations pass their income tax liability through to shareholders, who pay tax on the income according
to the individual income tax rate schedule. S corporations that have shareholders who are not North Carolina
residents may pass the tax liability to those shareholders only if the nonresidents have agreed to pay North
Carolina taxes on their share of the corporation’s income. For nonresident shareholders who fail to sign
such an agreement, the S corporations must file a composite return and pay the tax for the shareholders.
The tax for nonresidents filing composite is calculated according to the individual income tax rate schedule,
but the collections are considered corporate income tax receipts.
Table 2.12 and Figure 2.13 show the number of returns and net income tax liability by North Carolina
taxable income. Corporations with taxable income of $1 million or more accounted for 59.5% of the tax
liability, but only 1.7% of returns.
The total net tax liability of $99.7 million shown in Table 2.12 belies the importance of taxation of the net
income of S corporations since most taxable income is passed to shareholders.
Table 2.12
S-Corporation Returns and Net Income Tax Liability by NC Taxable Income
Tax Year 2018
* North Carolina taxable income is the sum of the corporation's total apportionable and allocable income plus separately stated items of income
attributable to nonresidents filing a composite return
Note: Calculations are based partially on unaudited returns. Breakout percentages may not add to totals due to rounding.
Net
Tax Liability
NC Taxable Income* Percent [$] Percent
$0 or less 55,542 32.3% 0 0 0.0%
$1-$15,000 32,414 18.9% 4,187 1,052,414 1.0%
$15,001-30,000 17,270 10.1% 1,162 1,323,947 1.3%
$30,001-$50,000 15,268 8.9% 903 1,820,568 1.7%
$50,001-$100,000 19,951 11.6% 1,127 4,089,109 3.9%
$100,001-$500,000 24,861 14.5% 1,844 21,003,709 20.1%
$500,001-$1,000,000 3,514 2.0% 389 13,097,347 12.5%
$1,000,001-$10,000,000 2,797 1.6% 349 38,426,949 36.8%
$10,000,001+ 136 0.1% 29 23,723,701 22.7%
Total 171,753 100.0% 9,990 104,537,744 100.0%
Number of
Returns
Number With
Tax Due for
Nonresidents

SECTION II
INCOME TAX ______________________________________________________________________________
-25-
Figure 2.14 illustrates the distribution of returns by North Carolina taxable income and nonresident
shareholder filing status. Only 5.8% of S corporation returns had a tax liability attributable to nonresidents
who chose to allow the S corporation to file a composite return on their behalf.

SECTION II
INCOME TAX ____________________________________________________________________________________________________________
-26-
Table 2.15 provides summary data for the main components of the progression from taxpayers’ federal taxable income to North Carolina net tax
liability.
Table 2.15
S Corporation Income Tax Calculation Detail
Tax Year 2018
Note: Figures are based partially on unaudited returns.
(+) (+) (-) (-) (=) (+)
Number of Returns
Federal
Corporation Income
Adjustments to
Federal Income
Nonapportion-
able Income
Reduction Due To
Apportionment
Income Apportioned
to NC
Nonapportion-
able Income
Allocated to NC
NC Taxable Income [$] [$] [$] [$] [$] [$]
Zero or Negative 55,542 7,496,245,188 600,092,978 1,107,878,788 9,008,599,586 (2,020,140,208) (12,953,629)
Positive, But No Income Attributable to Nonresidents Filing Composite 106,176 51,028,414,163 3,156,869,709 2,544,137,518 34,108,039,380 17,533,106,974 395,587,563
Positive, With Income Attributable to Nonresidents Filing Composite 10,035 58,326,095,957 5,397,675,027 1,724,201,864 59,745,084,048 2,254,485,072 62,252,685
Total 171,753 116,850,755,308 9,154,637,714 5,376,218,170 102,861,723,014 17,767,451,838 444,886,619
(=) (+) (=) (-) (=)
NC
Net Taxable Income
Adjustment for
Shareholders
Paying Tax on
Shares
Taxable Income
Attributable to
Nonresidents Filing
Composite
Separately Stated
Income
Attributable to
Nonresidents
Filing Composite
Computed Income
Tax Tax Credits Net Tax Liability
NC Taxable Income [$] [$] [$] [$] [$] [$] [$]
Zero or Negative (1,858,986,007) 1,711,939,996 (147,046,011) 265,964 - - -
Positive, But No Income Attributable to Nonresidents Filing Composite 16,397,267,917 (16,397,267,917) - 1,871,976 103,074 - 103,074
Positive, With Income Attributable to Nonresidents Filing Composite 2,191,443,702 (294,110,308) 1,897,333,394 11,819,128 105,000,482 565,812 104,434,670
Total 16,729,725,612 (14,979,438,229) 1,750,287,383 13,957,068 105,103,556 565,812 104,537,744
- 26
-

SECTION III
TRENDS
______________________________________________________________________________
- 27 --- 27 -~ - 27 - ~
C CORPORATIONS
In this section, data on corporate returns are presented for tax years 2013 through 2018. Similar information
for earlier years can be found in previous editions of this publication.
Table 3.1 compares the number of C corporation returns by tax year. Since the 2007 recession, there was a
general decline from a peak of 80,552 returns, but the number of returns has seen a rebound since 2014.13
Data from the IRS Statistics of Income Division also shows a decline in the number of Form 1120 filers
nationally between 2008 and 2013.14
The number of first-time filers, as reported on the tax form, was 6,036 in 2018 and 5,432 in 2017. These
numbers are higher than in prior years since the Great Recession. The number of new filers was
approximately 5,000 annually during the period from 2005 through 2007.
13 There was a small increase in NC C corporation returns between 2010 and 2011. 14 Annual statistical reports are available at https://www.irs.gov/statistics/soi-tax-stats-table-16-returns-of-active-
corporations-form-1120.

SECTION III
TRENDS
______________________________________________________________________________
- 28 --- 28 -~ - 28 - ~
Figure 3.2 shows the net tax liability for both the franchise tax and the corporation income tax from 2013
through 2018 for C corporations.
The decreases in income tax revenues since 2014 reflects mainly the decrease in the tax rates in these years.
In 2014, the income tax rate decreased from 6.9% to 6.0%; it was reduced further in 2015 to 5.0% and to
4.0% in 2016. In 2017 and 2018, the tax rate was 3.0%.

SECTION III
TRENDS
______________________________________________________________________________
- 29 --- 29 -~ - 29 - ~
Table 3.3 and Figure 3.4 compare the net income tax liability of C corporations in tax year 2013 and tax
year 2018 by NC taxable income brackets. Each taxable income bracket has experienced a decrease in tax
liability due to the decline in the tax rate.
Table 3.3
C Corporation Net Income Tax Liability by NC Taxable Income
Tax Year 2013 & Tax Year 2018
Note: The tax rate in 2013 was 6.9% and the tax rate in 2018 was 3.0%.
NC Taxable Income
Net Income Tax
Liability
TY 2013
Net Income Tax
Liability
TY 2018
%
Difference
$0 or less - - --
$1-$15,000 3,285,969 1,527,554 -53.5%
$15,001-$30,000 3,960,694 2,056,055 -48.1%
$30,001-$50,000 5,315,741 2,712,101 -49.0%
$50,001-$100,000 11,280,918 6,035,267 -46.5%
$100,001-$500,000 58,432,293 34,423,927 -41.1%
$500,001-$1,000,000 46,905,514 29,384,215 -37.4%
$1,000,001-$10,000,000 291,915,821 195,196,554 -33.1%
$10,000,001+ 717,759,993 464,692,124 -35.3%
Total 1,138,856,943 736,027,797 -35.4%

SECTION III
TRENDS
______________________________________________________________________________
- 30 --- 30 -~ - 30 - ~
Trends in tax credit usage by C corporations. Over the preceding several years, a number of tax credits
that have been used by corporations have been repealed. Table 3.5 provides a list of some of the tax credits
that have been available to corporations in recent years and information on the expiration date of generating
these credits.
Table 3.5
Various Tax Credits Available to Corporations in Recent Years
Figure 3.6 shows the amount of credits taken by C corporations against the franchise and corporate income
tax for tax years 2013 through 2018. Income tax credits have decreased sharply since 2014, while franchise
tax credits have had a much smaller decline since 2015. Even though some credits cannot be generated after
a certain date, installments and carryforwards of unused credits will continue to be taken in future years.15
15 Figure 3.6 does not include film production tax credit usage.
Franchise
Tax
Corporate Income
Tax
Creating Jobs - Art 3J Y Y Y 2013
Investing in Business Property - Art 3J Y Y Y 2013
N.C. State Ports N Y Y 2013
Work opportunity Y Y Y 2013
Research & Development - Art 3F Y Y Y 2015
Renewable Energy - Art 3B Y Y Y 2016*
Film Production N Y N† **
Historic Mill Rehabilitation - Art 3H Y Y N ***
Cigarette Exportation N Y Y 2017
Historic Rehabilitation - Art 3L Y Y N ****
Railroad Intermodal Facility - Art 3K Y Y Y 2037
Recycling Facility - Art 3C Y Y N None
Short period credit for change in income year Y N N† None
Notes:
†This is a refundable tax credit; amount of credit is not limited by tax liability
*A biomass resource project may generate credits if placed in service before May 5, 2017
**A taxpayer can claim a credit for expenses occurring before Jan. 1, 2015
***A taxpayer can claim a credit for a project for which an application for an eligibility certification is submitted prior to Jan. 1, 2015
(The Article 3H credit was re-enacted for an eligible railroad station in 2019 for the 2021 and 2022 tax years.)
****A taxpayer can claim a credit for expenses occurring before Jan. 1, 2024
Tax Credit Description
Credit allowed againstLimited to 50%
of tax liability?
Last Tax Year to
generate credits
SECTION III
TRENDS
______________________________________________________________________________
- 31 --- 31 -~ - 31 - ~
S CORPORATIONS
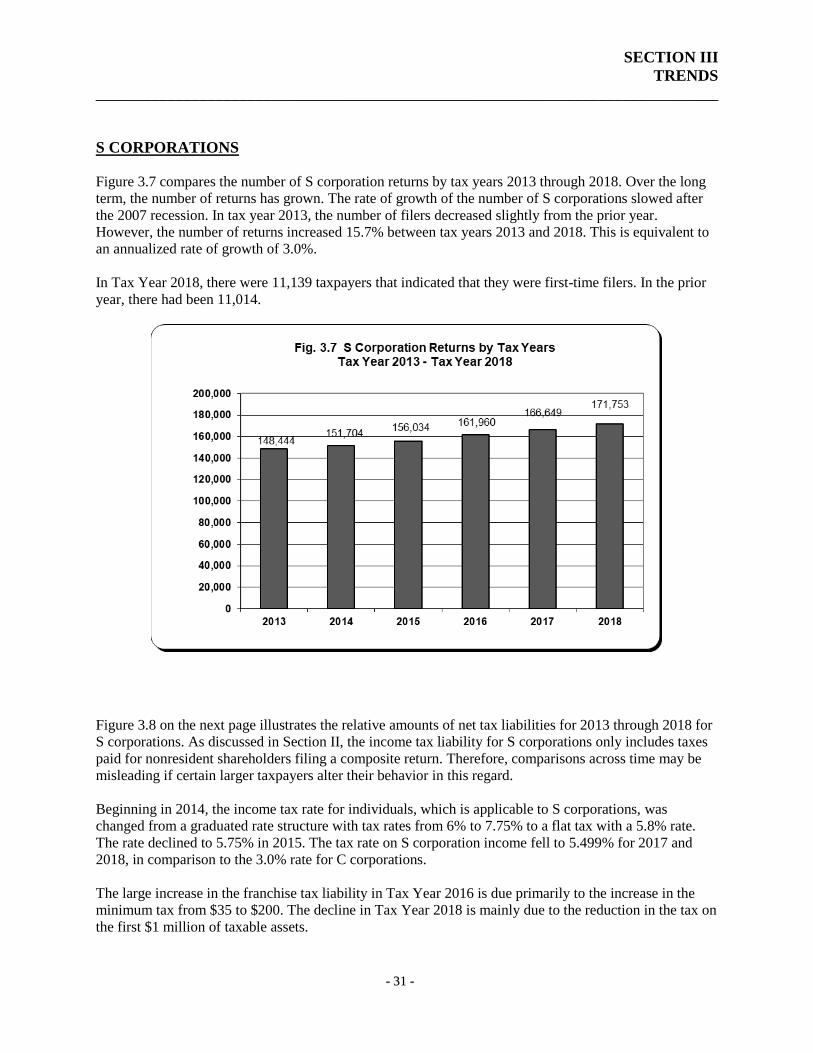
Figure 3.7 compares the number of S corporation returns by tax years 2013 through 2018. Over the long
term, the number of returns has grown. The rate of growth of the number of S corporations slowed after
the 2007 recession. In tax year 2013, the number of filers decreased slightly from the prior year.
However, the number of returns increased 15.7% between tax years 2013 and 2018. This is equivalent to
an annualized rate of growth of 3.0%.
In Tax Year 2018, there were 11,139 taxpayers that indicated that they were first-time filers. In the prior
year, there had been 11,014.
Figure 3.8 on the next page illustrates the relative amounts of net tax liabilities for 2013 through 2018 for
S corporations. As discussed in Section II, the income tax liability for S corporations only includes taxes
paid for nonresident shareholders filing a composite return. Therefore, comparisons across time may be
misleading if certain larger taxpayers alter their behavior in this regard.
Beginning in 2014, the income tax rate for individuals, which is applicable to S corporations, was
changed from a graduated rate structure with tax rates from 6% to 7.75% to a flat tax with a 5.8% rate.
The rate declined to 5.75% in 2015. The tax rate on S corporation income fell to 5.499% for 2017 and
2018, in comparison to the 3.0% rate for C corporations.
The large increase in the franchise tax liability in Tax Year 2016 is due primarily to the increase in the
minimum tax from $35 to $200. The decline in Tax Year 2018 is mainly due to the reduction in the tax on
the first $1 million of taxable assets.

SECTION III
TRENDS
______________________________________________________________________________
- 32 --- 32 -~ - 32 - ~
Figure 3.9 compares the number of S corporation returns in tax years 2013 and 2018 by NC taxable
income brackets. The total number of returns has grown in each bracket, with the smallest increase for
those with zero or negative taxable income. The percentage growth has been greatest in the largest NC
taxable income bracket. However, the returns are still predominantly those with less than $100,000 in
taxable income.

SECTION IV
FISCAL YEAR STATISTICS
______________________________________________________________________________
- 33 --- 33 -~ 33 ~
Fiscal Year Filing Statistics. Taxpayers may calculate their net income based on a calendar year or an
alternative fiscal year that ends on the last day of any month other than December. Taxpayers may also
use a 52/53 week fiscal year, as allowed under the IRS Code. This section reports tax statistics based on
the month in which the fiscal year begins.
Table 4.1 shows the distribution of C corporation returns by the month in which their fiscal year begins,
as well as for short-period returns. Calendar year returns comprised 77.2% of full-year returns and 72.7%
of all returns. Their net franchise tax liability was 73.4% of the total, and their net income tax liability
made up 67.5% of the total.
Table 4.1
C Corporation Statistics by Fiscal Year Start Month
Tax Year 2018
Note: For this table, short-period returns are all returns where the recorded tax year is less than 360 days. These were mainly
corporations that changed their accounting periods during the year, existed less than a full year, or adopted the tax year of
an affiliated corporation.
For S corporations, calendar year filers comprised 93.7% of the 171,753 returns and 98.7% of the 163,089
full-year returns. They represented 87.2% of net franchise tax liabilities and 87.9% of the net corporation
income tax liabilities. There were 8,664 short-period returns included in the S corporation returns.
All Returns
Tax Year Start MonthNumber of
returnsNumber
Amount
($) Number
Amount
($)
January 58,450 48,229 475,707,291 19,370 496,557,580
February 1,056 1,020 30,790,943 421 36,090,396
March 603 582 2,847,153 241 2,871,051
April 3,115 2,978 24,661,753 1,349 30,513,749
May 923 852 5,459,282 390 11,115,042
June 910 807 5,569,142 398 12,975,810
July 4,017 3,384 19,152,165 1,549 26,415,122
August 849 784 6,350,573 367 20,482,164
September 839 784 4,494,252 368 6,332,913
October 3,147 2,902 26,733,836 1,298 33,574,232
November 1,113 1,070 7,250,072 457 9,063,027
December 698 664 6,538,193 296 5,259,559
Short-period returns 5,937 5,102 32,675,741 1,632 44,777,152
Total 81,657 69,158 648,230,396 28,136 736,027,797
Franchise Tax Income Tax

SECTION V
INDUSTRY SECTORS
______________________________________________________________________________
- 34 --- 34 -~ 34 ~
C-CORPORATIONS
Table 5.1 shows franchise and income tax liabilities by major industry sector. The manufacturing sector
had the largest tax liability for both the franchise tax and the income tax, approximately 26.5% of the total
amount. Other sectors with relatively high shares of tax liability include finance and insurance; retail;
information; real estate, rental & leasing; professional, scientific, and technical services; and wholesale.
Table 5.1
C Corporation Franchise Tax and Income Tax Liability by Industry Sector
Tax Year 2018
Note: The amounts in this table are based partially on unaudited returns. In some cases, revisions were made to the NAICS codes reported by
taxpayers. If it was evident that a taxpayer reported an old NAICS or SIC code, these were converted to newer codes. Also, holding companies often listed their NAICS code as "Management of Companies." One hundred twenty-nine (129) of these taxpayers were
reassigned to other industries based on information concerning the main business of these companies. (These reassignments were made by
staff of the Revenue Research Section, mainly for four of the industry sectors: manufacturing; retail; information; and finance and insurance.) In addition, all bank holding companies (NAICS=551111) were reassigned to the Finance & Insurance sector.
All Returns
Industry SectorNumber of
returnsNumber
Amount
($) Number
Amount
($)
Agriculture, Forestry, Fishing and Hunting 1,105 1,064 3,165,464 344 2,440,680
Mining 161 154 3,041,858 59 2,381,328
Utilities 233 206 37,855,196 55 6,103,222
Construction 6,012 5,822 15,372,994 2,448 27,655,735
Manufacturing 8,005 7,798 184,010,905 3,314 182,383,466
Wholesale 5,814 5,639 42,908,977 2,683 51,364,768
Retail 5,404 5,185 46,474,808 2,109 73,974,108
Transportation 2,142 2,068 9,570,864 924 17,314,992
Couriers and Warehousing 186 184 887,849 68 1,476,849
Information 2,569 2,433 52,827,444 772 61,828,505
Finance and Insurance 7,485 6,622 103,198,739 2,561 155,765,201
Real Estate and Rental & Leasing 11,658 6,891 54,351,168 2,668 42,440,586
Professional, Scientific and Technical Services 10,890 10,388 42,729,346 3,779 53,920,170
Management of Companies / see note 2,374 2,260 25,115,664 758 17,768,229
Administration & Support and
Waste Management & Remediation Services 3,204 2,632 7,157,118 1,120 11,227,010
Educational Services 458 414 697,830 152 848,383
Health Care and Social Assistance 2,795 2,575 7,632,185 927 10,393,585
Arts, Entertainment and Recreation 922 794 1,690,936 342 1,092,283
Accommodations and Food Services 2,166 2,050 5,889,367 1,043 10,344,366
Other Services 4,625 2,828 2,642,919 1,337 3,980,151
Unidentifiable 3,449 1,151 1,008,765 673 1,324,180
Total 81,657 69,158 648,230,396 28,136 736,027,797
Franchise Tax Income Tax

SECTION V
INDUSTRY SECTORS
______________________________________________________________________________
- 35 --- 35 -~ 35 ~
Table 5.2 provides a breakout of the income tax calculation similar to Table 2.7 for various industry
sectors.
Table 5.2
C Corporation Income Tax Calculation Detail for Certain Industry Sectors
Tax Year 2018
Note: Refer to the note on the previous page for identification of NAICS code industry sectors. A "**" in a cell indicates that the
amount is withheld to protect taxpayer confidentiality. Amounts are based on both audited and unaudited returns.
Total Construction Manufacturing Wholesale Retail Information Finance & Insurance
Real Estate, Rental
& LeasingProfessional Services
Taxable Returns
Number of returns 28,138 1,448 3,316 2,683 2,109 772 2,561 2,668 3,779
Federal Taxable Income, Before NOL 854,190,768,266 6,726,171,231 271,767,469,313 49,620,890,632 64,151,660,726 109,590,131,267 193,252,327,897 20,106,584,733 68,534,574,841
(+) Adjustments to Federal Income 158,211,253,529 1,375,610,197 691,268,816 9,277,869,132 24,074,493,206 18,819,914,560 50,441,852,985 23,367,763,107 6,834,101,841
(-) Contributions to Donees Outside NC 6,189,321,837 54,382,916 2,130,817,973 429,841,195 1,137,396,229 ** 1,166,484,433 115,593,929 384,299,158
(-) Nonapportionable Income 3,638,669,027 21,171,982 286,689,254 896,332,867 16,288,379 ** 709,424,887 53,646,663 163,859,425
(-) Reduction Due to Apportionment 974,779,071,784 7,077,922,915 262,999,643,780 55,798,700,560 84,500,988,189 125,455,872,478 235,340,101,391 41,830,636,119 72,836,499,479
(=) Income Apportioned to NC 27,794,959,147 948,303,615 7,041,587,122 1,773,885,142 2,571,481,135 2,354,053,467 6,478,170,171 1,474,471,129 1,984,018,620
(+) Nonapportionable Income Allocated to NC ** ** 26,562,194 7,191,190 ** ** 101,079,506 ** 1,912,448
(-) Percentage Depletion Over Cost Depletion ** ** 0 0 ** ** 0 ** 0
(-) State Net Loss 1,684,456,462 23,451,413 679,646,537 53,659,740 42,086,631 246,869,223 189,677,588 84,336,744 158,303,480
(-) Contributions to NC Donees 116,459,687 2,860,332 12,391,840 1,755,073 32,654,831 4,061,471 52,514,501 556,773 1,734,230
(=) Net Taxable Income 26,168,108,678 923,013,056 6,376,110,939 1,725,661,519 2,499,594,065 2,100,846,790 6,337,057,588 1,415,792,836 1,825,893,358
Computed Income Tax 785,043,433 ** 191,283,349 ** ** ** 190,111,749 ** 54,776,827
(-) Tax Credits 49,015,636 ** 8,899,883 ** ** ** 34,346,548 ** 856,657
(=) Net Tax Liability 736,027,797 27,655,735 182,383,466 51,364,768 73,974,108 61,828,505 155,765,201 42,440,586 53,920,170
Total Construction Manufacturing Wholesale Retail Information Finance & InsuranceReal Estate, Rental
& LeasingProfessional Services
Non-Taxable Returns
Number of returns 53,519 3,564 4,689 3,131 3,295 1,797 4,924 8,990 7,111
Federal Taxable Income, Before NOL 30,116,451,768 1,719,207,076 81,927,741,806 -10,013,276,846 -12,333,030,927 -15,285,415,556 44,625,228,412 -14,092,030,165 -3,615,902,866
(+) Adjustments to Federal Income 9,689,143,291 2,101,937,705 -19,342,834,965 3,580,884,081 7,360,043,102 21,999,251,423 -24,077,023,582 9,024,957,778 -337,207,981
(-) Contributions to Donees Outside NC 2,082,907,090 12,563,278 1,398,647,503 36,289,390 151,096,431 79,469,438 139,239,260 5,528,160 75,551,319
(-) Nonapportionable Income 1,460,785,537 3,334,841 609,836,300 -211,745,356 21,939,833 466,904,683 -218,672,939 281,418,448 264,561,721
(-) Reduction Due to Apportionment -197,954,602,414 3,823,928,817 61,272,408,486 -5,995,841,336 -4,759,693,337 6,538,669,020 20,892,461,942 -5,128,817,029 -2,909,955,287
(=) Income Apportioned to NC -6,544,843,791 -18,682,155 -695,985,448 -261,095,463 -386,330,752 -371,207,274 -264,823,433 -225,201,966 -1,383,268,600
(+) Nonapportionable Income Allocated to NC ** ** ** ** ** -26,228,382 -96,783,994 ** 716,658
(-) Percentage Depletion Over Cost Depletion ** ** ** ** ** 0 0 ** 0
(-) State Net Loss 10,852,733,971 745,923,438 3,229,025,532 412,024,036 504,784,698 ** ** ** **
(-) Contributions to NC Donees 36,957,222 29,231 876,857 32,979 64,876 ** ** ** **
(=) Net Taxable Income -16,932,716,657 -764,390,065 -3,908,901,182 -690,885,523 -891,210,611 -2,677,297,488 -985,466,253 -682,579,714 -2,253,235,889
Computed Income Tax 0 0 0 0 0 0 0 0 0
(-) Tax Credits 0 0 0 0 0 0 0 0 0
(=) Net Tax Liability 0 0 0 0 0 0 0 0 0

SECTION V
INDUSTRY SECTORS
______________________________________________________________________________
- 36 --- 36 -~ 36 ~
S CORPORATIONS
Table 5.3 shows franchise and income tax liabilities by major industry sector for S corporations. Industry
sectors that pay a relatively high share of the franchise tax include (1) retail; (2) construction; (3)
manufacturing; and (4) real estate and rental & leasing.
As mentioned in prior sections of this report, the income tax liability only includes the tax liability of
certain nonresident shareholders. An alternative measure of relative tax liability is shown on the following
pages.
Table 5.3
S Corporation Franchise Tax and Income Tax Liability by Industry Sector
Tax Year 2018
Note: Calculations are based partially on unaudited returns. Agriculture, Mining and Utilities were reported as one sector to protect confidentiality of taxpayers. In some cases, revisions were made to the NAICS codes reported by taxpayers. If it was evident that a
taxpayer reported an old NAICS or SIC code, these were converted to newer codes. Also, taxpayers that were holding companies often
listed their NAICS code as “Management of Companies.” Twenty-eight (28) of these taxpayers were reassigned to other industries based on information concerning the main business of these companies. (These reassignments were made by staff of the Revenue Research
section of the Financial Services Division.)
All Returns
Industry SectorNumber of
returnsNumber
Amount
($) Number
Amount
($)
Agriculture, Mining & Utilities 4,180 4,063 3,261,901 96 1,089,157
Construction 26,381 25,526 11,118,849 1,343 14,377,408
Manufacturing 7,309 7,017 10,078,980 978 20,958,379
Wholesale 6,784 6,494 6,449,725 853 11,679,644
Retail 16,544 15,686 12,507,259 477 7,760,878
Transportation 5,099 4,873 1,772,994 283 4,647,051
Couriers and Warehousing 481 464 241,687 27 470,242
Information 2,513 2,354 1,310,636 269 3,182,533
Finance and Insurance 7,010 6,732 4,095,512 587 3,874,584
Real Estate and Rental & Leasing 18,720 17,842 9,858,921 756 6,151,900
Professional, Scientific and Technical Services 27,902 26,575 7,189,260 2,275 13,923,902
Management of Companies 1,161 1,091 1,105,662 348 3,462,161
Administration & Support and
Waste Management & Remediation Services 7,615 7,269 2,123,960 613 6,275,147
Educational Services 1,257 1,193 365,705 70 1,044,947
Health Care and Social Assistance 11,517 11,040 4,807,890 133 825,278
Arts, Entertainment and Recreation 4,111 3,851 2,656,061 450 1,589,511
Accommodations and Food Services 8,681 8,269 3,732,261 175 2,220,758
Other Services 12,605 12,071 2,933,681 219 877,532
Unidentifiable 1,883 1,800 428,522 38 126,732
Total 171,753 164,210 86,039,466 9,990 104,537,744
Franchise Tax Income Tax

SECTION V
INDUSTRY SECTORS
______________________________________________________________________________
- 37 --- 37 -~ 37 ~
Table 5.4 shows the North Carolina net taxable income of S corporations in tax year 2018 by industry
sector. This is the income that is passed through to shareholders who then report this income on their
individual income tax returns. The industry sectors with the largest net taxable income are (1)
construction; (2) professional, scientific and technical services; (3) manufacturing; (4) wholesale; (5)
retail; (6) real estate and rental & leasing; and (7) health care and social assistance..
Table 5.4
S Corporation NC Net Taxable Income by Industry Sector
Tax Year 2018
Note: Amounts shown in the table include accounts with negative values for net taxable income. Calculations are based partially on unaudited returns. In some cases, revisions were made to the NAICS codes reported by taxpayers. If it was evident that a taxpayer reported an old
NAICS or SIC code, these were converted to newer codes. . Also, taxpayers that were holding companies often listed their NAICS code as
“Management of Companies.” Twenty-eight (28) of these taxpayers were reassigned to other industries based on information concerning the main business of these companies. (These reassignments were made by staff of the Revenue Research section of the Financial Services
Division.)
Industry Sector Number of
returns
Amount
($)
Share of
total amount
Agriculture, Forestry, Fishing and Hunting 3,721 260,708,602 1.4%
Mining 116 21,815,289 0.1%
Utilities 151 9,715,989 0.1%
Construction 24,028 2,924,929,351 16.1%
Manufacturing 6,597 1,639,429,751 9.0%
Wholesale 6,240 1,494,782,556 8.2%
Retail 15,745 1,480,410,509 8.1%
Transportation 4,711 763,336,820 4.2%
Couriers and Warehousing 442 51,866,320 0.3%
Information 2,256 496,027,088 2.7%
Finance and Insurance 6,065 1,001,637,768 5.5%
Real Estate and Rental & Leasing 17,297 1,356,880,213 7.5%
Professional, Scientific and Technical Services 25,230 2,493,180,612 13.7%
Management of Companies 974 390,525,024 2.1%
Administration & Support and
Waste Management & Remediation Services 6,944 746,114,831 4.1%
Educational Services 1,194 71,348,408 0.4%
Health Care and Social Assistance 11,024 1,280,303,673 7.0%
Arts, Entertainment and Recreation 3,814 322,816,533 1.8%
Accommodations and Food Services 8,242 751,918,948 4.1%
Other Services 12,137 598,016,933 3.3%
Unidentifiable 1,369 56,573,239 0.3%
Total 158,297 18,212,338,457
Net Taxable Income

SECTION V
INDUSTRY SECTORS
______________________________________________________________________________
- 38 --- 38 -~ 38 ~
Table 5.5 shows the North Carolina net taxable income of S corporations in tax year 2018 by industry
sector for taxpayers who had positive amounts of net taxable income. The industry sectors with the largest
net taxable income are (1) construction; (2) professional, scientific and technical services; (3) manu-
facturing; (4) retail; (5) wholesale; (6) real estate and rental & leasing; and (7) health care and social
assistance.
Table 5.5
S Corporation NC Net Taxable Income (Positive Values Only) by Industry Sector
Tax Year 2018
Note: Amounts shown in the table include accounts with negative values for net taxable income. Calculations are based partially on unaudited
returns. In some cases, revisions were made to the NAICS codes reported by taxpayers. If it was evident that a taxpayer reported an old NAICS or SIC code, these were converted to newer codes. . Also, taxpayers that were holding companies often listed their NAICS code as
“Management of Companies.” Twenty-eight (28) of these taxpayers were reassigned to other industries based on information concerning
the main business of these companies. (These reassignments were made by staff of the Revenue Research section of the Financial Services Division.)
Industry Sector Number Amount
($)
Share of
total amount
Agriculture, Forestry, Fishing and Hunting 2,233 375,573,145 1.9%
Mining 81 23,757,067 0.1%
Utilities 107 11,938,276 0.1%
Construction 18,074 3,256,069,338 16.1%
Manufacturing 4,572 1,839,143,749 9.1%
Wholesale 4,683 1,587,285,691 7.8%
Retail 10,599 1,747,768,958 8.6%
Transportation 3,365 815,171,815 4.0%
Couriers and Warehousing 316 58,929,974 0.3%
Information 1,572 517,744,962 2.6%
Finance and Insurance 4,974 1,065,608,199 5.3%
Real Estate and Rental & Leasing 11,982 1,558,088,448 7.7%
Professional, Scientific and Technical Services 19,579 2,660,179,637 13.1%
Management of Companies 720 431,897,431 2.1%
Administration & Support and
Waste Management & Remediation Services 5,346 791,322,646 3.9%
Educational Services 836 80,036,144 0.4%
Health Care and Social Assistance 8,800 1,412,072,505 7.0%
Arts, Entertainment and Recreation 2,679 393,520,213 1.9%
Accommodations and Food Services 5,720 880,352,623 4.3%
Other Services 9,031 674,309,991 3.3%
Unidentifiable 895 65,008,464 0.3%
Total 116,164 20,245,779,276
Net Taxable Income
(Positive Values Only)