working party on agricultural policies and markets drivers
TRANSCRIPT

Organisation for Economic Co-operation and Development
TAD/CA/APM/WP(2020)2/ANN/FINAL
Unclassified English - Or. English
29 May 2020
TRADE AND AGRICULTURE DIRECTORATE
COMMITTEE FOR AGRICULTURE
Working Party on Agricultural Policies and Markets
Drivers of Farm Performance - Annex
Empirical Country Case Studies
Contact: Catherine Moreddu ([email protected])
JT03462282
This document, as well as any data and map included herein, are without prejudice to the status of or sovereignty over any territory, to the
delimitation of international frontiers and boundaries and to the name of any territory, city or area.

2 TAD/CA/APM/WP(2020)2/ANN/FINAL
DRIVERS OF FARM PERFORMANCE Unclassified
Note by the Secretariat
This analysis of drivers of farm performance, mandated under Expected Output
Result 2.1.2.3 of the 2017-18 Programme of Work and Budget of the Committee for
agriculture aims at empirically identifying the main conditions for, and obstacles to,
productivity and environmental sustainability of different types of farms in selected OECD
countries.
This study has been conducted by Professor Johannes Sauer (Technical University of
Munich) in collaboration with the OECD Farm-Level Analysis Network, and under the
responsibility of Catherine Moreddu.
The findings of the analysis are reported in three documents:
The Part 1 document contains a short description of the methodological framework
and data, an overview of findings by farm type, and conclusions
[TAD/CA/APM/WP(2020)2/PART1/FINAL]. It also includes three annexes.
Annex A contains the detailed methodology framework applied; Annex B contains
a review of the literature, and Annex C contains tables supporting the overview of
findings.
The Part 2 document contains the results of individual farm cases
[TAD/CA/APM/WP(2020)2/PART2/FINAL].
An annex document contains a series of background tables for each case study,
including descriptive statistics and estimation results (Annex D)
[TAD/CA/APM/WP(2020)2/ANN/FINAL].
This document contains Annex D.
These three documents were declassified by the Working Party on Agricultural Policies
and Markets on 17-18 March 2020.

TAD/CA/APM/WP(2020)2/ANN/FINAL 3
DRIVERS OF FARM PERFORMANCE Unclassified
Table of contents
Annex D. Background Tables ............................................................................................................... 8
1. Australia ............................................................................................................................................. 8
1.1. Australian dairy farms................................................................................................................... 8 1.2. Australian crop farms .................................................................................................................. 12 1.3. Australian crop and livestock farms ........................................................................................... 16 1.4. Australian beef and sheep farms ................................................................................................. 20 1.5. Australian beef farms .................................................................................................................. 24 1.6. Australian sheep farms ................................................................................................................ 28 1.7. Australian wool farms ................................................................................................................. 32
2. Chile .................................................................................................................................................. 36
2.1. Chilean small-scale fruit farms ................................................................................................... 36
3. Czech Republic ................................................................................................................................ 40
3.1. Czech dairy farms ....................................................................................................................... 40
4. Denmark ........................................................................................................................................... 44
4.1. Danish dairy farms ...................................................................................................................... 44 4.2. Danish pig farms ......................................................................................................................... 48
5. Estonia .............................................................................................................................................. 55
5.1. Estonian dairy farms ................................................................................................................... 55
6. France ............................................................................................................................................... 59
6.1. French dairy farms ...................................................................................................................... 59 6.2. French crop farms ....................................................................................................................... 63
7. Hungary ............................................................................................................................................ 67
7.1. Hungarian crop farms ................................................................................................................. 67
8. Ireland .............................................................................................................................................. 71
8.1. Irish dairy farms .......................................................................................................................... 71 8.2. Irish crop farms ........................................................................................................................... 75 8.3. Irish cattle rearing farms ............................................................................................................. 79 8.4. Irish cattle other farms ................................................................................................................ 83 8.5. Irish sheep farms ......................................................................................................................... 87
9. Italy ................................................................................................................................................... 91
9.1. Italian crop farms ........................................................................................................................ 91
10. Korea .............................................................................................................................................. 95
10.1. Korean rice farms ...................................................................................................................... 95
11. Norway ........................................................................................................................................... 99
11.1. Norwegian dairy farms ............................................................................................................. 99

4 TAD/CA/APM/WP(2020)2/ANN/FINAL
DRIVERS OF FARM PERFORMANCE Unclassified
11.2. Norwegian crop farms............................................................................................................. 103 11.3. Norwegian cattle farms ........................................................................................................... 107
12. Sweden .......................................................................................................................................... 111
12.1. Swedish dairy farms ................................................................................................................ 111 12.2. Swedish crop farms ................................................................................................................. 115
13. United Kingdom .......................................................................................................................... 119
13.1. UK dairy farms ....................................................................................................................... 119 13.2. UK cereal farms ...................................................................................................................... 123 13.3. UK mixed crop and livestock farms ....................................................................................... 127 13.4. UK pig farms .......................................................................................................................... 131 13.5. UK poultry farms .................................................................................................................... 135
Tables
Table A D.1.1. Australian dairy farms: Descriptive statistics ................................................................. 8 Table A D.1.2. Australian dairy farms: Latent class estimates ............................................................... 9 Table A D.1.3. Australian dairy farms: Full production function estimates ......................................... 10 Table A D.1.4. Australian dairy farms: Elasticities for classes ............................................................. 11 Table A D.1.5. Australian dairy farms: Class identification - mean values indices .............................. 11 Table A D.1.6. Australian crop farms: Descriptive statistics ................................................................ 12 Table A D.1.7. Australian crop farms: Latent class estimates .............................................................. 13 Table A D.1.8. Australian crop farms: Full production function estimates .......................................... 14 Table A D.1.9. Australian crop farms: Elasticities for classes .............................................................. 15 Table A D.1.10. Australian crop farms Class identification - mean values indices .............................. 15 Table A D.1.11. Australian crop and livestock farms: Descriptive statistics ........................................ 16 Table A D.1.12. Australian crop and livestock farms: Latent class estimates ...................................... 17 Table A D.1.13. Australian crop and livestock farms: Full production function estimates .................. 18 Table A D.1.14. Australian crop and livestock farms: Elasticities for classes ...................................... 19 Table A D.1.15. Australian crop and livestock farms: Class identification - mean values indices ....... 19 Table A D.1.16. Australian beef and sheep farms: Descriptive statistics .............................................. 20 Table A D.1.17. Australian beef and sheep farms: Latent class estimates ............................................ 21 Table A D.1.18. Australian beef and sheep farms: Full production function estimates ........................ 22 Table A D.1.19. Australian beef and sheep farms: Elasticities for classes ........................................... 23 Table A D.1.20. Australian beef and sheep farms: Class identification - mean values indices ............ 23 Table A D.1.21. Australian beef farms: Descriptive statistics .............................................................. 24 Table A D.1.22. Australian beef farms: Latent class estimates ............................................................. 25 Table A D.1.23. Australian beef farms: Full production function estimates ......................................... 26 Table A D.1.24. Australian beef farms: Elasticities for classes ............................................................ 27 Table A D.1.25. Australian beef farms: Class identification - mean values indices ............................. 27 Table A D.1.26. Australian sheep farms: Descriptive statistics ............................................................ 28 Table A D.1.27. Australian sheep farms: Latent class estimates........................................................... 29 Table A D.1.28. Australian sheep farms: Full production function estimates ...................................... 30 Table A D.1.29. Australian sheep farms: Elasticities for classes .......................................................... 31 Table A D.1.30. Table A B.1.30. Australian sheep farms: Class identification - mean values indices 31 Table A D.1.31. Australian wool farms: Descriptive statistics ............................................................. 32 Table A D.1.32. Australian wool farms: Latent class estimates ............................................................ 33 Table A D.1.33. Australian wool farms: Full production function estimates ........................................ 34

TAD/CA/APM/WP(2020)2/ANN/FINAL 5
DRIVERS OF FARM PERFORMANCE Unclassified
Table A D.1.34. Australian wool farms: Elasticities for classes ........................................................... 35 Table A D.1.35. Australian wool farms: Class identification - mean values indices ............................ 35 Table A D.2.1. Chilean small-scale fruit farms: Descriptive statistics .................................................. 36 Table A D.2.2. Chilean small-scale fruit farms: Latent Class Estimates .............................................. 37 Table A D.2.3. Chilean small-scale fruit farms: Full Production Function Estimates .......................... 38 Table A D.2.4. Chilean small-scale fruit farms: Elasticities for classes ................................................ 38 Table A D.2.5. Chilean small-scale fruit farms: Class identification - mean values indices ................ 39 Table A D.3.1. Czech dairy farms: Descriptive statistics ...................................................................... 40 Table A D.3.2. Czech dairy farms: Latent class estimates .................................................................... 41 Table A D.3.3. Czech dairy farms: Full production function estimates ................................................ 42 Table A D.3.4. Czech dairy farms: Elasticities for classes .................................................................... 43 Table A D.3.5. Czech dairy farms: Class identification - mean values indices .................................... 43 Table A D.4.1. Danish dairy farms: Descriptive statistics .................................................................... 44 Table A D.4.2. Danish dairy farms: Latent class estimates ................................................................... 45 Table A D.4.3. Danish dairy farms: Full production function estimates ............................................... 46 Table A D.4.4. Danish dairy farms: Elasticities for classes .................................................................. 47 Table A D.4.5. Danish dairy farms: Class identification - mean values indices ................................... 47 Table A D.4.6. Danish pig farms: Descriptive statistics ....................................................................... 48 Table A D.4.7. Danish pig farms, type rearing and fattening: Latent class estimates ........................... 49 Table A D.4.8. Danish pig farms, type specialist fattening: Latent class estimates .............................. 50 Table A D.4.9. Danish pig farms, type rearing and fattening: Full production function estimates ....... 51 Table A D.4.10. Danish pig farms, type specialist fattening: Full production function estimates ........ 52 Table A D.4.11. Danish pig farms, type rearing and fattening: Elasticities for classes ........................ 53 Table A D.4.12. Danish pig farms, type specialist fattening: Elasticities for classes............................ 53 Table A D.4.13. Danish pig farms, type rearing and fattening: Class identification - mean values
indices ............................................................................................................................................ 53 Table A D.4.14. Danish pig farms, type specialist fattening: Class identification - mean values
indices ............................................................................................................................................ 54 Table A D.5.1. Estonian dairy farms: Descriptive statistics .................................................................. 55 Table A D.5.2. Estonian dairy farms: Latent class estimates ................................................................ 56 Table A D.5.3. Estonian dairy farms: Full production function estimates ............................................ 57 Table A D.5.4. Estonian dairy farms: Elasticities for classes ................................................................ 58 Table A D.5.5. Estonian dairy farms: Class identification - mean values indices ................................ 58 Table A D.6.1. French dairy farms: Descriptive statistics ..................................................................... 59 Table A D.6.2. French dairy farms: Latent class estimates ................................................................... 60 Table A D.6.3. French dairy farms: Full production function estimates ............................................... 61 Table A D.6.4. French dairy farms: Elasticities for classes................................................................... 62 Table A D.6.5. French dairy farms: Class identification - mean values indices ................................... 62 Table A D.6.6. French crop farms: Descriptive statistics ...................................................................... 63 Table A D.6.7. French crop farms: Latent class estimates .................................................................... 64 Table A D.6.8. French crop farms: Full production function estimates ................................................ 65 Table A D.6.9. French crop farms: Elasticities for classes .................................................................... 65 Table A D.6.10. French crop farms: Class identification - mean values indices................................... 66 Table A D.7.1. Hungarian crop farms: Descriptive statistics ................................................................ 67 Table A D.7.2. Hungarian crop farms: Latent class estimates .............................................................. 68 Table A D.7.3. Hungarian crop farms: Full production function estimates .......................................... 69 Table A D.7.4. Hungarian crop farms: Elasticities for classes .............................................................. 70 Table A D.7.5. Hungarian crop farms: Class identification - mean values indices ............................... 70 Table A D.8.1. Irish dairy farms: Descriptive statistics ........................................................................ 71 Table A D.8.2. Irish dairy farms: Latent class estimates ....................................................................... 72

6 TAD/CA/APM/WP(2020)2/ANN/FINAL
DRIVERS OF FARM PERFORMANCE Unclassified
Table A D.8.3. Irish dairy farms: Full production function estimates ................................................... 73 Table A D.8.4. Irish dairy farms: Elasticities for classes ...................................................................... 74 Table A D.8.5. Irish dairy farms: Class identification - mean values indices ....................................... 74 Table A D.8.6. Irish crop farms: Descriptive statistics ......................................................................... 75 Table A D.8.7. Irish crop farms: Latent class estimates ........................................................................ 76 Table A D.8.8. Irish crop farms: Full production function estimates .................................................... 77 Table A D.8.9. Irish crop farms: Elasticities for classes ....................................................................... 78 Table A D.8.10. Irish crop farms: Class identification - mean values indices ...................................... 78 Table A.B.8.11. Irish cattle rearing farms: Descriptive statistics .......................................................... 79 Table A D.8.12. Irish cattle rearing farms: Latent class estimates ........................................................ 80 Table A D.8.13. Irish cattle rearing farms: Full production function estimates .................................... 81 Table A D.8.14. Irish cattle rearing farms: Elasticities for classes........................................................ 82 Table A D.8.15. Irish cattle rearing farms: Class identification - mean values indices ........................ 82 Table A.B.8.16. Irish cattle other farms: Descriptive statistics ............................................................. 83 Table A D.8.17. Irish cattle other farms: Latent class estimates ........................................................... 84 Table A D.8.18. Irish cattle other farms: Full production function estimates ....................................... 85 Table A D.8.19. Irish cattle other farms: Elasticities for classes ........................................................... 86 Table A D.8.20. Irish cattle other farms: Class identification - mean values indices............................ 86 Table A.B.8.21. Irish sheep farms: Descriptive statistics ...................................................................... 87 Table A D.8.22. Irish sheep farms: Latent class estimates .................................................................... 88 Table A D.8.23. Irish sheep farms: Full production function estimates ................................................ 89 Table A D.8.24. Irish sheep farms: Elasticities for classes ................................................................... 90 Table A D.8.25. Irish sheep farms: Class identification - mean values indices .................................... 90 Table A D.9.1. Italian crop farms: Descriptive statistics, ...................................................................... 91 Table A D.9.2. Italian crop farms: Latent class estimates ..................................................................... 92 Table A D.9.3. Italian crop farms: Full production function estimates ................................................. 93 Table A D.9.4. Italian crop farms: Elasticities for classes..................................................................... 94 Table A D.9.5. Italian crop farms: Class identification - mean values indices ..................................... 94 Table A D.10.1. Korean rice farms: Descriptive statistics .................................................................... 95 Table A D.10.2. Korean rice farms: Latent class estimates .................................................................. 96 Table A D.10.3. Korean rice farms: Full production function estimates .............................................. 97 Table A D.10.4. Korean rice farms: Elasticities for classes .................................................................. 98 Table A D.10.5. Korean rice farms: Class identification - mean values indices ................................... 98 Table A D.11.1. Norwegian dairy farms: Descriptive statistics ............................................................ 99 Table A D.11.2. Norwegian dairy farms: Latent class estimates ........................................................ 100 Table A D.11.3. Norwegian dairy farms: Full production function estimates .................................... 101 Table A D.11.4. Norwegian dairy farms: Elasticities for classes ........................................................ 102 Table A D.11.5. Norwegian dairy farms: Class identification - mean values indices ......................... 102 Table A D.11.6. 11.2. Norwegian crop farms: Descriptive statistics .................................................. 103 Table A D.11.7. Norwegian crop farms: Latent class estimates ......................................................... 104 Table A D.11.8. Norwegian crop farms: Full production function estimates ..................................... 105 Table A D.11.9. Norwegian crop farms: Elasticities for classes ......................................................... 106 Table A D.11.10. Norwegian crop farms: Class identification - mean values indices ........................ 106 Table A D.11.11. Norwegian cattle farms: Descriptive statistics........................................................ 107 Table A D.11.12. Norwegian cattle farms: Latent class estimates ...................................................... 108 Table A D.11.13. Norwegian cattle farms: Full production function estimates .................................. 109 Table A D.11.14. Norwegian cattle farms: Elasticities for classes ..................................................... 110 Table A D.11.15. Norwegian cattle farms: Class identification - mean values indices ...................... 110 Table A D.12.1. Swedish dairy farms: Descriptive statistics .............................................................. 111 Table A D.12.2. Swedish dairy farms: Latent class estimates ............................................................ 112

TAD/CA/APM/WP(2020)2/ANN/FINAL 7
DRIVERS OF FARM PERFORMANCE Unclassified
Table A D.12.3. Swedish dairy farms: Full production function estimates ........................................ 113 Table A D.12.4. Swedish dairy farms: Elasticities for classes ............................................................ 114 Table A D.12.5. Swedish dairy farms: Class identification - mean values indices ............................. 114 Table A D.12.6. Swedish crop farms: Descriptive statistics ............................................................... 115 Table A D.12.7. Swedish crop farms: Latent class estimates .............................................................. 116 Table A D.12.8. Swedish crop farms: Full production function estimates .......................................... 117 Table A D.12.9. Swedish crop farms: Elasticities for classes ............................................................. 117 Table A D.12.10. Swedish crop farms: Class identification - mean values indices ............................ 118 Table A D.13.1. UK dairy farms: Descriptive statistics ...................................................................... 119 Table A D.13.2. UK dairy farms: Latent class estimates .................................................................... 120 Table A D.13.3. UK dairy farms: Full production function estimates ................................................ 121 Table A D.13.4. UK dairy farms: Elasticities for classes .................................................................... 122 Table A D.13.5. UK dairy farms: Class identification - mean values indices ..................................... 122 Table A D.13.6. UK cereal farms: Descriptive statistics ..................................................................... 123 Table A D.13.7. UK cereal farms: Latent class estimates ................................................................... 124 Table A D.13.8. UK cereal farms: Full production function estimates ............................................... 125 Table A D.13.9. UK cereal farms: Elasticities for classes................................................................... 126 Table A D.13.10. UK cereal farms: Class identification - mean values indices ................................. 126 Table A D.13.11. UK mixed crop and livestock farms: Descriptive statistics .................................... 127 Table A D.13.12. UK mixed crop and livestock farms: Latent class estimates .................................. 128 Table A D.13.13. UK mixed crop and livestock farms: Full production function estimates .............. 129 Table A D.13.14. UK mixed crop and livestock farms: Elasticities for classes .................................. 129 Table A D.13.15. UK mixed crop and livestock farms: Class identification - mean values indices ... 130 Table A D.13.16. UK pig farms: Descriptive statistics ....................................................................... 131 Table A D.13.17. UK pig farms: Latent class estimates ..................................................................... 132 Table A D.13.18. UK pig farms: Full production function estimates ................................................. 133 Table A D.13.19. UK pig farms: Elasticities for classes ..................................................................... 134 Table A D.13.20. UK pig farms: Class identification - mean values indices ...................................... 134 Table A D.13.21. UK poultry farms: Descriptive statistics ................................................................. 135 Table A D.13.22. UK poultry farms: Latent class estimates ............................................................... 136 Table A D.13.23. UK poultry farms: Full production function estimates ........................................... 137 Table A D.13.24. UK poultry farms: Elasticities for classes .............................................................. 138 Table A D.13.25. UK poultry farms: Class identification - mean values indices ............................... 138

8 TAD/CA/APM/WP(2020)2/ANN/FINAL
DRIVERS OF FARM PERFORMANCE Unclassified
Annex D. Background Tables
1. Australia
1.1. Australian dairy farms
Table A D.1.1. Australian dairy farms: Descriptive statistics
Sample 1989 to 2018
Note: LU per ha: Livestock Unit per hectare. 1. Values are per year
Full sample (n = 9161)
1st year (1989, n = 293)
Final year (2018, n = 297)
Statistical measure Mean [Min; Max]
Mean [Min; Max]
Mean [Min; Max]
Variable1
Milk output (AUD) 705 192 [0; 23 718 105]
162 865 [15 154; 5 049 933]
1 502 177 [97 820; 11 670 141]
Total output (AUD) 760 994 [0; 24 397 320]
204 797 [29 864; 8 858 570]
1 587 025 [97 820; 11 910 678]
Dairy cows (number) 471 [0; 10 270]
228 [29; 5 338]
744 [48; 6 696]
Capital depreciation (AUD) 46 662 [0; 870 126]
16 182 [0; 274 308]
93607 [0; 632 526.9]
Fodder cost (AUD) 191 014 [0; 6 756 689]
22 316 [0; 1 256 192]
412 017 [0; 1 115 293]
Materials (AUD) 4 116 [0; 871 835]
1 605 [0; 37 571]
9 800 [0; 195 426]
Hired labour (hour) 6 373 [0; 4 084 846]
1 128 [0; 49.88]
55 442 [0; ]
Family labour (hour) 105 039 [0; 4 492 996]
37 195 [1 664; 988 407]
176 395 [0; ]
Land (ha) 384 [0; 18 194.6]
291 [0; 18 194.6]
472 [71; 4 108]
Stocking density (LU per ha) 1.51 [0; 13.45]
1.22 [0; 6.09]
1.80 [0.13; 7.32]
Chemicals cost (AUD) 48 079 [0; 1 888 131]
8 509 [0; 152 867]
92 540 [0; 1 115 293]
Organic (0-1 probability) 0 [0; 0]
0 [0; 0]
0 [0; 0]
Total assets (AUD) 4 034 172 [0; 0.129583D+09]
1 414 148 [182 878; 54 288 634]
8 440 075 [1 385 600; 61 426 847]
Age (years) 53.4 [18; 99]
48.4 [18; 81]
58.2 [18; 93]

TAD/CA/APM/WP(2020)2/ANN/FINAL 9
DRIVERS OF FARM PERFORMANCE Unclassified
Table A D.1.2. Australian dairy farms: Latent class estimates
LCM panel translog reduced model, 1989 to 2018
Total output Class 1 Class 2 Class 3
Constant 8.75318*** 8.48228*** 8.30690***
Land 0.21115*** -0.12413* -0.03402**
Dairy cows -0.22601*** 0.34888*** 0.93964***
Capital -0.15855*** 0.12750 -0.13550***
Chemicals -0.06397*** -0.19347*** -0.03751***
Labour 0.03902 0.07812 -0.23464***
Land*Land -0.01702*** 0.02643*** 0.00672***
Dairy cows*Dairy cows 0.04453*** 0.02353*** -0.02115***
Capital*Capital 0.01164*** -0.00455 0.01335***
Chemicals*Chemicals 0.00681*** 0.01979*** 0.00748***
Labour*Labour 0.02513*** -0.00569 0.01506***
Time 0.21385*** -0.14848** -0.03029***
Time*Time -0.00012 -0.00111** -0.00020**
Time*Land -0.00281 0.00439 -0.00338***
Time*Dairy cows 0.01664*** -0.03380*** 0.00225
Time*Capital 0.00130 0.02733*** 0.00408***
Time*Chemicals -0.00080 0.00491*** -0.00133***
Time*Labour -0.02422*** 0.00296 0.00256***
Sigma 0.29279*** 0.40796*** 0.23729***
Class Membership Vector
Constant -0.66544*** -1.31929*** ---
Index 1 - Structure 0.20388** 0.26845** ---
Index 2 - Environmental sustainability -0.31042*** 0.21152* ---
Index 3 - Innovation-cooperation-commercialisation 0.11105 -0.07195 ---
Index 4 - Technology -0.00649 -0.15537 ---
Index 5 - Diversity 0.02651 0.10634* ---
Index 6 - Individual 0.16370** 0.21285** ---
Index 7 - Location 0.00577 0.06771 ---
Index 8 - Household 0.03306 0.04202 ---
Index 9 - Financial 0.71229*** 0.24568 ---
Log-Likelihood Function -1740.11759
Inf.Cr.AIC / AIC/N 3634.2 / 0.397
Note: *significant at 10%, **significant at 5%, ***significant at 1%.
Source: Estimations.

10 TAD/CA/APM/WP(2020)2/ANN/FINAL
DRIVERS OF FARM PERFORMANCE Unclassified
Table A D.1.3. Australian dairy farms: Full production function estimates
Fixed-effects panel translog model per class, 1989 to 2018
Total output Class 1 Class 2 Class 3
Land 0.08707 -0.47269 0.00750
Dairy cows -0.46482** 0.39691 0.05756
Capital 0.27073** 0.33716 -0.05155
Chemicals 0.01900 -0.41114*** -0.01558
Labour 0.06160 -3.99269** -0.05411
Land*Land 0.00706** 0.03378*** 0.00658***
Dairy cows*Dairy cows 0.05935*** 0.07003*** 0.06945***
Capital*Capital 0.00344* 0.00442 0.00674***
Chemicals*Chemicals 0.00554*** 0.01147*** 0.00551***
Labour*Labour 0.01951*** 0.22107** 0.00716
Land*Dairy cows 0.00274 -0.01474 -0.01217
Land*Capital -0.01160 0.04814* 0.00149
Land*Chemicals 0.00143 0.00762 -0.13958D-04
Land*Labour -0.00038 -0.01420 0.00237
Dairy cows*Capital 0.00994 0.02232 -0.00842
Dairy cows*Chemicals 0.00026 -0.03854*** -0.00021
Dairy cows*Labour -0.00209 -0.06913 -0.01378
Capital*Chemicals -0.00938*** 0.00306 -0.00070
Capital*Labour -0.02026 -0.06556 0.00282
Chemicals*Labour 0.00041 0.03966** -0.00128
Time 0.07199*** -0.14002 -0.03463**
Time*Time -0.00104*** -0.00144*** -0.00039***
Time*Land -0.93002D-04 -0.00823* 0.00024
Time*Dairy cows -0.00425* 0.00724 0.00382**
Time*Capital 0.00606*** 0.00694 0.00164**
Time*Chemicals 0.00063** 0.00032 -0.00090***
Time*Labour -0.00537*** 0.01116 0.00316**
Number of observations / average group size 1 800 / 2.96 426 / 1.90 6 935 / 2.94
R-squared / R-bar squared 0.9793 / 0.9685 0.9832 / 0.9621 0.9829 / 0.9736
Rho squared (residual variation) 0.8572 0.9764 0.8532
R-squared (within groups var) 0.6563 0.5087 0.6196
Hausman Test 368.71*** 159.89*** 522.48***
Note: *significant at 10%, **significant at 5%, ***significant at 1%.
Source: Estimations.

TAD/CA/APM/WP(2020)2/ANN/FINAL 11
DRIVERS OF FARM PERFORMANCE Unclassified
Table A D.1.4. Australian dairy farms: Elasticities for classes
LCM panel translog reduced model, 1989 to 2018
Wald procedure based on delta method at sample means
Total output Class 1 Class 2 Class 3
Land 0.02681 0.19783*** 0.00881
Dairy cows 0.20584*** 0.31215*** 0.71633***
Capital 0.06643* 0.27080*** 0.17268***
Chemicals 0.06142*** 0.18858*** 0.09126***
Labour 0.67900*** -0.02149 0.12307***
Returns-to-scale 1.03950*** 0.94787*** 1.11216***
Note: *significant at 10%, **significant at 5%, ***significant at 1%.
Source: Estimations.
Table A D.1.5. Australian dairy farms: Class identification - mean values indices
Mean values1, 1989 to 2018
Class 1: Most productive (19.6%)
Class 2: Least productive (4.7%)
Class 3: Medium productive (75.7%)
Index 1 - Structure -0.5245 0.5891 0.1000
Index 2 – Environmental sustainability -0.8024 0.4844 0.1785
Index 3 – Innovation-cooperation-commercialisation 0.5217 -0.3108 -0.1163
Index 4 - Technology -0.1307 -0.0925 0.0396
Index 5 - Diversity -0.0264 0.4995 -0.0238
Index 6 - Individual 0.4667 0.0567 -0.1246
Index 7 - Location -0.1099 0.2352 0.0141
Index 8 - Household 0.2501 0.0144 -0.0658
Index 9 - Financial 0.1063 -0.0276 -0.0259
Note: 1. At class means, scaled values.
Source: Estimations.

12 TAD/CA/APM/WP(2020)2/ANN/FINAL
DRIVERS OF FARM PERFORMANCE Unclassified
1.2. Australian crop farms
Table A D.1.6. Australian crop farms: Descriptive statistics
Sample 1989 to 2018
Note: 1. Values are per year.
Full sample (n = 8921)
1st year (1989, n = 117)
Final year (2018, n = 346)
Statistical measure Mean [Min; Max]
Mean [Min; Max]
Mean [Min; Max]
Variable1
Crop output (AUD) 994 676 [0; 19 513 669]
253 659 [0; 1 740 849]
1 763 441 [0; 16 287 981]
Total output (AUD) 780 183 [50; 21 814 625]
337 703 [10 734; 2 271 732]
2 076 965 [34 580; 17 040 303]
Land (ha) 3 365 [0; 308 048]
1 606 [45; 11 873]
4 056 [81.6; 32 260]
Capital depreciation (AUD) 91 681 [0; 2 241 422]
34 169 [0; 260 522]
183 389 [4 795; 2 241 422]
Chemicals cost (AUD) 207 077 [0; 4 357 020]
27 009 [0; 329 648]
451 808 [0; 4 357 020]
Hired labour (hour) 7 937 [43; 193 892]
3 017 [43; 10 297]
14 252 [2 061; 193 893]
Family labour (hour) 91 106 [798; 41 710 095]
56 409 [798; 3 723 375]
8 1781 [11 826; 41 710 095]
Materials (AUD) 75 838 [0; 3 318 176]
24 693 [0; 211 152]
157 887 [635; 1 830 766]
Organic (0-1 probability) 0 [0; 1]
0 [0; 0]
0.00578 [0; 1]
Total assets (AUD) 5 430 817 [79 068; .124D+09]
1 245 898 [143 077; 9 678 509]
13 031 211 [704 200; 0.106D+09]
Age (years) 52.7 [18; 96]
50.8 [28; 84]
56.9 [18; 86]

TAD/CA/APM/WP(2020)2/ANN/FINAL 13
DRIVERS OF FARM PERFORMANCE Unclassified
Table A D.1.7. Australian crop farms: Latent class estimates
LCM panel translog reduced model, 1989 to 2018
Total output Class 1 Class 2
Constant 10.1654*** 5.70352***
Land 0.47789*** 0.47556***
Capital -0.10451*** -0.14441***
Chemicals -0.29330*** -0.04558*
Labour -0.28353*** -0.35911*
Seed -0.02022*** -0.01994
Materials -0.06356*** 0.45673**
Land*Land -0.02680*** -0.00992**
Capital*Capital 0.00905*** 0.00809*
Chemicals*Chemicals 0.02779*** 0.00597***
Labour*Labour 0.01804*** 0.02207**
Seed*Seed 0.00386*** 0.00602**
Materials*Materials 0.01807*** 0.00438
Time 0.03345*** -0.06257*
Time*Time 0.00057*** 0.00139***
Time*Land 0.00061 -0.01102***
Time*Capital 0.00044 0.00786**
Time*Chemicals -0.00133*** 0.00053
Time*Labour -0.00308*** -0.00316
Time*Seed -0.00046 0.00436
Time*Materials -0.00043*** -0.00156**
Sigma 0.30431*** 0.61546***
Class Membership Vector
Constant 2.13015*** ---
Index 1 - Structure 0.06753 ---
Index 2 - Environmental sustainability -0.87976*** ---
Index 3 - Innovation-cooperation-commercialisation 0.65398*** ---
Index 4 - Technology -0.29405*** ---
Index 5 - Diversity -0.70452*** ---
Index 6 - Individual 0.05796 ---
Index 7 - Location -0.08244* ---
Index 8 - Household 0.05357 ---
Index 9 - Financial 0.02517 ---
Log-Likelihood Function -3 908.65280
Inf.Cr.AIC / AIC/N 7 925.3 / 0.888
Note: *significant at 10%, **significant at 5%, ***significant at 1%.
Source: Estimations.

14 TAD/CA/APM/WP(2020)2/ANN/FINAL
DRIVERS OF FARM PERFORMANCE Unclassified
Table A D.1.8. Australian crop farms: Full production function estimates
Fixed-effects panel translog model per class, 1989 to 2018
Total output Class 1 Class 2
Land 0.11903 0.57898
Capital -0.03178 -0.57473
Chemicals -0.08323 -0.35261
Labour -0.17083 -2.84180***
Seed 0.01647 -0.04637
Materials -0.42543* -0.51106
Land*Land -0.02823*** -0.00798
Capital*Capital 0.00326*** 0.01365
Chemicals*Chemicals 0.00481*** -0.01430*
Labour*Labour 0.01500*** 0.13123**
Seed*Seed 0.00045 -0.00251
Materials*Materials 0.03196* 0.21207**
Land*Capital 0.00210 0.04497
Land*Chemicals -0.01341*** 0.02759**
Land*Labour 0.01108 -0.13883
Land*Seed -0.00395** -0.02747**
Land*Materials 0.02419 0.00838
Capital*Chemicals -0.00164 0.35873D-04
Capital*Labour 0.00036 0.22529
Capital*Seed 0.00077 0.02306*
Capital*Materials -0.00135 -0.21455*
Chemicals*Labour -0.01971*** 0.05040**
Chemicals*Seed -0.00032 0.00053
Chemicals*Materials 0.02658*** -0.01715
Labour*Seed -0.00108 -0.00034
Labour*Materials -0.00040 -0.12855
Seed*Materials 0.00126 0.00385
Time 0.04667** -0.06208
Time*Time 0.00038*** 0.00016
Time*Land 0.00420** 0.01271
Time*Capital 0.00078 0.00681
Time*Chemicals 0.00055 -0.00125
Time*Labour 0.00487** 0.01600
Time*Seed 0.91431D-04 -0.00197
Time*Materials -0.01192*** -0.02140
Number of observations / average group size 7814 / 2.71 1107 / 1.38
R-squared / R-bar squared 0.9658 / 0.9554 0.9569 / 0.8228
Rho squared (residual variation) 0.5279 0.7592
R-squared (within groups var) 0.4927 0.2691
Hausman Test 113.64*** 66.9***
Note: *significant at 10%, **significant at 5%, ***significant at 1%.
Source: Estimations.

TAD/CA/APM/WP(2020)2/ANN/FINAL 15
DRIVERS OF FARM PERFORMANCE Unclassified
Table A D.1.9. Australian crop farms: Elasticities for classes
LCM panel translog reduced model, 1989 to 2018
Wald procedure based on delta method at sample means
Total output Class 1 Class 2
Land 0.08455*** 0.17274***
Capital 0.09877*** 0.13761***
Chemicals 0.32427*** 0.07372***
Labour 0.11449*** 0.18212***
Seed 0.02568*** 0.01775***
Materials 0.30430*** 0.50638***
Returns-to-scale 0.95205*** 1.09032***
Note: *significant at 10%, **significant at 5%, ***significant at 1%.
Source: Estimations.
Table A D.1.10. Australian crop farms Class identification - mean values indices
Mean values1, 1989 to 2018
Class 1: Most productive (87.6%)
Class 2: Least productive (12.4%)
Index 1 – Structure -0.1625 1.1468
Index 2 - Environmental sustainability -0.0660 0.4660
Index 3 – Innovation-cooperation-commercialisation 0.0797 -0.5628
Index 4 - Technology 0.1022 -0.7212
Index 5 - Diversity -0.2664 1.8805
Index 6 - Individual 0.0363 -0.2560
Index 7 - Location -0.0532 0.3753
Index 8 - Household 0.0382 -0.2696
Index 9 - Financial 0.2201 -1.5538
Note: 1. At class means, scaled values.
Source: Estimations.

16 TAD/CA/APM/WP(2020)2/ANN/FINAL
DRIVERS OF FARM PERFORMANCE Unclassified
1.3. Australian crop and livestock farms
Table A D.1.11. Australian crop and livestock farms: Descriptive statistics
Sample 1989 to 2018
Note: LU per ha: Livestock Unit per hectare. 1. Values are per year.
Full sample (n = 9715)
1st year (1989, n = 303)
Final year (2018, n = 335)
Statistical measure Mean [Min; Max]
Mean [Min; Max]
Mean [Min; Max]
Variable1
Crop output (AUD) 295 812 [0; 7 161 487]
161 529 [0; 2 400 325]
637 442 [0; 6 903 153]
Livestock output (AUD) 188 321 [0; 14 877 500]
58 327 [0; 2 270 795]
440 758 [0; 7 320 071]
Total output (AUD) 626 233 [0; 20 945 442]
340 633 [0; 11 102 106]
1 408 587 [25 520; 14 542 846]
Land (ha) 3 795 [2; 774 725]
2 848 [161.9; 115 233]
7 177 [138.1; 774 725]
Livestock Units (number) 6 817 [3.6; 1 391 707]
4 951 [0; 913 084.4]
11 842 [4.947; 7 705 246.7]
Capital depreciation (AUD) 55 611 [0; 1 023 988]
36 512 [0; 890 143]
107 163 [7 324; 1 019 751.9]
Hired labour (hour) 6 599 [86; 181 943]
420 [67.9; 2 032 079]
30 447 [3 348.9; 297 099.4]
Family labour (hour) 87 846 [0; 2 603 870]
53 019 [0; 2 048 111]
155 579 [17 113; 1 800 110.6]
Materials (AUID) 332 399 [2 401; 18 150 569]
166 374 [7481; 6 386 823]
723 538 [0; 9 324 447]
Stocking density (LU per ha) 1.80 [0; 219]
1.74 [0; 7.92]
1.65 [0; 9.95]
Organic (0-1 probability) 0.000721 [0; 1]
0 [0; 0]
0.008955 [0; 1]
Total assets (AUD) 4 405 164 [35 554; .115D+09]
1 605 898 [164 824; 51 995 485]
1 056 0001 [782 256; 64 771 908]
Age (years) 53.5 [18; 92]
50.4 [23; 81]
57.8 [18; 89]

TAD/CA/APM/WP(2020)2/ANN/FINAL 17
DRIVERS OF FARM PERFORMANCE Unclassified
Table A D.1.12. Australian crop and livestock farms: Latent class estimates
LCM panel translog reduced model, 1989 to 2018
Total output Class 1 Class 2 Class 3
Constant 0.53247 2.23096 1.05320
Land 0.31829*** 0.82674*** 0.59032***
Capital -0.08570*** -0.02705 -0.25014**
Labour -0.08046* -0.53297 0.66513
Livestock -0.07667*** -0.15645*** -0.21077***
Materials 1.04206*** 0.93460** 0.17467
Land*Land -0.01903*** -0.04371*** -0.04596***
Capital*Capital 0.00749*** 0.00535 0.01488*
Labour*Labour 0.00505** 0.04096 -0.01959
Livestock*Livestock 0.00686*** 0.00629** 0.01205***
Materials*Materials -0.00950*** -0.02117 0.03054*
Time -0.00601 -0.10735 0.03208
Time*Time 0.00039*** -0.00039 0.00094*
Time*Land -0.00011 0.00505 -0.00466
Time*Capital 0.00189*** -0.00877 0.00948*
Time*Labour 0.00415*** -0.00299 -0.00619
Time*Livestock -0.00068*** 0.62802D-04 0.00630***
Time*Materials -0.00489*** 0.01731** -0.01166*
Sigma 0.26813*** 0.60077*** 0.54264***
Class Membership Vector
Constant 3.11557*** 0.53468 ---
Index 1 - Structure 1.86829*** 1.29534*** ---
Index 2 - Environmental sustainability -1.90611*** -0.32702 ---
Index 3 - Innovation-cooperation-commercialisation -0.89360 11.1559*** ---
Index 4 - Technology -1.56910*** -0.40484 ---
Index 5 - Diversity -0.92936*** -0.31450*** ---
Index 6 - Individual -0.21278* 0.41090** ---
Index 7 - Location 0.23375*** 0.29159** ---
Index 8 - Household 0.03013 -0.23823** ---
Index 9 - Financial 0.27045 0.49549* ---
Log-Likelihood Function -3070.91441
Inf.Cr.AIC / AIC/N 6295.8 / 0.648
Note: *significant at 10%, **significant at 5%, ***significant at 1%.
Source: Estimations.

18 TAD/CA/APM/WP(2020)2/ANN/FINAL
DRIVERS OF FARM PERFORMANCE Unclassified
Table A D.1.13. Australian crop and livestock farms: Full production function estimates
Fixed-effects panel translog model per class, 1989 to 2018
Total output Class 1 Class 2 Class 3
Land 0.10412 -2.90352*** 3.30397*
Capital -0.01612 0.39113 -1.42855
Labour -0.25398 0.14477 -1.75871
Livestock 0.00084 0.16391 -0.19490
Materials 1.30147*** 2.47218** 1.75715
Land*Land -0.02245*** 0.10754** 0.01854
Capital*Capital 0.00449*** 0.02587 0.02581
Labour*Labour 0.00455 -0.03388 0.04118
Livestock*Livestock 0.00199*** 0.00199 0.00655**
Materials*Materials -0.02748** -0.06346 -0.06465
Land*Capital 0.00369 0.06187 -0.03311
Land*Labour 0.01839 0.09342 -0.11551
Land*Livestock -0.00139 0.00848 0.01491*
Land*Materials 0.00524 -0.04201 -0.22689**
Capital*Labour 0.00073 -0.05695 0.03425
Capital*Livestock 0.21727D-04 -0.01409 -0.01507
Capital*Materials -0.00578 -0.03953 0.08828
Labour’Livestock -0.00256 -0.04234*** 0.01739
Labour*Materials 0.00966 0.05878 0.13993
Livestock*Materials 0.00138 0.02887** -0.00031
Time 0.00386 -0.07078 0.16344
Time*Time 0.00036*** 0.00103 0.00030
Time*Land 0.00090 0.00889 0.05218***
Time*Capital 0.00024 0.00179 0.00256
Time*Labour 0.00069 0.01432 -0.02329
Time*Livestock 0.00032** 0.00197 0.00039
Time*Materials -0.00205 -0.01899* -0.02757*
Number of observations / average group size 7480 / 2.42 1176 / 1.40 1043 / 1.31
R-squared / R-bar squared 0.9829 / 0.9708 0.9871 / 0.9511 0.9764 / 0.8889
Rho squared (residual variation) 0.7048 0.8102 0.7754
R-squared (within groups var) 0.6016 0.4714 0.3463
Hausman Test 140.10*** 87.93*** 83.02***
Note: *significant at 10%, **significant at 5%, ***significant at 1%.
Source: Estimations.

TAD/CA/APM/WP(2020)2/ANN/FINAL 19
DRIVERS OF FARM PERFORMANCE Unclassified
Table A D.1.14. Australian crop and livestock farms: Elasticities for classes
LCM panel translog reduced model, 1989 to 2018
Wald procedure based on delta method at sample means
Total output Class 1 Class 2 Class 3
Land 0.03176*** 0.26968*** -0.08589***
Capital 0.09201*** -0.02197 0.18002***
Labour 0.08055*** 0.33499*** 0.15484**
Livestock 0.07566*** -0.02225 0.14558***
Materials 0.75303*** 0.63071*** 0.70630***
Returns-to-scale 1.03301*** 1.19116*** 1.10086***
Note: *significant at 10%, **significant at 5%, ***significant at 1%.
Source: Estimations.
Table A D.1.15. Australian crop and livestock farms: Class identification - mean values
indices
Mean values1, 1989 to 2018
Class 1: Most productive (86.3% of farms)
Class 2: Medium productive (5.3% of
farms)
Class 3: Least productive (8.4% of
farms)
Index 1 - Structure 0.2963 0.2273 -3.2005
Index 2 - Environmental sustainability -0.2278 0.2476 2.1910
Index 3 - Innovation-cooperation-commercialisation -0.0496 0.8926 -0.0572
Index 4 - Technology -0.3938 1.2839 3.2429
Index 5 - Diversity -0.1901 0.4839 1.6521
Index 6 - Individual -0.3495 1.7108 2.5140
Index 7 - Location -0.1555 3.6421 -0.7166
Index 8 - Household 0.0174 -4.3174 2.5715
Index 9 - Financial 0.1745 1.8189 -2.9584
Note: 1. At class means, scaled values.
Source: Estimations.

20 TAD/CA/APM/WP(2020)2/ANN/FINAL
DRIVERS OF FARM PERFORMANCE Unclassified
1.4. Australian beef and sheep farms
Table A D.1.16. Australian beef and sheep farms: Descriptive statistics
Sample 1989 to 2018
Note: LU per ha: Livestock Unit per hectare. 1. Values are per year.
Full sample (n = 5192)
1st year (1989, n = 136)
Final year (2018, n = 154)
Statistical measure Mean [Min; Max]
Mean [Min; Max]
Mean [Min; Max]
Variable1
Livestock output (AUD) 310 476
[176; 6 106 171] 147 230 [3 852; 1 554 391]
843 105 [20 546; 61 06171]
Total output (AUD) 498 274 [6258; 7 644 909]
316 241 [32 533; 4 935 833]
1 230 303 [40 263; 7 302 086]
Land (ha) 14 852 [40; 993 271]
7 011 [40; 256 544.7]
5 687 [89; 80 938.9]
Livestock Units (number) 35 921 [96.74; 2 402 388]
21 047 [2.88; 770 106]
13 651 [267.2; 242 965.6]
Capital depreciation (AUD) 32 356 [0; 481 638]
21 537 [0; 352 554]
60 049 [7 165; 224 783.1]
Hired labour (hour) 9 813 [494; 133 294]
5 926 [494.1; 82 477.4]
28 821 [3 066.8; 129 779.7]
Family labour (hour) 91 387 [1 756; 1 373 716]
51 102 [4 260.9; 788 931.4]
154 685 [26 445.2; 1 119 090.3]
Materials (AUD) 226 734 [8 845; 4 755 199]
112 940 [10 029; 1 330 683]
511 146 [32 105; 3 480 811]
Stocking density (LU per ha) 2.42 [0; 13.2]
3.00 [0.07; 10.67]
2.40 [0.01; 7.85]
Organic (0-1 probability) 0.000578 [0; 1]
0 [0; 0]
0.019481 [0; 1]
Total assets (AUD) 4 654 805 [117 084; 82 377 118]
2 090 796 [209 565; 9 857 524]
11 432 318 [833 128; 78 522 104]
Age (years) 54.9 [18; 94]
52.7 [28; 82]
58.6 [19; 91]

TAD/CA/APM/WP(2020)2/ANN/FINAL 21
DRIVERS OF FARM PERFORMANCE Unclassified
Table A D.1.17. Australian beef and sheep farms: Latent class estimates
LCM panel translog reduced model, 1989 to 2018
Total output Class 1 Class 2 Class 3
Constant 22.7340** -6.41916 4.10353**
Land 0.59857* 0.50585*** 0.12811**
Capital -0.57634** -0.49119*** -0.09834***
Labour -2.00237 2.35755*** 1.27950***
Livestock -0.88592* -0.07803 -0.90252***
Fodder -0.13904** 0.00955 -0.02758***
Land*Land -0.04234** -0.05323*** -0.01167***
Capital*Capital 0.05379*** 0.04711*** 0.01157***
Labour*Labour 0.10617 -0.11262*** -0.04928***
Livestock*Livestock 0.04614* 0.03948*** 0.06591***
Fodder*Fodder 0.01438** 0.00274 0.00465***
Time 0.25916 0.03278 0.01274
Time*Time 0.00156 -0.00051 0.00152***
Time*Land -0.01132** 0.01546*** 0.00143
Time*Capital -0.00465 -0.00726 0.00194
Time*Labour -0.00244 0.02201** -0.00272
Time*Livestock -0.01180 -0.02215*** -0.00388***
Time*Fodder 0.00196 -0.00155* -0.00066*
Sigma 1.18339*** 0.44715*** 0.49684***
Class Membership Vector
Constant -2.37530*** -1.43396*** ---
Index 1 - Structure 0.71542*** 0.35632*** ---
Index 2 - Environmental sustainability 1.64801*** -0.79895*** ---
Index 3 - Innovation-cooperation-commercialisation 2.73258*** 0.23339 ---
Index 4 - Technology -0.68873*** 0.41423** ---
Index 5 - Diversity 0.07897 0.47170*** ---
Index 6 - Individual -0.04904 0.40129*** ---
Index 7 - Location 0.00925 -0.27949*** ---
Index 8 - Household -0.05370 0.18510** ---
Index 9 - Financial 0.12335** -0.00684 ---
Log-Likelihood Function -4978.49780
Inf.Cr.AIC / AIC/N 10111.0 / 1.947
Note: *significant at 10%, **significant at 5%, ***significant at 1%.
Source: Estimations.

22 TAD/CA/APM/WP(2020)2/ANN/FINAL
DRIVERS OF FARM PERFORMANCE Unclassified
Table A D.1.18. Australian beef and sheep farms: Full production function estimates
Fixed-effects panel translog model per class, 1989 to 2018
Total output Class 1 Class 2 Class 3
Land -1.94064 0.09639 0.03031
Capital -0.50492 0.82547 0.18926
Labour 9.43694*** 0.19931 -0.69622
Livestock -0.80834 -0.26821 -0.05572
Fodder 0.31112 0.11735 0.04295
Land*Land -0.00789 0.00099 -0.03120***
Capital*Capital 0.00573 0.01727** 0.00574**
Labour*Labour -0.66615*** 0.00938 0.06093*
Livestock*Livestock 0.03966 0.06477* 0.02490***
Fodder*Fodder 0.01218** 0.00161 0.00169**
Land*Capital 0.09312 0.04373 0.00328
Land*Labour 0.12669 0.04170 0.03956**
Land*Livestock 0.02480 -0.09062 0.00585
Land*Fodder -0.01144 0.00741 0.00147
Capital*Labour 0.18255 -0.08522 -0.02915
Capital*Livestock -0.22678* -0.03679 0.00489
Capital*Fodder 0.00760 0.00438 -0.00227
Labour*Livestock 0.17868 0.01228 -0.03451
Labour*Fodder -0.03299 -0.00686 -0.00378
Livestock*Fodder -0.00099 -0.01079* -0.00011
Time -0.78295** 0.04928 0.00442
Time*Time 0.00047 0.00081 0.00119***
Time*Land -0.02883** 0.00911 -0.00197
Time*Capital 0.05455*** 0.00233 0.00322*
Time*Labour 0.03939 0.01060 -0.00180
Time*Livestock 0.00266 -0.01888** -0.00151
Time*Fodder 0.47661D-04 -0.00059 -0.12323D-04
Number of observations / average group size 440 / 1.43 900 / 2.05 1530 / 2.52
R-squared / R-bar squared 0.9623 / 0.8422 0.9847 / 0.9683 0.9585 / 0.9303
Rho squared (residual variation) 0.8879 0.9652 0.7943
R-squared (within groups var) 0.3358 0.3553 0.2447
Hausman Test 60.35*** 98.17*** 258.20***
Note: *significant at 10%, **significant at 5%, ***significant at 1%.
Source: Estimations.

TAD/CA/APM/WP(2020)2/ANN/FINAL 23
DRIVERS OF FARM PERFORMANCE Unclassified
Table A D.1.19. Australian beef and sheep farms: Elasticities for classes
LCM panel translog reduced model, 1989 to 2018
Wald procedure based on delta method at sample means
Total output Class 1 Class 2 Class 3
Land -0.16447*** 0.01699 -0.04422***
Capital 0.42520*** 0.35182*** 0.15043***
Labour 0.27290** 0.13968** 0.14927***
Livestock 0.09844 0.58019*** 0.72647***
Fodder 0.05827** 0.02459** 0.02868***
Returns-to-scale 0.69034*** 1.11328*** 1.01063***
Note: *significant at 10%, **significant at 5%, ***significant at 1%.
Source: Estimations.
Table A D.1.20. Australian beef and sheep farms: Class identification - mean values indices
Mean values1, 1989 to 2018
Class 1: Least productive (8.5%)
Class 2: Most productive (17.3%)
Class 3: Medium productive (74.2%)
Index 1 - Structure 0.3133 0.2333 -0.0903
Index 2 - Environmental sustainability 0.4156 -1.1065 0.2111
Index 3 – Innovation-cooperation-commercialisation 0.8566 0.0572 -0.1112
Index 4 - Technology -0.1165 0.5623 -0.1181
Index 5 - Diversity 0.0203 0.5716 -0.1359
Index 6 - Individual -0.1530 0.6820 -0.1419
Index 7 - Location 0.2986 -0.8074 0.1545
Index 8 - Household -0.1328 0.6180 -0.1292
Index 9 - Financial 0.3054 -0.0812 -0.0159
Note: 1. At class means, scaled values.
Source: Estimations.

24 TAD/CA/APM/WP(2020)2/ANN/FINAL
DRIVERS OF FARM PERFORMANCE Unclassified
1.5. Australian beef farms
Table A D.1.21. Australian beef farms: Descriptive statistics
Sample 1989 to 2018
Note: LU per ha: Livestock Unit per hectare. 1. Values are per year.
Full sample (n = 12 685)
1st year (1989, n = 257)
Final year (2018, n = 515)
Statistical measure Mean [Min; Max]
Mean [Min; Max]
Mean [Min; Max]
Variable1
Livestock output (AUD) 921 404 [380; 98 000 000]
544 996 [5 971; 51 663 950]
1 736 698 [1 155; 83 453 420]
Total output (AUD) 1 207 728 [652; 0.174D+09]
595 387 [10 984; 52 524 078]
2 308 457 [3 655; 90 111 094]
Land (ha) 108 515 [0; 3 256 600]
100 242 [41; 2 699 504]
122 761 [0; 2 689 600]
Livestock Units (number) 70 896 [0; 1 946 515]
61 420 [653; 490 831]
73 376 [0; 1 607 611.6]
Capital depreciation (AUD) 53 341 [0; 1 755 133]
36 690 [0; 821 181]
85 027 [1 719.8; 1 755 132.9]
Hired labour (hour) 6 432 [0; 521 570]
3 360 [55; 41 918]
39 426 [1 780.5; 521 569.6]
Family labour (hour) 121 136 [139 402; 2 243 170]
57 291 [1 038; 789 445]
169 562 [7 657.5; 2 243 170.4]
Materials (AUD) 448 474 [2 068; 45 761 413]
212 377 [7 678; 15 333 160]
794 852 [7 342; 28 812 677]
Stocking density (LU per ha) 0.65 [0; 97.76]
0.61 [0.004; 16]
0.60 [0; 31.35]
Organic (0-1 probability) 0.002917 [0; 1]
0 [0; 0]
0.036893 [0; 1]
Total assets (AUD) 8 842 919 [91 533; .248D+09]
2 583 581 [211 093; 18 472 215]
17 307 435 [113 350; .222D+09]
Age (years) 54.8 [18; 97]
52.4 [29; 86]
57.4 [18; 93]

TAD/CA/APM/WP(2020)2/ANN/FINAL 25
DRIVERS OF FARM PERFORMANCE Unclassified
Table A D.1.22. Australian beef farms: Latent class estimates
LCM panel translog reduced model, 1989 to 2018
Total output Class 1 Class 2 Class 3
constant 7.74747*** 11.0951*** 8.31768***
Land 0.37909*** 0.55919*** 0.40889***
Capital 0.59878*** -0.10446* -0.02849
Labour -0.17231*** -0.62888*** 0.23708
Livestock -0.80210*** -0.26063*** -1.06023***
Fodder -0.02524*** -0.10490*** -0.17783***
Land*Land -0.02265*** -0.02695*** -0.03778***
Capital*Capital -0.01853*** 0.01387*** -0.00062
Labour*Labour 0.01546*** 0.05795*** -0.00088
Livestock*Livestock 0.05513*** 0.01056*** 0.08655***
Fodder*Fodder 0.00302*** 0.00868*** 0.01953***
Time -0.02152 0.00432 0.09135*
Time*Time 0.00085*** 0.00166*** 0.00116***
Time*Land -0.00264*** -0.00216 0.00076
Time*Capital -0.00260** 0.00832*** -0.00146
Time*Labour 0.00149 -0.00853** -0.00956*
Time*Livestock 0.00173** -0.00057 -0.00316
Time*Fodder -0.00011 0.00026 -0.00056
Sigma 0.41749*** 0.97844*** 0.72292***
Class Membership Vector
Constant 1.56043*** 0.77145*** ---
Index 1 - Structure 0.56487*** 1.12839*** ---
Index 2 - Environmental sustainability -1.13632*** -1.86525*** ---
Index 3 - Innovation-cooperation-commercialisation -0.12745* 0.18963*** ---
Index 4 - Technology 0.79517*** 0.67305*** ---
Index 5 - Diversity 0.35866*** 0.71627*** ---
Index 6 - Individual 0.18813*** -0.23899*** ---
Index 7 - Location 0.13410*** 0.04344 ---
Index 8 - Household 0.20421*** 0.26399*** ---
Index 9 - Financial -0.03087 0.05827 ---
Log-Likelihood Function -13743.38382
Inf.Cr.AIC / AIC/N 27640.8 / 2.179
Note: *significant at 10%, **significant at 5%, ***significant at 1%.
Source: Estimations.

26 TAD/CA/APM/WP(2020)2/ANN/FINAL
DRIVERS OF FARM PERFORMANCE Unclassified
Table A D.1.23. Australian beef farms: Full production function estimates
Fixed-effects panel translog model per class, 1989 to 2018
Total output Class 1 Class 2 Class 3
Land 0.09296 -0.80292*** 0.98265
Capital -0.08788 0.58383** -0.20458
Labour -0.14576 -0.67474 0.17159
Livestock -0.41065*** -0.10132 -0.99015***
Fodder 0.00365 0.11241* 0.05097
Land*Land -0.01066** -0.01765** -0.06889***
Capital*Capital -0.00679 0.00674* 0.00617
Labour*Labour 0.01333*** 0.06065 -0.01205
Livestock*Livestock 0.02634*** 0.00204 0.01941***
Fodder*Fodder 0.00409*** 0.00396*** 0.01129***
Land*Capital -0.00178 0.01407 -0.00304
Land*Labour 0.00766 0.08084*** 0.04311
Land*Livestock 0.00819** 0.00852 -0.00108
Land*Fodder -0.00122 0.00221 -0.00086
Capital*Labour 0.01968 -0.08291*** -0.01988
Capital*Livestock 0.01565 0.01118 0.02446
Capital*Fodder -0.00352* -0.01172** 0.00588
Labour*Livestock -0.02186* -0.01340 0.03659
Labour*Fodder -0.00190 -0.00559 -0.02300
Livestock*Fodder 0.00263 0.00064 0.00477
Time 0.00716 -0.15503*** 0.14359
Time*Time 0.00076*** 0.00011 -0.00011
Time*Land -0.00039 -0.00571*** -0.00042
Time*Capital -0.00405** 0.01597*** 0.00545
Time*Labour 0.00228 0.00230 -0.02773***
Time*Livestock 0.00083 0.00120 0.00918
Time*Fodder -0.00038* 0.00113* -0.00036
Number of observations / average group size 8593 / 2.75 2777 / 2.47 1315 / 1.53
R-squared / R-bar squared 0.9665 / 0.9471 0.9469 / 0.9096 0.9667 / 0.8983
Rho squared (residual variation) 0.8215 0.8357 0.9315
R-squared (within groups var) 0.2993 0.2892 0.1911
Hausman Test 625.84*** 146.20*** 121.37***
Note: *significant at 10%, **significant at 5%, ***significant at 1%.
Source: Estimations.

TAD/CA/APM/WP(2020)2/ANN/FINAL 27
DRIVERS OF FARM PERFORMANCE Unclassified
Table A D.1.24. Australian beef farms: Elasticities for classes
LCM panel translog reduced model, 1989 to 2018
Wald procedure based on delta method at sample means
Total output Class 1 Class 2 Class 3
Land -0.03297*** -0.02943* -0.19534***
Capital 0.18793*** 0.30535*** -0.05662**
Labour 0.18843*** 0.64606*** 0.10915**
Livestock 0.67937*** 0.02597 1.06659***
Fodder 0.01956*** 0.05966*** 0.09202***
Returns-to-scale 1.04232*** 1.00760*** 1.01580***
Note: *significant at 10%, **significant at 5%, ***significant at 1%.
Source: Estimations.
Table A D.1.25. Australian beef farms: Class identification - mean values indices
Mean values1, 1989 to 2018
Class 1: Medium productive (67.7%)
Class 2: Most productive (21.9%)
Class 3: Least productive (10.4%)
Index 1 - Structure -0.3679 1.3549 -0.4572
Index 2 - Environmental sustainability 0.0637 -0.2764 0.1677
Index 3 – Innovation-cooperation-commercialisation -0.3849 0.9361 0.5383
Index 4 - Technology 0.1474 0.2921 -1.5799
Index 5 - Diversity 0.0793 0.2390 -1.0232
Index 6 - Individual 0.3620 -1.1545 0.0727
Index 7 - Location 0.1907 -0.6162 0.0548
Index 8 - Household 0.3215 -0.9680 -0.0571
Index 9 - Financial -0.2418 0.8142 -0.1390
Note: 1. At class means, scaled values.
Source: Estimations.

28 TAD/CA/APM/WP(2020)2/ANN/FINAL
DRIVERS OF FARM PERFORMANCE Unclassified
1.6. Australian sheep farms
Table A D.1.26. Australian sheep farms: Descriptive statistics
Sample 1989 to 2018
Note: LU per ha: Livestock Unit per hectare. 1. Values are per year.
Full sample (n = 4011)
1st year (1989, n = 110)
Final year (2018, n = 232)
Statistical measure Mean [Min; Max]
Mean [Min; Max]
Mean [Min; Max]
Variable1
Livestock output (AUD) 253 468 [40 000; 8 624 325]
131 617 [40 707; 679 487]
431 368 [40 000; 3 050 500]
Total output (AUD) 591 285 [43 675; 13 356 960]
480 249 [0; 223 459]
849 059 [52 600; 6 657 558]
Land (ha) 18 752 [0.4; 956 450]
25 247 [4 071; 679 487]
12 651 [93; 509 320]
Livestock Units (number) 7 715 [0; 96 498]
10 135 [606; 67 443]
6 208 [474; 48 324]
Capital depreciation (AUD) 39 348 [0; 605 781]
30 042 [17 770; 581 833]
43 468 [5 057; 218 863]
Hired labour (hour) 26 045 [1 230; 510 235]
36 682 [7 548; 247 128]
38 347 [6 190; 222 060]
Family labour (hour) 101 537 [3 980; 1 650 304]
49 681 [10 222; 334 705]
124 031 [20 020; 718 231]
Materials (AUD) 269 158 [11 133; 5 746 246]
172 426 [31 668; 758 373]
335 612 [36 072; 1 729 391]
Stocking density (LU per ha) 4.00 [0; 21.85]
3.67 [0.04; 18.20]
3.54 [0.04; 15.55]
Organic (0-1 probability) 0.002493 [0; 1]
0 [0; 0]
0.017241 [0; 1]
Total assets (AUD) 4 757 376 [115 350; 75 745 652]
2 790 358 [347 797; 14 942 217]
7 651 745 [337 236; 53 364 952]
Age (years) 54.2 [18; 93]
49.7 [23; 81]
59.0 [18; 93]

TAD/CA/APM/WP(2020)2/ANN/FINAL 29
DRIVERS OF FARM PERFORMANCE Unclassified
Table A D.1.27. Australian sheep farms: Latent class estimates
LCM panel translog reduced model, 1989 to 2018
Total output Class 1 Class 2 Class 3
Constant 19.3428*** 30.4360*** 22.9283***
Land -0.00931 -0.13843 -0.72624***
Capital -0.02077 0.17926 0.27892
Labour 0.81825 -4.39430*** -2.77262***
Livestock -0.09597 -0.30760 -0.48017***
Materials -2.75660*** 0.54170 0.97447
Land*Land -0.00240 0.00956 0.04629***
Capital*Capital 0.00239 0.01247 -0.02219**
Labour*Labour -0.03173 0.18597*** 0.13673***
Livestock*Livestock -0.00815** 0.00883 0.01976***
Materials*Materials 0.15297*** -0.00398 -0.03217
Time -0.02664 -0.12887 -0.18160***
Time*Time 0.00062*** 0.00124 0.00017
Time*Land 0.00050 -0.00380 0.00652**
Time*Capital 0.00150 -0.02239*** 0.01465***
Time*Labour 0.00195 0.03401** -0.02462**
Time*Livestock 0.00760*** 0.01933** 0.01938***
Time*Materials -0.00698** -0.01333 0.01065
Sigma 0.46945*** 0.44091*** 0.45275***
Class Membership Vector
Constant 0.94495*** -15.0185***
Index 1 - Structure 0.09313 3.77515***
Index 2 - Environmental sustainability 0.83765*** 7.16337***
Index 3 - Innovation-cooperation-commercialisation 0.31028*** -1.03609
Index 4 - Technology 0.58752*** 4.01745***
Index 5 - Diversity 0.85623*** -3.20101***
Index 6 - Individual -0.18432* -0.47461
Index 7 - Location 0.16269** 1.22987***
Index 8 - Household 0.05851 10.3661***
Index 9 - Financial 0.42522*** 2.13794***
Log-Likelihood Function -2923.43087
Inf.Cr.AIC / AIC/N 6000.9 / 1.496
Note: *significant at 10%, **significant at 5%, ***significant at 1%.
Source: Estimations.

30 TAD/CA/APM/WP(2020)2/ANN/FINAL
DRIVERS OF FARM PERFORMANCE Unclassified
Table A D.1.28. Australian sheep farms: Full production function estimates
Fixed-effects panel translog model per class, 1989 to 2018
Total output Class 1 Class 2 Class 3
Land -0.32968 -0.98153 0.23768
Capital 0.02223 0.08649 -0.02139
Labour 0.67808* 0.37684 0.09947
Livestock -0.39944 -1.08686 -0.54643
Materials -1.51648*** 2.03158 0.20121
Land*Land -0.01767 0.00757 0.06589
Capital*Capital 0.00582* 0.08785 -0.12462*
Labour*Labour 0.00714* 0.01328 -0.00114
Livestock*Livestock 0.03910 0.18911 0.17068
Materials*Materials 0.09584*** -0.02783 -0.20713*
Land*Capital 0.00383 -0.01364 -0.06485
Land*Labour 0.05878** 0.00994 -0.18603
Land*Livestock 0.02072** -0.00775 0.02847
Land*Materials -0.02138 0.06133 0.10989
Capital*Labour -0.05334 -0.50926** -0.12328
Capital*Livestock 0.01509* 0.30769* -0.04636
Capital*Materials 0.03040 0.11158 0.39472**
Labour*Livestock -0.05056 0.08254 -0.04975
Labour*Materials 0.00757 0.11391 -0.01913
Livestock*Materials -0.03920 -0.37297** 0.05834
Time 0.07466 0.17214 -0.33041*
Time*Time 0.00145*** 0.00155 0.00111
Time*Land 0.00071 0.01066 0.00819
Time*Capital -0.00081 0.01795 0.00241
Time*Labour -0.00089 -0.00397 0.00279
Time*Livestock 0.00704 0.00922 0.00513
Time*Materials -0.01423*** -0.04585*** 0.01233
Number of observations / average group size 2968 / 2.32 397 / 1.80 646 / 1.64
R-squared / R-bar squared 0.9465 / 0.9046 0.9768 / 0.9388 0.9685 / 0.9102
Rho squared (residual variation) 0.6601 0.7881 0.9398
R-squared (within groups var) 0.4042 0.4854 0.4099
Hausman Test 110.32*** 30.24*** 52.46*
Note: *significant at 10%, **significant at 5%, ***significant at 1%.
Source: Estimations.

TAD/CA/APM/WP(2020)2/ANN/FINAL 31
DRIVERS OF FARM PERFORMANCE Unclassified
Table A D.1.29. Australian sheep farms: Elasticities for classes
LCM panel translog reduced model, 1989 to 2018
Wald procedure based on delta method at sample means
Total output Class 1 Class 2 Class 3
Land -0.03965*** -0.04352 0.06935***
Capital 0.05000** 0.07521 0.03440
Labour 0.11851*** 0.48035*** 0.03061
Livestock -0.12200*** 0.15992*** 0.14614***
Materials 0.81647*** 0.22248*** 0.32757***
Returns-to-scale 0.82334*** 0.89444*** 0.60807***
Note: *significant at 10%, **significant at 5%, ***significant at 1%.
Source: Estimations.
Table A D.1.30. Table A B.1.30. Australian sheep farms: Class identification - mean values
indices
Mean values1, 1989 to 2018
Class 1: Most productive (73.9%)
Class 2: Least productive (9.9%)
Class 3: Medium productive (16.1%)
Index 1 - Structure -0.0352 0.4319 -0.1037
Index 2 - Environmental sustainability 0.2402 -0.1730 -0.9971
Index 3 – Innovation-cooperation-commercialisation -0.0229 0.0758 0.0585
Index 4 - Technology -0.2404 1.0735 0.4448
Index 5 - Diversity 0.5135 -1.6918 -1.3194
Index 6 - Individual -0.0699 0.3379 0.1135
Index 7 - Location 0.0534 -0.1501 -0.1531
Index 8 - Household -0.0726 1.0616 -0.3187
Index 9 - Financial -0.0667 0.4644 0.0212
Note: 1. At class means, scaled values.
Source: Estimations.

32 TAD/CA/APM/WP(2020)2/ANN/FINAL
DRIVERS OF FARM PERFORMANCE Unclassified
1.7. Australian wool farms
Table A D.1.31. Australian wool farms: Descriptive statistics
Sample 1989 to 2018
Note: LU per ha: Livestock Unit per hectare. 1. Values are per year.
Full sample (n = 5168)
1st year (1989, n = 250)
Final year (2018, n = 219)
Statistical measure Mean [Min; Max]
Mean [Min; Max]
Mean [Min; Max]
Variable1
Livestock output (AUD) 179 545 [0; 8 624 325]
76 741 [0; 679 487]
430 670 [0; 3 050 500]
Total output (AUD) 483 101 [0; 13 356 960]
345 527 [48 237; 2 561 299]
876 868 [57 153; 6 657 558]
Land (ha) 21 499 [25; 956 450]
20 274 [123; 956 450]
13 715 [128; 509 320]
Livestock Units (number) 7 913 [0; 96 498]
7 758 [1 135; 67 443]
6 511 [474; 48 324]
Capital depreciation (AUD) 33 854 [0; 819 409]
24 116 [0; 221 663]
44 265 [6 195; 218 864]
Hired labour (hour) 20 426 [949; 569 315]
15 035 [3 104;153 317]
44 434.16 [5 995; 247 772]
Family labour (hour) 92 955 [2 654; 1 591 224]
51 505 [8 676; 428 517]
124 193 [16 755; 692 519]
Materials (AUD) 220 531 [9 396; 5 746 246]
130 759 [11 184; 1 433 272]
345 645 [28 813; 1 729 391]
Stocking density (LU per ha) 3.31 [0.008; 31.19]
3.86 [0.03; 18.20]
3.50 [0.04; 15.55]
Organic (0-1 probability) 0.00135 [0; 1]
0 [0; 0]
0.013699 [0; 1]
Total assets (AUD) 3 826 584 [86 024; 75 745 652]
1 982 546 [261 984; 14 942 217]
7 975 898 [940 004; 53 364 952]
Age (years) 53.7 [18; 93]
49.5 [23; 85]
59.2 [18; 93]

TAD/CA/APM/WP(2020)2/ANN/FINAL 33
DRIVERS OF FARM PERFORMANCE Unclassified
Table A D.1.32. Australian wool farms: Latent class estimates
LCM panel translog reduced model, 1989 to 2018
Total output Class 1 Class 2 Class 3
Constant 7.71589*** 17.8771** 11.2515***
Land 0.02253 -0.17628 0.19567*
Capital -0.00804 0.31659 0.02552
Labour -0.44263 0.07783 -0.00024
Livestock -0.25972*** -1.39495** -1.69981***
Materials 0.48624** -0.33647 0.50161
Land*Land -0.00272 0.00697 -0.01408***
Capital*Capital 0.00208 -0.02927 -0.00149
Labour*Labour 0.02369* -0.01329 0.00943
Livestock*Livestock 0.04346*** 0.04718 0.13217***
Materials*Materials -0.00450 0.05452 -0.01995
Time -0.03131** -0.15896** -0.07787***
Time*Time 0.00224*** 0.00301*** 0.00103***
Time*Land 0.47718D-04 0.00056 0.01067***
Time*Capital -0.00236** 0.01063** -0.00482*
Time*Labour 0.00123 0.01442 0.00257
Time*Livestock 0.01179*** 0.03936*** -0.00035
Time*Materials -0.00872*** -0.04532*** 0.00029
Sigma 0.29276*** 0.18874*** 0.32675***
Class Membership Vector
Constant 1.30502*** -6.23462*** ---
Index 1 - Structure -0.06323 -2.53966*** ---
Index 2 - Environmental sustainability 0.07312 -0.59212*** ---
Index 3 - Innovation-cooperation-commercialisation -0.16434 0.15154 ---
Index 4 - Technology -0.40500*** -0.15264 ---
Index 5 - Diversity 0.62124*** 6.44772*** ---
Index 6 - Individual 0.06486 0.72417*** ---
Index 7 - Location -0.24594*** -0.04864 ---
Index 8 - Household -0.02176 -0.08085 ---
Index 9 - Financial -0.15942 -0.47212** ---
Log-Likelihood Function -1801.79913
Inf.Cr.AIC / AIC/N 3757.6 / 0.725
Note: *significant at 10%, **significant at 5%, ***significant at 1%.
Source: Estimations.

34 TAD/CA/APM/WP(2020)2/ANN/FINAL
DRIVERS OF FARM PERFORMANCE Unclassified
Table A D.1.33. Australian wool farms: Full production function estimates
Fixed-effects panel translog model per class, 1989 to 2018
Total output Class 1 Class 2 Class 3
Land -0.32888* -1.51932 -0.56774
Capital -0.11777 -18.4133** -1.74630
Labour -0.84773* -6.25746 -2.86284**
Livestock 0.49504 -4.61905 3.43844***
Materials -0.40291 22.3210** -0.37110
Land*Land -0.02622*** -0.17429 -0.02358
Capital*Capital 0.00333 0.03807 0.07405
Labour*Labour 0.04490 0.00445 0.25671**
Livestock*Livestock 0.07513** 0.20648 0.04059
Materials*Materials 0.05198** -0.87785** 0.19247***
Land*Capital -0.00690 -1.02547 -0.03555
Land*Labour 0.04046** 1.70262** 0.09858
Land*Livestock 0.02782* -0.05700 -0.05113
Land*Materials 0.01524 -0.18017 0.03720
Capital*Labour -0.00738 1.93054** 0.10954
Capital*Livestock -0.00222 -0.35345 0.10606
Capital*Materials 0.02121 0.68793 -0.12905
Labour*Livestock -0.08102 -0.90878 -0.31476**
Labour*Materials 0.03216 -1.46040* -0.16105
Livestock*Materials -0.09458** 1.17169* -0.09770
Time 0.05416* 1.95668** 0.22305*
Time*Time 0.00208*** -0.00054 0.00055
Time*Land 0.00157 -0.12664* 0.00751
Time*Capital -0.00029 -0.14304** -0.00389
Time*Labour 0.00214 -0.02120 -0.00725
Time*Livestock 0.01140*** 0.07087 0.00468
Time*Materials -0.01898*** 0.00488 -0.01524
Number of observations / average group size 4169 / 2.53 166 / 1.42 851 / 1.57
R-squared / R-bar squared 0.9601 / 0.9332 0.9908 / 0.9309 0.9821 / 0.9459
Rho squared (residual variation) 0.7281 0.9871 0.9089
R-squared (within groups var) 0.4614 0.7269 0.4101
Hausman Test 187.62*** 34.03* 47.10**
Note: *significant at 10%, **significant at 5%, ***significant at 1%.
Source: Estimations.

TAD/CA/APM/WP(2020)2/ANN/FINAL 35
DRIVERS OF FARM PERFORMANCE Unclassified
Table A D.1.34. Australian wool farms: Elasticities for classes
LCM panel translog reduced model, 1989 to 2018
Wald procedure based on delta method at sample means
Total output Class 1 Class 2 Class 3
Land -0.02157*** -0.07107** 0.10545***
Capital 0.00912 -0.07166 -0.06490***
Labour 0.10825*** 0.04732 0.24864***
Livestock 0.61850*** 0.08669* 0.55832***
Materials 0.29037*** 0.11154** 0.00932
Returns-to-scale 1.00467*** 0.10281* 0.85683***
Note: *significant at 10%, **significant at 5%, ***significant at 1%.
Source: Estimations.
Table A D.1.35. Australian wool farms: Class identification - mean values indices
Mean values1, 1989 to 2018
Class 1: Most productive (80.4%)
Class 2: Least productive (3.2%)
Class 3: Medium productive (16.4%)
Index 1 - Structure 0.0437 -0.5804 -0.1008
Index 2 - Environmental sustainability 0.2355 -0.7425 -1.0090
Index 3 – Innovation-cooperation-commercialisation -0.1034 0.8975 0.3313
Index 4 - Technology -0.2835 0.2759 1.3352
Index 5 - Diversity 0.3835 0.6373 -2.0029
Index 6 - Individual -0.0338 0.8113 0.0071
Index 7 - Location -0.0801 0.0835 0.3760
Index 8 - Household -0.0438 0.6584 0.0863
Index 9 - Financial -0.0686 -0.1676 0.3688
Note: 1. At class means, scaled values.
Source: Estimations.

36 TAD/CA/APM/WP(2020)2/ANN/FINAL
DRIVERS OF FARM PERFORMANCE Unclassified
2. Chile
2.1. Chilean small-scale fruit farms
Table A D.2.1. Chilean small-scale fruit farms: Descriptive statistics
Sample 2015
Note: 1. Values are per year.
2- Gross value of production for output as supplied by national agency.
3- Excluding land.
Full sample (2015, n = 448)
Statistical measure Mean [Min; Max]
Variable 1
Fruit output (EUR) 2 8 380 [5; 116 134]
Land (ha) 2.93 [0.02; 60.1]
Fixed assets (EUR) 3 9 891 [0.6; 127 064]
Chemicals cost (EUR) 1 273 [0.2; 25 550]
Family labour (person) 1.3 [0.01; 7.1]
Hired labour (person) 0.6 [0; 1.1]
Age (years) 57.6 [26; 90]
Off-farm income (EUR) 72.9 [0; 1 935.6]

TAD/CA/APM/WP(2020)2/ANN/FINAL 37
DRIVERS OF FARM PERFORMANCE Unclassified
Table A D.2.2. Chilean small-scale fruit farms: Latent Class Estimates
LCM cross-section translog reduced model, 2015
Total fruit output Class 1 Class 2 Class 3
Constant 10.4391** 22.6688* 21.8045
Land 0.3979*** -0.0494 -0.2653*
Capital 1.0891** -0.9594 -0.3873
Chemicals -1.1999** -0.7658 -1.6129
Labour 0.1793 -0.3656 0.0679
Land*Land -0.0783*** -0.1315* 0.2095***
Capital*Capital -0.0315** 0.0359 0.0177
Chemicals*Chemicals 0.0562*** 0.0481 0.0986**
Labour*Labour 0.0209 0.0289 -0.0472
Sigma 0.6436*** 1.3729*** 0.6704***
Class Membership Vector
Constant 1.1058** 0.8092 ---
Index 1 - Structure 0.1289 0.3429 ---
Index 2 - Environmental sustainability -0.1909 -0.2137 ---
Index 3 – Innovation-cooperation-commercialisation 0.7562** -0.1291 ---
Index 4 - Technology 1.2062** 1.0664* ---
Index 5 - Diversity -0.5625* -0.8886** ---
Index 6 - Individual -0.2429 0.0736
Index 7 - Location -0.6424* -0.8407** ---
Index 8 - Household 0.1776 0.0894
Log-Likelihood Function -701.8881
Inf.Cr.AIC / AIC/N 1499 / 3.348
Note: *significant at 10%, **significant at 5%, ***significant at 1%.
Source: Estimations.

38 TAD/CA/APM/WP(2020)2/ANN/FINAL
DRIVERS OF FARM PERFORMANCE Unclassified
Table A D.2.3. Chilean small-scale fruit farms: Full Production Function Estimates
Cross-sectional translog model per class, 2015
Total fruit output Class 1 Class 2 Class 3
Constant 10.1782 18.1016* 31.5875**
Land 0.0991 -0.8673 0.3713
Capital 1.1886** -1.0724 -0.3657
Chemicals -1.2729** -0.6093 -1.4247**
Labour 0.2564 1.0711 -3.6092
Land*Land -0.0793*** -0.1381** 0.2384***
Capital*Capital -0.0432*** 0.0416** 0.0139
Chemicals*Chemicals 0.0526** 0.0692 0.1052***
Labour*Labour 0.0123 0.1532 0.2604
Land*Capital 0.0176 -0.0207 -0.0081
Land*Chemicals -0.0105 0.0215 0.0142
Land*Labour 0.0225 0.1342 -0.1199
Capital*Chemicals 0.0157 0.0197 -0.0041
Capital*Labour 0.0059 -0.0597 0.0255
Chemicals*Labour -0.0092 -0.1604 -0.0435
Number of observations / average group size 200 162 86
R-squared / R-bar squared 0.7299 / 0.7094 0.3043 / 0.2381 0.8681 / 0.8421
F-Test 35.71*** 4.59*** 33.39***
Note: *significant at 10%, **significant at 5%, ***significant at 1%.
Source: Estimations.
Table A D.2.4. Chilean small-scale fruit farms: Elasticities for classes
LCM cross-sectional translog reduced model, 2015
Wald procedure based on delta method at sample means
Total fruit output Class 1 Class 2 Class 3
Land 0.3149*** 0.3069 0.0401
Capital 0.1303*** 0.3582 0.1235
Chemicals 0.2791*** 0.4167*** 0.8106***
Labour 0.4357*** 0.0274 0.0511*
Returns-to-scale 1.1599*** 1.1091** 1.5597**
Note: *significant at 10%, **significant at 5%, ***significant at 1%.
Source: Estimations.

TAD/CA/APM/WP(2020)2/ANN/FINAL 39
DRIVERS OF FARM PERFORMANCE Unclassified
Table A D.2.5. Chilean small-scale fruit farms: Class identification - mean values indices
Mean values1, 2015
Class 1: Most productive (44.6%)
Class 2: Least productive (36.2%)
Class 3: Medium productive (19.2%)
Index 1 - Structure -0.1948 0.3898 -0.2813
Index 2 - Environmental sustainability 0.2485 -0.2462 -0.1142
Index 3 – Innovation-cooperation-commercialisation 1.0223 -0.9384 -0.6097
Index 4 - Technology 0.2184 -0.0265 -0.4581
Index 6 - Individual -0.0580 -0.3078 0.7146
Index 7 - Location -0.0872 0.1290 -0.0402
Index 8 - Household -0.0065 -0.3079 0.5952
Index 9 - Financial 0.0713 -0.0212 -0.1258
Note: 1. At class means, scaled values.
Source: Estimations.

40 TAD/CA/APM/WP(2020)2/ANN/FINAL
DRIVERS OF FARM PERFORMANCE Unclassified
3. Czech Republic
3.1. Czech dairy farms
Table A D.3.1. Czech dairy farms: Descriptive statistics
Sample 2005 to 2015
Note: LU per ha: Livestock Unit per hectare. 1. Values are per year.
Full sample (n = 1 011)
1st year (2005, n = 52)
Final year (2015, n = 97)
Statistical measure Mean [Min; Max]
Mean [Min; Max]
Mean [Min; Max]
Variable1
Milk output (EUR) 452 638 [6 156; 3 723 580]
343 033 [8 894; 2 112 335]
586 502 [10 928; 2 678 867]
Dairy cows (n) 193 [4; 829]
168 [6; 829]
240 [10; 824]
Capital depreciation (EUR) 97 868 [0; 891 729]
54 526 [157; 415 414]
184 891 [235; 881 109]
Fodder cost (EUR) 261 605 [1 742; 1 694 230]
177 787 [4 590; 1 222 558]
372 442 [1 741; 1 649 988]
Materials (EUR) 40 580 [77; 365 669]
26 113 [77; 341 627]
62 514 [454; 365 669]
Other cost (EUR) 101 329 [815; 833 065]
58 776 [1 334; 290 094]
130 827 [2 957; 543 852]
Hired labour (hour) 40 996 [0; 282 782]
37 313 [0; 257 733]
49 431 [0; 282 782]
Family labour (hour) 2 549 [0; 11 800]
2 733 [0; 11 800]
2 600 [0; 11 600]
Land (ha) 555 [10; 3 094]
473 [10; 1 736]
676 [18; 2 438]
Stocking density (LU per ha) 0.72 [0.23; 2.34]
0.72 [0.27; 2.07]
0.74 [0.28; 1.63]
Chemicals cost (EUR) 25 800 [0; 444 050]
12 498 [0; 172 166]
46 003 [0; 353 641]
Organic (0-1 probability) 0.1474 [0; 1]
0.1351 [0; 1]
0.1341 [0; 1]
Total assets (EUR) 2 276 195 [19 399; 17 622 802]
1 553 341 [24 363; 13 804 403]
2 782 801 [32 167; 17 622 802]
Age (years) 52.4 [25; 74]
49.3 [25; 67]
55.1 [25; 74]
Less-Favoured-Area (1-3 severely disadvantaged )
2.2225 [1; 3]
2.2811 [1; 3]
2.1649 [1; 3]

TAD/CA/APM/WP(2020)2/ANN/FINAL 41
DRIVERS OF FARM PERFORMANCE Unclassified
Table A D.3.2. Czech dairy farms: Latent class estimates
LCM panel translog reduced model, 2005 to 2015
Total dairy output Class 1 Class 2 Class 3
Constant 15.2201** 0.0241 5.1982
Dairy Cows -0.7939 0.4893 05088
Capital -0.7146*** -0.0367 0.0136
Materials -1.7429*** -0.1591 -0.3225
Fodder 0.9228 0.2487 1.8623***
Fuel 0.8090 1.1322** -1.2172***
Labour -0.0858 -0.4492*** 0.2204
Dairy cows*Dairy cows 0.0713 -0.0232 -0.0311
Capital*Capital 0.0281*** 0.0056 0.0011
Materials*Materials 0.0629*** 0.0121 0.0168
Fodder*Fodder -0.0136 0.0007 -0.0459*
Fuel*Fuel -0.0151 -0.0291 0.0463***
Labour*Labour 0.0249 0.0463** -0.0571
Time 0.7549*** 0.0919 0.2727
Time*Time 0.0048*** 0.0072** 0.0036*
Time*Dairy Cows 0.0655*** 0.0218 0.0385*
Time*Capital -0.0009 -0.0063 -0.0027
Time*Materials 0.0042 -0.0158 0.0087
Time*Fodder -0.0267** 0.0071 -0.0716***
Time*Fuel -0.0408*** -0.0113 0.0374***
Time*Labour -0.0165 0.0229 -0.0077
Sigma 0.1601*** 0.2553*** 0.2002***
Class Membership Vector
Constant 2.7531 2.6087 ---
Index 1 - Structure -7.8716*** -2.7787* ---
Index 2 - Environmental sustainability 1.2419** 2.7697*** ---
Index 3 – Innovation-cooperation-commercialisation -1.5674 -3.0878* ---
Index 4 - Technology 0.0644 -0.8533* ---
Index 5 - Diversity -1.7175*** 4.7171*** ---
Index 7 - Location -0.7671 1.5388** ---
Log-Likelihood Function 135.026
Inf.Cr.AIC / AIC/N -110.1 / -0.109
Note: *significant at 10%, **significant at 5%, ***significant at 1%.
Source: Estimations.

42 TAD/CA/APM/WP(2020)2/ANN/FINAL
DRIVERS OF FARM PERFORMANCE Unclassified
Table A D.3.3. Czech dairy farms: Full production function estimates
Fixed-effects panel translog model per class, 2005 to 2015
Total dairy output Class 1 Class 2 Class 3
Dairy cows 0.0016 6.3909* -2.9986
Capital 0.8414 0.7419 -0.7224
Materials 0.3104 0.3604 1.2756
Fodder 2.9442 -4.1331 1.9299
Fuel -0.5317 -6.1935** -1.8131
Labour -0.8219 3.3208 3.5491
Dairy cows*Dairy cows -0.3578 0.1413 0.1588
Capital*Capital 0.0333* 0.0051 -0.0058
Materials*Materials -0.0225 -0.0762** -0.0049
Fodder*Fodder 0.0036 0.1180 -0.0032
Fuel*Fuel 0.0475 0.1635 0.0562
Labour*Labour -0.3469*** 0.1771 0.3652**
Dairy cows*Capital 0.0167 0.2129* -0.10006
Dairy cows*Materials 0.0461 0.0489 0.2218**
Dairy cows*Fodder 0.0436 -0.3239 0.0028
Dairy cows*Fuel 0.1215 -0.4831* 0.1139
Dairy cows*Labour 0.2967 0.1985 -0.3478
Capital*Materials -0.0199 0.0149 -0.0395
Capital*Fodder -0.1439** -0.1414 0.1196**
Capital*Fuel 0.0381 0.0127 0.0029
Capital*Labour 0.0437 -0.0825 0.245
Materials*Fodder -0.0094 0.0629 -0.1818**
Materials*Fuel 0.0229 0.0119 0.0859
Materials*Labour 0.0402 0.0329 -0.0739
Fodder*Fuel -0.0955 0.2850 -0.0587
Fodder*Labour 0.1869 -0.1378 -0.0752
Fuel*Labour -0.1712 -0.1451 -0.1254
Time 0.2038 0.1707 0.0671
Time*Time 0.0054*** 0.0055*** 0.0024
Time*Dairy cows -0.0159 0.0132 -0.0097
Time*Capital -0.0017 0.0099 0.0024
Time*Materials 0.0007 -0.0032 0.0105
Time*Fodder 0.0092 -0.0059 -0.0361*
Time*Fuel -0.0214 -0.0257 0.0263**
Time*Labour 0.0086 0.0218 0.0192
Number of observations / average group size 343 / 4.29 328 / 3.52 340 / 6.42
R-squared / R-bar squared 0.9795 / 0.9692 0.9888 / 0.9817 0.9631 / 0.9503
Rho squared (residual variation) 0.9228 0.8303 0.6068
R-squared (within groups var) 0.6685 0.5828 0.6201
Hausman Test 83.42*** 61.86*** 43.84*
Note: *significant at 10%, **significant at 5%, ***significant at 1%.
Source: Estimations.

TAD/CA/APM/WP(2020)2/ANN/FINAL 43
DRIVERS OF FARM PERFORMANCE Unclassified
Table A D.3.4. Czech dairy farms: Elasticities for classes
LCM panel translog reduced model, 2005 to 2015
Wald procedure based on delta method at sample means
Total dairy output Class 1 Class 2 Class 3
Dairy cows 0.4792*** 0.4381*** 0.5287***
Capital 0.0692*** 0.0697*** 0.0242***
Material 0.0852*** 0.0317*** 0.1103***
Fodder 0.3053*** 0.3177*** 0.2041***
Fuels 0.0742*** 0.2565*** 0.1559***
Labour 0.0186*** 0.0883*** 0.0626***
Returns-to-scale 1.1211*** 1.2020*** 1.0857***
Note: *significant at 10%, **significant at 5%, ***significant at 1%.
Source: Estimations.
Table A D.3.5. Czech dairy farms: Class identification - mean values indices
Mean values1, 2005 to 2015
Class 1: Most productive (33.9%)
Class 2: Medium productive (32.5%)
Class 3: Least productive (33.6%)
Index 1 - Structure -1.5974 0.1502 1.4666
Index 2 - Environmental sustainability 0.3087 0.4622 -0.7574
Index 3 – Innovation-cooperation-commercialisation 0.6923 -0.2304 -0.4761
Index 4 – Technology 0.2450 -0.2415 -0.0142
Index 5 – Diversity 0.0865 0.9826 -1.0353
Index 7 – Location 0.2703 1.2756 -0.6735
Note: 1. At class means, scaled values.
Source: Estimations.

44 TAD/CA/APM/WP(2020)2/ANN/FINAL
DRIVERS OF FARM PERFORMANCE Unclassified
4. Denmark
4.1. Danish dairy farms
Table A D.4.1. Danish dairy farms: Descriptive statistics
Sample 2006 to 2016
Note: LU per ha: Livestock Unit per hectare. 1. Values are per year.
Full sample (n = 17 121)
1st year (2010, n = 2 756)
Final year (2016, n = 2 131)
Statistical measure Mean [Min; Max]
Mean [Min; Max]
Mean [Min; Max]
Variable1
Milk output (EUR) 615 190 [3 140; 8 101 894]
494 345 [9 349; 4 222 505]
787 739 [3 140; 10 867 880]
Dairy cows (n) 172 [1; 2 460]
152 [6; 1 067]
199 [2.5; 2 460]
Capital depreciation (EUR) 71 668 [0; 642 233]
70 626 [0; 447 364]
78 403 [0; 642 233]
Fodder cost (EUR) 166 676 [0; 3 238 438]
129 189 [5 215; 1 600 867]
201 304 [280; 3 238 438]
Materials (EUR) 49 012 [0; 1 046 274]
49 668 [1 329; 513 233]
54 202 [0; 1 046 274]
Hired labour (hour) 3 163 [0; 44 580]
2 384 [0; 25 834]
3 960 [0; 44 580]
Family labour (hour) 2 870 [0; 20 545]
2 886 [0; 18 264]
2 812 [0; 13 008]
Land (ha) 54.8 [0; 914]
47.6 [0; 807]
63.4 [0; 768.2]
Stocking density (LU per ha) 7.89 [0; 633.3]
7.77 [0; 307.6]
8.08 [0; 544.7]
Chemicals cost (EUR) 18 873 [0; 238 982]
15 586 [0; 110 030.7]
22 038 [0; 169 640]
Organic (0-1 probability) 0.2889 [0; 1]
0.2906 [0; 1]
0.2684 [0; 1]
Total assets (EUR) 3 794 599 [0; 60 768 505]
4 277 617 [0; 60 768 505]
3 836 263 [157 030; 19 618 377]
Age (years) 48.3 [22; 105]
46.6 [24; 99]
51.1 [22; 105]
Total subsidies (EUR) 114 925 [0; 1 371 813]
66 382 [0; 351 295]
162 957 [0; 1 371 813]

TAD/CA/APM/WP(2020)2/ANN/FINAL 45
DRIVERS OF FARM PERFORMANCE Unclassified
Table A D.4.2. Danish dairy farms: Latent class estimates
LCM panel translog reduced model, 2010 to 2016
Total dairy output Class 1 Class 2 Class 3
Constant 13.1272*** -3.7601*** 2.0177*
Land -0.0320*** -0.0224* 0.0019
Dairy Cows 1.1402*** 0.2083*** 0.6353***
Capital -0.0792*** 0.3496*** -0.1386***
Material -0.2733*** 1.1787*** 1.3341***
Labour -0.4622*** 0.8217*** -0.5989***
Land*Land 0.0077*** 0.0065*** -0.0006
Dairy cows*Dairy cows -0.0623*** 0.0117* -0.0478***
Capital*Capital 0.0051*** -0.0013 0.0098***
Materials*Materials 0.0172*** -0.0369*** -0.0356***
Labour*Labour 0.0396*** -0.0343*** 0.0619***
Time -0.1817*** -0.1836*** -0.1118**
Time*Time 0.0058*** 0.0084*** -0.0006
Time*Land 0.0006 0.0027*** 0.0002
Time*Dairy Cows -0.0049* -0.0074 -0.0015
Time*Capital 0.0008*** -0.0203*** 0.0011
Time*Material 0.0144*** 0.0201*** 0.0168***
Time*Labour -0.0101*** 0.0107*** -0.0118**
Sigma 0.0972*** 0.1689*** 0.1579***
Class Membership Vector
Constant 3.8194*** 0.0001 ---
Index 1 - Structure -0.6592*** -0.2583** ---
Index 2 - Environmental sustainability 0.7302*** 3.1835*** ---
Index 3 – Innovation-cooperation-commercialisation 0.1664** 0.1991 ---
Index 4 - Technology 1.2777*** 4.3237*** ---
Index 5 - Diversity 2.9316*** 5.2951*** ---
Index 6 - Individual -0.3969*** -0.6584***
Index 7 - Location 0.0179 -0.0236 ---
Index 8 - Household 0.1673 0.2929**
Index 9 - Financial 0.2425** 0.9934***
Log-Likelihood Function 11128.5
Inf.Cr.AIC / AIC/N -22103 / -1.291
Note: *significant at 10%, **significant at 5%, ***significant at 1%.
Source: Estimations.

46 TAD/CA/APM/WP(2020)2/ANN/FINAL
DRIVERS OF FARM PERFORMANCE Unclassified
Table A D.4.3. Danish dairy farms: Full production function estimates
Fixed-effects panel translog model per class, 2010 to 2016
Total dairy output Class 1 Class 2 Class 3
Land 0.0752 -0.3919** 0.4065**
Dairy cows 2.5901*** 2.6291*** 2.0589**
Capital 0.0261 0.8816** 0.8949***
Material -0.3421 -0.4557 -0.3278
Labour -1.4157*** -1.1065 -0.3089
Land*Land 0.0066*** 0.0099** -0.0022
Dairy cows*Dairy cows 0.1135*** 0.2973*** -0.0127
Capital*Capital 0.0025*** -0.0589*** 0.0055***
Materials*Materials 0.0301** 0.0873*** 0.1031***
Labour*Labour 0.1605*** -0.0134 0.1020*
Land*Dairy cows 0.0115* -0.0147 0.0783***
Land*Capital 0.0007 0.0344*** -0.0225***
Land*Material -0.0041 -0.0046 0.0148
Land*Labour -0.0127** 0.0033 -0.0811***
Dairy cows*Capital 0.0051 0.0194 0.1349***
Dairy cows*Material -0.0802** -0.1692*** -0.2739***
Dairy cows*Labour -0.2505*** -0.3553*** 0.0358
Capital*Material -0.0030 -0.0918*** -0.0686***
Capital*Labour -0.0056 0.2094*** -0.0691***
Material*Labour 0.0169 0.0318 -0.0139
Time -0.1112*** -0.2107*** 0.0101
Time*Time 0.0055*** 0.0135*** -0.0021***
Time*Land 0.0006* 0.0014 -0.0005
Time*Dairy cows 0.0044* 0.0184*** 0.0201**
Time*Capital 0.0005 -0.0079** 0.0013
Time*Material 0.0041** 0.0014 0.0059
Time*Labour -0.0056*** 0.0017 -0.0181**
Number of observations / average group size 11 464 / 4.70 2734 / 2.56 2923
R-squared / R-bar squared 0.9912 / 0.9888 0.9896 / 0.9826 0.9926 / 0.9851
Rho squared (residual variation) 0.6513 0.9348 0.7786
R-squared (within groups var) 0.9385 0.7307 0.7602
Hausman Test 282.24*** 258.87*** 214.56***
Note: *significant at 10%, **significant at 5%, ***significant at 1%.
Source: Estimations.

TAD/CA/APM/WP(2020)2/ANN/FINAL 47
DRIVERS OF FARM PERFORMANCE Unclassified
Table A D.4.4. Danish dairy farms: Elasticities for classes
LCM panel translog reduced model, 2010 to 2016
Wald procedure based on delta method at sample means
Total dairy output Class 1 Class 2 Class 3
Land 0.0249*** 0.0457*** 0.0003
Dairy cows 0.4714*** 0.2625*** 0.1775***
Capital 0.0567*** 0.1538*** 0.1108***
Material 0.3335*** 0.3025*** 0.4666***
Labour 0.1425*** 0.3193*** 0.3457***
Returns-to-scale 1.0291*** 1.0838*** 1.1008***
Note: *significant at 10%, **significant at 5%, ***significant at 1%.
Source: Estimations.
Table A D.4.5. Danish dairy farms: Class identification - mean values indices
Mean values1
Class 1: Most productive (66.9%)
Class 2: Medium productive (15.9%)
Class 3: Least productive (17.2%)
Index 1 - Structure -0.1459 -0.0030 0.5749
Index 2 - Environmental sustainability -0.2879 1.1130 0.0873
Index 3 – Innovation-cooperation-commercialisation 0.0763 0.0466 -0.3427
Index 4 - Technology -0.0578 0.4853 -0.2276
Index 5 - Diversity 0.2199 1.3527 -2.1279
Index 6 - Individual -0.0289 -0.0263 0.1382
Index 7 - Location 0.0144 -0.0305 -0.0281
Index 8 - Household -0.0292 0.1931 -0.0663
Index 9 - Financial 0.0655 0.4719 -0.6981
Note: 1. At class means, scaled values.
Source: Estimations.

48 TAD/CA/APM/WP(2020)2/ANN/FINAL
DRIVERS OF FARM PERFORMANCE Unclassified
4.2. Danish pig farms
Table A D.4.6. Danish pig farms: Descriptive statistics
Sample 2006 to 2016
Note: 1. Values are per year.
Full sample (n = 21 765)
1st year (2006, n = 1 834)
Final year (2016, n = 1 690)
Statistical measure Mean [Min; Max]
Mean [Min; Max]
Mean [Min; Max]
Variable1
Total output (EUR) 811 713 [0; 8 471 053]
535 920 [0; 3 286 469]
1 207 712 [0; 8 471 053]
Livestock value (EUR) 289 104 [0; 4 072 788]
207 794 [0; 1 406 573]
424 979 [0; 4 072 788]
Capital depreciation (EUR) 87 745 [0; 965 147]
65 484 [0; 381 379]
112 446 [0; 798 053]
Fodder cost (EUR) 461 349 [0; 5 802 611]
212 727 [0; 1 367 059]
613 204 [0; 4 535 778]
Materials (EUR) 52 881 [0; 1 869 756]
35 346 [0; 371 931]
76 088 [0; 829 366]
Hired labour (h) 3 497 [0; 41 053]
2 433 [0; 20 717]
4 903 [0; 41 053]
Family labour (h) 2 935 [0; 263 485]
3 153 [0; 11 773]
2 496 [0; 11 896]
Land (ha) 173.2 [0; 2 246]
144.4 [0; 1 122.4]
202.1 [0; 1 848.6]
Livestock value per ha (EUR per ha) 1 669 [0; 1 814]
1 263 [0; 1 439]
2 103 [0; 2 203]
Chemicals cost (EUR) 30 428 [0; 432 921]
16 476 [0; 200 918]
44 816 [0; 432 921]
Organic (0-1 probability) 0.1968 [0; 1]
0.2557 [0; 1]
0.1615 [0; 1]
Total assets (EUR) 5 180 472 [0; 39 793 302]
3 999 853 [0; 27 793 137]
5 959 486 [0; 39 793 302]
Age (years) 46.8 [22; 93.4]
43.9 [25; 95]
50.1 [22; 105]
Total subsidies (EUR) 71 796 [0; 958 460.6]
43 037 [0; 324 292]
106 249 [0; 958 461]
Farm Type Rearing & Fattening (0-1 probability)
0.2267 [0; 1]
0.2241 [0; 1]
0.2201 [0; 1]
Farm Type Specialist Rearing (0-1 probability)
0.3357 [0; 1]
0.3195 [0; 1]
0.3633 [0; 1]
Farm Type Fattening (0-1 probability)
0.4376 [0; 1]
0.4564 [0; 1]
0.4166 [0; 1]

TAD/CA/APM/WP(2020)2/ANN/FINAL 49
DRIVERS OF FARM PERFORMANCE Unclassified
Table A D.4.7. Danish pig farms, type rearing and fattening: Latent class estimates
LCM panel translog reduced model, 2006 to 2016
Total livestock output Class 1 Class 2 Class 3
Constant 7.0765*** 3.1083*** 2.7974***
Land 0.0479* -0.0068 -0.0247**
Capital -0.2287*** -0.0979*** -0.0572***
Fodder -0.4256*** -0.6877*** -0.3349***
Labour 1.5194*** 1.3706*** -0.0577
Livestock -0.0202** -0.1123*** -0.1299***
Other inputs livestock -0.0332*** 0.0091 0.0043
Materials 0.0885 0.8973*** 1.5252***
Land*Land 0.0182*** 0.0033 0.0091***
Capital*Capital 0.0146*** 0.0046*** 0.0023***
Fodder*Fodder 0.0299*** 0.0472*** 0.0213***
Labour*Labour -0.0707*** -0.0671*** 0.0171
Livestock*Livestock 0.0003 0.0085*** 0.0086***
Other inputs livestock*Other inputs livestock 0.0029*** -0.0018 -0.0005
Materials*Materials -0.0054 -0.0354*** -0.0436***
Time -0.1928*** -0.1317** 0.0163
Time*Time -0.0002 0.0032** -0.0002
Time*Land -0.0131*** 0.0012 -0.0031***
Time*Capital -0.0002 0.0085*** 0.0029***
Time*Fodder 0.0077*** 0.0252*** 0.0085***
Time*Labour -0.0215*** -0.0387*** -0.0081**
Time*Livestock 0.0021*** 0.0019 -0.0003
Time*Other inputs livestock 0.0007 0.0022** -0.67e-05
Time*Materials 0.0248*** -0.0061 -0.0051*
Sigma 0.1069*** 0.1686*** 0.0926***
Class Membership Vector
Constant 0.2860** -2.7297*** ---
Index 1 - Structure 0.7804*** 0.7659*** ---
Index 2 - Environmental sustainability 0.9369*** 2.1615*** ---
Index 3 – Innovation-cooperation-commercialisation 0.1501* -0.0522 ---
Index 4 - Technology 2.6668*** 0.3995 ---
Index 5 - Diversity 0.3552*** 0.0957 ---
Index 6 - Individual 0.1016 -0.0231 ---
Index 7 - Location 0.2937*** 0.4594*** ---
Index 8 - Household 0.1444 0.3522*** ---
Index 9 - Financial 0.2248 -1.7015*** ---
Log-Likelihood Function 3320.96
Inf.Cr.AIC / AIC/N -6451.9 / -1.308
Note: *significant at 10%, **significant at 5%, ***significant at 1%.
Source: Estimations.

50 TAD/CA/APM/WP(2020)2/ANN/FINAL
DRIVERS OF FARM PERFORMANCE Unclassified
Table A D.4.8. Danish pig farms, type specialist fattening: Latent class estimates
LCM panel translog reduced model, 2006 to 2016
Total livestock output Class 1 Class 2 Class 3
Constant 11.0257*** 3.0455*** 5.5386***
Land -0.0618*** -0.0173 -0.0078
Capital -0.0688*** 0.0187 -0.0275***
Labour 0.9265*** 2.2211*** 1.9099***
Livestock -0.0732*** -0.0701*** -0.0537***
Other inputs livestock 0.0019 0.0062* 0.0015
Materials -0.5461*** -0.4044*** -0.6811***
Land*Land 0.0204*** 0.0101*** 0.0037**
Capital*Capital 0.0066*** 0.0052*** 0.0024***
Labour*Labour -0.0322*** -0.1215*** -0.1089***
Livestock*Livestock 0.0036*** 0.0031*** 0.0037***
Other inputs livestock*Other inputs livestock -0.0007 -0.0008*** 0.0002
Materials*Materials 0.0309*** 0.0329*** 0.0519***
Time -0.0225 -0.0289* 0.0654***
Time*Time -0.0004 0.0004 0.0021***
Time*Land -0.0088*** -0.0051*** 0.0004
Time*Capital -0.0033** -0.0085*** -0.0005
Time*Labour 0.0004 0.0175*** 0.0011
Time*Livestock 0.0031*** 0.0046*** 0.0006*
Time*Other inputs livestock -0.0004 0.0002 -0.0004
Time*Materials 0.0066*** -0.0016 -0.0058**
Sigma 0.1147*** 0.1004*** 0.1432***
Class Membership Vector
Constant 0.2463 1.8365*** ---
Index 1 - Structure 0.1076 0.5221*** ---
Index 2 - Environmental sustainability -0.4581*** -0.4909*** ---
Index 3 – Innovation-cooperation-commercialisation 0.4445*** 0.2602*** ---
Index 4 - Technology 0.2274** 0.1532* ---
Index 5 - Diversity 0.4735*** 0.0663 ---
Index 6 - Individual -0.3511*** -0.1506** ---
Index 7 - Location -1.0246*** -0.3698*** ---
Index 8 - Household -0.1308 -0.1179 ---
Index 9 - Financial 2.7286*** 2.0684*** ---
Log-Likelihood Function 6015.62
Inf.Cr.AIC / AIC/N -11859.2 / -1.245
Note: *significant at 10%, **significant at 5%, ***significant at 1%.
Source: Estimations.
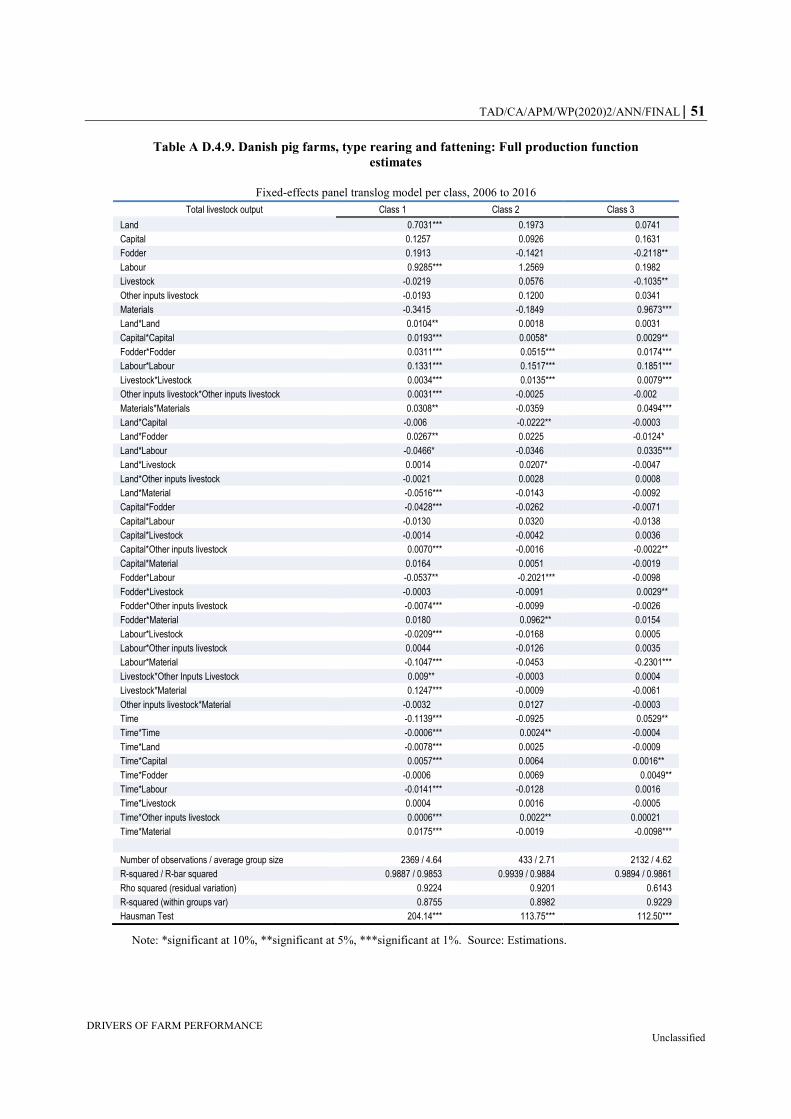
TAD/CA/APM/WP(2020)2/ANN/FINAL 51
DRIVERS OF FARM PERFORMANCE Unclassified
Table A D.4.9. Danish pig farms, type rearing and fattening: Full production function
estimates
Fixed-effects panel translog model per class, 2006 to 2016
Total livestock output Class 1 Class 2 Class 3
Land 0.7031*** 0.1973 0.0741
Capital 0.1257 0.0926 0.1631
Fodder 0.1913 -0.1421 -0.2118**
Labour 0.9285*** 1.2569 0.1982
Livestock -0.0219 0.0576 -0.1035**
Other inputs livestock -0.0193 0.1200 0.0341
Materials -0.3415 -0.1849 0.9673***
Land*Land 0.0104** 0.0018 0.0031
Capital*Capital 0.0193*** 0.0058* 0.0029**
Fodder*Fodder 0.0311*** 0.0515*** 0.0174***
Labour*Labour 0.1331*** 0.1517*** 0.1851***
Livestock*Livestock 0.0034*** 0.0135*** 0.0079***
Other inputs livestock*Other inputs livestock 0.0031*** -0.0025 -0.002
Materials*Materials 0.0308** -0.0359 0.0494***
Land*Capital -0.006 -0.0222** -0.0003
Land*Fodder 0.0267** 0.0225 -0.0124*
Land*Labour -0.0466* -0.0346 0.0335***
Land*Livestock 0.0014 0.0207* -0.0047
Land*Other inputs livestock -0.0021 0.0028 0.0008
Land*Material -0.0516*** -0.0143 -0.0092
Capital*Fodder -0.0428*** -0.0262 -0.0071
Capital*Labour -0.0130 0.0320 -0.0138
Capital*Livestock -0.0014 -0.0042 0.0036
Capital*Other inputs livestock 0.0070*** -0.0016 -0.0022**
Capital*Material 0.0164 0.0051 -0.0019
Fodder*Labour -0.0537** -0.2021*** -0.0098
Fodder*Livestock -0.0003 -0.0091 0.0029**
Fodder*Other inputs livestock -0.0074*** -0.0099 -0.0026
Fodder*Material 0.0180 0.0962** 0.0154
Labour*Livestock -0.0209*** -0.0168 0.0005
Labour*Other inputs livestock 0.0044 -0.0126 0.0035
Labour*Material -0.1047*** -0.0453 -0.2301***
Livestock*Other Inputs Livestock 0.009** -0.0003 0.0004
Livestock*Material 0.1247*** -0.0009 -0.0061
Other inputs livestock*Material -0.0032 0.0127 -0.0003
Time -0.1139*** -0.0925 0.0529**
Time*Time -0.0006*** 0.0024** -0.0004
Time*Land -0.0078*** 0.0025 -0.0009
Time*Capital 0.0057*** 0.0064 0.0016**
Time*Fodder -0.0006 0.0069 0.0049**
Time*Labour -0.0141*** -0.0128 0.0016
Time*Livestock 0.0004 0.0016 -0.0005
Time*Other inputs livestock 0.0006*** 0.0022** 0.00021
Time*Material 0.0175*** -0.0019 -0.0098***
Number of observations / average group size 2369 / 4.64 433 / 2.71 2132 / 4.62
R-squared / R-bar squared 0.9887 / 0.9853 0.9939 / 0.9884 0.9894 / 0.9861
Rho squared (residual variation) 0.9224 0.9201 0.6143
R-squared (within groups var) 0.8755 0.8982 0.9229
Hausman Test 204.14*** 113.75*** 112.50***
Note: *significant at 10%, **significant at 5%, ***significant at 1%. Source: Estimations.

52 TAD/CA/APM/WP(2020)2/ANN/FINAL
DRIVERS OF FARM PERFORMANCE Unclassified
Table A D.4.10. Danish pig farms, type specialist fattening: Full production function
estimates
Fixed-effects panel translog model per class, 2006 to 2016
Total livestock output Class 1 Class 2 Class 3
Land 0.6320*** 0.1279 -0.2578***
Capital -0.0132 0.1071 0.0074
Labour 0.6134*** 1.8598*** 1.0801***
Livestock 0.0037 -0.0465*** -0.0432**
Other inputs livestock 0.0052 0.0051 -0.0379
Materials -0.3874** -0.3413*** -0.2361
Land*Land 0.0415*** 0.0009 0.0024
Capital*Capital 0.0051*** 0.0153*** 0.0026***
Labour*Labour 0.04612* -0.1454*** 0.0659***
Livestock*Livestock 0.0026*** 0.0031*** 0.0029***
Other inputs livestock*Other inputs livestock -0.0004 -0.0007** 0.0028***
Materials*Materials 0.0751*** 0.0348*** 0.0621***
Land*Capital -0.0307*** 0.0048 0.0024
Land*Labour 0.0957*** 0.0228** -0.0323***
Land*Livestock 0.0164*** -0.0009 -0.0004
Land*Other Inp Livestock -0.0004 -0.0002 -0.0014
Land*Materials -0.1119*** -0.0227*** 0.0034***
Capital*Labour 0.0008 0.0056 -0.0052
Capital*Livestock -0.0021*** 0.0004 -0.0021***
Capital*Other inputs livestock 0.0001 0.0007 0.0011
Capital*Materials 0.0106 -0.0322*** 0.0014
Labour*Livestock -0.0101*** -0.0048 -0.0067
Labour*Other inputs livestock -0.0030 0.0006 -0.0017
Labour*Materials -0.1011*** 0.0467*** -0.1207***
Livestock*Other inputs livestock -0.0003 -0.0003* 0.0007**
Livestock*Materials -0.0033 0.0014 0.0054**
Other inputs livestock*Materials 0.0022 0.0046 0.0064
Time 0.0241 -0.0169 0.445**
Time*Time 0.0002 -0.0002 0.0021***
Time*Land -0.0002 -0.0037*** -0.0025***
Time*Capital -0.0023 -0.0032*** 0.0002
Time*Labour 0.0125*** 0.0107*** 0.0159***
Time*Livestock 0.0038*** 0.0041*** 0.0005
Time*Other inputs livestock -0.00028 0.0008 0.0004
Time*Material -0.0085*** -0.0031*** -0.0125***
Number of observations / average group size 1852 /3.88 5670 / 5.39 2002 / 3.48
R-squared / R-bar squared 0.9896 / 0.9856 0.9853 / 0.9819 0.9899 / 0.9856
Rho squared (residual variation) 0.8462 0.8063 0.7204
R-squared (within groups var) 0.9177 0.9125 0.9008
Hausman Test 422.15*** 102.91*** 132.86***
Note: *significant at 10%, **significant at 5%, ***significant at 1%.
Source: Estimations.

TAD/CA/APM/WP(2020)2/ANN/FINAL 53
DRIVERS OF FARM PERFORMANCE Unclassified
Table A D.4.11. Danish pig farms, type rearing and fattening: Elasticities for classes
LCM panel translog reduced model, 2006 to 2016
Wald procedure based on delta method at sample means
Total livestock output Class 1 Class 2 Class 3
Land 0.1501*** 0.0223* 0.0523***
Capital 0.1484*** 0.0563*** 0.0207***
Fodder 0.4911*** 0.7765*** 0.3671***
Labour 0.1844*** 0.0753* 0.2057***
Livestock 0.0009 0.1211*** 0.1221***
Other Inputs Livestock 0.0211*** 0.0117 0.0023
Materials 0.0955*** 0.0071 0.3029***
Returns-to-scale 1.0473*** 1.0703*** 1.0729***
Note: *significant at 10%, **significant at 5%, ***significant at 1%.
Source: Estimations.
Table A D.4.12. Danish pig farms, type specialist fattening: Elasticities for classes
LCM panel translog reduced model, 2006 to 2016
Wald procedure based on delta method at sample means
Total dairy output Class 1 Class 2 Class 3
Land 0.1051*** 0.4914*** 0.1772***
Capital 0.0848*** 0.1013*** 0.0266***
Labour 0.3761*** 0.3555*** 0.2384***
Livestock 0.0462*** 0.0392*** 0.0421***
Other Inputs Livestock 0.0728 0.0035* 0.0003
Materials 0.3898*** 0.2584*** 0.5354***
Returns-to-scale 1.0747*** 1.2494*** 1.0199***
Note: *significant at 10%, **significant at 5%, ***significant at 1%.
Source: Estimations.
Table A D.4.13. Danish pig farms, type rearing and fattening: Class identification - mean
values indices
Mean values1
Class 1: Medium productive (48.0%)
Class 2: Least productive (8.8%)
Class 3: Most productive (43.2%)
Index 1 – Structure 0.6862 1.1176 -0.9895
Index 2 – Environmental sustainability 0.0016 1.1393 -0.2332
Index 3 – Innovation-cooperation-commercialisation -0.0173 -0.6529 0.1519
Index 4 – Technology 0.0862 -0.0577 -0.0841
Index 5 – Diversity 0.5208 -0.8660 -0.4028
Index 6 – Individual 0.1414 0.1054 -0.1786
Index 7 – Location 0.0362 0.2415 -0.0893
Index 8 – Household 0.0135 -0.0008 -0.0149
Index 9 – Financial -0.3131 -1.0601 0.5632
Note: 1. At class means, scaled values.
Source: Estimations.

54 TAD/CA/APM/WP(2020)2/ANN/FINAL
DRIVERS OF FARM PERFORMANCE Unclassified
Table A D.4.14. Danish pig farms, type specialist fattening: Class identification - mean values
indices
Mean values1
Class 1: Most productive (19.4%)
Class 2: Medium productive (59.5%)
Class 3: Least productive (21.1%)
Index 1 - Structure -1.4742 0.2376 0.6910
Index 2 - Environmental sustainability -0.8319 0.0523 0.6213
Index 3 – Innovation-cooperation-commercialisation 0.5552 0.0659 -0.7002
Index 4 - Technology 0.1314 -0.0158 -0.0768
Index 5 - Diversity 0.8071 0.0584 -0.9120
Index 6 - Individual -0.1007 0.0132 0.0557
Index 7 - Location -0.4848 0.0308 0.3611
Index 8 - Household 0.2516 -0.0410 -0.1166
Index 9 - Financial 1.5537 -0.1439 -1.0296
Note: 1. At class means, scaled values.
Source: Estimations.

TAD/CA/APM/WP(2020)2/ANN/FINAL 55
DRIVERS OF FARM PERFORMANCE Unclassified
5. Estonia
5.1. Estonian dairy farms
Table A D.5.1. Estonian dairy farms: Descriptive statistics
Sample 2000 to 2015
Note: LU per ha: livestock unit per ha. 1. Values are per year.
Full sample (n = 2 935)
1st year (2000, n = 221)
Final year (2015, n = 138)
Statistical measure Mean [Min; Max]
Mean [Min; Max]
Mean [Min; Max]
Variable1
Milk output (EUR) 211 478 [0; 5 268 544]
48 840 [2 461; 953 028]
467 339 [0; 3 788 281]
Dairy cows (n) 105 [1; 1 808]
62 [3; 1 286]
224 [0.8; 1 745]
Capital depreciation (EUR) 38 448 [0; 897 141]
7 363 [0; 330 341]
110 184 [40; 737 739]
Fodder cost (EUR) 126 080 [0; 3 222 847]
17 939 [0; 320 865]
344 822 [390; 3 062 942]
Materials (EUR) 22 910 [0; 3 620 209]
4 356 [0; 132 215]
54 843 [75; 803 772]
Other cost (EUR) 14 915 [0; 508 724]
2 595 [0; 43 577]
38 039 [8; 408 545]
Hired labour (hour) 14 680 [0; 317 061]
12 191 [0; 317 061]
23 695 [0; 240 102]
Family labour (hour) 3 214 [0; 19 000]
4 228 [0; 11 980]
1 462 [0; 5 840]
Land (ha) 350 [0; 5862]
229 [12.8; 4 772]
593 [0; 5 700]
Stocking density (LU per ha) 0.67 [0; 57.1]
0.57 [0.13; 3.02]
0.97 [0; 20.30]
Chemicals cost (EUR) 20 692 [0; 827 250]
3 082.8 [0; 86 389]
55 426 [0; 772 367]
Organic (0-1 probability) 0.1141 [0; 1]
0.1041 [0; 1]
0.0652 [0; 1]
Total assets (EUR) 698 418 [1 625; 22 416 934]
119 844 [6 838; 1 893 708]
1 960 688 [14 259; 22 416 934]
Age (years) 51.5 [19; 86]
47.3 [23; 69]
53.9 [21; 82]
Less-Favoured-Area (0-1 probability)
0.7816 [0; 1]
0.5566 [0; 1]
1 [1; 1]

56 TAD/CA/APM/WP(2020)2/ANN/FINAL
DRIVERS OF FARM PERFORMANCE Unclassified
Table A D.5.2. Estonian dairy farms: Latent class estimates
LCM panel translog reduced model, 2000 to 2015
Milk output Class 1 Class 2
Constant 4.9529*** 4.8574***
Dairy cows 1.2966*** 1.2309***
Capital 0.1419*** 0.1819*
Fodder -0.1297 -0.1324
Materials 0.1578 0.1425
Veterinary -0.0196 -0.0119
Labour hired 0.0034 -0.0789
Labour family -0.0375 -0.0211
Dairy cows*dairy cows -0.0925*** -0.0944***
Capital*capital -0.0077*** -0.0233***
Fodder*fodder 0.0202** 0.0497***
Materials*materials -0.0047 0.0109
Veterinary*veterinary 0.0069* 0.0024
Labour hired*labour hired -0.0006 -0.0065
Labour family*labour family 0.7625e-04 0.0229*
Time -0.0328* 0.2547
Time*time 0.0035*** -0.0216***
Time*dairy cows 0.1236 0.0003
Time*capital 0.0034** 0.0541***
Time*fodder -0.0071 -0.0259*
Time*materials -0.0059 -0.0115
Time*veterinary -0.0029 0.0036
Time*labour hired -0.0002 -0.0211*
Time*labour family 0.0052*** -0.0219***
Sigma 0.5174*** 0.8963***
Class Membership Vector
Constant -0.0031 ---
Index 1 - Structure -0.0418*** ---
Index 2 - Environmental sustainability -0.0029*** ---
Index 4 - Technology 0.0112*** ---
Index 5 - Diversity 0.0623*** ---
Index 6 - Individual 0.0518*** ---
Index 7 - Location -0.0002 ---
Log-Likelihood Function -2819.3636
Inf.Cr.AIC / AIC/N 5748 / 1.959
Note: 1- *significant at 10%, **significant at 5%, ***significant at 1%.
Source: Estimations.

TAD/CA/APM/WP(2020)2/ANN/FINAL 57
DRIVERS OF FARM PERFORMANCE Unclassified
Table A D.5.3. Estonian dairy farms: Full production function estimates
Fixed-effects panel translog model per class, 2000 to 2015
Milk output Class 1 Class 2
Dairy cows -1.4331*** -1.2993
Capital 0.8382*** -0.5781*
Fodder 0.6692*** 1.7878***
Materials 0.2961** 0.1666
Veterinary 0.3549*** 0.1596
Labour hired 0.0175 -0.0261
Labour family -0.0569 -0.0099
Dairy cows*dairy cows -0.1985*** -0.0184
Capital*capital 0.0031 -0.0127
Fodder*fodder -0.0094 -0.1738***
Materials*materials 0.0125* 0.0186**
Veterinary*veterinary 0.0092*** 0.0006
Labour hired*labour hired 0.0011 -0.0189
Labour family*labour family 0.0027 0.0067
Dairy cows*capital 0.1589*** -0.1011
Dairy cows*fodder 0.1461*** 0.2586*
Dairy cows*material 0.0383 -0.0015
Dairy cows*veterinary 0.0515*** 0.0582*
Dairy cows*labour hired 0.0086 0.0152
Dairy cows*family labour -0.0085 -0.0129
Capital*fodder -0.0799*** 0.0883*
Capital*materials -0.0488*** 0.0253
Capital*veterinary -0.0441*** 6.59e-05
Capital*labour hired -0.0006 0.0066
Capital*family labour 0.0111** -0.0054
Fodder*materials 0.0024 -0.0647*
Fodder*veterinary -0.0099 -0.0381
Fodder*labour hired -0.0041 0.0669
Fodder*labour family -0.0017 0.0154
Materials*veterinary -0.0051 0.0101
Materials*labour hired 0.0024 -0.0112
Materials*labour family -0.0046 0.0036
Veterinary*labour hired -0.0036** -0.0157
Veterinary*labour family 0.0013 -0.0071
Labour hired*labour family 0.0051 -0.0039
Time -0.1504*** -0.1987**
Time*time -0.0019*** -0.0112***
Time*dairy cows -0.0467*** -0.0421**
Time*capital 0.0091*** 0.0037
Time*fodder 0.0263*** 0.0586***
Time*materials -0.0017 -0.0049
Time*veterinary 0.0025 0.0077*
Time*labour hired 0.0006 -0.0129
Time*labour family -0.0016 -3.33e-07
Number of observations / average group size 2431 / 6.30 504 / 3.79
R-squared / R-bar squared 0.9591 / 0.9503 0.9988 / 0.9981
Rho squared (residual variation) 0.5815 0.9974
R-squared (within groups var) 0.6962 0.8439
Hausman Test 89.06***(0.0000) 128.87***(0.0000)
Note: *significant at 10%, **significant at 5%, ***significant at 1%.
Source: Estimations.

58 TAD/CA/APM/WP(2020)2/ANN/FINAL
DRIVERS OF FARM PERFORMANCE Unclassified
Table A D.5.4. Estonian dairy farms: Elasticities for classes
LCM panel translog reduced model, 2000 to 2015
Wald procedure based on delta method at sample means
Milk output Class 1 Class 2
Dairy cows 0.8642*** 0.7592***
Capital 0.1459*** 0.1427***
Fodder 0.1094** 0.1718***
Materials 0.0393 0.0059
Veterinary 0.0227** 0.0058
Labour hired 0.0034 0.0066
Labour family 0.0047 0.0979***
Returns-to-scale 1.1896*** 1.1651***
Note: *significant at 10%, **significant at 5%, ***significant at 1%.
Source: Estimations.
Table A D.5.5. Estonian dairy farms: Class identification - mean values indices
Mean values1
Class 1: Least productive (83%)
Class 2: Most productive (17%)
Index 1 - Structure -0.4595 2.2165
Index 2 - Environmental sustainability 1.8418 -8.8839
Index 3 – Innovation-cooperation-commercialisation -2.8488 13.7411
Index 4 - Technology -1.8691 9.0153
Index 5 - Diversity 1.1648 -5.6182
Index 6 - Individual 3.3621 -16.2166
Index 7 - Location 0.7012 -3.3821
Note: 1- at class means, scaled values.
Source: Estimations.

TAD/CA/APM/WP(2020)2/ANN/FINAL 59
DRIVERS OF FARM PERFORMANCE Unclassified
6. France
6.1. French dairy farms
Table A D.6.1. French dairy farms: Descriptive statistics
Sample 1990 to 2013
Note: AWU: Annual Work Unit. LU per ha: Livestock Unit per hectare. 1. Values are per year.
Full sample (n = 28 711)
1st year (1990, n = 1 491)
Final year (2013, n = 1 040)
Statistical measure Mean [Min; Max]
Mean [Min; Max]
Mean [Min; Max]
Variable1
Milk output (EUR) 107 809 [0; 894 275]
69 969 [11 011; 286 367]
181 083 [14 027; 894 275]
Total output (EUR) 156 934 [3 901; 1 834 396]
101 089 [11 311; 456 071]
260 759 [19 436; 1 834 396]
Dairy cows (number) 44.4] [7; 250]
35.0 [8; 128]
59.4 [11; 249]
Capital depreciation (EUR) 22 284 [0; 292 897]
9 678.938 [0; 59 077]
42 316 [1; 292 897]
Fodder cost (EUR) 18 370 [0; 243 322]
11 793 [0; 66 916]
16 202 [0; 163 519]
Materials (EUR) 4 919.896 [0; 754 15]
2 878.746 [26; 14 865]
7 346 [56; 70 817]
Hired labour (AWU) 0.4251 [0.1822; 2.2452]
0.404 [0.2246; 1.3323]
0.3557 [0.1829; 1.4522]
Family labour (AWU) 1.3243 [0.5678; 6.9948]
1.2155 [0.6754; 4.0072]
1.5891 [0.8171; 6.4878]
Land (ha) 72.0 [0; 521]
47.0 [9; 255]
99.1 [9; 504]
Stocking density (LU per ha) 1.56 [0; 274.43]
1.6208 [0.2944; 6.7583]
1.481 [0.3647; 6.7615]
Chemicals cost (EUR) 9 460 [0; 163 519]
6 505 [0; 36 380]
16 202 [0; 163 519]
Organic (0-1 probability) 0.021 [0; 1]
0 [0; 0]
0.0664 [0; 1]
Total assets (EUR) 299 848 [0; 2 987 444]
193 259 [18 469; 858 598]
486 083 [25 335; 2 987 444]
Age (years) 46.3 [1; 113]
37.8 [1; 90]
57.2 [26; 113]

60 TAD/CA/APM/WP(2020)2/ANN/FINAL
DRIVERS OF FARM PERFORMANCE Unclassified
Table A D.6.2. French dairy farms: Latent class estimates
LCM panel translog reduced model, 1990 to 2013
Total output Class 1 Class 2 Class 3
Constant 8.74747*** 6.34980*** 5.10532***
Land -0.80056*** 0.33925*** 0.30699***
Dairy Cows 1.82797*** 0.45151*** 0.47985***
Capital -0.50898*** -0.08403*** -0.24173***
Labour 0.21348*** 0.07442*** 0.13210***
Materials -0.07428 0.21275*** 0.48133***
Land*Land 0.06712*** -0.02383*** -0.02229***
Dairy Cows*Dairy Cows -0.19948*** -0.02587*** -0.02286**
Capital*Capital 0.03410*** 0.00934*** 0.01762***
Labour*Labour -0.00670 0.05856*** -0.02009
Materials*Materials 0.03602*** 0.00817** -0.00179
Time 0.06723*** -0.02787*** 0.02931***
Time*Time 0.00048*** 0.40501D-04 -0.00025***
Time*Land 0.00698*** -0.00699*** -0.00672***
Time*Dairy Cows -0.00272 0.01419*** 0.01416***
Time*Capital -0.00207** 0.00084*** 0.00148***
Time*Laour -0.00269 -0.00275*** 0.00185*
Time*Materials -0.00820*** -0.00039 -0.00636***
Sigma 0.26977*** 0.13515*** 0.16633***
Class Membership Vector
Constant -0.62047*** 2.00108*** ---
Index 1 - Structure 1.93741*** 1.10972*** ---
Index 2 - Environmental sustainability 0.17265** -0.18459*** ---
Index 3 – Innovation-cooperation-commercialisation 0.48414*** 0.45992*** ---
Index 4 - Technology -0.77831*** -0.30479*** ---
Index 5 - Diversity 3.09045*** 1.14252*** ---
Index 6 - Individual 0.21796*** -0.16739*** ---
Index 7 - Location -2.63357*** -1.21329*** ---
Index 8 - Household 10.6104*** 4.68727*** ---
Index 9 - Financial 1.64098*** 0.49141*** ---
Log-Likelihood Function 6437.74527
Inf.Cr.AIC / AIC/N -12721.5 -0.443
Note: *significant at 10%, **significant at 5%, ***significant at 1%.
Source: Estimations.

TAD/CA/APM/WP(2020)2/ANN/FINAL 61
DRIVERS OF FARM PERFORMANCE Unclassified
Table A D.6.3. French dairy farms: Full production function estimates
Fixed-effects panel translog model per class, 1990 to 2013
Total output Class 1 Class 2 Class 3
Land -0.79054*** 0.23145*** 0.14964
Dairy cows 1.63400*** 0.88034*** 0.64607***
Capital -0.06389 -0.09988*** -0.11375**
Labour 1.05159*** 0.42411*** 0.64229***
Materials -0.22975* -0.24246*** 0.18453*
Land*Land 0.12045*** -0.02486*** -0.01441***
Dairy cows*Dairy cows -0.11122*** 0.00810 -0.07694***
Capital*Capital 0.05196*** 0.00772*** 0.01904***
Labour*Labour 0.10602*** 0.06916*** -0.00537
Materials*Materials 0.08633*** 0.04578*** 0.01669**
Land*Dairy Cows 0.04807 0.01718 -0.01620
Land*Capital -0.04632** 0.00426 -0.01898***
Land*Labour -0.00619 0.00444 0.02992**
Land*Materials -0.14790*** -0.03355*** 0.01174
Dairy cows*Capital 0.03230 0.01138 0.03283***
Dairy cows*Labour -0.08993*** -0.08320*** -0.00306
Dairy cows*Materials 0.08142 0.02934* 0.12931***
Capital*Labour -0.06482*** -0.00037 -0.01845***
Capital*Materials -0.03376* -0.00366 -0.01138
Labour*Materials -0.03862 -0.03195*** -0.09335***
Time 0.03170*** -0.00450 0.00437
Time*Time 0.00039*** 0.00019*** -0.00022***
Time*Land 0.00599*** -0.00708*** -0.00651***
Time*Dairy cows -0.00838*** 0.01241*** 0.01073***
Time*Capital -0.00160 0.00042 0.00079
Time*Labour 0.00363 -0.00027 0.00178*
Time*Materials -0.00262* -0.00201*** -0.00225***
Number of observations / average group size 6031 / 6.1 14819 / 6.7 7861 / 5.1
R-squared / R-bar squared 0.8766 / 0.8747 0.9537 / 0.9534 0.9341 / 0.9332
Rho squared (residual variation) 0.4278 0.3016 0.3841
R-squared (within groups var) 0.8508 0.9433 0.9122
Hausman Test 55.64*** 45.50** 78.28***
Note: *significant at 10%, **significant at 5%, ***significant at 1%.
Source: Estimations.

62 TAD/CA/APM/WP(2020)2/ANN/FINAL
DRIVERS OF FARM PERFORMANCE Unclassified
Table A D.6.4. French dairy farms: Elasticities for classes
LCM panel translog reduced model, 1990 to 2013
Wald procedure based on delta method at sample means
Total dairy output Class 1 Class 2 Class 3
Land -0.09778*** 0.06715*** 0.05741***
Dairy cows 0.27706*** 0.41766*** 0.47125***
Capital 0.13899*** 0.10428*** 0.10811***
Labour 0.16348*** 0.09855*** 0.13664***
Materials 0.55495*** 0.37694*** 0.37497***
Returns-to-scale 1.03670*** 1.06459*** 1.14838***
Note: *significant at 10%, **significant at 5%, ***significant at 1%.
Source: Estimations.
Table A D.6.5. French dairy farms: Class identification - mean values indices
Mean values1, 1990 to 2013
Class 1: Most productive (21.0%)
Class 2: Medium productive (51.6%)
Class 3: Least productive (27.4%)
Index 1 - Structure -0.5018 0.1195 0.1596
Index 2 - Environmental sustainability -0.0958 -0.2565 0.5571
Index 3 – Innovation-cooperation-commercialisation 0.7326 -0.0210 -0.5225
Index 4 - Technology 0.4473 -0.0711 -0.2093
Index 5 - Diversity 1.0933 0.1324 -1.0883
Index 6 - Individual 0.3333 -0.1518 0.0305
Index 7 - Location 0.0622 -0.6259 1.1321
Index 8 - Household 0.6597 -0.2146 -0.1015
Index 9 - Financial 0.9372 -0.1553 -0.4263
Note: 1. At class means, scaled values.
Source: Estimations.

TAD/CA/APM/WP(2020)2/ANN/FINAL 63
DRIVERS OF FARM PERFORMANCE Unclassified
6.2. French crop farms
Table A D.6.6. French crop farms: Descriptive statistics
Sample 1989 to 2016
Note: AWU: Annual Work Unit. 1. Values are per year.
Full sample (n = 50 785)
1st year (1990, n = 1 848)
Final year (2013, n = 1 651)
Statistical measure Mean [Min; Max]
Mean [Min; Max]
Mean [Min; Max]
Variable1
Crop output (EUR) 136 026 [0; 4 023 170]
93 110 [3 087; 624 223]
167 360 [5 618; 3 933 724]
Total output (EUR) 155 125 [0; 4 063 431]
105 917 [9 261; 697 551]
193 058 [8 985; 3 982 610]
Land (hectares) 122.1 [1.4; 794.5]
76.6 [3.0; 391.7]
135.9 [3.4; 746.9]
Capital depreciation (EUR) 25 287 [0; 335 675]
15 367 [155; 130 997]
19 562 [0; 219 373]
Materials (EUR) 762 [0; 293 588]
399 [0; 36 323]
891 [0; 252 287]
Chemicals cost (EUR) 37 376 [0; 389 192]
20 312 [1 061; 115 070]
55 652 [0; 356 782]
Hired labour (AWU) 0.4263 [0.1606; 10.2278]
0.3103 [0.1606; 3.4679]
0.4228 [0.0235; 9.7065]
Family labour (AWU) 1.2957 [0.6194; 31.6039]
1.1966 [0.6194; 13.3747]
1.3767 [0.0765; 31.6039]
Organic (0-1 probability) 0.01189 [0; 1]
0 [0; 0]
0.04119 [0; 1]
Total assets (EUR) 33 4915 [0; 6 344 058]
20 1721 [6 818; 1 648 816]
44 9985 [ 54; 6 344 058]
Age (years) 53 [17; 116]
43 [22; 89]
46 [21; 116]

64 TAD/CA/APM/WP(2020)2/ANN/FINAL
DRIVERS OF FARM PERFORMANCE Unclassified
Table A D.6.7. French crop farms: Latent class estimates
LCM panel translog reduced model, 1990 to 2013
Total output Class 1 Class 2 Class 3 Class 4
Constant 9.25728*** 6.52442*** 5.87275*** 11.7230***
Land 0.24447*** 0.67033*** 0.01207 0.83723***
Capital -0.07739*** -0.03751*** 0.22864*** -0.42793***
Labour 0.17684*** 0.38915*** 0.03698 -0.30566***
Materials -0.33089*** -0.15402*** 0.23765*** -0.36486***
Land*Land -0.02911*** -0.06189*** 0.03258*** -0.01649***
Capital*Capital 0.01216*** 0.00686*** 0.00567*** 0.01148***
Labour*Labour 0.06020*** -0.26030*** 0.05172*** 0.11930***
Materials*Materials 0.04816*** 0.04551*** 0.00213 0.03450***
Time 0.06358*** 0.00336 0.07015*** -0.15013***
Time*Time 0.00254*** 0.00268*** -0.00023* 0.00239***
Time*Land 0.01132*** -0.00088 -0.00877*** -0.01421***
Time*Capital -0.00148*** 0.00044* -0.01020*** 0.01191***
Time*Laour 0.00568*** -0.00294** 0.01112*** 0.01834***
Time*Materials -0.01581*** -0.00825*** 0.00644*** 0.00180
Sigma 0.24328*** 0.26806*** 0.32755*** 0.23322***
Class Membership Vector
Constant 3.10576*** 0.76805*** -2.34586*** ---
Index 1 - Structure 2.58326*** 2.30462*** 3.28560*** ---
Index 2 - Environmental sustainability 0.15484*** 0.01052 -7.30751*** ---
Index 3 – Innovation-cooperation-commercialisation 0.41057*** -1.60584*** 1.12813*** ---
Index 4 - Technology 0.15402 -2.84942*** 6.77061*** ---
Index 5 - Diversity -0.10282*** -0.41463*** 1.06442*** ---
Index 6 - Individual -1.48526*** -1.70582*** -1.74142*** ---
Index 7 - Location -0.28668*** 0.19165*** -0.71111*** ---
Index 8 - Household -0.23926*** 0.08944** 0.03926 ---
Index 9 - Financial 2.25877*** 1.24117*** 1.69392*** ---
Log-Likelihood Function -9010.97605
Inf.Cr.AIC / AIC/N 18210.0 / 0.359
Note: *significant at 10%, **significant at 5%, ***significant at 1%.
Source: Estimations.

TAD/CA/APM/WP(2020)2/ANN/FINAL 65
DRIVERS OF FARM PERFORMANCE Unclassified
Table A D.6.8. French crop farms: Full production function estimates
Fixed-effects panel translog model per class, 1990 to 2013
Total output Class 1 Class 2 Class 3 Class 4
Land 0.15784*** 0.71410*** 0.01192 0.44514***
Capital -0.01620 0.01875 0.31299*** -0.43826***
Labour 0.56149*** 1.10179*** 0.24881** 0.21694**
Materials -0.14018*** -0.09189*** 0.28978*** -0.25785***
Land*Land 0.02159*** -0.08418*** 0.06689*** 0.00758
Capital*Capital 0.00936*** 0.00253*** 0.00839*** 0.00981***
Labour*Labour 0.11198*** -0.16741*** 0.08163*** 0.15203***
Materials*Materials 0.04675*** 0.04056*** 0.00783** 0.02995***
Land*Capital 0.00639*** 0.00218 -0.00817** 0.01231***
Land*Labour -0.11322*** 0.11237*** -0.11648*** -0.12125***
Land*Materials -0.02783*** 0.01684* -0.00232 0.01293
Capital*Labour 0.00299** 0.00684 0.02915*** 0.00084
Capital*Materials -0.00796*** -0.00187 -0.01694*** -0.00707***
Labour*Materials 0.00075 -0.14695*** -0.00941 0.01469
Time 0.03574*** 0.01431*** 0.07567*** -0.15419***
Time*Time 0.00279*** 0.00292*** -0.37499D-04 0.00257***
Time*Land 0.01333*** -0.00035 -0.00822*** -0.00910***
Time*Capital -0.00062** 0.00025 -0.00891*** 0.01332***
Time*Labour 0.00679*** -0.27939D-04 0.01045*** 0.01299***
Time*Materials -0.01568*** -0.01045*** 0.00430*** -0.00170
Number of observations / average group size 28 114 / 5.1 12 476 / 5.7 4320 / 6.1 5875 / 5.9
R-squared / R-bar squared 0.8662 / 0.8655 0.8296 / 0.8277 0.8838 / 0.8807 0.8884 / 0.8866
Rho squared (residual variation) 0.4201 0.4684 0.5001 0.3723
R-squared (within groups var) 0.8484 0.7986 0.8343 0.8574
Hausman Test 94.67*** 74.35*** 62.02*** 69.68***
Note: *significant at 10%, **significant at 5%, ***significant at 1%.
Source: Estimations.
Table A D.6.9. French crop farms: Elasticities for classes
LCM panel translog reduced model, 1990 to 2013
Wald procedure based on delta method at sample means
Total output Class 1 Class 2 Class 3 Class 4
Land 0.12754*** 0.13229*** 0.14806*** 0.33978***
Capital 0.13671*** 0.08667*** 0.21802*** -0.03932***
Labour 0.30879*** 0.27994*** 0.25229*** 0.24037***
Materials 0.45103*** 0.64898*** 0.35401*** 0.42303***
Returns-to-scale 1.02408*** 1.14788*** 0.97238*** 0.96387***
Note: *significant at 10%, **significant at 5%, ***significant at 1%.
Source: Estimations.

66 TAD/CA/APM/WP(2020)2/ANN/FINAL
DRIVERS OF FARM PERFORMANCE Unclassified
Table A D.6.10. French crop farms: Class identification - mean values indices
Mean values1, 1989 to 2016
Class 1: Medium productive (55.4%)
Class 2: Least productive (24.6%)
Class 3: Medium productive (8.5%)
Class 4: Most productive (11.6%)
Index 1 - Structure -0.2063 0.5520 0.6725 -0.6792
Index 2 - Environmental sustainability 0.3089 -0.4800 -1.7127 0.8004
Index 3 – Innovation-cooperation-commercialisation
0.3190 -0.9968 0.0315 0.5670
Index 4 - Technology -0.1115 -0.1970 1.7380 -0.3260
Index 5 - Diversity -0.0213 -0.3091 1.1205 -0.0659
Index 6 - Individual -0.1584 -0.2213 -0.3049 1.4519
Index 7 - Location -0.2174 0.5814 -0.1562 -0.0795
Index 8 - Household -0.0584 0.0550 -0.1499 0.2729
Index 9 - Financial 0.2867 -0.4807 -0.1014 -0.2765
Note: 1. At class means, scaled values.
Source: Estimations.

TAD/CA/APM/WP(2020)2/ANN/FINAL 67
DRIVERS OF FARM PERFORMANCE Unclassified
7. Hungary
7.1. Hungarian crop farms
Table A D.7.1. Hungarian crop farms: Descriptive statistics
Sample 2001 to 2014
Note: 1- Values are per year. 2- Gross value of production for output as supplied by national agency.
Full sample (n = 14 128)
1st year (2001, n = 942)
Final year (2014, n = 1 006)
Statistical measure Mean [Min; Max]
Mean [Min; Max]
Mean [Min; Max]
Variable 1
Crop output (EUR) 2 104 328 [140; 12 156 212]
46 264 [613; 1 205 972]
381 160 [376; 12 156 212]
Land (ha) 238 [0; 8 796]
214 [2; 5 736]
225 [3; 4 608]
Capital depreciation (EUR) 5 531 [0; 634 458]
2 605 [0; 82 340]
6 716 [0; 203 782]
Chemicals Cost (EUR) 13 208 [0; 1 306 577]
5 474 [0; 116 495]
49 125 [0; 1 306 577]
Materials (EUR) 16 211 [11; 12 474 445]
9 252 [11; 283 371]
53 895 [509; 1 282 527]
Hired labour (hour) 7 520 [0; 705 414]
6 795 [0; 323 901]
6 939 [0; 279 423]
Family labour (hour) 1 720 [0; 12 100]
1 468 [0; 9 000]
1 823 [0; 11 086]
Organic (0-1 probability) 0.1966 [0; 1]
0.0138 [0; 1]
0.0109 [0; 1]
Total assets (EUR) 69 844 [0; 7 723 231]
24 395 [0; 799 376]
103 386 [0; 3 608 561]
Age (years) 52.4 [19; 99]
48.8 [21; 88]
56.5 [21; 89]
Less-Favoured-Area (0-1 probability)
0.0223 [0; 1]
0 [0; 0]
0.0626 [0; 1]

68 TAD/CA/APM/WP(2020)2/ANN/FINAL
DRIVERS OF FARM PERFORMANCE Unclassified
Table A D.7.2. Hungarian crop farms: Latent class estimates
LCM panel translog reduced model, 2001 to 2014
Total crop output Class 1 Class 2 Class 3
constant 0.6515*** 1.9236*** 4.0176***
Land -0.0635*** -0.0453 0.7925***
Capital -0.0006 -0.0198 -0.0471***
Chemicals -0.2484*** 0.7313*** 0.2847***
Materials 1.5565*** 0.7313*** 0.2847***
Labour 0.1029*** 0.2895*** 0.0259
Land*Land 0.0239*** 0.0186*** -0.0234***
Capital*Capital 0.0058*** 0.0048*** 0.0066***
Chemicals*Chemicals 0.0359*** 0.0245*** 0.0158***
Materials*Materials -0.0707*** -0.0273*** -0.0067***
Labour*Labour -0.0034 -0.0109** -0.667e-04
Time -0.0401*** -0.0951*** -0.0536***
Time*Time 0.0027*** 0.0032*** 0.0019***
Time*Land 0.0051** -0.0031 -0.0284***
Time*Capital -0.0063*** -0.601e-04 0.0015**
Time*Chemicals -0.0062*** -0.0059* 0.0103***
Time*Materials 0.0116*** 0.0202*** 0.0168***
Time*Labour 0.0028 -0.0109** -0.0054***
Sigma 0.3098*** 0.5193*** 0.2839***
Class Membership Vector
Constant -1.3229*** -1.3026*** ---
Index 1 - Structure 0.0004*** 0.0002* ---
Index 2 - Environmental sustainability -0.0028** -0.0003 ---
Index 3 – Innovation-cooperation-commercialisation -0.0026 -0.0289* ---
Index 4 - Technology 0.0023 0.0089*** ---
Index 5 - Diversity 1.1369*** 1.0216*** ---
Index 6 - Individual -0.0156 0.0375** ---
Index 7 - Location -0.0659 -0.9083* ---
Log-Likelihood Function -5737.618
Inf.Cr.AIC / AIC/N 11621 / 0.823
Note: 1- *significant at 10%, **significant at 5%, ***significant at 1%.
Source: Estimations.

TAD/CA/APM/WP(2020)2/ANN/FINAL 69
DRIVERS OF FARM PERFORMANCE Unclassified
Table A D.7.3. Hungarian crop farms: Full production function estimates
Fixed-effects panel translog model per class, 2001 to 2014
Total crop output Class 1 Class 2 Class 3
Land 0.3941*** 0.3035** 0.6251***
Capital -0.0665 0.0627 -0.0246
Chemicals -0.2335** 0.2665** 0.0735
Materials 0.7856*** 0.3678** 0.0683
Labour 0.1178 0.0658 0.1201*
Land*Land 0.0738*** 0.0449*** 0.0118
Capital*Capital 0.0026 0.0075* 0.0033**
Chemicals*Chemicals 0.0353*** 0.0259*** 0.0197***
Materials*Materials -0.0015 0.0179 0.0506***
Labour*Labour 0.0221*** 0.0395*** 0.0039
Land*Capital -0.0187*** -0.0299* -0.0119*
Land*Chemicals -0.0064 0.0323 0.0086
Land*Materials -0.0424** -0.0239 -0.0427**
Land*Labour -0.0237* -0.0362 0.0247*
Capital*Chemicals 0.0059 0.0129 -0.0069
Capital*Materials 0.0055 -0.0026 0.0173***
Capital*Labour 0.0078 -0.0105 -0.0043
Chemicals*Materials -0.0099 -0.0409* -0.0381***
Chemicals*Labour -0.0023 -0.0288 0.0201
Materials*Labour -0.0321* -0.0132 -0.0466***
Time -0.0192 -0.1904*** -0.0484***
Time*Time 0.0027*** 0.0036*** 0.0014***
Time*Land -0.0032 -0.0167*** -0.0293***
Time*Capital -0.0043*** -0.0009 0.0006
Time*Chemicals -0.0013 0.0028 0.0084***
Time*Materials 0.0121*** 0.0284*** 0.0179***
Time*Labour -0.0016 -0.0016 -0.0028
Number of observations / average group size 3933 / 4.71 3057 / 4.41 7138 / 4.47
R-squared / R-bar squared 0.9608 / 0.9498 0.9170 / 0.8915 0.9774 / 0.9708
Rho squared (residual variation) 0.4842 0.4939 0.4294
R-squared (within groups var) 0.7774 0.5620 0.7949
Hausman Test 113.04*** 51.44*** 91.66***
Note: *significant at 10%, **significant at 5%, ***significant at 1%.
Source: Estimations.

70 TAD/CA/APM/WP(2020)2/ANN/FINAL
DRIVERS OF FARM PERFORMANCE Unclassified
Table A D.7.4. Hungarian crop farms: Elasticities for classes
LCM panel translog reduced model, 2001 to 2014
Wald procedure based on delta method at sample means
Total crop output Class 1 Class 2 Class 3
Land 0.0778*** 0.0851*** 0.0754***
Capital 0.0072 0.0114** 0.0058
Chemicals 0.0166*** 0.0181*** 0.0378***
Materials 0.8759*** 0.9043*** 0.8453***
Labour 0.1591*** 0.1569*** 0.1569***
Returns-to-scale 1.1366*** 1.1757*** 1.1212***
Note: *significant at 10%, **significant at 5%, ***significant at 1%.
Source: Estimations.
Table A D.7.5. Hungarian crop farms: Class identification - mean values indices
Mean values1
Class 1: Most productive (28%)
Class 2: Least productive (22%)
Class 3: Medium productive (50%)
Index 1 - Structure 1.5599 0.1918 -0.9417
Index 2 - Environmental sustainability -2.5095 -0.0209 1.3831
Index 3 – Innovation-cooperation-commercialisation -0.9220 -0.6861 0.8020
Index 4 - Technology 0.2543 1.1934 -0.6512
Index 5 - Diversity 0.6970 0.6940 0.6380
Index 6 - Individual -0.0450 1.5820 0.3370
Index 7 - Location 0.0146 -0.0160 -0.0011
Note: 1. At class means, scaled values.
Source: Estimations.

TAD/CA/APM/WP(2020)2/ANN/FINAL 71
DRIVERS OF FARM PERFORMANCE Unclassified
8. Ireland
8.1. Irish dairy farms
Table A D.8.1. Irish dairy farms: Descriptive statistics
Sample 2010 to 2018
Note: AWU: Annual Work Unit. LU per ha: Livestock Unit per hectare. 1. Values are per year.
Full sample (n = 2 792)
1st year (2010, n = 225)
Final year (2018, n = 311)
Statistical measure Mean [Min; Max]
Mean [Min; Max]
Mean [Min; Max]
Variable1
Milk output (EUR) 122 259 [12 817; 500 435]
139 377 [10 244; 513 060]
231 967 [13 125; 892 566]
Total output (EUR) 137 504 [14 373; 521 384]
163 225 [13 694; 569 462]
251 534 [14 388; 922 016]
Dairy cows (number) 49.4 [1.5; 149]
65.6 [7; 224]
84.1 [10; 291.5]
Capital depreciation (EUR) 11 022 [0; 50 431]
13 795 [0; 59 402.47]
20 562 [0; 84 977]
Fodder cost (EUR) 45 430 [2 716; 246 930]
10 425 [ 428; 44 296]
16 984 [0; 65 919]
Materials (EUR) 8 909 [835; 36 128]
10 961 [1 399; 52 333]
15 587 [1 614; 69 064]
Hired labour (AWU) 0.0674 [0.0078; 11.4654]
0.0858 [0.0287; 11.4654]
0.1205 [0.0384; 0.3861]
Family labour (AWU) 1.3932 [0.1622; 212.5346]
1.5912 [0.5313; 212.5346]
1.6374 [0.5216; 5.2439]
Land (ha) 49.5 [8.3; 137.6]
61.6 [8.3; 181.8]
71.1 [8.3; 226.3]
Stocking density (LU per ha) 1.75 [0.49; 3.90]
1.72 [0.49; 3.10]
1.97 [0.60; 3.90]
Chemicals cost (EUR) 10 091 [0; 43 531]
10 425 [428; 44 296]
16 984 [0; 65 919]
Organic (0-1 probability) 0.111 [0; 1]
0 [0; 0]
0.123 [0; 1]
Total assets (EUR) 992 392 [131 239; 3 569 465]
1 261 824 [131 519; 3 546 527]
156 8211 [168 857; 5 768 208]
Age (years) 53.3 [18; 82]
49.5 [18; 76]
53.0 [23; 76]

72 TAD/CA/APM/WP(2020)2/ANN/FINAL
DRIVERS OF FARM PERFORMANCE Unclassified
Table A D.8.2. Irish dairy farms: Latent class estimates
LCM panel translog reduced model, 2010 to 2018
Total output Class 1 Class 2 Class 3
Constant 6.11099*** 2.84268 -0.39910
Land 0.36366*** 0.34778 0.42146***
Dairy cows -0.38831*** -0.12801 -0.66565***
Capital -0.00589 -0.07686 -0.05077**
Labour 0.23000*** 0.40959** 0.01058
Materials 0.48182** 1.09205 1.58995***
Land*Land -0.03036** -0.00592 -0.03583**
Dairy cows*Dairy cows 0.08293*** 0.07532 0.13408***
Capital*Capital 0.00215** 0.00969 0.00442***
Labour*Labour -0.06550*** -0.14788 -0.03183
Materials*Materials -0.00349 -0.04539 -0.04775***
Time -0.07108* -0.39531*** 0.11204*
Time*Time -0.00054 -0.00281 -0.00076
Time*Land 0.00300 -0.06301*** -0.00784
Time*Dairy cows -0.00915 0.01018 0.01010
Time*Capital -0.00028 -0.01481 0.00824***
Time*Labour -0.00627 -0.02779 -0.00305
Time*Materials 0.00978* 0.07090*** -0.01726**
Sigma 0.12208*** 0.21460*** 0.14116***
Class Membership Vector
Constant 0.20947 -6.20598***
Index 1 - Structure -0.37888 -7.81174***
Index 2 - Environmental sustainability 0.95364*** -1.38534***
Index 3 – Innovation-cooperation-commercialisation 2.92227*** -2.07044***
Index 4 - Technology -1.73900*** -0.16320
Index 5 - Diversity -0.36929 2.76504***
Index 6 - Individual -1.73184*** 0.41169
Index 7 - Location -2.50310*** 0.05743
Index 8 - Household 0.62951*** -0.23566
Index 9 - Financial 1.00642*** -3.48956***
Log-Likelihood Function 1484.26656
Inf.Cr.AIC / AIC/N -2814.5 / -1.008
Note: *significant at 10%, **significant at 5%, ***significant at 1%.
Source: Estimations.

TAD/CA/APM/WP(2020)2/ANN/FINAL 73
DRIVERS OF FARM PERFORMANCE Unclassified
Table A D.8.3. Irish dairy farms: Full production function estimates
Fixed-effects panel translog model per class, 2010 to 2018
Total output Class 1 Class 2 Class 3
Land 0.90962* 1.42579 -0.58374
Dairy Cows 0.29325 4.67832** 0.95185*
Capital 0.09438 -2.19817* -0.30232
Labour 0.12230 -0.42045 0.56362
Materials -0.60449 -3.33119* -0.03965
Land*Land 0.03452 -0.15427 0.23895***
Dairy Cows*Dairy Cows 0.06075*** 0.33023* 0.09889***
Capital*Capital 0.00744*** 0.04011* -0.00091
Labour*Labour -0.03711 0.00626 0.14911**
Materials*Materials 0.06688* 0.19939 0.02960
Land*Dairy Cows 0.00907 0.18961 -0.19093***
Land*Capital 0.02002 -0.04894 0.02701
Land*Labour -0.11625** -0.06328 -0.05841
Land*Materials -0.00352 0.05228 -0.06414
Dairy Cows*Capital -0.05800 -0.09988 -0.00964
Dairy Cows*Labour -0.00508 -0.63605** -0.05857
Dairy Cows*Materials 0.00949 0.18034 -0.04200
Capital*Labour -0.00631 0.20501 0.02360
Capital*Materials -0.02349 -0.28667 -0.01265
Labour*Materials 0.01360 0.20497 -0.01067
Time -0.01788 -0.19822 0.00516
Time*Time 0.74152D-05 -0.00203 -0.00144**
Time*Land 0.00559 0.01938 0.00379
Time*Dairy Cows 0.44201D-05 -0.01372 -0.00146
Time*Capital 0.00796*** -0.02234** 0.00637***
Time*Labour -0.00155 -0.03880** 0.00353
Time*Materials -0.00613 0.03924 -0.00455
Number of observations / average group size 1429 / 5.25 220 / 2.16 1143 / 4.20
R-squared / R-bar squared 0.9737 / 0.9668 0.9908 / 0.9779 0.9765 / 0.9682
Rho squared (residual variation) 0.7507 0.9445 0.8313
R-squared (within groups var) 0.7201 0.6362 0.5563
Hausman Test 102.73*** 38.81* 120.70***
Note: *significant at 10%, **significant at 5%, ***significant at 1%.
Source: Estimations.

74 TAD/CA/APM/WP(2020)2/ANN/FINAL
DRIVERS OF FARM PERFORMANCE Unclassified
Table A D.8.4. Irish dairy farms: Elasticities for classes
LCM panel translog reduced model, 2010 to 2018
Wald procedure based on delta method at sample means
Total output Class 1 Class 2 Class 3
Land 0.11815*** 0.00915 0.10943***
Dairy cows 0.29670*** 0.51616*** 0.40036***
Capital 0.03407*** 0.02464 0.07057***
Labour 0.12343*** 0.16154** 0.02562
Materials 0.45206*** 0.42782*** 0.45304***
Returns-to-scale 1.02441*** 1.13931*** 1.05903***
Note: *significant at 10%, **significant at 5%, ***significant at 1%.
Source: Estimations.
Table A D.8.5. Irish dairy farms: Class identification - mean values indices
Mean values1, 2010 to 2018
Class 1: Most productive (51.2%)
Class 2: Least productive (7.9%)
Class 3: Medium productive (40.9%)
Index 1 - Structure -0.3613 -0.2116 0.4924
Index 2 - Environmental sustainability -0.2359 -0.2308 0.3394
Index 3 – Innovation-cooperation-commercialisation 0.9107 -0.9886 -0.9482
Index 4 - Technology 0.0459 -0.6824 0.0739
Index 5 - Diversity -0.0172 0.1109 0.0002
Index 6 - Individual -0.2656 0.4894 0.2378
Index 7 - Location -0.6795 0.8257 0.6905
Index 8 - Household -0.1086 0.2267 0.0921
Index 9 - Financial 0.3499 -0.3880 -0.3628
Note: 1. At class means, scaled values.
Source: Estimations.

TAD/CA/APM/WP(2020)2/ANN/FINAL 75
DRIVERS OF FARM PERFORMANCE Unclassified
8.2. Irish crop farms
Table A D.8.6. Irish crop farms: Descriptive statistics
Sample 2010 to 2018
Note: AWU: Annual Work Unit. 1. Values are per year.
Full sample (n = 749)
1st year (2010, n = 97)
Final year (2018, n = 67)
Statistical measure Mean [Min; Max]
Mean [Min; Max]
Mean [Min; Max]
Variable1
Crop output (EUR) 81 837 [2 400; 1 115 282]
84 803 [2 400; 975 353]
84 295 [4 865; 458 096]
Total output (EUR) 144 548 [11 875; 1 397 538]
143 615 [18 987; 975 353]
143 283 [17 729; 648 165]
Land (ha) 83.7 [9.7; 738.5]
87.5 [10.9; 437.5]
76.4 [10.9; 244.8]
Capital depreciation (EUR) 12 849 [0; 121 311]
12 287 [0; 118 234]
13 197 [0; 83 716]
Materials (EUR) 5 194 [270; 34 096]
5 113 [945; 29 096]
5 214 [380; 14 369]
Chemicals cost (EUR) 27 673 [0; 398 346]
24 165 [0; 243 605]
24 092 [0; 119 414]
Hired labour (AWU) 0.1699 [0.0013; 0.9129]
0.1518 [0.0013; 0.9129]
0.2869 [0.0116; 0.8957]
Family labour (AWU) 1.1195 [0.0087; 6.0171]
1.1947 [0.0087; 6.0171]
0.9461 [0.0384; 2.9543]
Organic (0-1 probability) 0.119 [0; 1]
0.111 [0; 1]
0.144 [0; 1]
Total assets (EUR) 1 563 942 [0; 7 947 237.3]
1 555 967 [200 000; 7 947 237]
1 493 647 [0; 4 891 323.2]
Age (years) 58 [18; 85]
53 [18; 78]
59 [29; 85]

76 TAD/CA/APM/WP(2020)2/ANN/FINAL
DRIVERS OF FARM PERFORMANCE Unclassified
Table A D.8.7. Irish crop farms: Latent class estimates
LCM panel translog reduced model, 2010 to 2018
Total output Class 1 Class 2 Class 3
constant 13.6229*** 6.45735*** 11.5147***
Land 0.07281 0.29865 0.40351**
Capital -1.24204*** -0.02896 0.05966
Labour -0.02376 -0.07535 -0.04244
Chemicals -0.08932 -0.53751*** -0.41493***
Material 0.30370 0.69701* -0.65538**
Land*Land 0.01224 -0.00121 0.00421
Capital*Capital 0.08708*** 0.00477*** 0.00067
Labour*Labour 0.03015 -0.00485 -0.06406**
Chemicals*Chemicals 0.01137** 0.05488*** 0.04590***
Material*Material -0.01583 -0.03069 0.04291**
Time -0.00288 0.04599 0.04991
Time*Time 0.00136 0.00726*** 0.00720***
Time*Land 0.01743 0.00584 -0.00769
Time*Capital -0.01720* -0.00073 -0.00724**
Time*Labour 0.00036 0.01437** -0.00171
Time*Chemicals -0.00188 0.00807 -0.00093
Time*Material 0.01110 -0.02683** -0.00237
Sigma 0.14864*** 0.14673*** 0.10067***
Class Membership Vector
Constant -0.63170 -1.78672*** ---
Index 1 - Structure 0.91227* 1.62607*** ---
Index 2 - Environmental sustainability 0.79523** -2.31788*** ---
Index 3 – Innovation-cooperation-commercialisation 0.87485** 0.36841 ---
Index 4 - Technology 0.19229 0.37484 ---
Index 5 - Diversity -0.10166 2.07052*** ---
Index 6 - Individual -0.05441 0.48063* ---
Index 7 - Location 0.86586*** 0.67839** ---
Index 8 - Household -0.04514 0.67113** ---
Index 9 - Financial 1.91795*** -5.53917*** ---
Log-Likelihood Function 305.93374
Inf.Cr.AIC / AIC/N -457.9 / -0.611
Note: *significant at 10%, **significant at 5%, ***significant at 1%.
Source: Estimations.

TAD/CA/APM/WP(2020)2/ANN/FINAL 77
DRIVERS OF FARM PERFORMANCE Unclassified
Table A D.8.8. Irish crop farms: Full production function estimates
Fixed-effects panel translog model per class, 2010 to 2018
Total output Class 1 Class 2 Class 3
Land 0.22869 -0.08439 -2.47434**
Capital -0.72858 -0.06884 -0.11378
Labour -1.27454 -0.07673 1.49229***
Chemicals -1.28782 1.20839* -0.50346
Material 1.39346 -0.90149 0.56284
Land*Land 0.22283 -0.04819 -0.00389
Capital*Capital -0.01946 0.01033 -0.04580**
Labour*Labour -0.00681 0.00164 -0.01245
Chemicals*Chemicals -0.16615 -0.00643 -0.03951
Material*Material -0.10955 0.03154 -0.03693
Land*Capital 0.04215 -0.11339 -0.09993
Land*Labour -0.05682 -0.04708* -0.02681
Land*Chemicals -0.14634 0.09745 0.34029**
Land*Material -0.16495 -0.07485 0.09447
Capital*Labour 0.00783 0.00198 0.02826
Capital*Chemicals 0.04672 0.04257 0.04669
Capital*Material -0.07409 0.02980 -0.00583
Labour*Chemicals 0.16732 0.02498 -0.11362**
Labour*Material 0.04574 0.00354 0.04642
Chemicals*Material 0.20176* -0.10274 -0.02400
Time -0.09186 -0.11408 0.15778**
Time*Time 0.00213 0.00166 0.00148
Time*Land 0.01545 -0.01700 0.00844
Time*Capital 0.00435 0.00593 0.00339
Time*Labour -0.00388 -0.00132 -0.00182
Time*Chemicals -0.00860 -0.00166 -0.01294
Time*Material 0.00327 0.01624* -0.01948
Number of observations / average group size 249 / 4.02 255 / 3.49 245 / 3.10
R-squared / R-bar squared 0.9808 / 0.9702 0.9871 / 0.9788 0.9867 / 0.9767
Rho squared (residual variation) 0.8631 0.9526 0.9388
R-squared (within groups var) 0.5419 0.5821 0.4839
Hausman Test 37.47* 37.39* 41.38**
Note: *significant at 10%, **significant at 5%, ***significant at 1%.
Source: Estimations.

78 TAD/CA/APM/WP(2020)2/ANN/FINAL
DRIVERS OF FARM PERFORMANCE Unclassified
Table A D.8.9. Irish crop farms: Elasticities for classes
LCM panel translog reduced model, 2010 to 2018
Wald procedure based on delta method at sample means
Total dairy output Class 1 Class 2 Class 3
Land 0.26851*** 0.31785*** 0.40435***
Capital 0.69730*** 0.02119 0.03204
Labour 0.56769 0.07509 1.15345***
Chemicals 0.08785 0.55654*** -0.40557***
Material 0.00802 0.03492 0.21804**
Returns-to-scale 1.62936 1.00559*** 1.40232***
Note: *significant at 10%, **significant at 5%, ***significant at 1%.
Source: Estimations.
Table A D.8.10. Irish crop farms: Class identification - mean values indices
Mean values1, 2010 to 2018
Class 1: Most productive (33.2%)
Class 2: Least productive (34.0%)
Class 3: Medium productive (32.7%)
Index 1 - Structure -0.2855 0.2733 0.0058
Index 2 - Environmental sustainability -0.1736 -0.3055 0.4944
Index 3 – Innovation-cooperation-commercialisation 0.1232 -0.0797 -0.0422
Index 4 - Technology 0.5312 -0.2474 -0.2824
Index 5 - Diversity -0.3638 0.8674 -0.5331
Index 6 - Individual -0.4330 0.4983 -0.0785
Index 7 - Location 0.4585 0.0525 -0.5207
Index 8 - Household -0.6109 0.6999 -0.1077
Index 9 - Financial 0.6632 -0.4108 -0.2464
Note: 1. At class means, scaled values.
Source: Estimations.

TAD/CA/APM/WP(2020)2/ANN/FINAL 79
DRIVERS OF FARM PERFORMANCE Unclassified
8.3. Irish cattle rearing farms
Table A.B.8.11. Irish cattle rearing farms: Descriptive statistics
Sample 2010 to 2018
Note: AWU: Annual Work Unit. LU per ha: Livestock Unit per hectare. 1. Values are per year.
Full sample (n = 1 489)
1st year (2010, n = 164)
Final year (2018, n = 164)
Statistical measure Mean [Min; Max]
Mean [Min; Max]
Mean [Min; Max]
Variable1
Livestock output (EUR) 27 064 [0; 254 285]
19 509 [0; 176 744]
28 776 [1 464; 254 285]
Total output (EUR) 44 857 [5 528; 381 196]
39 920 [7 586; 306 647]
44 714 [5 915; 321 026]
Land (ha) 45.3 [8.5; 589.2]
47.1 [11.1; 242.8]
42.0 [11.5; 214]
Livestock Units (number) 43.97 [9.15; 389.82]
43.09 [13.49; 389.82]
43.49 [11.13; 373.47]
Capital depreciation (EUR) 4 655 [0; 47 851]
4 602 [0; 33 611]
5 228 [0; 47 851]
Hired labour (AWU) 0.1435 [0.0001; 0.3869]
0.1502 [0.0239; 0.3669]
0.1279 [0.0359; 0.2862]
Family labour (AWU) 0.8949 [0.0009; 2.4131]
0.9181 [0.1461; 2.2431]
0.8688 [0.2441; 1.9438]
Materials (EUR) 2 960 [48; 24 803]
2 666 [110; 24 803]
3 221 [202; 14 623]
Stocking density (LU per ha) 1.03 [0.05; 3.85]
0.97 [0.20; 2.40]
1.09 [0.02; 2.19]
Organic (0-1 probability) 0.115 [0; 1]
0.113 [0; 1]
0.113 [0; 1]
Total assets (EUR) 709 173 [21 850; 6 825 339]
733 086 [101 071; 6 805 658]
668 022 [100 312; 3 832 397]
Age (years) 55 [18; 86]
52 [18; 82]
58 [30; 86]

80 TAD/CA/APM/WP(2020)2/ANN/FINAL
DRIVERS OF FARM PERFORMANCE Unclassified
Table A D.8.12. Irish cattle rearing farms: Latent class estimates
LCM panel translog reduced model, 2010 to 2018
Total output Class 1 Class 2 Class 3
Constant 5.75547*** 5.67330 12.9448***
Land 1.14295*** -0.73241 0.28561***
Livestock 0.04675 1.82019** 0.64032***
Capital -0.41828*** -0.06402 -0.07672***
Labour -0.04780 0.17938 0.02040
Material 0.27813 -0.11672 -1.34931***
Land*Land -0.10378** 0.16937 -0.02334**
Livestock*Livestock 0.04236 -0.22530** -0.00440
Capital*Capital 0.02761*** 0.02240*** 0.00788***
Labour*Labour 0.05845 -0.08102 -0.02491
Material*Material 0.00186 0.01469 0.08017***
Time 0.53960*** -0.15256 -0.01233
Time*Time -0.00285 -0.02068*** -0.00143
Time*Land -0.03937*** -0.03195 0.00272
Time*Livestock 0.06814*** -0.00270 -0.00533
Time*Capital 0.00567 -0.00883 0.00245
Time*Labour 0.02052 -0.03537 -0.00853
Time*Material -0.06683*** 0.05895* 0.00399
Sigma 0.15997*** 0.28909*** 0.17970***
Class Membership Vector
Constant -1.87983*** -3.28738*** ---
Index 1 – Structure -0.16433 1.04967** ---
Index 2 – Environmental sustainability 2.16375*** -0.67396** ---
Index 3 – Innovation-cooperation-commercialisation 0.93395*** -0.36004 ---
Index 4 – Technology -0.76858*** -0.80353** ---
Index 5 - Diversity 0.10481 -0.78114*** ---
Index 6 - Individual -0.06581 0.85035*** ---
Index 7 - Location -0.32005* 0.14516 ---
Index 8 - Household -0.84966*** 0.43941 ---
Index 9 - Financial 1.15679** 4.27208*** ---
Log-Likelihood Function 251.30958
Inf.Cr.AIC / AIC/N -348.6 / -0.234
Note: *significant at 10%, **significant at 5%, ***significant at 1%.
Source: Estimations.

TAD/CA/APM/WP(2020)2/ANN/FINAL 81
DRIVERS OF FARM PERFORMANCE Unclassified
Table A D.8.13. Irish cattle rearing farms: Full production function estimates
Fixed-effects panel translog model per class, 2010 to 2018
Total output Class 1 Class 2 Class 3
Land -0.55319 -0.58056 -1.04288*
Livestock 0.59503 1.50675** 1.53311*
Capital -0.17807 0.26154** 0.36397***
Labour 0.10319 -0.44832 0.38964
Material 0.45665 -1.00148* -1.71388**
Land*Land 0.23219 0.02235 0.03229
Livestock*Livestock 0.01869 -0.18119** -0.01910
Capital*Capital -0.00308 0.00636* -0.00095
Labour*Labour 0.08065 0.02903 0.01850
Material*Material -0.02318 0.07067 0.11835**
Land*Livestock -0.21159 0.01774 -0.06546
Land*Capital -0.13646 -0.01836 0.01692
Land*Labour 0.06799 0.07995 0.11097
Land*Material -0.18713 0.05620 0.06520
Livestock*Capital 0.11734 0.04939 0.04679
Livestock*Labour -0.06908 -0.04685 -0.11098
Livestock*Material 0.07697 -0.04994 0.02825
Capital*Labour 0.02778 -0.04876*** -0.06160***
Capital*Material 0.11262 -0.03336 -0.03152
Labour*Material -0.07370 0.07907 -0.04647
Time 0.19427** -0.03633 -0.06979
Time*Time -0.00302* -0.00329*** -0.00171*
Time*Land -0.01136 -0.00598 -0.00029
Time*Livestock 0.03536* 0.01272 0.00077
Time*Capital 0.00916 0.00400** 0.00508***
Time*Labour 0.01462 -0.00255 -0.00044
Time*Material -0.03326** 0.00410 0.00698
Number of observations / average group size 397 / 2.48 137 / 3.42 955 / 3.28
R-squared / R-bar squared 0.9818 / 0.9657 0.9547 / 0.9338 0.9537 / 0.9306
Rho squared (residual variation) 0.9115 0.8514 0.7603
R-squared (within groups var) 0.2364 0.3171 0.3672
Hausman Test 57.69*** 115.47*** 75.09***
Note: *significant at 10%, **significant at 5%, ***significant at 1%.
Source: Estimations.
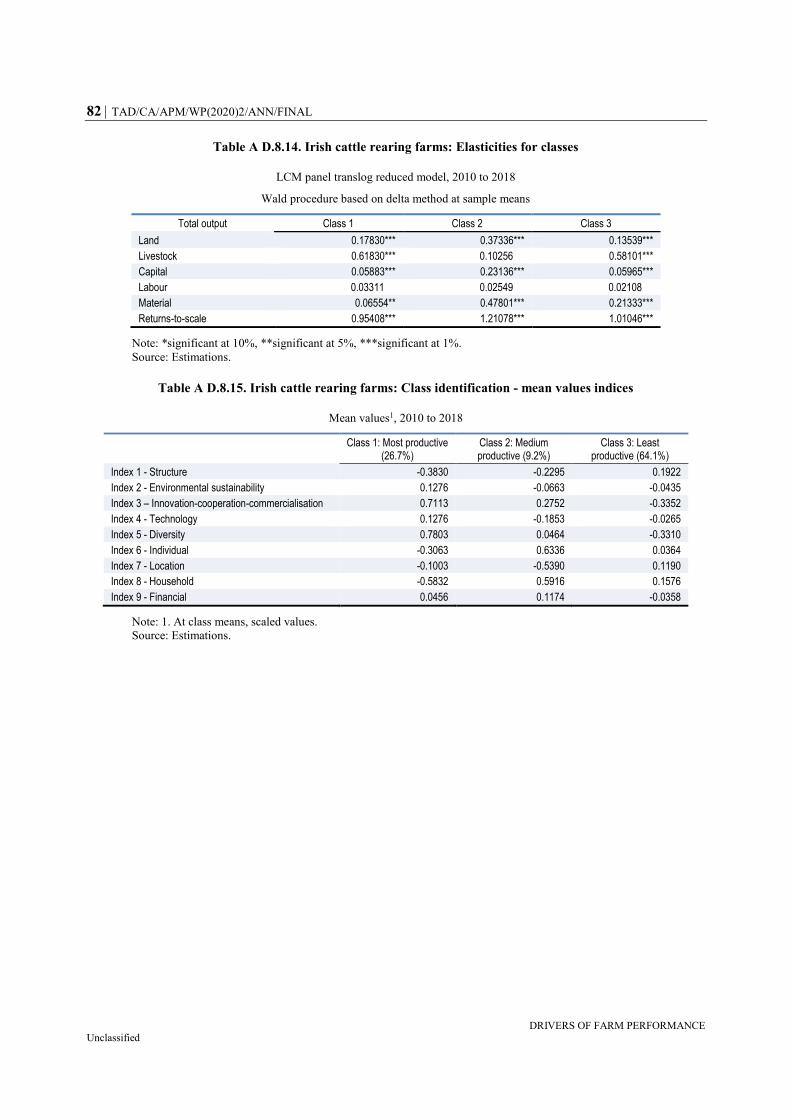
82 TAD/CA/APM/WP(2020)2/ANN/FINAL
DRIVERS OF FARM PERFORMANCE Unclassified
Table A D.8.14. Irish cattle rearing farms: Elasticities for classes
LCM panel translog reduced model, 2010 to 2018
Wald procedure based on delta method at sample means
Total output Class 1 Class 2 Class 3
Land 0.17830*** 0.37336*** 0.13539***
Livestock 0.61830*** 0.10256 0.58101***
Capital 0.05883*** 0.23136*** 0.05965***
Labour 0.03311 0.02549 0.02108
Material 0.06554** 0.47801*** 0.21333***
Returns-to-scale 0.95408*** 1.21078*** 1.01046***
Note: *significant at 10%, **significant at 5%, ***significant at 1%.
Source: Estimations.
Table A D.8.15. Irish cattle rearing farms: Class identification - mean values indices
Mean values1, 2010 to 2018
Class 1: Most productive (26.7%)
Class 2: Medium productive (9.2%)
Class 3: Least productive (64.1%)
Index 1 - Structure -0.3830 -0.2295 0.1922
Index 2 - Environmental sustainability 0.1276 -0.0663 -0.0435
Index 3 – Innovation-cooperation-commercialisation 0.7113 0.2752 -0.3352
Index 4 - Technology 0.1276 -0.1853 -0.0265
Index 5 - Diversity 0.7803 0.0464 -0.3310
Index 6 - Individual -0.3063 0.6336 0.0364
Index 7 - Location -0.1003 -0.5390 0.1190
Index 8 - Household -0.5832 0.5916 0.1576
Index 9 - Financial 0.0456 0.1174 -0.0358
Note: 1. At class means, scaled values.
Source: Estimations.

TAD/CA/APM/WP(2020)2/ANN/FINAL 83
DRIVERS OF FARM PERFORMANCE Unclassified
8.4. Irish cattle other farms
Table A.B.8.16. Irish cattle other farms: Descriptive statistics
Sample 2010 to 2018
Note: AWU: Annual Work Unit. LU per ha: Livestock Unit per hectare. 1. Values are per year.
Full sample (n = 1 977)
1st year (2010, n = 235)
Final year (2018, n = 214)
Statistical measure Mean [Min; Max]
Mean [Min; Max]
Mean [Min; Max]
Variable1
Livestock output (EUR) 43 975 [0; 534 913]
29 744 [0; 408 102]
50 754 [0; 509 975]
Total output (EUR) 69 770 [62 07; 659 560]
55 911 [7 987; 556 700]
76 531 [11 338; 630 976]
Land (ha) 54.8 [6.9; 242.8]
53.8 [11.4; 242.8]
56.6 [11.4; 206]
Livestock Units (number) 68.3 [2.4; 456.1]
63.3 [13.1; 351.7]
72.4 [9.5; 456.1]
Capital depreciation (EUR) 6 167 [0; 52 303]
5 846 [0; 52 303]
7 207 [0; 50 146.02]
Hired labour (AWU) 0.1238 [0.0033; 0.3435]
0.1239 [0.0181; 0.3319]
0.1089 [0.0189; 0.3159]
Family labour (AWU) 1.0157 [0.0267; 2.8165]
1.0416 [0.1519; 2.7881]
0.9785 [0.1711; 2.8441]
Materials (EUR) 3 887 [0; 30 485]
3 437 [229; 13 740]
4 373 [235; 23 377]
Stocking density (LU per ha) 1.77 [0.03; 25.06]
1.68 [0.10; 19.19]
1.89 [0.13; 25.06]
Organic (0-1 probability) 0.028 [0; 1]
0.009 [0; 1]
0.032 [0; 1]
Total assets (EUR) 1 046 032 [30 573; 7 115 927]
1 003 669 [36 296; 4 453 496]
1 106 746 [108 607; 7 109 135]
Age (years) 57 [18; 86]
55 [19; 83]
59 [28; 86]

84 TAD/CA/APM/WP(2020)2/ANN/FINAL
DRIVERS OF FARM PERFORMANCE Unclassified
Table A D.8.17. Irish cattle other farms: Latent class estimates
LCM panel translog reduced model, 2010 to 2018
Total output Class 1 Class 2 Class 3
constant 8.92558*** 14.6645*** 18.8410***
Land -0.05217 0.35501 -0.17511
Livestock 0.30033** 0.37869 -0.02883
Capital -0.09342*** 0.05759 0.18121
Labour -0.07958* -0.16520** 0.12464**
Material -0.29859* -1.89314*** -1.97641***
Land*Land 0.01595 -0.06123* 0.01980
Livestock*Livestock 0.00231 -0.00497 0.02288
Capital*Capital 0.01047*** 0.00383 -0.01150
Labour*Labour -0.01407 -0.09087*** -0.05022*
Material*Material 0.03677*** 0.12060*** 0.11542***
Time 0.15656*** 0.01092 0.09989
Time*Time -0.00195 -0.00457** -0.00268
Time*Land -0.00252 0.02088** 0.00648
Time*Livestock 0.01203 0.01488 0.02803***
Time*Capital -0.00320 -0.01387*** 0.00140
Time*Labour 0.00083 0.01793 0.00034
Time*Material -0.01438* 0.00400 -0.02220**
Sigma 0.19052*** 0.24069*** 0.17045***
Class Membership Vector
Constant 2.01772*** -1.80778*** ---
Index 1 - Structure -0.20756 -0.06174 ---
Index 2 - Environmental sustainability -0.00351 1.66802*** ---
Index 3 – Innovation-cooperation-commercialisation
-1.17360*** -1.59740*** ---
Index 4 - Technology 0.02579 -0.01491 ---
Index 5 - Diversity -0.40194** -0.39740** ---
Index 6 - Individual -0.43699*** 0.04577 ---
Index 7 - Location 0.31783** -0.06648 ---
Index 8 - Household 0.72906*** 0.45857** ---
Index 9 - Financial -0.92097*** -5.11626*** ---
Log-Likelihood Function 34.04072
Inf.Cr.AIC / AIC/N 85.9 / 0.043
Note: *significant at 10%, **significant at 5%, ***significant at 1%.
Source: Estimations.

TAD/CA/APM/WP(2020)2/ANN/FINAL 85
DRIVERS OF FARM PERFORMANCE Unclassified
Table A D.8.18. Irish cattle other farms: Full production function estimates
Fixed-effects panel translog model per class, 2010 to 2018
Total output Class 1 Class 2 Class 3
Land 0.40162 -0.15978 -0.07065
Livestock -0.25657 1.56344 -1.01248
Capital 0.13956 -0.54366** 0.77212**
Labour 0.62340 1.98457*** -1.16531*
Material 0.04409 -2.11200*** 0.20531
Land*Land 0.00438 -0.07244* 0.05745**
Livestock*Livestock 0.04109 0.00801 0.08351
Capital*Capital -0.00162 0.00850* -0.01460
Labour*Labour 0.03927 0.04981 -0.01466
Material*Material 0.02590*** 0.11808** 0.09505**
Land*Livestock 0.02501 0.17476** 0.06840*
Land*Capital 0.00155 -0.06402** -0.00107
Land*Labour -0.05620* 0.06053 -0.06578*
Land*Material -0.03494 -0.03521 -0.01285
Livestock*Capital 0.00426 0.03081 0.15096***
Livestock*Labour 0.00818 -0.21828 -0.12153
Livestock*Material 0.05394 0.26198** -0.06107
Capital*Labour -0.01306 0.07052** -0.12107***
Capital*Material -0.02563 -0.01072 0.00924
Labour*Material -0.04498 -0.30484*** 0.14069**
Time 0.09564** 0.09733 0.01490
Time*Time -0.00334*** -0.00443*** -0.00177*
Time*Land 0.00326 0.01254 0.00585
Time*Livestock 0.00257 -0.01668 0.02298***
Time*Capital -0.00280 -0.00906** 0.00655
Time*Labour -0.00500 0.02064** -0.00758
Time*Material -0.00542 0.00488 -0.01618***
Number of observations / average group size 1022 / 3.38 524 / 2.57 431 / 3.48
R-squared / R-bar squared 0.9523 / 0.9297 0.9359 / 0.8856 0.9783 / 0.9666
Rho squared (residual variation) 0.7486 0.8309 0.9275
R-squared (within groups var) 0.3596 0.4107 0.5812
Hausman Test 95.15*** 64.13*** 63.87***
Note: *significant at 10%, **significant at 5%, ***significant at 1%.
Source: Estimations.

86 TAD/CA/APM/WP(2020)2/ANN/FINAL
DRIVERS OF FARM PERFORMANCE Unclassified
Table A D.8.19. Irish cattle other farms: Elasticities for classes
LCM panel translog reduced model, 2010 to 2018
Wald procedure based on delta method at sample means
Total output Class 1 Class 2 Class 3
Land 0.05555*** 0.01974 0.00923
Livestock 0.37527*** 0.42284*** 0.32718***
Capital 0.06221*** 0.04146** 0.02159
Labour 0.07739*** 0.02920 0.09915***
Material 0.36205*** 0.37024*** 0.37778***
Returns-to-scale 0.93247*** 0.88347*** 0.83495***
Note: *significant at 10%, **significant at 5%, ***significant at 1%.
Source: Estimations.
Table A D.8.20. Irish cattle other farms: Class identification - mean values indices
Mean values1, 2010 to 2018
Class 1: Medium productive (51.7%)
Class 2: Least productive (26.5%)
Class 3: Most productive (21.8%)
Index 1 - Structure 0.0570 0.5500 -0.8039
Index 2 - Environmental sustainability 0.0932 0.9124 -1.3301
Index 3 – Innovation-cooperation-commercialisation -0.0244 -0.1157 0.1985
Index 4 - Technology -0.0219 -0.1016 0.1754
Index 5 - Diversity 0.0785 -0.3525 0.2423
Index 6 - Individual -0.1239 0.2398 0.0021
Index 7 - Location 0.1908 0.2119 -0.7101
Index 8 - Household 0.2189 0.1419 -0.6916
Index 9 - Financial -0.0135 -0.0669 0.1134
Note: 1. At class means, scaled values.
Source: Estimations.

TAD/CA/APM/WP(2020)2/ANN/FINAL 87
DRIVERS OF FARM PERFORMANCE Unclassified
8.5. Irish sheep farms
Table A.B.8.21. Irish sheep farms: Descriptive statistics
Sample 2010 to 2018
Note: AWU: Annual Work Unit. LU per ha: Livestock Unit per hectare. 1. Values are per year.
Full sample (n = 1 147)
1st year (2010, n = 124)
Final year (2018, n = 125)
Statistical measure Mean [Min; Max]
Mean [Min; Max]
Mean [Min; Max]
Variable1
Livestock output (EUR) 35 654 [0; 462 936]
27 071 [1 610; 168 216]
37 334.3 [1 207; 199 151]
Total output (EUR) 58 468 [5 549; 583 551]
53 276 [10 339; 251 836]
61 650.91 [10 795; 239 194]
Land (ha) 71.0 [7.9; 1 116.8]
71.7 [7.9; 418]
71.155 [14.16; 1 116.82]
Livestock Units (number) 2 880 [0; 30 879]
63.4 [14.5; 304.2]
65.6 [8.1; 316.7]
Capital depreciation (EUR) 4 926 [0; 38 952]
4 654 [19; 25 752]
5 549 [0; 26 588]
Hired labour (AWU) 0.1278 [0.0001; 0.3574]
0.1744 [0.0161; 0.4097]
0.0961 [8.00732E-05; 0.3574]
Family labour (AWU) 1.0804 [0.0009; 198.7042]
1.0219 [0.0939; 2.4003]
1.1033 [0.0009; 198.7042]
Materials (EUR) 3 909 [101; 27 065]
3 376 [101; 20 686]
4 521 [354; 19 713]
Stocking density (LU per ha) 1.23 [0.02; 4.17]
1.18 [0.09; 3.53]
1.23 [0.04; 4.08]
Organic (0-1 probability) 0.026 [0; 1]
0.034 [0; 1]
0.023 [0; 1]
Total assets (EUR) 792 034 [6 831; 4 334 456]
781 491 [10 100; 3 114 416]
810 747 [129 001; 3 832 822]
Age (years) 56.5 [18; 88]
55 [26; 85]
57.5 [35; 78]

88 TAD/CA/APM/WP(2020)2/ANN/FINAL
DRIVERS OF FARM PERFORMANCE Unclassified
Table A D.8.22. Irish sheep farms: Latent class estimates
LCM panel translog reduced model, 2010 to 2018
Total output Class 1 Class 2 Class 3
constant 18.1972*** 8.24771*** 8.53271***
Land -0.96806*** -0.18850** 0.66073***
Livestock 1.13214*** -0.11410 1.28961***
Capital -0.22162 0.02785 -0.09815*
Labour 0.24370** -0.09519 -0.00387
Material -1.71873*** 0.12024 -0.69504**
Land*Land 0.12310*** 0.00981 -0.06790***
Livestock*Livestock -0.08236*** 0.08255*** -0.08928***
Capital*Capital 0.01857** 0.00176 0.00873**
Labour*Labour 0.07456 -0.01512 -0.06342
Material*Material 0.09170*** 0.00818 0.04139**
Time -0.02769 -0.04458 -0.34798***
Time*Time -0.00125 0.00497*** -0.00283
Time*Land 0.00145 0.00769 0.01992*
Time*Livestock 0.01760 0.00382 -0.00108
Time*Capital -0.00746 -0.01564*** 0.00500
Time*Labour -0.03027* 0.02436* -0.02099
Time*Material 0.00236 0.00789 0.02677*
Sigma 0.15956*** 0.15767*** 0.17866***
Class Membership Vector
Constant -2.89970*** 0.03756 ---
Index 1 - Structure 1.24398 0.65415* ---
Index 2 - Environmental sustainability 2.84095*** 0.66108*** ---
Index 3 – Innovation-cooperation-commercialisation 2.76689*** 0.90635** ---
Index 4 - Technology 0.51187** 0.31369** ---
Index 5 - Diversity -1.24243*** -0.05331 ---
Index 6 - Individual -1.88034*** 0.27036 ---
Index 7 - Location -0.00244*** -0.00039 ---
Index 8 - Household -0.27931 1.04426*** ---
Index 9 - Financial 3.63912*** -0.07814 ---
Log-Likelihood Function 277.3416
Inf.Cr.AIC / AIC/N -400.7 / -0.349
Note: *significant at 10%, **significant at 5%, ***significant at 1%.
Source: Estimations.

TAD/CA/APM/WP(2020)2/ANN/FINAL 89
DRIVERS OF FARM PERFORMANCE Unclassified
Table A D.8.23. Irish sheep farms: Full production function estimates
Fixed-effects panel translog model per class, 2010 to 2018
Class 1 Class 2 Class 3
Land -2.57145* -0.01783 0.99409
Livestock 1.94472* -0.43851 2.32749***
Capital -0.00542 -0.43993 -0.08918
Labour 0.93640 0.61077 -0.69985
Material -0.96840 -0.38871 -0.19168
Land*Land 0.33564* 0.02778 -0.09695
Livestock*Livestock 0.10522 -0.08657 0.05737
Capital*Capital 0.02025 -0.00909 0.00927
Labour*Labour 0.00575 0.04956 -0.15804*
Material*Material 0.11314* -0.03110 0.05507
Land*Livestock -0.13272 0.01708 -0.10659
Land*Capital 0.15298** -0.01988 0.00725
Land*Labour -0.08323 -0.01365 0.02583
Land*Material -0.20537 -0.07899 -0.20892
Livestock*Capital -0.11565 0.00670 0.00201
Livestock*Labour -0.08830 0.15486 -0.19485*
Livestock*Material 0.18621 -0.24384* -0.07516
Capital*Labour -0.05635 0.07015* -0.01747
Capital*Material 0.02210 -0.01278 0.06362
Labour*Material -0.08285 0.06588 0.13965
Time -0.20125** -0.08727 -0.20701***
Time*Time 0.00037 0.00461*** -0.00183
Time*Land 0.00486 0.00342 0.00102
Time*Livestock 0.00069 -0.00451 0.01590
Time*Capital 0.01546** -0.01440*** 0.00997
Time*Labour -0.03182** 0.02179 -0.01303
Time*Material 0.00381 0.01687** 0.00858
Number of observations / average group size 286 / 3.29 434 / 3.31 427 / 2.99
R-squared / R-bar squared 0.9833 / 0.9722 0.9601 / 0.9374 0.9816 / 0.9694
Rho squared (residual variation) 0.8694 0.7484 0.8721
R-squared (within groups var) 0.4715 0.4504 0.4579
Hausman Test 50.96*** 38.85** 48.06***
Note: *significant at 10%, **significant at 5%, ***significant at 1%.
Source: Estimations.

90 TAD/CA/APM/WP(2020)2/ANN/FINAL
DRIVERS OF FARM PERFORMANCE Unclassified
Table A D.8.24. Irish sheep farms: Elasticities for classes
LCM panel translog reduced model, 2010 to 2018
Wald procedure based on delta method at sample means
Total output Class 1 Class 2 Class 3
Land 0.09623*** 0.07407*** 0.24879***
Livestock 0.52141*** 0.50788*** 0.58549***
Capital 0.05835** 0.02226 0.06037***
Labour 0.10732** 0.02401 0.10944**
Material 0.15923*** 0.31420*** 0.21900***
Returns-to-scale 0.94255*** 0.94242*** 1.22308***
Note: *significant at 10%, **significant at 5%, ***significant at 1%.
Source: Estimations.
Table A D.8.25. Irish sheep farms: Class identification - mean values indices
Mean values1, 2010 to 2018
Class 1: Most productive (24.9%)
Class 2: Least productive (37.8%)
Class 3: Medium productive
(37.3%)
Index 1 - Structure -0.4410 0.3694 -0.0801
Index 2 - Environmental sustainability -0.2608 0.4795 -0.3127
Index 3 – Innovation-cooperation-commercialisation 0.1526 -0.0490 -0.0524
Index 4 - Technology 0.4368 0.2439 -0.5405
Index 5 - Diversity 0.2757 0.0866 -0.2726
Index 6 - Individual -0.2455 0.3065 -0.1471
Index 7 - Location -0.2359 0.2511 -0.1202
Index 8 - Household -0.5938 0.8222 -0.4380
Index 9 - Financial 0.9843 -0.3651 -0.2881
Note: 1. At class means, scaled values.
Source: Estimations.

TAD/CA/APM/WP(2020)2/ANN/FINAL 91
DRIVERS OF FARM PERFORMANCE Unclassified
9. Italy
9.1. Italian crop farms
Table A D.9.1. Italian crop farms: Descriptive statistics,
Sample 2008 to 2015
Full sample
(n = 20 847)
1st year
(2008, n = 3 260)
Final year
(2015, n = 1 971)
Statistical measure Mean
[Min; Max]
Mean
[Min; Max]
Mean
[Min; Max] Variable 1
Crop output (EUR) 2 75 490
[0; 7 000 000]
77 832
[0; 6 800 000]
72 000
[0; 3 400 000]
Land (ha) 44.3
[0.15; 3 445.1]
46.1
[0.6; 3445.1]
42.4
[0.7; 1 258.4]
Capital depreciation (EUR) 7 217
[0; 418 936]
7 083
[0; 200 373]
7 812
[0; 418 936]
Chemicals cost (EUR) 12 524
[0; 913 211]
12 432
[0; 913 211]
12 470
[0; 435 120]
Materials (EUR) 9 812
[0; 883 516]
9 344
[0; 711 585]
9 703
[0; 400 720]
Hired labour (AWU) 0.3538
[0; 109.9]
0.3887
[0; 53.6]
0.2958
[0; 66.6]
Family labour (AWU) 1.0825
[0.1; 11]
1.0348
[0.02; 9.25]
1.1222
[0.03; 6]
Organic (0-1 probability) 0.0236
[0; 1]
0.0331
[0; 1]
0.0315
[0; 1]
Total assets (EUR) 733 873
[0; 85 000 000]
711 735
[0; 85 000 000]
698 000
[0; 20 000 000]
Age (years) 57.1
[12; 101]
56.75
[12; 95]
57.09
[22; 95]
Less-Favoured-Area
(1-3 severely disadvantaged )
1.5609
[0; 3]
1.4809
[0; 3]
1.6601
[0; 3]
Note: 1. Values are per year. AWU: Annual Work Unit.
2. Gross value of production for output as supplied by national agency.

92 TAD/CA/APM/WP(2020)2/ANN/FINAL
DRIVERS OF FARM PERFORMANCE Unclassified
Table A D.9.2. Italian crop farms: Latent class estimates
LCM panel translog reduced model, 2008 to 2015
Total crop output Class 1 Class 2 Class 3
constant 8.7703*** 8.4078*** 8.4711***
Land 0.0507* 0.3405*** 0.2971***
Capital -0.0534*** 0.0291 -0.0128
Labour 0.3286*** 0.2931** 0.2168***
Chemicals -0.0652*** -0.3143*** -0.0507
Materials -0.1124*** -0.1222*** -0.2726***
Land*Land 0.0185*** -0.0192** 0.0029
Capital*Capital 0.0057*** -0.0054*** -0.0024
Labour*Labour -0.0078 -0.1678 0.0158
Chemicals*Chemicals 0.0183*** 0.0285*** 0.0286***
Materials*Materials 0.0246*** 0.0329*** 0.0202***
Time -0.0018* -0.0041 0.1067
Time*Time 0.1981*** 0.1112* -0.0025
Time*Land -0.0111*** -0.0229** -0.0086
Time*Capital 0.0049*** -0.0009 0.0034
Time*Labour -0.0054 -0.0176 1.04e-05
Time*Chemicals -0.0072*** 0.0293*** -0.0079***
Time*Materials 0.0081*** -0.0101** 0.0149***
Sigma 0.4578*** 0.6247*** 0.5032***
Class Membership Vector
Constant 0.1452 -0.2691 ---
Index 1 - Structure -0.2122*** 0.1939* ---
Index 2 - Environmental sustainability 0.2487*** -0.1359 ---
Index 3 – Innovation-cooperation-commercialisation 0.2458*** -0.1498 ---
Index 4 - Technology 0.1393* 0.0527 ---
Index 5 - Diversity -0.5771*** 0.0621 ---
Index 6 - Individual -0.0559 -0.0426 ---
Index 7 - Location 0.2071*** 0.0147 ---
Log-Likelihood Function -14480.36
Inf.Cr.AIC / AIC/N 29100 / 1.396
Note: *significant at 10%, **significant at 5%, ***significant at 1%.
Source: Estimations.

TAD/CA/APM/WP(2020)2/ANN/FINAL 93
DRIVERS OF FARM PERFORMANCE Unclassified
Table A D.9.3. Italian crop farms: Full production function estimates
Fixed-effects panel translog model per class, 2008 to 2015.
Total crop output Class 1 Class 2 Class 3
Land -0.2122*** 0.3657 0.6229***
Capital 0.0235 0.0398 0.0015
Labour 0.2339*** -0.6635** 0.1950
Chemicals -0.0662*** -0.0531 -0.1637***
Materials 0.0531** -0.1189 -0.1959***
Land*Land 0.0573*** -0.0877 0.0107
Capital*Capital 0.0017** -0.0007 -0.0009
Labour*Labour 0.0216*** -0.0958** 0.0237
Chemicals*Chemicals 0.0108*** 0.0129** 0.0197***
Materials*Materials 0.0139*** 0.0283*** 0.0151***
Land*Capital 0.0033 0.0124 -0.0114**
Land*Labour -0.0383*** 0.0935 0.0061
Land*Chemicals 0.0092** -0.0022 -0.0014
Land*Materials -0.0008 -0.0012 -0.0185**
Capital*Labour 0.0084** 0.0237 -0.0037
Capital*Chemicals 0.0015 -0.0011 0.0009
Capital*Materials -0.0076*** 0.0035 0.0043
Labour*Chemicals -0.0087 0.0326 0.0002
Labour*Materials 0.0082 -0.0065 -0.0098
Chemicals*Materials -0.0029 -0.0106 0.0068**
Time 0.0625*** 0.0017 0.1079***
Time*Time -0.0041*** -0.0038 -0.0071***
Time*Land 0.0092*** 0.0041 -0.0087*
Time*Capital 0.0016** -0.0066 0.0004
Time*Labour -0.0049 0.0079 0.0016
Time*Chemicals -0.0022* 0.0171** 0.0032
Time*Materials -0.0038** -0.0051 0.0021
Number of observations / average group size 10756 / 2.26 1432 / 1.33 8659 / 2.19
R-squared / R-bar squared 0.9748 / 0.9546 0.9859 / 0.9387 0.9407 / 0.8904
Rho squared (residual variation) 0.8017 0.8898 0.6611
R-squared (within groups var) 0.2588 0.2501 0.1861
Hausman Test 898.69*** 114.54*** 214.94***
Note: *significant at 10%, **significant at 5%, ***significant at 1%.
Source: Estimations.

94 TAD/CA/APM/WP(2020)2/ANN/FINAL
DRIVERS OF FARM PERFORMANCE Unclassified
Table A D.9.4. Italian crop farms: Elasticities for classes
LCM panel translog reduced model, 2008 to 2015
Wald procedure based on delta method at sample means
Total crop output Class 1 Class 2 Class 3
Land 0.0966*** 0.3152*** 0.1179***
Capital 0.0333*** 0.0183*** 0.0405***
Labour 0.4646*** 0.0955*** 0.0847***
Chemicals 0.1526*** 0.3982*** 0.3421***
Materials 0.3039*** 0.0891*** 0.3759***
Returns-to-scale 1.0512*** 0.9163*** 0.9612***
Note: *significant at 10%, **significant at 5%, ***significant at 1%.
Source: Estimations.
Table A D.9.5. Italian crop farms: Class identification - mean values indices
Mean values1
Class 1: Most productive (51.5%)
Class 2: Least productive (7%)
Class 3: Medium productive (41.5%)
Index 1 - Structure -0.1764 0.3482 0.1629
Index 2 - Environmental sustainability -0.0247 -0.1281 0.0511
Index 3 – Innovation-cooperation-commercialisation 0.2429 -0.6062 -0.2041
Index 4 - Technology 0.1207 0.1024 -0.1657
Index 5 - Diversity -0.7459 1.4586 0.6909
Index 6 - Individual -0.1459 -0.0469 0.1881
Index 7 - Location 0.1094 0.3591 -0.1927
Note: 1. At class means, scaled values.
Source: Estimations.

TAD/CA/APM/WP(2020)2/ANN/FINAL 95
DRIVERS OF FARM PERFORMANCE Unclassified
10. Korea
10.1. Korean rice farms
Table A D.10.1. Korean rice farms: Descriptive statistics
Sample 2003 to 2015
Note: 1. Values are per year.
Full sample (n = 16 565)
1st year (2003, n = 1 300)
Final year (2015, n = 1 219)
Statistical measure Mean [Min; Max]
Mean [Min; Max]
Mean [Min; Max]
Variable1
Rice output (EUR) 8 296 [0; 230 997]
7 808 [276; 119 481]
11 262 [616; 230 997]
Land (ha) 1.18 [0.16; 35.51]
1.14 [0.19; 19.23]
1.52 [0.19; 27.16]
Capital depreciation (EUR) 438 [0; 24 693]
402 [0; 15 931]
539 [0; 24 693]
Chemicals cost (EUR) 833 [0; 30 269]
597 [0; 11 948]
1 158 [0; 30 269]
Materials (EUR) 314 [0; 31 065.1]
657 [0; 7 965]
375 [0; 10 355]
Family labour (hour) 172.5 [0; 3 598.0]
248.3 [8; 2 932.0]
145 [11.0; 2 526]
Hired labour (hour) 20.1 [0; 3 958]
45.5 [0; 1 530.3]
15.7 [0; 608.0]
Total assets (EUR) 1 531 [0.4; 159 308]
1 165 [2.9; 70 892]
2 176 [1.7; 159 308]
Age (years) 63.9 [29; 92]
59.4 [30; 89]
67.4 [33; 91]
Part-Time Farming (probability) 0.55 [0; 1]
0.45 [0; 1]
0.54 [0; 1]

96 TAD/CA/APM/WP(2020)2/ANN/FINAL
DRIVERS OF FARM PERFORMANCE Unclassified
Table A D.10.2. Korean rice farms: Latent class estimates
LCM panel translog reduced model, 2003 to 2015
Total rice output Class 1 Class 2 Class 3
Constant 4.5906*** 4.3874*** 4.6636***
Land 1.1359*** 0.8945*** 1.2614***
Capital 1.5187*** 0.8765*** 1.3836***
Labour -0.8171*** -0.5253*** -0.1071
Chemicals 0.1757*** 1.1829*** 0.6687***
Materials 0.5066*** -0.0777*** 0.0709**
Land*Land 0.0847*** 0.0411*** 0.1098***
Capital*Capital -0.0614*** -0.0329*** -0.0666***
Labour*Labour 0.0462*** 0.0846*** 0.0571**
Chemicals*Chemicals -0.0031*** -0.0482*** -0.0265***
Materials*Materials -0.0184*** -0.0003 -0.0082***
Time 0.0473 -0.1797*** 0.3765
Time*Time 0.0082*** -0.0029*** 0.0053***
Time*Land -0.0027 0.0148*** 0.0182***
Time*Capital 0.0007 -0.0093*** -0.0051***
Time*Labour 0.0389*** -0.0418*** -0.0768***
Time*Chemicals -0.0119*** 0.0207*** 0.0179***
Time*Materials -0.0122*** 0.0082*** 0.0074***
Sigma 0.2577*** 0.3311*** 0.4055***
Class Membership Vector
Constant 0.4276*** 0.1839 ---
Index 1 - Structure -0.0321 -0.1366 ---
Index 2 - Environmental sustainability 0.2271*** -0.3286*** ---
Index 3 – Innovation-cooperation-commercialisation -0.1125 0.0872 ---
Index 4 - Technology 0.3766*** 0.3529*** ---
Index 5 - Diversity 0.3117*** -0.2341** ---
Index 6 - Individual 0.0094 0.0009
Index 7 - Location -0.3013*** 0.1401 ---
Index 8 - Household -0.5109*** 0.0655
Log-Likelihood Function -2249.801
Inf.Cr.AIC / AIC/N 4643.6 / 0.280
Note: *significant at 10%, **significant at 5%, ***significant at 1%.
Source: Estimations.

TAD/CA/APM/WP(2020)2/ANN/FINAL 97
DRIVERS OF FARM PERFORMANCE Unclassified
Table A D.10.3. Korean rice farms: Full production function estimates
Fixed-effects panel translog model per class, 2003 to 2015
Total rice output Class 1 Class 2 Class 3
Land 0.3804*** 0.0021 -7.2769***
Capital 1.3701*** 0.3376*** -0.4102***
Labour -0.8236*** -0.2137* -2.3312***
Chemicals 0.2637*** 2.1913*** 1.5058***
Materials 0.2658*** -0.2304*** 0.3456***
Land*Land 0.0169* 0.0117 -0.6895***
Capital*Capital -0.0416*** -0.0016 -0.0508***
Labour*Labour -0.0375*** 0.0376*** 0.1713***
Chemicals*Chemicals 0.0002 -0.0789*** -0.1065***
Materials*Materials -0.0012 0.0012** -0.0106***
Land*Capital 0.0457*** 0.0149** -0.4072***
Land*Labour -0.0131 -0.0362* 0.8871***
Land*Chemicals 0.0172*** 0.0812*** 0.5679***
Land*Materials -0.0091* -0.0161*** 0.0036
Capital*Labour 0.0721*** -0.0073*** -0.2709***
Capital*Chemicals -0.0246*** -0.0173*** 0.1019***
Capital*Materials -0.0312*** 0.0014 0.0097***
Labour*Chemicals -0.0002 0.0011 0.4576***
Labour*Materials 0.0172*** -0.0011 0.0317***
Chemicals*Materials 0.0076*** 0.0138*** -0.0444***
Time 0.0246 0.0701*** 1.2173***
Time*Time 0.0035*** -0.0024*** -0.0159***
Time*Land 0.0013 0.0068*** 0.0492***
Time*Capital 0.0023*** -0.0033*** 0.0679***
Time*Labour 0.0115*** -0.0131*** -0.2092***
Time*Chemicals -0.0059*** 0.0049*** -0.0736***
Time*Materials -0.0056*** 0.0016*** 0.0195***
Number of observations / average group size 9687 / 3.04 5472 / 2.86 1452 / 1.82
R-squared / R-bar squared 0.9737 / 0.9636 0.9937 / 0.9915 0.9947 / 0.9919
Rho squared (residual variation) 0.6103 0.8781 0.9982
R-squared (within groups var) 0.9641 0.9926 0.9581
Hausman Test 922.63*** 6009.86*** 31.37***
Note: *significant at 10%, **significant at 5%, ***significant at 1%.
Source: Estimations.

98 TAD/CA/APM/WP(2020)2/ANN/FINAL
DRIVERS OF FARM PERFORMANCE Unclassified
Table A D.10.4. Korean rice farms: Elasticities for classes
LCM panel translog reduced model, 2003 to 2015
Wald procedure based on delta method at sample means
Total rice output Class 1 Class 2 Class 3
Land 1.0647*** 0.9837*** 1.2039***
Capital 0.0318*** 0.0144*** 0.0186***
Labour 0.0791*** 0.0776*** 0.1515***
Chemicals 0.0041*** 0.0095*** 0.1204***
Materials 0.0307*** 0.0329*** 0.0562***
Returns-to-scale 1.2104*** 1.0522*** 1.5505***
Note: *significant at 10%, **significant at 5%, ***significant at 1%.
Source: Estimations.
Table A D.10.5. Korean rice farms: Class identification - mean values indices
Mean values1
Class 1: Medium productive (57.9%)
Class 2: Most productive (33.3%)
Class 3: Least productive (8.8%)
Index 1 - Structure 0.1204 -0.3246 0.4015
Index 2 - Environmental sustainability 0.3026 -0.6276 0.3163
Index 3 – Innovation-cooperation-commercialisation -0.0549 0.1643 -0.2428
Index 4 - Technology 0.0403 0.1355 -0.7632
Index 5 - Diversity 0.4086 -0.7518 0.0758
Index 6 - Individual -0.1283 0.2396 -0.0365
Index 7 - Location -0.1983 0.3425 0.0452
Index 8 - Household -0.4627 0.6586 0.6226
Note: 1. At class means, scaled values.
Source: Estimations.

TAD/CA/APM/WP(2020)2/ANN/FINAL 99
DRIVERS OF FARM PERFORMANCE Unclassified
11. Norway
11.1. Norwegian dairy farms
Table A D.11.1. Norwegian dairy farms: Descriptive statistics
Sample 2005 to 2016
Note: LU per ha: Livestock Unit per hectare. 1. Values are per year.
Full sample (n = 5 549)
1st year (2005, n = 515)
Final year (2016, n = 453)
Statistical measure Mean [Min; Max]
Mean [Min; Max]
Mean [Min; Max]
Variable1
Milk output (EUR) 93 628 [2 324; 558 221]
54 947 [2 324; 189 553]
137 855 [4 514; 433 974]
Dairy cows (n) 23.0 [0; 111]
17.9 [0; 59]
27.2 [0; 87]
Capital depreciation (EUR) 20 884 [0; 156 439]
12 064 [0.501; 56 674]
31 002 [2 046; 133 550]
Fodder cost (EUR) 31 253 [0; 231 320]
16 854 [329; 94 136]
43 341 [433; 183 229]
Materials (EUR) 54 103 [3 299; 333 959]
32 729 [3 299; 185 698]
76 306 [12 543; 286 037]
Hired labour (h) 1 427 [0; 15 020]
1 267 [0; 8 250]
1 582 [0; 15 020]
Family labour (h) 2 878 [102; 8 508]
2 852 [102; 5 970]
2 734 [120; 6 400]
Land (ha) 34.3 [3; 263.6]
26.9 [6.6; 93.3]
39.8 [9.1; 138.3]
Stocking density (LU per ha) 0.72 [0; 2.88]
0.72 [0; 1.62
0.73 [0; 2.88]
Chemicals cost (EUR) 7 005 [0; 99 456]
4 341 [0; 27 772]
9 621 [0; 70 448]
Organic (0-1 probability) 0.078 [0; 1]
0.041 [0; 1]
0.059 [0; 1]
Total assets (EUR) 244 159 [0; 2 264 968]
143 122 [0; 1 272 694]
375 810 [0; 1 902 640]
Age (years) 48.6 [20; 71]
47.1 [26; 69]
49.2 [25; 71]
Total Subsidies (EUR) 46 016 [5 513; 157 061]
29 958 [8 071; 74 362]
58 634 [13 649; 134 180]

100 TAD/CA/APM/WP(2020)2/ANN/FINAL
DRIVERS OF FARM PERFORMANCE Unclassified
Table A D.11.2. Norwegian dairy farms: Latent class estimates
LCM panel translog reduced model, 2005 to 2016
Total dairy output Class 1 Class 2 Class 3
constant -8.1464*** -7.2472*** 1.9732*
Land 0.0663 -0.4247** 1.1681***
Dairy Cows -0.1556*** 0.0669 -0.1196**
Capital -0.0143** 0.2708e-04 -0.0145
Fodder 1.0566*** 0.0088 -0.0939***
Labour 1.9376*** 1.6149*** 0.0457
Intermediates 0.5644*** 1.2962*** -0.2681
Land*Land -0.0115 0.0777*** -0.1446***
Dairy cows*Dairy cows 0.1399*** -0.0041 0.0313***
Capital*Capital 0.0009 0.0009 0.0033
Fodder*Fodder -0.0709*** 0.0695*** 0.0461***
Labour*Labour -0.1131*** -0.0876*** 0.0156
Intermediates*Intermediates -0.0441*** -0.0906*** 0.0461**
Time -0.0534*** -0.0258 0.0374
Time*Time -0.0004 0.0015 0.0012
Time*Land 0.0054** -0.0187** -0.0121
Time*Dairy Cows -0.0233*** -0.0101* 0.0058
Time*Capital 0.0005 0.0007 0.0002
Time*Fodder 0.0189*** -0.0197*** 0.0029
Time*Labour -0.0005 0.0053 -0.0045
Time*Intermediates 0.0057 0.0247** -0.0004
Sigma 0.1109*** 0.2707*** 0.1752***
Class Membership Vector
Constant 0.9731*** -0.7344*** ---
Index 1 - Structure 0.1507** 0.3819*** ---
Index 2 - Environmental sustainability -0.8312*** -0.2771*** ---
Index 3 – Innovation-cooperation-commercialisation 0.2572** 0.4268*** ---
Index 4 - Technology 0.0003 -0.0004 ---
Index 5 - Diversity 0.0041 1.1177*** ---
Index 6 - Individual 0.1856 0.1879 ---
Index 7 - Location -0.8971*** -1.3788*** ---
Index 8 - Household -1.0093*** 0.0476 ---
Index 9 - Financial -0.0008** 0.0016** ---
Log-Likelihood Function 1745.8
Inf.Cr.AIC / AIC/N -3319.6 / -0.598
Note: *significant at 10%, **significant at 5%, ***significant at 1%.
Source: Estimations.

TAD/CA/APM/WP(2020)2/ANN/FINAL 101
DRIVERS OF FARM PERFORMANCE Unclassified
Table A D.11.3. Norwegian dairy farms: Full production function estimates
Fixed-effects panel translog model per class, 2005 to 2016
Total dairy output Class 1 Class 2 Class 3
Land -0.2361 -2.4116*** 0.3053
Dairy cows 0.3045 0.3214 -1.0299***
Capital -0.0135 0.2193 0.0166
Fodder 0.8734*** -0.5087 0.1864
Labour 0.8219*** 2.0012** 1.8117***
Intermediates 0.5393** 1.0815 0.784
Land*Land -0.0499** 0.0169 0.0821
Dairy cows*Dairy cows 0.0791*** 0.0511* 0.0586***
Capital*Capital 0.0051*** 0.0029 0.0037
Fodder*Fodder -0.0524*** 0.0421*** 0.0437***
Labour*Labour -0.0249 -0.1541** -0.0645*
Intermediates*Intermediates -0.0073 0.0091 0.0974
Land*Dairy Cows 0.0158 0.0669 -0.0243
Land*Capital -0.0167*** -0.0073 -0.0083
Land*Fodder 0.0241 -0.2288*** -0.0748*
Land*Labour 0.0289 0.4252*** 0.0771
Land*Intermediates 0.0432 -0.0253 -0.1545
Dairy cows*Capital -0.0132** 0.0273 0.0003
Dairy cows*Fodder 0.0252* 0.0379 0.0252
Dairy cows*Labour 0.0025 0.0111 0.1025*
Dairy cows*Intermediates -0.0827*** -0.1925*** -0.0075
Capital*Fodder 0.0102*** -0.0309** 0.0202***
Capital*Labour -0.0047 -0.0325* -0.0081
Capital*Intermediates 0.0119*** 0.0276 -0.0079
Fodder*Labour -0.0401* 0.0541 -0.0479
Fodder*Intermediates 0.0218 0.1509*** 0.0268
Labour*Intermediates -0.0515 -0.1481 -0.1597**
Time -0.1083*** 0.0892 -0.0105
Time*Time -0.0001 -0.0009 0.0001
Time*Land -0.0014 0.0038 -0.0003
Time*Dairy cows -0.0113*** 0.0109* 0.0071
Time*Capital -0.0007** 0.0003 -0.0002
Time*Fodder 0.0122*** -0.0083* -0.0052*
Time*Labour 0.0123*** -0.0096 0.0021
Time*Intermediates 0.0016 0.0008 0.0034
Number of observations / average group size 3 583 / 4.91 902 / 2.85 1064 / 2.87
R-squared / R-bar squared 0.9894 / 0.9866 0.9704 / 0.9515 0.9873 / 0.9794
Rho squared (residual variation) 0.7723 0.7678 0.8686
R-squared (within groups var) 0.9224 0.6297 0.8064
Hausman Test 2098.44*** 113.95*** 204.13***
Note: *significant at 10%, **significant at 5%, ***significant at 1%.
Source: Estimations.

102 TAD/CA/APM/WP(2020)2/ANN/FINAL
DRIVERS OF FARM PERFORMANCE Unclassified
Table A D.11.4. Norwegian dairy farms: Elasticities for classes
LCM panel translog reduced model, 2005 to 2016
Wald procedure based on delta method at sample means
Total dairy output Class 1 Class 2 Class 3
Land 0.0231** 0.0214 0.0411
Dairy cows 0.5452*** 0.0186 0.1140***
Capital 0.0048* 0.0113 0.0142
Fodder 0.4019*** 0.5641*** 0.4069***
Labour 0.0485*** 0.2224*** 0.2721***
Intermediates 0.0683*** 0.3992*** 0.2929***
Returns-to-scale 1.0918*** 1.2371*** 1.1413***
Note: *significant at 10%, **significant at 5%, ***significant at 1%.
Source: Estimations.
Table A D.11.5. Norwegian dairy farms: Class identification - mean values indices
Mean values1
Class 1: Most productive (64.6%)
Class 2: Least productive (16.2%)
Class 3: Medium productive (19.2%)
Index 1 - Structure 0.0537 0.3574 -0.4839
Index 2 - Environmental sustainability -0.3782 0.3419 0.9836
Index 3 – Innovation-cooperation-commercialisation -0.0312 0.1412 -0.0147
Index 4 - Technology -0.0102 -0.0121 0.0408
Index 5 - Diversity -0.4519 1.7376 0.0487
Index 6 – Individual -0.0393 0.1414 0.0124
Index 7 – Location -0.1873 -0.1271 0.7384
Index 8 – Household -0.2012 0.3105 0.4144
Index 9 – Financial -0.0865 -0.1789 0.4444
Note: 1. At class means, scaled values.
Source: Estimations.

TAD/CA/APM/WP(2020)2/ANN/FINAL 103
DRIVERS OF FARM PERFORMANCE Unclassified
11.2. Norwegian crop farms
Table A D.11.6. 11.2. Norwegian crop farms: Descriptive statistics
Full sample
(n = 1613)
1st year
(2005, n = 121)
Final year
(2016, n = 150)
Statistical measure Mean
[Min; Max]
Mean
[Min; Max]
Mean
[Min; Max] Variable 1
Crop output (EUR)2 74 795
[1 125; 968 568]
45 389
[4 182; 221 111]
99 590
[6 410; 866 938]
Land (ha) 33.8
[0.2; 282.4]
31.6
[3.3; 105.5]
38.6
[0.21; 282.4]
Capital depreciation (EUR) 14 548
[430; 115 792]
9 843
[430; 29 326]
19 911
[609; 110 769]
Chemicals cost (EUR) 11 325
[0; 105 889]
7 336
[0; 27 428]
15 773
[0; 85 578]
Materials (EUR) 47 093
[4 562; 403 036]
28 966
[5 488; 103 109]
63 329
[5 956; 333 471]
Hired labour (h) 1 506
[0; 42 304]
876
[0; 13 626]
1 690
[0; 23 300]
Family labour (h) 1 376
[40; 6 500]
1 383
[50; 4 642]
1 313
[105; 5 500]
Organic (0-1 probability) 0.041
[0; 1]
0.017
[0; 1]
0.033
[0; 1]
Total assets (EUR) 195 858
[0; 1 627 447]
138 545
[0; 467 425]
288 852
[0; 1 627 447]
Age (years) 50
[25; 75]
49.3
[18; 66]
51.7
[27; 75]
Total Subsidies (EUR) 16 712
[0; 156 579]
13 000
[1 212; 47 543]
22 138
[0; 156 579]
Note: 1. Values are per year. 2. Gross value of production for output as supplied by national agency.

104 TAD/CA/APM/WP(2020)2/ANN/FINAL
DRIVERS OF FARM PERFORMANCE Unclassified
Table A D.11.7. Norwegian crop farms: Latent class estimates
LCM panel translog reduced model, 2005 to 2016
Total crop output Class 1 Class 2 Class 3
Constant -0.2285 5.5585*** -4.3439*
Land -0.0305 1.4663*** -0.0481
Capital -0.0621* 0.0685 0.3617
Chemicals -0.1629** 0.0319 -0.9199***
Labour 0.3724*** -1.0239*** 0.9148**
Intermediates 0.6304*** -0.6442* 1.1357
Land*Land -0.0132 -0.1103*** -0.0943**
Capital*Capital 0.0185** -0.0004 -0.0616**
Chemicals*Chemicals 0.0628*** 0.0253*** 0.2079***
Labour*Labour 0.0124 0.0793*** -0.0172
Intermediates*Intermediates -0.0326* 0.0789** -0.0374
Time 0.0708* -0.0375 0.2111*
Time*Time 0.0025* 0.0063*** 0.0046
Time*Land -0.0037 0.0019 -0.0179
Time*Capital 0.0006 0.0002 0.0445**
Time*Chemicals -0.0084 -0.0068 0.0181
Time*Labour -0.0136** 0.0037 -0.0276*
Time*Intermediates 0.0119 -0.0066 -0.0521*
Sigma 0.2782*** 0.3349*** 0.4005***
Class Membership Vector
Constant 2.4894*** 2.4654*** ---
Index 1 - Structure -3.4225*** -4.4584*** ---
Index 2 - Environmental sustainability -0.6616 0.8749 ---
Index 3 – Innovation-cooperation-commercialisation -0.8167*** -1.9791*** ---
Index 4 - Technology -0.0053*** -0.0021 ---
Index 5 - Diversity -0.4929*** -0.5815*** ---
Index 6 - Individual -0.7108*** -0.3920 ---
Index 7 - Location -0.6819*** -1.4145*** ---
Index 8 - Household -0.9342*** -0.1443 ---
Index 9 - Financial -0.0079 -0.0011 ---
Log-Likelihood Function -631.7
Inf.Cr.AIC / AIC/N 1417.3 / 0.879
Note: *significant at 10%, **significant at 5%, ***significant at 1%.
Source: Estimations.

TAD/CA/APM/WP(2020)2/ANN/FINAL 105
DRIVERS OF FARM PERFORMANCE Unclassified
Table A D.11.8. Norwegian crop farms: Full production function estimates
Fixed-effects panel translog model per class, 2005 to 2016
Total crop output Class 1 Class 2 Class 3
Land 0.6399* 1.6826** 2.5939
Capital 0.0228 -0.1879 -0.7525
Chemicals 0.2751 -0.4329 1.6611
Labour -0.2053 0.2627 0.0105
Intermediates 0.5081* -0.1669 2.4456
Land*Land 0.0061 -0.0973 0.3206*
Capital*Capital 0.0028 0.0225 0.0506
Chemicals*Chemicals 0.0123 -0.0051 0.2712***
Labour*Labour 0.0809*** -0.0120 0.1307**
Intermediates*Intermediates 0.0035 -0.0322 -0.2436
Land*Capital 0.0253 -0.1103 -0.1144
Land*Chemicals 0.0288 -0.0118 -0.4894***
Land*Labour -0.0675 0.0347 -0.1416
Land*Intermediates -0.0393 0.0289 -0.0031
Capital*Chemicals -0.0062 0.0052 -0.0786
Capital*Labour -0.0267 0.0401 -0.0411
Capital*Intermediates 0.0299 0.0098 0.2511
Chemicals*Labour -0.0211 -0.0349 -0.2084**
Chemicals*Intermediates -0.0227 0.1438* -0.0846
Labour*Intermediates -0.0318 -0.0206 -0.0525
Time 0.0259 -0.0369 0.2851*
Time*Time 0.0015 0.0035*** 0.0021
Time*Land -0.0059 -0.0025 -0.0257
Time*Capital 0.0005 0.0058 -0.0187
Time*Chemicals -0.0014 -0.0148* 0.0268
Time*Labour -0.0052 -0.0037 -0.0276*
Time*Intermediates 0.0081 0.0168 -0.0089
Number of observations / average group size 674 / 3.79 719 / 4.73 220 / 2.56
R-squared / R-bar squared 0.9761 / 0.9657 0.9367 / 0.9158 0.9764 / 0.9516
Rho squared (residual variation) 0.7371 0.6724 0.9693
R-squared (within groups var) 0.5644 0.4253 0.5963
Hausman Test 59.63*** 57.75*** 105.62***
Note: *significant at 10%, **significant at 5%, ***significant at 1%.
Source: Estimations.

106 TAD/CA/APM/WP(2020)2/ANN/FINAL
DRIVERS OF FARM PERFORMANCE Unclassified
Table A D.11.9. Norwegian crop farms: Elasticities for classes
LCM panel translog reduced model, 2005 to 2016
Wald procedure based on delta method at sample means
Total crop output Class 1 Class 2 Class 3
Land 0.1299*** 0.6638*** 0.0612***
Capital 0.0543*** 0.0382 0.1157
Chemicals 0.2985*** 0.2096*** 0.7729***
Labour 0.4766*** 0.0886*** 0.4483***
Intermediates 0.3503*** 0.1671*** 0.3755***
Returns-to-scale 1.3096*** 1.1674*** 1.7737***
Note: *significant at 10%, **significant at 5%, ***significant at 1%.
Source: Estimations.
Table A D.11.10. Norwegian crop farms: Class identification - mean values indices
Mean values1
Class 1: Most productive (41.8%)
Class 2: Least productive (44.6%)
Class 3: Medium productive (13.6%)
Index 1 - Structure 0.2520 -0.4360 0.6527
Index 2 - Environmental sustainability -0.4083 0.4361 -0.1743
Index 3 – Innovation-cooperation-commercialisation 0.0931 -0.1866 0.3244
Index 4 - Technology 0.2267 -0.2969 0.4966
Index 5 - Diversity -0.2559 -0.0131 0.8269
Index 6 - Individual -0.2347 0.0842 0.4439
Index 7 - Location 0.3055 -0.6737 1.2658
Index 8 - Household -0.2319 0.1394 0.2550
Index 9 - Financial -0.3574 0.4175 -0.3020
Note: 1. At class means, scaled values.
Source: Estimations.

TAD/CA/APM/WP(2020)2/ANN/FINAL 107
DRIVERS OF FARM PERFORMANCE Unclassified
11.3. Norwegian cattle farms
Table A D.11.11. Norwegian cattle farms: Descriptive statistics
Note: 1. Values are per year.
Full sample (n = 1 655)
1st year (2005, n = 119)
Final year (2016, n = 158)
Statistical measure Mean [Min; Max]
Mean [Min; Max]
Mean [Min; Max]
Variable1
Total output (EUR) 56 409 [2 822; 657 018]
29 415 [3 737; 198 274]
76 234 [5 269; 657 018]
Livestock units (number) 97.9 [0; 365.5]
84.1 [0; 223.5]
112.2 [0; 356.2]
Capital depreciation (EUR) 15 024 [361; 145 402]
8 074 [539; 71 027]
22 903 [986; 134 402]
Fodder cost (EUR) 21 010 [9.556; 193 638]
11 446 [678; 87 585]
29 208 [1 424; 187 486]
Materials (EUR) 32 648 [2 976; 246 925]
19 007 [4 357; 55 049]
44 854 [7 790; 199 066]
Hired labour (hour) 990 [0; 10 734]
786 [68; 5 000]
1 122 [0; 6 900]
Family labour (hour) 2 150 [200; 9 027]
2 156 [556; 5 150]
2 066 [420; 6 040]
Land (ha) 22.4 [0; 110.5]
16.7 [1.7; 53.3]
26.9 [0.1; 110.5]
Stocking density (number per ha) 0.04 [0; 2.10]
0.03 [0; 0.73]
0.05 [0; 1.93]
Chemicals cost (EUR) 3 941 [0; 31 938]
2 121 [0; 7 788]
5 270 [0; 25 940]
Organic (0-1 probability) 0.0549 [0; 1]
0.0504 [0; 1]
0.0443 [0; 1]
Total assets (EUR) 131 018 [0; 1 645 237]
78 945 [0; 815 058]
202 772 [0; 1 599 963]
Age (years) 48.8 [24; 70]
48.9 [32; 66]
49.1 [28; 70]
Total subsidies (EUR) 37 808 [4 762.3; 165 111.9]
22 500 [5 896; 59 105]
47 255 [9 745; 116 667]

108 TAD/CA/APM/WP(2020)2/ANN/FINAL
DRIVERS OF FARM PERFORMANCE Unclassified
Table A D.11.12. Norwegian cattle farms: Latent class estimates
LCM panel translog reduced model, 2005 to 2016
Total livestock output Class 1 Class 2
constant -0.3942 -7.8791
Land 0.0270 1.4747**
Capital -0.0055 0.1707**
Material 0.9589*** 1.8677**
Fodder -0.3781*** -0.2137
Fuel 0.0966* 0.1432
Labour 0.5489 0.7951
Livestock -0.8374*** -0.0022
Land*Land -0.0022 -0.2047**
Capital*Capital 0.0076* -0.0160
Material*Material -0.0946*** -0.0987
Fodder*Fodder 0.0886*** 0.0679**
Fuel*Fuel -0.0102 0.0121
Labour*Labour -0.0145 -0.0563
Livestock*Livestock 0.1536*** -0.0021
Time 0.1073** -0.2039
Time*Time -0.0025*** 0.0062
Time*Land -0.0055 0.0402
Time*Capital -0.0029*** -0.0049
Time*Material 0.0228*** -0.0464
Time*Fodder -0.0041 -0.0008
Time*Fuel 0.0023 -0.0134
Time*Labour -0.0179*** 0.0396
Time*Livestock 0.0002 -0.0082
Sigma 0.2338*** 0.3821***
Class Membership Vector
Constant 1.7076*** ---
Index 1 - Structure 1.0363*** ---
Index 2 - Environmental sustainability -0.3532** ---
Index 3 – Innovation-cooperation-commercialisation 0.7795*** ---
Index 4 - Technology -0.0031* ---
Index 5 - Diversity -0.6301*** ---
Index 6 - Individual 0.3143* ---
Index 7 - Location 0.4704*** ---
Index 8 - Household 0.0558 ---
Index 9 - Financial 0.0017** ---
Log-Likelihood Function -314.357
Inf.Cr.AIC / AIC/N 748 / 0.452
Note: *significant at 10%, **significant at 5%, ***significant at 1%.
Source: Estimations.

TAD/CA/APM/WP(2020)2/ANN/FINAL 109
DRIVERS OF FARM PERFORMANCE Unclassified
Table A D.11.13. Norwegian cattle farms: Full production function estimates
Fixed-effects panel translog model per class, 2005 to 2016
Total livestock output Class 1 Class 2
Land 0.4632 -2.2147
Capital 0.0252 0.1352
Material -0.2439 3.4212**
Fodder 0.6553*** -1.0545
Fuel 0.1058 -0.0142
Labour -0.7726 0.9156
Livestock -0.3166* 0.5771
Land*Land 0.0218** -0.1128
Capital*Capital 0.0045 0.0054
Material*Material 0.0395 -0.0154
Fodder*Fodder 0.1099*** 0.0065
Fuel*Fuel 0.0039 -0.0897**
Labour*Labour 0.0915** 0.0017
Livestock*Livestock 0.1221*** 0.0646
Land*Capital 0.0054 0.0849*
Land*Material 0.0162 0.0032
Land*Fodder -0.0388 0.0238
Land*Fuel -0.0154 0.1413
Land*Labour -0.0275 0.1753
Land*Livestock -0.0372* 0.1518*
Capital*Material 0.0145 -0.0005
Capital*Fodder -0.0105 -0.0074
Capital*Fuel -0.0103 -0.0012
Capital*Labour -0.0022 -0.0444
Capital*Livestock -0.0095** 0.0404**
Material*Fodder -0.0333 0.0631
Material*Fuel -0.0186 0.0844
Material*Labour -0.0032 -0.4164*
Material*Livestock 0.0349* -0.0596
Fodder*Fuel -0.0057 -0.0163
Fodder*Labour -0.1053*** 0.1764
Fodder*Livestock -0.0375** -0.1247*
Fuel*Labour 0.0204 0.0261
Fuel*Livestock -0.0204 -0.0615
Labour*Livestock -0.0178 -0.0451
Time -0.0103 0.0418
Time*Time -0.0011* 0.0006
Time*Land -0.0005 0.0094
Time*Capital 0.0015 -0.0029
Time*Material -0.0041 -0.0147
Time*Fodder -0.0003 0.0017
Time*Fuel 0.0012 -0.0084
Time*Labour 0.0055 0.0019
Time*Livestock 0.0038* 0.0068
Number of observations / average group size 1 340 /5.30 315 / 2.79
R-squared / R-bar squared 0.9771 / 0.9706 0.9872 / 0.9746
Rho squared (residual variation) 0.6438 0.9316
R-squared (within groups var) 0.8183 0.6692
Hausman Test 89.84*** 106.98***
Note: *significant at 10%, **significant at 5%, ***significant at 1%.Source: Estimations.

110 TAD/CA/APM/WP(2020)2/ANN/FINAL
DRIVERS OF FARM PERFORMANCE Unclassified
Table A D.11.14. Norwegian cattle farms: Elasticities for classes
LCM panel translog reduced model, 2005 to 2016
Wald procedure based on delta method at sample means
Total livestock output Class 1 Class 2
Land 0.0217 0.4081***
Capital 0.0198*** 0.0329
Material 0.1385*** 0.4181***
Fodder 0.3809*** 0.4208***
Fuel 0.0454*** 0.1236*
Labour 0.3019* 0.5725
Livestock 0.1695*** 0.0805*
Returns-to-scale 1.0777*** 2.0563***
Note: *significant at 10%, **significant at 5%, ***significant at 1%.
Source: Estimations.
Table A D.11.15. Norwegian cattle farms: Class identification - mean values indices
Mean values1
Class 1: Least productive (81%)
Class 2: Most productive (19%)
Index 1 - Structure 0.2452 -1.0429
Index 2 - Environmental sustainability -0.1318 0.5605
Index 3 - Innovation-cooperation-commercialisation 0.0524 -0.2228
Index 4 - Technology -0.0155 0.0677
Index 5 - Diversity -0.2193 0.9327
Index 6 - Individual 0.0267 -0.1138
Index 7 - Location 0.1558 -0.6735
Index 8 - Household 0.0140 -0.0596
Index 9 - Financial -0.1402 0.6169
Note: 1. At class means, scaled values.
Source: Estimations.

TAD/CA/APM/WP(2020)2/ANN/FINAL 111
DRIVERS OF FARM PERFORMANCE Unclassified
12. Sweden
12.1. Swedish dairy farms
Table A D.12.1. Swedish dairy farms: Descriptive statistics
Sample 1997 to 2017
Note: AWU: Annual Work Unit. LU per ha: Livestock Unit per hectare. 1. Values are per year.
Full sample (n = 7 729)
1st year (1997, n = 365)
Final year (2017, n = 481)
Statistical measure Mean [Min; Max]
Mean [Min; Max]
Mean [Min; Max]
Variable1
Milk output (EUR) 132 958 [0; 5 993 978]
74 053 [0; 913 976]
229 266 [0; 2 314 048]
Total output (EUR) 232 613 [0; 8 021 976]
109 962 [0; 948 573]
405 666 [5 613; 3 828 228]
Dairy cows (number) 93 [2; 1 985]
75 [2; 721]
107 [3; 1 985]
Capital depreciation (EUR) 36 259 [0; 681 184]
24 828 [373.822; 165 613]
52 245 [0; 437 547]
Fodder cost (EUR) 107 548 [0; 3 772 453]
37 313 [0; 437 529]
212 870 [0; 2 423 862]
Materials (EUR) 102 352 [0; 5 250 431]
26 853 [718.978; 316 215]
177 797 [0; 1 997 333]
Hired labour (AWU) 0.4808 [0.0029; 15.3489]
0.2582 [0.0171; 1.0278]
0.6009 [0.0352; 4.3589]
Family labour (AWU) 2.8743 [0.0074; 44.1172]
1.2489 [0.0829; 4.9721]
1.6199 [0.0948; 11.7511]
Land (ha) 115.8 [0; 2400]
95.2 [0; 921]
156.4 [0; 976]
Stocking density (LU per ha) 0.82 [0; 52.4]
0.78 [0; 52.4]
0.69 [0; 5.1]
Chemicals cost (EUR) 13 741 [0; 542 486]
7 681 [0; 50 393]
19 678 [0; 281 843]
Organic (0-1 probability) 0.180 618 [0; 1]
0.101439 [0; 1]
0.195426 [0; 1]
Total assets (EUR) 868 940 [12 595; 19 497 927]
37 2534 [25 336; 1 969 743]
162 2962 [13 047; 19 497 927]
Age (years) 55 [21; 87]
52 [21; 85]
57 [21; 87]

112 TAD/CA/APM/WP(2020)2/ANN/FINAL
DRIVERS OF FARM PERFORMANCE Unclassified
Table A D.12.2. Swedish dairy farms: Latent class estimates
LCM panel translog reduced model, 1997 to 2017
Total output Class 1 Class 2 Class 3
Constant 10.4107*** 10.0313*** 10.0180***
Land -0.22194*** -0.24732*** -0.39732
Dairy cows -0.10642 -0.34465*** -0.22756**
Capital -0.29222*** -0.80297*** -0.76935***
Labour 0.53797*** 0.56200*** 0.83515***
Materials -0.59111*** 0.28603*** -0.04910
Land*Land 0.04327*** 0.02830*** 0.06979***
Dairy cows*Dairy cows -0.12738 0.05018*** 0.06412***
Capital*Capital 0.03712*** 0.03152*** 0.02209***
Labour*Labour 0.09360*** -0.07914*** -0.26235***
Materials*Materials 0.05733*** 0.02204*** 0.04729***
Time 0.16042*** 0.14210*** 0.32451***
Time*Time 0.00076 -0.00361*** -0.00422**
Time*Land -0.00749*** 0.00306 -0.00414
Time*Dairy cows 0.03728* 0.00610*** 0.00108
Time*Capital -0.00991*** 0.02642*** 0.03726***
Time*Labour -0.00770* -0.02148*** -0.02800**
Time*Materials -0.00610*** -0.02535*** -0.04416***
Sigma 0.66682*** 0.33625*** 0.47380***
Class Membership Vector
Constant -0.58265 0.53673** ---
Index 1 - Structure 0.16721 -0.37343* ---
Index 2 - Environmental sustainability 0.61063*** -0.37086 ---
Index 3 – Innovation-cooperation-commercialisation 0.15765 0.28895* ---
Index 4 - Technology -0.41783 0.09600** ---
Index 5 - Diversity -0.34995 -0.23111 ---
Index 6 - Individual -0.00942 -0.09106 ---
Index 7 - Location -0.59212*** -0.49567*** ---
Index 8 - Household -0.00704*** 0.08086** ---
Index 9 - Financial -0.15107 0.28940 ---
Log-Likelihood Function -5147.43172
Inf.Cr.AIC / AIC/N 10448.9 / 1.352
Note: *significant at 10%, **significant at 5%, ***significant at 1%.
Source: Estimations.

TAD/CA/APM/WP(2020)2/ANN/FINAL 113
DRIVERS OF FARM PERFORMANCE Unclassified
Table A D.12.3. Swedish dairy farms: Full production function estimates
Fixed-effects panel translog model per class, 1997 to 2017
Total output Class 1 Class 2 Class 3
Land 0.17177** 0.22341 0.49798
Dairy cows 0.05750 0.13893 0.24187
Capital -0.00016 -0.33480** 0.41113
Labour 0.53161*** 0.64530** 0.32936
Materials -0.19499*** -0.61992*** -0.41489
Land*Land 0.02753*** 0.01876** -0.04731
Dairy cows*Dairy cows 0.03094*** 0.05150*** 0.05861***
Capital*Capital 0.01440*** 0.01066*** -0.01919
Labour*Labour 0.03150*** -0.01213 -0.10132*
Materials*Materials 0.03480*** 0.04971*** 0.08640***
Land*Dairy cows -0.02928*** 0.00903 -0.05093
Land*Capital -0.02073*** -0.02452* 0.10806***
Land*Labour -0.00353 -0.01315 -0.10618**
Land*Materials -0.05494*** 0.03231 0.12786*
Dairy cows*Capital 0.00718 -0.00719 0.01057
Dairy cows*Labour -0.00585 -0.02124** -0.01875
Dairy cows*Materials -0.03933*** -0.01658 0.04645
Capital*Labour -0.01755*** 0.01387 -0.04538
Capital*Materials 0.00948 0.05037** -0.07540*
Labour*Materials -0.00466 -0.07351*** 0.00724
Time -0.04416*** 0.10172*** 0.10189**
Time*Time 0.00094*** -0.00216*** -0.00170**
Time*Land 0.00357* 0.00599** 0.01391*
Time*Dairy cows 0.00042 -0.00032 -0.00528*
Time*Capital 0.00571*** 0.01055*** 0.00905*
Time*Labour -0.00346*** -0.01240*** -0.01532***
Time*Materials -0.00352 -0.01078** -0.00415
Number of observations / average group size 2780 / 4.72 3622 / 3.73 1327 / 2.91
R-squared / R-bar squared 0.9305 / 0.9114 0.9659 / 0.9529 0.9736 / 0.9585
Rho squared (residual variation) 0.7389 0.8413 0.9662
R-squared (within groups var) 0.3356 0.5037 0.4888
Hausman Test 344.09*** 256.38*** 446.63***
Note: *significant at 10%, **significant at 5%, ***significant at 1%.
Source: Estimations.

114 TAD/CA/APM/WP(2020)2/ANN/FINAL
DRIVERS OF FARM PERFORMANCE Unclassified
Table A D.12.4. Swedish dairy farms: Elasticities for classes
LCM panel translog reduced model, 1997 to 2017
Wald procedure based on delta method at sample means
Total output Class 1 Class 2 Class 3
Land 0.08798*** 0.06141*** 0.12447**
Dairy cows 0.08077 -0.04632*** -0.09403***
Capital 0.38513*** 0.24262*** 0.18263***
Labour 0.54785*** 0.14729*** 0.33770***
Materials -0.08432*** 0.43797*** 0.39643***
Returns-to-scale 1.01741*** 0.84296*** 0.94720***
Note: *significant at 10%, **significant at 5%, ***significant at 1%.
Source: Estimations.
Table A D.12.5. Swedish dairy farms: Class identification - mean values indices
Mean values1, 1997 to 2017
Class 1: Medium productive (36%)
Class 2: Most productive (46.9%)
Class 3: Least productive (17.1%)
Index 1 - Structure 0.6886 -0.5555 0.0735
Index 2 - Environmental sustainability 0.1928 -0.1166 -0.0856
Index 3 – Innovation-cooperation-commercialisation -0.2586 0.3157 -0.3199
Index 4 - Technology -0.7195 0.5423 0.0272
Index 5 - Diversity -0.8131 0.3138 0.8470
Index 6 - Individual 0.6331 -0.4001 -0.2343
Index 7 - Location -0.1354 -0.2827 1.0553
Index 8 - Household -0.2392 0.0260 -0.0178
Index 9 - Financial -0.3440 0.3595 -0.2605
Note: 1. At class means, scaled values.
Source: Estimations.

TAD/CA/APM/WP(2020)2/ANN/FINAL 115
DRIVERS OF FARM PERFORMANCE Unclassified
12.2. Swedish crop farms
Table A D.12.6. Swedish crop farms: Descriptive statistics
Sample 1997 to 2017
Note: AWU: Annual Work Unit. 1. Values are per year.
Full sample (n = 3939)
1st year (1997, n = 156)
Final year (2017, n = 153)
Statistical measure Mean [Min; Max]
Mean [Min; Max]
Mean [Min; Max]
Variable1
Crop output (EUR) 65 423 [0; 8 067 918]
46 153 [0; 1 274 245]
178 935 [0; 7 983 603]
Total output (EUR) 218 998 [0; 8 136 613]
97 366 [4 536; 677 057]
461 147 [13 789; 8 023 763]
Land (ha) 115.1 [0; 2 434.3]
94.2 [0.2; 457.7]
156.2 [0.2; 2 336.1]
Capital depreciation (EUR) 33 450 [0; 644 703]
24 013 [2 125; 80 315]
50 164 [147; 519 425]
Materials (EUR) 95 268 [0; 3 694 244]
28 224 [3 374; 130 324]
185 702 [0; 3 157 792]
Chemicals cost (EUR) 13 288 [0; 658 442]
7 488 [0; 62 879]
21 440 [0; 658 442]
Hired labour (AWU) 0.5256 [0.0204; 22.3141]
0.1911 [0.01256; 0.5024]
0.7864 [0.0343; 20.9228]
Family labour (AWU) 1.2767 [0.0496; 54.1964]
1.3306 [0.0874; 3.4976]
1.7359 [0.0757; 46.1848]
Organic (0-1 probability) 0.1866 [0; 1]
0 [0; 0]
0.2614 [0; 1]
Total assets (EUR) 824 064 [10 471; 15 761 483]
362 240 [ 54 150; 1 271 057]
1 591 754 [17 230; 11 301 648]
Age (years) 56 [28; 87]
55 [28; 86]
57 [29; 87]

116 TAD/CA/APM/WP(2020)2/ANN/FINAL
DRIVERS OF FARM PERFORMANCE Unclassified
Table A D.12.7. Swedish crop farms: Latent class estimates
LCM panel translog reduced model, 1997 to 2017
Total output Class 1 Class 2 Class 3
Constant 10.8277*** 8.01279*** 9.27233***
Land -0.04073 0.59522*** 0.21032*
Chemicals -0.11763*** 0.06380*** -0.02692
Labour 0.65042*** 0.62767*** 0.40806***
Materials -0.24962*** -0.34036*** -0.38539***
Land*Land 0.01514** -0.00865 -0.00284
Chemicals*Chemicals 0.01870*** -0.00142 0.00954***
Labour*Labour 0.01938 -0.05377*** 0.02135
Materials*Materials 0.02663*** 0.03483*** 0.04150***
Time 0.12875*** 0.23757*** 0.09337***
Time*Time 0.26167D-04 0.00144* 0.00119
Time*Land 0.00538** -0.03216*** -0.00695
Time*Chemicals -0.01253*** -0.00316*** -0.00485***
Time*Labour -0.00364 0.00251 0.00780
Time*Materials -0.00274 -0.00309 -0.00296
Sigma 0.46851*** 0.33497*** 0.58140***
Class Membership Vector
Constant 0.02984 1.48867*** ---
Index 1 - Structure 0.62809*** -0.36101* ---
Index 2 - Environmental sustainability -4.84182*** 0.48507 ---
Index 3 – Innovation-cooperation-commercialisation 2.28615*** 2.51535*** ---
Index 4 - Technology 0.00032 0.01306 ---
Index 5 - Diversity -2.81605*** -2.60744*** ---
Index 6 - Individual -1.63067*** -1.11845*** ---
Index 7 - Location -0.62913*** -0.20451** ---
Index 8 - Household -1.15405*** -0.64541*** ---
Index 9 - Financial -6.60918*** -5.44538*** ---
Log-Likelihood Function -2730.15697
Inf.Cr.AIC / AIC/N 5596.3 / 1.421
Note: *significant at 10%, **significant at 5%, ***significant at 1%.
Source: Estimations.

TAD/CA/APM/WP(2020)2/ANN/FINAL 117
DRIVERS OF FARM PERFORMANCE Unclassified
Table A D.12.8. Swedish crop farms: Full production function estimates
Fixed-effects panel translog model per class, 1997 to 2017
Total output Class 1 Class 2 Class 3
Land -0.07305 -0.32205 0.73529
Chemicals -0.04969** 0.03464 0.02815
Labour 0.07404 0.47578*** 0.92340***
Materials -0.08936*** -0.15376*** -0.10145**
Land*Land 0.03213*** 0.07971*** -0.06990
Chemicals*Chemicals 0.00458** -0.00117 0.00209
Labour*Labour 0.03220 -0.01604 0.06266
Materials*Materials 0.01296*** 0.02784*** 0.02170***
Land*Chemicals 0.00426 0.00648 -0.00176
Land*Labour -0.03468* -0.02746 -0.11901
Land*Materials -0.00576** -0.01520** -0.01512
Chemicals*Labour 0.01197 0.01179 -0.00417
Chemicals*Materials -0.00104 -0.00402* -0.00102
Labour*Materials 0.00388 -0.00926 0.00957
Time 0.01958 0.09694*** -0.06058**
Time*Time 0.00112* 0.00131** 0.00210***
Time*Land 0.00265 -0.00593 0.02104***
Time*Chemicals -0.00290** -0.00162* -0.00251**
Time*Labour 0.01024* 0.00204 -0.00684
Time*Materials -0.00212* -0.00418** -0.00429
Number of observations / average group size 987 / 2.52 1352 / 2.91 1600 / 3.04
R-squared / R-bar squared 0.9781 / 0.9624 0.9809 / 0.9702 0.8871 / 0.8285
Rho squared (residual variation) 0.9249 0.8466 0.7708
R-squared (within groups var) 0.2973 0.6027 0.1789
Hausman Test 232.74*** 142.67*** 84.38***
Note: *significant at 10%, **significant at 5%, ***significant at 1%.
Source: Estimations.
Table A D.12.9. Swedish crop farms: Elasticities for classes
LCM panel translog reduced model, 1997 to 2017
Wald procedure based on delta method at sample means
Total output Class 1 Class 2 Class 3
Land 0.12127*** 0.10275*** 0.10544***
Chemicals 0.09184*** 0.00038 0.04424***
Labour 0.64423*** 0.59533*** 0.50065***
Materials 0.06349*** 0.31573*** 0.29237***
Returns-to-scale 0.92083*** 1.01418*** 0.94271***
Note: *significant at 10%, **significant at 5%, ***significant at 1%.
Source: Estimations.

118 TAD/CA/APM/WP(2020)2/ANN/FINAL
DRIVERS OF FARM PERFORMANCE Unclassified
Table A D.12.10. Swedish crop farms: Class identification - mean values indices
Mean values1, 1997 to 2017
Class 1: Medium productive (25.1%)
Class 2: Most productive (34.3%)
Class 3: Least productive (40.6%)
Index 1 - Structure 0.3008 -0.4505 0.1951
Index 2 - Environmental sustainability -0.3483 0.1396 0.0969
Index 3 – Innovation-cooperation- commercialisation -0.0260 0.5289 -0.4309
Index 4 - Technology 0.7953 -0.0976 -0.1365
Index 5 - Diversity -0.9789 0.0093 0.5960
Index 6 - Individual -0.4333 0.0860 0.1946
Index 7 - Location -0.3213 0.0891 0.1229
Index 8 - Household -0.1616 -0.1687 0.2422
Index 9 - Financial -0.1828 -0.2966 0.3634
Note: 1. At class means, scaled values.
Source: Estimations.

TAD/CA/APM/WP(2020)2/ANN/FINAL 119
DRIVERS OF FARM PERFORMANCE Unclassified
13. United Kingdom
13.1. UK dairy farms
Table A D.13.1. UK dairy farms: Descriptive statistics
Sample 1995 to 2017
Note: AWU: Annual Work Unit. LU per ha: Livestock Unit per hectare. 1. Values are per year.
Full Sample (n = 11 334)
1st Year (1995, n = 669)
Final Year (2017, n = 345)
Statistical Measure Mean [Min; Max]
Mean [Min; Max]
Mean [Min; Max]
Variable1
Milk output (EUR) 194 951 [0; 1 908 241]
144 292 [2 361; 795 473]
373 570 [30 572; 1 908 241]
Total output (EUR) 259 427 [0; 2 209 348]
190 774 [0; 947 331]
496 102 [66 037; 2 209 348]
Dairy cows (number) 119.1 [0; 922.5]
96.9 [12.5; 578]
170.4 [29.8; 868.1]
Capital depreciation (EUR) 22 744 [0; 239 648]
15 297 [805; 117 919]
39 988 [2 922; 176 670]
Fodder cost (EUR) 70 931 [0; 908 660]
41 675 [0; 265 347]
19 147 [0; 111 399]
Materials (EUR) 26 265 [0; 272 917]
15 765 [833; 70 540]
50 173 [5 488; 257 890]
Hired labour (AWU) 0.2335 [0.0008; 2.3951]
0.2436 [0.0591; 2.0902]
0.4553 [0.1048; 1.7441]
Family labour (AWU) 2.8122 [0.0092; 28.8449]
2.7643 [0.6709; 23.7198]
3.0635 [0.7052; 11.7359]
Land (ha) 106.1 [0; 1 131.1]
87.2 [9.5; 497.2]
134.4 [16.6; 565.9]
Stocking density (LU per ha) 1.28 [0; 6.00]
1.24 [0.25; 3.63]
1.41 [0.34; 4.80]
Chemicals cost (EUR) 13 699 [0; 148 675]
11 157 [0; 62 251]
19 147 [0; 111 399]
Organic (0-1 probability) 0.0352 [0; 1]
0 [0; 0]
0.1188 [0; 1]
Total assets (EUR) 1 017 505 [11 043; 10 351 903]
722 355 [11 043; 3 894 874]
2 016 234 [97 051; 8 421 687]
Age (years) 53 [20; 88]
54 [25; 89]
57 [26; 87]

120 TAD/CA/APM/WP(2020)2/ANN/FINAL
DRIVERS OF FARM PERFORMANCE Unclassified
Table A D.13.2. UK dairy farms: Latent class estimates
LCM panel translog reduced model, 1995 to 2017
Total output Class 1 Class 2 Class 3
Constant 9.48602*** 9.29159*** 9.30641***
Land 0.14345*** 0.19705* 0.13030
Dairy cows -0.50862*** -0.17157* -0.22724***
Capital 0.01612 -0.01058 -0.09482***
Labour 0.13787*** 0.36495*** 0.28973***
Materials -0.38817*** -0.14194*** -0.18203***
Land*Land -0.02188*** -0.02180* -0.02841*
Dairy cows*Dairy cows 0.12188*** 0.06218*** 0.06677***
Capital*Capital 0.01692*** 0.00373 0.01488***
Labour*Labour 0.00093 -0.06625*** -0.08888***
Materials*Materials 0.04021*** 0.02408*** 0.03438***
Time 0.06247*** -0.00092 0.08694***
Time*Time 0.00118*** -0.00057*** 0.00139***
Time*Land 0.00967*** 0.01069*** 0.01223***
Time*Dairy cows -0.00813*** -0.00417 -0.00910*
Time*Capital -0.00713*** 0.00243 -0.01002***
Time*Labour 0.00287 -0.00655* 0.00482
Time*Materials -0.00153*** -0.00104 -0.00224**
Sigma 0.29730*** 0.22311*** 0.24533***
Class Membership Vector
Constant -0.25391 0.23026 ---
Index 1 - Structure 0.19072* -0.10001 ---
Index 2 - Environmental sustainability -0.00571*** 0.01449 ---
Index 3 - Innovation-cooperation-commercialisation 0.00073 0.00501 ---
Index 4 - Technology -0.00205*** -0.00289*** ---
Index 5 - Diversity 0.17582** -0.07131 ---
Index 6 - Individual -0.03802 0.12667 ---
Index 7 - Location -0.03011 0.13890 ---
Index 8 - Household 0.07759 -0.06090 ---
Index 9 - Financial 0.00223*** 0.00575* ---
Log-Likelihood Function -441.83761
Inf.Cr.AIC / AIC/N 1037.7 / 0.092
Note: *significant at 10%, **significant at 5%, ***significant at 1%.
Source: Estimations.

TAD/CA/APM/WP(2020)2/ANN/FINAL 121
DRIVERS OF FARM PERFORMANCE Unclassified
Table A D.13.3. UK dairy farms: Full production function estimates
Fixed-effects panel translog model per class, 1995 to 2017
Total output Class 1 Class 2 Class 3
Land -0.33248 -0.16710 -0.14497
Dairy cows -0.06771 0.62640*** 0.15318
Capital 0.06701 -0.24302*** 0.03722
Labour -0.30326*** -0.29987*** -0.18390**
Materials 0.49842 0.45193** 0.61987**
Land*Land 0.14693*** 0.07466*** -0.00239
Dairy cows*Dairy cows 0.12497*** 0.02524 0.29803***
Capital*Capital 0.02598*** 0.03089*** 0.00650
Labour*Labour 0.03226*** 0.02894*** 0.02979***
Materials*Materials 0.10417 0.05785** 0.03446
Land*Dairy cows -0.09229 -0.05220 -0.27127***
Land*Capital -0.05665 -0.01483 0.13094***
Land*Labour -0.01091* 0.00025 0.01653
Land*Materials -0.05971 -0.06860* 0.01549
Dairy cows*Capital 0.00697 -0.03124** -0.12075***
Dairy cows*Labour -0.00717 0.00115 -0.00416
Dairy cows*Materials -0.01346 0.01368 0.08429
Capital*Labour 0.00649** -0.00029 0.00080
Capital*Materials -0.03053 -0.00901 -0.09049***
Labour*Materials 0.01622** -0.00125 -0.02244
Time 0.05854*** 0.05841*** 0.06341**
Time*Time 0.00075*** -0.00088*** 0.00571***
Time*Land 0.01156*** 0.37532D-04 0.01227***
Time*Dairy cows -0.00107 0.00038 -0.00910
Time*Capital -0.01103*** -0.00236** -0.01367***
Time*Labour -0.00202*** 0.00104 -0.00307
Time*Materials 0.00615 -0.00529** -0.00193
Number of observations / average group size 3128 / 2.44 6222 / 4.87 1984 / 3.05
R-squared / R-bar squared 0.9624 / 0.9351 0.9711 / 0.9634 0.9671 / 0.9504
Rho squared (residual variation) 0.8289 0.6311 0.9164
R-squared (within groups var) 0.5623 0.7181 0.5589
Hausman Test 128.13*** 157.91*** 177.68***
Note: *significant at 10%, **significant at 5%, ***significant at 1%.
Source: Estimations.

122 TAD/CA/APM/WP(2020)2/ANN/FINAL
DRIVERS OF FARM PERFORMANCE Unclassified
Table A D.13.4. UK dairy farms: Elasticities for classes
LCM panel translog reduced model, 1995 to 2017
Wald procedure based on delta method at sample means
Total output Class 1 Class 2 Class 3
Land 0.04674*** 0.13467*** -0.04577
Dairy cows 0.37610*** 0.37087*** 0.31415***
Capital 0.26446*** 0.09516*** 0.12754***
Labour 0.16538*** 0.13324*** 0.15293***
Materials -0.09250*** 0.35164*** 0.48565***
Returns-to-scale 0.76019*** 1.08557*** 1.03451***
Note: *significant at 10%, **significant at 5%, ***significant at 1%.
Source: Estimations.
Table A D.13.5. UK dairy farms: Class identification - mean values indices
Mean values1, 1995 to 2017
Class 1: Least productive (27.6%)
Class 2: Most productive (54.9%)
Class 3: Medium productive (17.5%)
Index 1 - Structure 0.4878 -0.3166 0.2239
Index 2 - Environmental sustainability 0.4292 -0.0346 -0.1172
Index 3 - Innovation-cooperation-commercialisation -0.4167 0.3625 -0.5173
Index 4 - Technology -0.4642 0.4791 -0.5218
Index 5 - Diversity 0.1787 -0.0291 -0.1904
Index 6 - Individual -0.3637 0.4662 -0.8886
Index 7 - Location -0.3790 0.5056 -0.9882
Index 8 - Household 0.0864 -0.0873 0.1377
Index 9 - Financial -0.3598 0.2879 -0.4557
Note: 1. At class means, scaled values.
Source: Estimations.

TAD/CA/APM/WP(2020)2/ANN/FINAL 123
DRIVERS OF FARM PERFORMANCE Unclassified
13.2. UK cereal farms
Table A D.13.6. UK cereal farms: Descriptive statistics
Sample 1995 to 2017
Note: AWU: Annual Work Unit. 1. Values are per year.
Full sample (n = 14 196)
1st year (1995, n = 747)
Final year (2017, n = 515)
Statistical measure Mean [Min; Max]
Mean [Min; Max]
Mean [Min; Max]
Variable1
Crop output (EUR) 223 114 [0; 10 264 243]
179 007 [ 7754; 3 348 878]
355 561 [1 825; 7 262 165]
Total output (EUR) 306 785 [0; 11 569 591]
222 890 [11 706; 3 360 371]
505 511 [9 939; 7 612 862]
Land (ha) 246.0 [5.4; 4 624.0]
208.2 [5.8; 1 416.6]
283.2 [15.8; 2 727.9]
Capital depreciation (EUR) 36 668 [0; 739 067]
27 504 [0; 273 240]
56 1251 [0; 739 067]
Materials (EUR) 3 522 [0; 170 192]
3 280 [0; 70 739]
3 722 [0; 98 921]
Chemicals cost (EUR) 53 674 [0; 1 950 462]
34 412 [0; 285 019]
83 394 [0; 802 975]
Hired labour (AWU) 0.3662 [0.0005; 16.1458]
0.6091 [0.0016; 16.1458]
0.3433 [0.0005; 10.8521]
Family labour (AWU) 2.8482 [0.0041; 119.9759]
2.8622 [0.0075; 75.8692]
3.0439 [0.0041; 96.2314]
Organic (0-1 probability) 0.0227 [0; 1]
0 [0; 0]
0.0466 [0; 1]
Total assets (EUR) 1 895 239 [0; 53 800 178]
95 0254 [8 932; 6 035 455]
3 909 709 [31 632; 51 497 347]
Age (years) 55 [22; 89]
58 [22; 86]
59 [28; 97]

124 TAD/CA/APM/WP(2020)2/ANN/FINAL
DRIVERS OF FARM PERFORMANCE Unclassified
Table A D.13.7. UK cereal farms: Latent class estimates
LCM panel translog reduced model, 1995 to 2017
Total output Class 1 Class 2 Class 3
Constant 8.30488*** 7.42450*** 8.43100***
Land 0.96281*** 0.48712*** 1.08069***
Capital -0.07991*** -0.20139*** -0.15052***
Labour 0.23606*** 0.38921*** 0.23907***
Chemicals -0.29283*** 0.02766 -0.32438***
Materials -0.04259*** -0.09367*** -0.03741***
Land*Land -0.06151*** -0.06816*** -0.08331***
Capital*Capital 0.01149*** 0.02250*** 0.01404***
Labour*Labour 0.03971*** 0.04692*** 0.06075***
Chemicals*Chemicals 0.02383*** 0.02571*** 0.03244***
Materials*Materials 0.00454*** 0.01091*** 0.00459***
Time 0.02421*** 0.16589*** -0.21015***
Time*Time -0.00179*** 0.00038 0.00709***
Time*Land 0.00944*** 0.02438*** 0.01769***
Time*Capital -0.00291*** -0.00725*** -0.00175
Time*Labour -0.00419*** -0.00449* -0.00934***
Time*Chemicals 0.00255*** -0.01788*** 0.00464***
Time*Materials -0.38969D-04 0.00030 -0.00065
Sigma 0.24097*** 0.54513*** 0.32373***
Class Membership Vector
Constant 1.95921*** -3.51129*** ---
Index 1 - Structure 0.13577 0.89839*** ---
Index 2 - Environmental sustainability -1.19754*** -1.67551*** ---
Index 3 - Innovation-cooperation-commercialisation 0.00250*** 0.00208** ---
Index 4 - Technology 0.83104*** 4.56886*** ---
Index 5 - Diversity 0.52045*** -0.91889*** ---
Index 6 - Individual 0.40767*** 1.40242*** ---
Index 7 - Location 2.12546*** 1.04725*** ---
Index 8 - Household -0.10482 0.83385*** ---
Index 9 - Financial 0.01052 -0.06203 ---
Log-Likelihood Function -2684.17820
Inf.Cr.AIC / AIC/N 5522.4 / 0.389
Note: *significant at 10%, **significant at 5%, ***significant at 1%.
Source: Estimations.

TAD/CA/APM/WP(2020)2/ANN/FINAL 125
DRIVERS OF FARM PERFORMANCE Unclassified
Table A D.13.8. UK cereal farms: Full production function estimates
Fixed-effects panel translog model per class, 1995 to 2017
Total output Class 1 Class 2 Class 3
Land 0.38440*** 0.95770** 0.51529**
Capital -0.07815 -0.38701*** 0.00059
Labour 0.33373*** 0.93083*** 0.08254
Chemicals -0.09203 -0.31124 0.01969
Materials 0.01617 0.18733*** -0.00837
Land*Land -0.01584 -0.04278 -0.03929*
Capital*Capital 0.00839*** -0.00397 0.01740***
Labour*Labour 0.05624*** 0.02465** 0.04357***
Chemicals*Chemicals 0.02630*** 0.01648*** 0.01517***
Materials*Materials 0.00460*** 0.01186*** 0.00495***
Land*Capital 0.00309 -0.04918** 0.02142
Land*Labour -0.08434*** -0.02461 0.02305
Land*Chemicals -0.00368 0.01169 0.00592
Land*Materials -0.00063 0.03732*** -0.00662*
Capital*Labour 0.00671 0.00749 -0.00850
Capital*Chemicals -0.00216 0.06074*** -0.01868**
Capital*Materials -0.00499*** 0.00829** -0.00179
Labour*Chemicals 0.01181 -0.07179*** -0.00205
Labour*Materials 0.00064 -0.05202*** 0.00081
Chemicals*Materials 0.00342* -0.00419 0.00453
Time 0.13952*** -0.08881*** 0.01356
Time*Time -0.00202*** 0.00460*** 0.00107***
Time*Land 0.01162*** 0.00766 0.01266***
Time*Capital 0.00162 0.00381** -0.01004***
Time*Labour 0.00027 0.00412 -0.00128
Time*Chemicals -0.01305*** -0.00701* -0.20857D-04
Time*Materials -0.00028 -0.00027 0.00063**
Number of observations / average group size 6968 / 3.93 1132 / 2.99 6096 / 2.38
R-squared / R-bar squared 0.9822 / 0.9759 0.9455 / 0.9174 0.9905 / 0.9834
Rho squared (residual variation) 0.7948 0.7832 0.8050
R-squared (within groups var) 0.5746 0.2957 0.4941
Hausman Test 439.95*** 299.74*** 412.73***
Note: *significant at 10%, **significant at 5%, ***significant at 1%.
Source: Estimations.

126 TAD/CA/APM/WP(2020)2/ANN/FINAL
DRIVERS OF FARM PERFORMANCE Unclassified
Table A D.13.9. UK cereal farms: Elasticities for classes
LCM panel translog reduced model, 1995 to 2017
Wald procedure based on delta method at sample means
Total output Class 1 Class 2 Class 3
Land 0.47028*** 0.16049*** 0.31638***
Capital 0.10199*** 0.15290*** 0.11275***
Labour 0.21923*** 0.43206*** 0.27921***
Chemicals 0.25084*** 0.32389*** 0.35387***
Materials -0.00657*** -0.02315** -0.00182
Returns-to-scale 1.03577*** 1.04620*** 1.06039***
Note: *significant at 10%, **significant at 5%, ***significant at 1%.
Source: Estimations.
Table A D.13.10. UK cereal farms: Class identification - mean values indices
Mean values1, 1995 to 2017
Class 1: Most productive (49.1%)
Class 2: Medium productive (8.0%)
Class 3: Least productive (42.9%)
Index 1 - Structure -0.1305 0.3184 0.0900
Index 2 - Environmental sustainability -0.1192 -1.2213 0.3631
Index 3 - Innovation-cooperation-commercialisation 0.3938 0.1148 -0.4823
Index 4 - Technology -0.0092 0.2023 -0.0271
Index 5 - Diversity 0.5828 -0.4305 -0.5862
Index 6 - Individual 0.9430 0.1679 -1.1090
Index 7 - Location 0.1199 0.0247 -0.1416
Index 8 - Household -0.1422 0.1257 0.1393
Index 9 - Financial 0.2329 -0.1754 -0.2429
Note: 1. At class means, scaled values.
Source: Estimations.

TAD/CA/APM/WP(2020)2/ANN/FINAL 127
DRIVERS OF FARM PERFORMANCE Unclassified
13.3. UK mixed crop and livestock farms
Table A D.13.11. UK mixed crop and livestock farms: Descriptive statistics
Sample 1995 to 2017
Note: AWU: Annual Work Unit. LU per ha: Livestock Unit per hectare. 1. Values are per year.
Full sample (n = 4 061)
1st year (1995, n = 309)
Final year (2017, n = 194)
Statistical measure Mean [Min; Max]
Mean [Min; Max]
Mean [Min; Max]
Variable1
Crop output (EUR) 130 414 [0; 3 421 822]
66 027 [0; 472 752]
134 470 [0; 1 430 406]
Livestock output (EUR) 282 697 [0; 2 877 746]
147 453 [3 540; 1 293 517]
171 441 [0; 2 017 617]
Total output (EUR) 482 253 [7 024; 6 692 332]
222 875 [8 057; 1 576 356]
356 843 [28 639; 2 932 713]
Land (ha) 208.9 [0.6; 1 278.3]
156.24 [0.6; 1 082.7]
198.6 [27.4; 1 035.4]
Livestock Units (number) 247.083 [3.24; 2 601]
184.608 [8.85; 1 081.955]
149.643 [10.2; 893.86]
Capital depreciation (EUR) 43 838 [273; 612 719]
19 961 [0; 134 896]
42 114 [564; 612 719]
Hired labour (AWU) 0.4819 [0.0057; 4.4609]
0.1977 [0.0345; 1.2412]
0.1736 [0.0206; 0.8048]
Family labour (AWU) 3.7197 [0.0443; 34.4291]
3.2771 [0.5727; 20.5769]
2.6679 [0.3171; 12.3738]
Materials (EUR) 32 021 [0; 187 732]
14 271 [49; 107 813]
21 530 [0; 151 870]
Stocking density (LU per ha) 2.13 [0.02; 140.17]
1.89 [0.20; 140.17]
0.86 [0.07; 3.47]
Organic (0-1 probability) 0.0069 [0; 1]
0 [0;1]]
0.1289 [0; 1]
Total assets (EUR) 2 037 169 [49 133; 16 499 848]
817 632 [11 421; 10 331 958]
2 591 980 [153 848; 16 499 848]
Age (years) 55 [23; 87]
57 [26; 89]
59 [23, 89]

128 TAD/CA/APM/WP(2020)2/ANN/FINAL
DRIVERS OF FARM PERFORMANCE Unclassified
Table A D.13.12. UK mixed crop and livestock farms: Latent class estimates
LCM panel translog reduced model, 1995 to 2017
Total output Class 1 Class 2 Class 3
Constant 9.51781*** 9.26260*** 9.04338***
Land 0.04293 -0.13707 0.12749
Capital 0.03210 -0.35359*** -0.25607***
Labour 0.28530** 0.63464*** 0.43056***
Livestock -0.07739 0.63218** -0.05077
Land*Land -0.00329 0.01441 -0.00050
Capital*Capital 0.02084 0.03449*** 0.03562***
Labour*Labour -0.02240 0.00362 0.09397***
Livestock*Livestock 0.02045 -0.02684 0.02236
Time 0.00291 -0.08242 0.08375**
Time*Time 0.00042 0.00692*** -0.00157***
Time*Land 0.00302 0.00423 0.01450**
Time*Capital -0.00484 0.00112 -0.01041**
Time*Labour 0.01851*** -0.01211 -0.01868***
Time*Livestock 0.00128 -0.00671 0.00717
Sigma 0.38162*** 0.51336*** 0.32114***
Class Membership Vector
Constant -0.44938 -1.42759***
Index 1 - Structure -0.57299*** 0.07750
Index 2 - Environmental sustainability -0.73637*** -0.17450
Index 3 - Innovation-cooperation-commercialisation -0.03019 -0.03539
Index 4 - Technology 0.33538** 0.01515
Index 5 - Diversity -0.89522*** -0.08912
Index 6 - Individual -0.07590 -0.42470
Index 7 - Location 0.15501 -0.96490***
Index 8 - Household 0.27503 0.39570
Index 9 - Financial 0.07949 -0.07599
Log-Likelihood Function -1666.26278
Inf.Cr.AIC / AIC/N 3468.5 / 0.854
Note: *significant at 10%, **significant at 5%, ***significant at 1%.
Source: Estimations.

TAD/CA/APM/WP(2020)2/ANN/FINAL 129
DRIVERS OF FARM PERFORMANCE Unclassified
Table A D.13.13. UK mixed crop and livestock farms: Full production function estimates
Fixed-effects panel translog model per class, 1995 to 2017
Total output Class 1 Class 2 Class 3
Land -1.11251*** 0.34676 0.02005
Capital -0.24801 0.80235 0.16533
Labour 0.74439 1.32478 -0.18409
Livestock 0.07494 0.15050 0.79024***
Land*Land 0.07829*** -0.01474 0.12782***
Capital*Capital 0.02091 -0.02596 0.00337
Labour*Labour 0.02146 0.27930 -0.06130
Livestock*Livestock -0.00567 -0.10066 -0.06172***
Land*Capital 0.03098 -0.06264 -0.08023***
Land*Labour -0.07392 -0.34520 -0.16087***
Land*Livestock 0.04216 0.25863 -0.06275
Capital*Labour -0.05601 0.08724 0.05866*
Capital*Livestock -0.00786 -0.02001 0.04301
Labour*Livestock 0.05956 -0.15462 0.15061***
Time 0.06474** -0.20569** 0.12691***
Time*Time 0.00065*** 0.00901*** -0.00338***
Time*Land -0.00185 -0.00782 0.01250***
Time*Capital -0.00660** 0.00066 0.00076
Time*Labour 0.00629 0.00525 -0.00352
Time*Livestock 0.00169 0.02470 -0.01242***
Number of observations / average group size 1149 / 2.70 1187 / 1.91 1726 / 3.12
R-squared / R-bar squared 0.9811 / 0.9691 0.9196 / 0.8258 0.9708 / 0.9563
Rho squared (residual variation) 0.9222 0.6874 0.8621
R-squared (within groups var) 0.4388 0.1318 0.3131
Hausman Test 134.18*** 37.29** 146.02***
Note: *significant at 10%, **significant at 5%, ***significant at 1%.
Source: Estimations.
Table A D.13.14. UK mixed crop and livestock farms: Elasticities for classes
LCM panel translog reduced model, 1995 to 2017
Wald procedure based on delta method at sample means
Total output Class 1 Class 2 Class 3
Land 0.05400* 0.02206 0.36526***
Capital 0.39059*** 0.29891*** 0.26082***
Labour 0.49968*** 0.57586*** 0.24665***
Livestock 0.15234*** 0.34281*** 0.27453***
Returns-to-scale 1.09661*** 1.23964*** 1.11916***
Note: *significant at 10%, **significant at 5%, ***significant at 1%.
Source: Estimations.
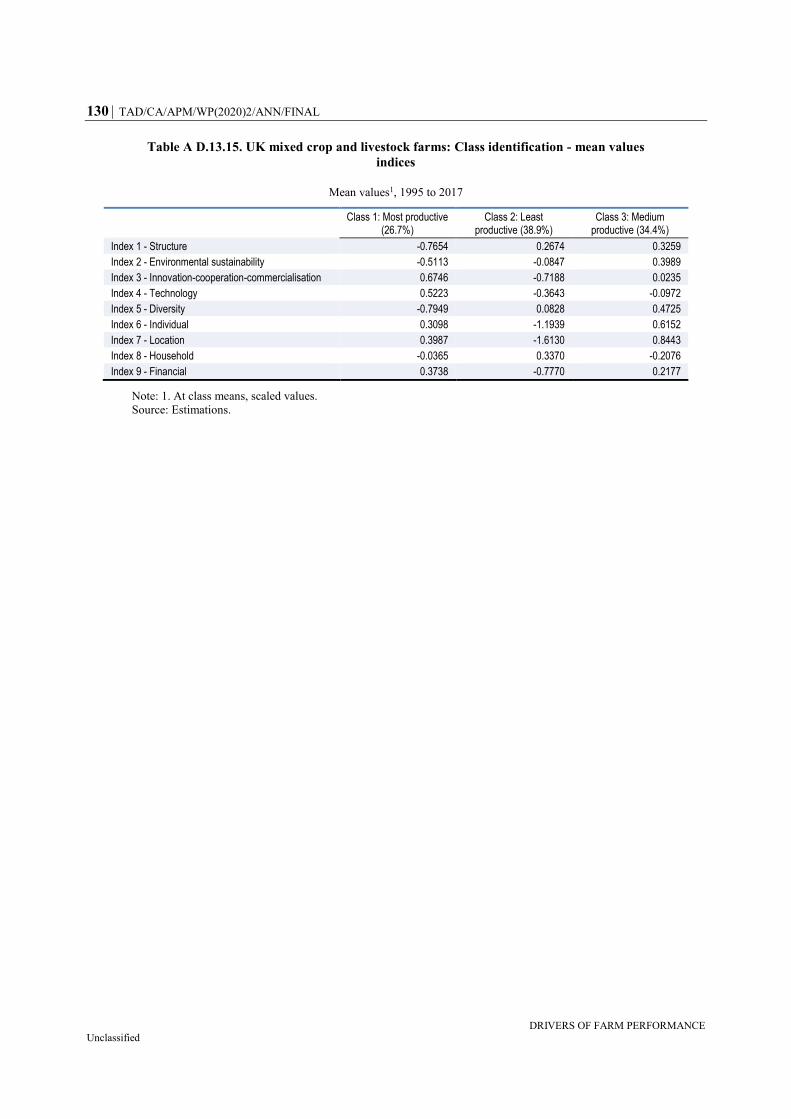
130 TAD/CA/APM/WP(2020)2/ANN/FINAL
DRIVERS OF FARM PERFORMANCE Unclassified
Table A D.13.15. UK mixed crop and livestock farms: Class identification - mean values
indices
Mean values1, 1995 to 2017
Class 1: Most productive (26.7%)
Class 2: Least productive (38.9%)
Class 3: Medium productive (34.4%)
Index 1 - Structure -0.7654 0.2674 0.3259
Index 2 - Environmental sustainability -0.5113 -0.0847 0.3989
Index 3 - Innovation-cooperation-commercialisation 0.6746 -0.7188 0.0235
Index 4 - Technology 0.5223 -0.3643 -0.0972
Index 5 - Diversity -0.7949 0.0828 0.4725
Index 6 - Individual 0.3098 -1.1939 0.6152
Index 7 - Location 0.3987 -1.6130 0.8443
Index 8 - Household -0.0365 0.3370 -0.2076
Index 9 - Financial 0.3738 -0.7770 0.2177
Note: 1. At class means, scaled values.
Source: Estimations.

TAD/CA/APM/WP(2020)2/ANN/FINAL 131
DRIVERS OF FARM PERFORMANCE Unclassified
13.4. UK pig farms
Table A D.13.16. UK pig farms: Descriptive statistics
Sample 1995 to 2017
Note: AWU: Annual Work Unit. LU per ha: Livestock Unit per hectare. 1. Values are per year.
Full sample (n = 1 723)
1st year (1995, n = 76)
Final year (2017, n = 68)
Statistical measure Mean [Min; Max]
Mean [Min; Max]
Mean [Min; Max]
Variable1
Livestock output (EUR) 458 481 [0; 22 344 642]
302 752 [23 826; 1 185 602]
895 053 [0; 21 369 219]
Total output (EUR) 500 040 [4 800; 23 003 081]
318 726 [25 379; 1 233 729]
1 006 305 [7 386; 21 400 826]
Land (ha) 41.4 [0; 795.5]
20.2 [0; 185.2]
82.0 [0; 795.4]
Livestock Units (n) 438.8 [0.9; 13 784.0]
279.6 [29.4; 1 153.8]
792.9 [31.6; 13 784.0]
Capital depreciation (EUR) 31 903 [0; 2 999 868]
13 078 [1 526; 60 569]
97 574 [117; 2 999 868]
Hired labour (AWU) 0.5274 [0.0407; 9.9917]
0.6361 [0.1614; 2.5786]
1.1367 [0.1004; 14.8174]
Family labour (AWU) 3.4905 [0.2693; 66.1333]
2.6779 [0.6795; 10.8568]
4.0072 [0.3541; 52.2331]
Materials (EUR) 43 788 [0; 1 995 256]
18 984 [970; 75 974]
86 228 [0; 1 877 663]
Stocking density (LU per ha) 56.86 [0; 4 363.2]
106.04 [0; 4 124.45]
39.12 [0; 977.83]
Organic (0-1 probability) 0.0023 [0; 1]
0 [0; 0]
0.0147 [0; 1]
Total assets (EUR) 813 888 [2 517; 25 239 396]
391 500 [48 812; 1 925 925]
2 209 997 [45 008; 25 239 396]
Age (years) 52 [24; 85]
49 [25; 79]
57 [40, 73]

132 TAD/CA/APM/WP(2020)2/ANN/FINAL
DRIVERS OF FARM PERFORMANCE Unclassified
Table A D.13.17. UK pig farms: Latent class estimates
LCM panel translog reduced model, 1995 to 2017
Total output Class 1 Class 2 Class 3
Constant 10.4023*** 4.42434*** 8.10375***
Land -0.11139*** -0.01347 -0.45919***
Capital 0.01393 0.20049*** -0.01221
Labour 0.63354*** 0.02313 1.42458***
Livestock -0.12216* 0.43032*** 0.07632
Material -0.45191*** 0.05911 0.08680
Land*Land 0.01281*** 0.01021*** 0.11786***
Capital*Capital 0.01897** -0.00896*** -0.01707*
Labour*Labour -0.09364*** 0.04253*** -0.26440***
Livestock*Livestock 0.00099 -0.05082*** -0.00061
Material*Material 0.03852*** 0.03680*** 0.01515
Time 0.21245*** 0.07390*** -0.00139
Time*Time -0.00012 0.00061*** -0.00567***
Time*Land 0.00236* 0.41361D-04 -0.00081
Time*Capital -0.01612*** 0.00064 0.02076***
Time*Labour 0.00772** 0.00344 -0.01442
Time*Livestock 0.00777*** 0.01963*** 0.00787
Time*Material -0.00670*** -0.01673*** -0.00276
Sigma 0.20180*** 0.13468*** 0.24595***
Class Membership Vector
Constant 2.48127*** 3.11818*** ---
Index 1 - Structure -1.43599*** -0.60456 ---
Index 2 - Environmental sustainability 0.91476*** 1.00186*** ---
Index 3 - Innovation-cooperation-commercialisation 0.00114* 0.00157*** ---
Index 4 - Technology 1.87048*** 1.70000*** ---
Index 5 - Diversity 0.58404*** -0.42199** ---
Index 6 - Individual 0.56844 0.13353 ---
Index 7 - Location -1.18870*** -0.81064*** ---
Index 8 - Household -0.48863** -0.39600** ---
Index 9 - Financial 0.00014 -0.00032 ---
Log-Likelihood Function 275.11309
Inf.Cr.AIC / AIC/N -396.2 / -0.230
Note: *significant at 10%, **significant at 5%, ***significant at 1%.
Source: Estimations.
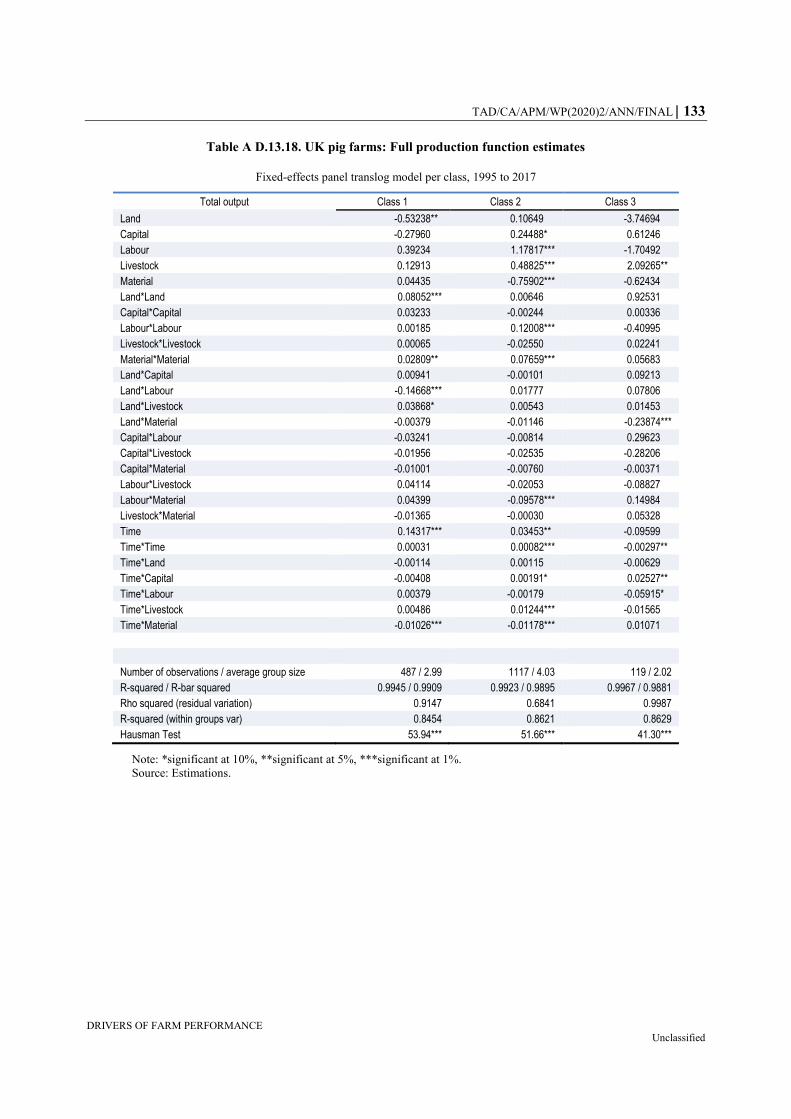
TAD/CA/APM/WP(2020)2/ANN/FINAL 133
DRIVERS OF FARM PERFORMANCE Unclassified
Table A D.13.18. UK pig farms: Full production function estimates
Fixed-effects panel translog model per class, 1995 to 2017
Total output Class 1 Class 2 Class 3
Land -0.53238** 0.10649 -3.74694
Capital -0.27960 0.24488* 0.61246
Labour 0.39234 1.17817*** -1.70492
Livestock 0.12913 0.48825*** 2.09265**
Material 0.04435 -0.75902*** -0.62434
Land*Land 0.08052*** 0.00646 0.92531
Capital*Capital 0.03233 -0.00244 0.00336
Labour*Labour 0.00185 0.12008*** -0.40995
Livestock*Livestock 0.00065 -0.02550 0.02241
Material*Material 0.02809** 0.07659*** 0.05683
Land*Capital 0.00941 -0.00101 0.09213
Land*Labour -0.14668*** 0.01777 0.07806
Land*Livestock 0.03868* 0.00543 0.01453
Land*Material -0.00379 -0.01146 -0.23874***
Capital*Labour -0.03241 -0.00814 0.29623
Capital*Livestock -0.01956 -0.02535 -0.28206
Capital*Material -0.01001 -0.00760 -0.00371
Labour*Livestock 0.04114 -0.02053 -0.08827
Labour*Material 0.04399 -0.09578*** 0.14984
Livestock*Material -0.01365 -0.00030 0.05328
Time 0.14317*** 0.03453** -0.09599
Time*Time 0.00031 0.00082*** -0.00297**
Time*Land -0.00114 0.00115 -0.00629
Time*Capital -0.00408 0.00191* 0.02527**
Time*Labour 0.00379 -0.00179 -0.05915*
Time*Livestock 0.00486 0.01244*** -0.01565
Time*Material -0.01026*** -0.01178*** 0.01071
Number of observations / average group size 487 / 2.99 1117 / 4.03 119 / 2.02
R-squared / R-bar squared 0.9945 / 0.9909 0.9923 / 0.9895 0.9967 / 0.9881
Rho squared (residual variation) 0.9147 0.6841 0.9987
R-squared (within groups var) 0.8454 0.8621 0.8629
Hausman Test 53.94*** 51.66*** 41.30***
Note: *significant at 10%, **significant at 5%, ***significant at 1%.
Source: Estimations.

134 TAD/CA/APM/WP(2020)2/ANN/FINAL
DRIVERS OF FARM PERFORMANCE Unclassified
Table A D.13.19. UK pig farms: Elasticities for classes
LCM panel translog reduced model, 1995 to 2017
Wald procedure based on delta method at sample means
Total output Class 1 Class 2 Class 3
Land 0.05576*** 0.02743*** -0.06798***
Capital 0.05620 0.04095*** -0.04972
Labour 0.55756*** 0.13884*** 0.94801***
Livestock 0.06884** 0.07849*** 0.16316***
Material 0.29066*** 0.75913*** 0.36222***
Returns-to-scale 1.02902*** 1.04484*** 1.35568***
Note: *significant at 10%, **significant at 5%, ***significant at 1%.
Source: Estimations.
Table A D.13.20. UK pig farms: Class identification - mean values indices
Mean values1, 1995 to 2017
Class 1: Most productive (28.3%)
Class 2: Medium productive (64.8%)
Class 3: Least productive (6.9%)
Index 1 - Structure -0.6602 0.2223 0.6147
Index 2 - Environmental sustainability -0.2218 0.1646 -0.6373
Index 3 - Innovation-cooperation-commercialisation 0.7017 -0.2994 -0.4508
Index 4 - Technology 0.4337 -0.1254 -0.5977
Index 5 - Diversity 0.1142 -0.0493 -0.0048
Index 6 - Individual 0.3127 -0.1640 0.2592
Index 7 - Location 0.2627 -0.1677 0.4995
Index 8 - Household 0.0385 -0.0668 0.4697
Index 9 - Financial 0.2275 -0.0975 -0.0671
Note: 1. At class means, scaled values.
Source: Estimations.

TAD/CA/APM/WP(2020)2/ANN/FINAL 135
DRIVERS OF FARM PERFORMANCE Unclassified
13.5. UK poultry farms
Table A D.13.21. UK poultry farms: Descriptive statistics
Sample 1995 to 2017
Note: AWU: Annual Work Unit. LU per ha: Livestock Unit per hectare. 1. Values are per year.
Full Sample (n = 4 415)
1st Year (1995, n = 39)
Final Year (2017, n = 101)
Statistical Measure Mean [Min; Max]
Mean [Min; Max]
Mean [Min; Max]
Variable1
Livestock output (EUR) 283 423 [0; 10 371 194]
386 969 [28 586; 1 984 565]
872 312 [0; 10 371 194]
Total output (EUR) 308 087 [3 852; 10 422 865]
405 511.7 [29 445; 1 992 679]
964 810 [39 859; 10 422 865]
Land (ha) 74.7 [0; 728.0]
18.2 [0; 155.6]
54.3 [0; 625.8]
Livestock Units (number) 228.6 [0.1; 5 489]
495.1 [33.9; 3 903.4]
406.6 [5.4; 4 371.4]
Capital depreciation (EUR) 24 242 [0.0; 1 304 185]
19 517 [523; 85 717]
79 865 [501; 1 304 185]
Hired labour (AWU) 0.2028 [0.0118; 4.4505]
2.1624 [0.2969; 10.1663]
0.7681 [0.0878; 11.3961]
Family labour (AWU) 3.0747 [0.1782; 67.4722]
2.9024 [0.3985; 13.6451]
3.9491 [0.4513; 58.5929]
Materials (EUR) 28 281 [0; 2 261 822]
14 180 [0; 89 134]
83 406 [0; 2 247 104]
Stocking density (LU per ha) 54.85 [0; 25 50]
39.37 [0; 440.16]
28.45 [0; 438.73]
Organic (0-1 probability) 0.0097 [0; 1]
0 [0; 0]
0.0594 [0; 1]
Total assets (EUR) 775 726 [718; 17 456 163]
363 582 [15 239; 1 170 170]
1 871 262 [33 914; 17 456 163]
Age (years) 52 [21; 87]
50 [32; 69]
54 [31; 87]

136 TAD/CA/APM/WP(2020)2/ANN/FINAL
DRIVERS OF FARM PERFORMANCE Unclassified
Table A D.13.22. UK poultry farms: Latent class estimates
LCM panel translog reduced model, 1995 to 2017
Total output Class 1 Class 2 Class 3
Constant 9.05249*** -20.0342*** 5.35806***
Land -0.15587*** -0.84057*** -0.00059
Capital 0.48601*** 0.85192*** -0.00588
Labour 0.05050 0.17527 0.05785**
Livestock 0.77479*** -0.27732 0.42106***
Material -0.92910*** 4.23874*** 0.00288
Land*Land 0.02571*** 0.06189*** 0.01070***
Capital*Capital -0.01455*** -0.03613** 0.00441**
Labour*Labour 0.02117** -0.03894 0.01386*
Livestock*Livestock -0.04069*** 0.06627** -0.02927***
Material*Material 0.05572*** -0.14595*** 0.03604***
Time 0.09848*** 0.42286*** 0.17840***
Time*Time -0.00089*** 0.00097 0.00011
Time*Land 0.00310*** 0.04839*** -0.00190**
Time*Capital 0.00916*** -0.00282 -0.00343***
Time*Labour 0.01273*** 0.01074 0.00751***
Tume*Livestock -0.01429*** -0.02698** -0.00907***
Time*Material -0.00795*** -0.04245*** -0.00793***
Sigma 0.20024*** 0.27010*** 0.19376***
Class Membership Vector
Constant -1.03561*** -2.40424*** ---
Index 1 - Structure -0.39863*** 0.56664** ---
Index 2 - Environmental sustainability -0.00848 0.21066 ---
Index 3 - Innovation-cooperation-commercialisation 0.00027 0.00013 ---
Index 4 - Technology -0.93599*** -0.24677 ---
Index 5 - Diversity 0.70326*** 0.30987** ---
Index 6 - Individual -0.40137*** 0.12038 ---
Index 7 - Location 0.71381*** -0.55759** ---
Index 8 - Household 0.00305 0.57347*** ---
Index 9 - Financial 0.22033D-04 0.77107*** ---
Log-Likelihood Function 166.23029
Inf.Cr.AIC / AIC/N -178.5 / -0.040
Note: *significant at 10%, **significant at 5%, ***significant at 1%.
Source: Estimations.

TAD/CA/APM/WP(2020)2/ANN/FINAL 137
DRIVERS OF FARM PERFORMANCE Unclassified
Table A D.13.23. UK poultry farms: Full production function estimates
Fixed-effects panel translog model per class, 1995 to 2017
Total output Class 1 Class 2 Class 3
Land -0.19718 4.27890 0.12446
Capital 0.55458** 17.0272** -0.03470
Labour 1.64914*** -8.83265 0.60872***
Livestock -0.05482 -1.57666 0.84796***
Material -1.64057*** 0.85454 -0.65551***
Land*Land 0.00453 1.44679 0.01543***
Capital*Capital -0.01401 -0.33127 -0.00089
Labour*Labour 0.16343*** 0.07722 0.03964***
Livestock*Livestock -0.00189 1.63119** 0.01486
Material*Material 0.10896*** 0.50430 0.06307***
Land*Capital 0.02036** -0.25910 0.00063
Land*Labour -0.05325*** 3.00937* -0.01203
Land*Livestock 0.04105*** -2.23004* 0.00393
Land*Material -0.01270 -0.29649 -0.01656**
Capital*Labour 0.07638*** 1.14365 0.01742
Capital*Livestock -0.00961 -0.20359 -0.03938***
Capital*Material -0.03305* -1.00231*** 0.02163***
Labour*Livestock -0.06743** -2.21227** 0.01248
Labour*Material -0.18914*** -0.49920 -0.06693***
Livestock*Material 0.03115 -0.02175 -0.04422***
Time 0.07009** 1.10592 0.05242***
Time*Time -0.00034 0.00865 -0.31108D-04
Time*Land -0.00259* -0.12895* 0.00102
Time*Capital 0.00956*** -0.07478 -0.00192
Time*Labour 0.00386 0.20599 0.00211
Time*Livestock -0.00516* 0.10232 0.00228
Time*Material -0.00932*** -0.06393 -0.00317**
Number of observations / average group size 924 / 2.46 157 / 1.57 3334 / 3.15
R-squared / R-bar squared 0.9924 / 0.9865 0.9938 / 0.9678 0.9897 / 0.9848
Rho squared (residual variation) 0.8724 0.9992 0.7716
R-squared (within groups var) 0.7341 0.8191 0.6933
Hausman Test 49.69*** 62.13*** 61.94***
Note: *significant at 10%, **significant at 5%, ***significant at 1%.
Source: Estimations.

138 TAD/CA/APM/WP(2020)2/ANN/FINAL
DRIVERS OF FARM PERFORMANCE Unclassified
Table A D.13.24. UK poultry farms: Elasticities for classes
LCM panel translog reduced model, 1995 to 2017
Wald procedure based on delta method at sample means
Total output Class 1 Class 2 Class 3
Land 0.06522*** -0.06200 0.06239***
Capital 0.38188*** 0.20700*** 0.04896***
Labour 0.39330*** 0.19710*** 0.14275***
Livestock -0.00534 0.12016* 0.05591***
Material 0.20212*** 1.01137*** 0.74483***
Returns-to-scale 1.03719*** 1.47363*** 1.05485***
Note: *significant at 10%, **significant at 5%, ***significant at 1%.
Source: Estimations.
Table A D.13.25. UK poultry farms: Class identification - mean values indices
Mean values1, 1995 to 2017
Class 1: Most productive (21%)
Class 2: Least productive (4%)
Class 3: Medium productive (75%)
Index 1 - Structure -0.7182 0.5972 0.1709
Index 2 - Environmental sustainability -0.7333 0.2148 0.1931
Index 3 - Innovation-cooperation-commercialisation 0.6797 -0.3500 -0.1707
Index 4 - Technology -0.0845 0.2822 0.0101
Index 5 - Diversity 0.1285 0.0235 -0.0367
Index 6 - Individual 0.5209 -0.5220 -0.1198
Index 7 - Location 0.8777 -0.8127 -0.2050
Index 8 - Household 0.0713 1.0057 -0.0671
Index 9 - Financial 0.1592 0.3956 -0.0657
Note: 1. At class means, scaled values.
Source: Estimations.