working paper series - european central bank · working paper series no 873 / february 2008 in 2008...
TRANSCRIPT

WORK ING PAPER SER IE SNO 873 / FEBRUARY 2008
THE FELDSTEIN-HORIOKAFACT
by Domenico Giannoneand Michele Lenza
WORKING PAPER SER IESNO 873 / FEBRUARY 2008
In 2008 all ECB publications
feature a motif taken from the
10 banknote.
THE FELDSTEIN-HORIOKA FACT 1
Domenico Giannone 2
and Michele Lenza 3
This paper can be downloaded without charge fromhttp : //www.ecb.europa.eu or from the Social Science Research Network
electronic library at http : //ssrn.com/abstract_id=1091122.
1 We are particularly indebted to Lucrezia Reichlin, Oved Yosha and Philippe Weil for inspiration and encouragement. This paper was presented at ECARES (Université Libre de Bruxelles), at the 2002 CEPR Workshop “Cities and Geography” (Paris), at the 2003
Summer Meeting of the European Economic Association (Stockholm), at the 2006 Meeting in Open Macroeconomics andDevelopment (Aix en Provence), Erasmus University of Rotterdam (2006), Koch University Instanbul (2006)
and University of Lisbon (2006). We thank the discussants Antonio Ciccone and Giordano Mion, the seminar participants and Michel Beine, Pierpaolo Benigno, Antonello D’Agostino, Andrea Lamorgese, Maurice Obstfeld, Giorgio Primiceri, Luca Sala, Chiara Scotti, Cristina Vespro and Wolf Wagner for many helpful suggestions and comments. All remaining
errors are our own. Domenico Giannone gratefully acknowledges fi nancial support from the RTN network on “Diversifi cation versus Specialization” funded by the European Commission. The views expressed in this paper are
exclusively those of the authors and do not necessarily refl ect those of the European Central Bank.2 European Central Bank and CEPR; Contact address: European Central Bank, Kaiserstrasse 29, 60311 Frankfurt am Main,
Germany; e-mail: [email protected] European Central Bank, Kaiserstrasse 29, 60311 Frankfurt am Main, Germany;
e-mail: [email protected]
© European Central Bank, 2008
Address Kaiserstrasse 29 60311 Frankfurt am Main, Germany
Postal address Postfach 16 03 19 60066 Frankfurt am Main, Germany
Telephone +49 69 1344 0
Website http://www.ecb.europa.eu
Fax +49 69 1344 6000
All rights reserved.
Any reproduction, publication and reprint in the form of a different publication, whether printed or produced electronically, in whole or in part, is permitted only with the explicit written authorisation of the ECB or the author(s).
The views expressed in this paper do not necessarily refl ect those of the European Central Bank.
The statement of purpose for the ECB Working Paper Series is available from the ECB website, http://www.ecb.europa.eu/pub/scientifi c/wps/date/html/index.en.html
ISSN 1561-0810 (print) ISSN 1725-2806 (online)

3ECB
Working Paper Series No 873February 2008
Abstract 4
Non-technical summary 5
1 Introduction 7
2 9
3 Empirics 14 3.1 Global fl uctuations 14
17
4 Conclusions 19
References 20
Tables and fi gures 21
Appendices 24
26
CONTENTS
General equilibrium and the saving-retention coeffi cient
European Central Bank Working Paper Series
3.2 Saving-investment regression
4ECBWorking Paper Series No 873February 2008
Abstract
This paper shows that general equilibrium effects can partly rationalize the high
correlation between saving and investment rates observed in OECD countries. We
find that once controlling for general equilibrium effects the saving-retention coeffi-
cient remains high in the 70’s but decreases considerably since the 80’s, consistently
with the increased capital mobility in OECD countries.
JEL Classification: C23, F32, F41.
Keywords: Saving-Investment Correlation, Capital Mobility, International Co-
movement, Dynamic Factor Model.

5ECB
Working Paper Series No 873February 2008
Non-technical abstract
The Feldstein-Horioka puzzle is one of the six major puzzles in International Macroe-conomics (Obstfeld and Rogoff, 2000). Domestic saving and investment rates are highlycorrelated both within and between OECD countries: in years when and countrieswhere saving is high, so is investment. This fact seems incompatible with the Intertem-poral Theory of the Current Account. Assuming perfect capital mobility, such a theorypredicts that the determinants of saving and investment are not the same. Hence,countries should borrow and lend abroad whenever they need to invest or disinvest,without being constrained by domestic saving decisions. Feldstein and Horioka (1980)interpreted their finding as evidence of low capital mobility among OECD countries.However, in the decades following the publication of Feldstein and Horioka results,capital mobility among OECD countries has kept on increasing while the correlationbetween saving and investment rates has only slightly decreased.
On the other hand, the Intertemporal Theory of the Current Account fails to con-sider general equilibrium effects and the latters, it has been argued, could provide anexplanation for the puzzle (see Ventura, 2003). Since the world, as a whole, is a closedeconomy, world saving and investment have to be equal. Consequently, a commonshock which, say, positively affects saving decisions of most countries, tends to createimbalance in world capital markets and decreases the world interest rate. This, inturn, increases world investment and generates a positive correlation between savingand investment in all countries.
Partial equilibrium predictions of the theory are more likely to hold, then, in re-sponse to idiosyncratic sources of fluctuations whose effect on world capital markets islikely to be negligible. Since global shocks are acknowledged to be an important forcedriving the world business cycle (see, for example, Gregory and Head, 1999 and Kose,Otrok and Whiteman, 2003), general equilibrium effects should reconcile theory andevidence. However, general equilibrium explanations of the Feldstein-Horioka findingnever found adequate empirical support since the saving-investment correlation doesnot decrease when controlling for global shocks (see, for example, Glick and Rogoff,1995 and Ventura, 2003). Consequently, a belief has risen that the high saving - invest-ment correlation can only be explained by introducing frictions in international goodor financial markets (Ventura, 2003 and Obstfeld and Rogoff, 2000, are two examplesof this view).
This paper revisits the general equilibrium explanation and shows that, unlike whatclaimed by existing empirical studies, it does help to rationalize the puzzle. Previousattempts to control for the effects of global shocks in saving and investment regressionsassume homogeneity of their transmission mechanisms across countries. However, thereare no theoretical reasons to focus only on global shocks that have homogeneous effects.In fact, also global shocks with heterogenous effect can create imbalance on the worldcapital market, unless the nature of the heterogeneity is such that the effect in a groupof countries is perfectly offset by the opposite effect in the rest of the world.
We propose a new methodology, factor augmented panel regression, to isolate id-iosyncratic sources of fluctuations. It improves on existing studies since countries are

6ECBWorking Paper Series No 873February 2008
allowed to react with specific sign and magnitude to global shocks. We show thatthe homogeneity restriction is rejected by the data and biases the estimation of thesaving-retention coefficient. Indeed, allowing for heterogeneous propagation mecha-nism of global shocks, the saving-retention coefficient drops significantly from the 80’son, consistently with the increase in capital mobility across OECD countries.

7ECB
Working Paper Series No 873February 2008
1 Introduction
The Feldstein-Horioka puzzle is one of the six major puzzles in International Macroeco-
nomics (Obstfeld and Rogoff, 2000). Domestic saving and investment rates are highly
correlated both within and between OECD countries: in years when and countries
where saving is high, so is investment. This fact seems incompatible with the Intertem-
poral Theory of the Current Account. Assuming perfect capital mobility, such a theory
predicts that the determinants of saving and investment are not the same. Hence,
countries should borrow and lend abroad whenever they need to invest or disinvest,
without being constrained by domestic saving decisions. Feldstein and Horioka (1980)
interpreted their finding as evidence of low capital mobility among OECD countries.
However, in the decades following the publication of Feldstein and Horioka results,
capital mobility among OECD countries has kept on increasing while the correlation
between saving and investment rates has only slightly decreased1.
On the other hand, the Intertemporal Theory of the Current Account fails to con-
sider general equilibrium effects and the latters, it has been argued, could provide an
explanation for the puzzle (see Ventura, 2003). Since the world, as a whole, is a closed
economy, world saving and investment have to be equal. Consequently, a common
shock which, say, positively affects saving decisions of most countries, tends to create
imbalance in world capital markets and decreases the world interest rate. This, in
turn, increases world investment and generates a positive correlation between saving
and investment in all countries.
Partial equilibrium predictions of the theory are more likely to hold, then, in re-
sponse to idiosyncratic sources of fluctuations whose effect on world capital markets
is likely to be negligible. Since global shocks are acknowledged to be an important
1This finding is relatively robust for OECD countries as a whole. However, some studies have foundevidence of a reduction of the correlation between saving and investment limited to specific groups ofcountries and sub-periods (for a survey, see Coakley, Kulasi, and Smith, 1998). Recently, Blanchardand Giavazzi (2002) finds that the correlation between saving and investment rates has decreased inthe 90’s but only in euro area countries

8ECBWorking Paper Series No 873February 2008
force driving the world business cycle (see, for example, Gregory and Head, 1999; Kose,
Otrok, and Whiteman, 2003), general equilibrium effects should reconcile theory and
evidence. However, general equilibrium explanations of the Feldstein-Horioka finding
never found adequate empirical support since the saving-investment correlation does
not decrease when controlling for global shocks (see, for example, Glick and Rogoff,
1995; Ventura, 2003). Consequently, a belief has risen that the high saving - invest-
ment correlation can only be explained by introducing frictions in international good
or financial markets (Ventura, 2003; Obstfeld and Rogoff, 2000, are two examples of
this view).
This paper revisits the general equilibrium explanation and shows that, unlike what
claimed by existing empirical studies, it does help to rationalize the puzzle. Previous
attempts to control for the effects of global shocks in saving and investment regressions
assume homogeneity of their transmission mechanisms across countries. However, there
are no theoretical reasons to focus only on global shocks that have homogeneous effects.
In fact, also global shocks with heterogenous effect can create imbalance on the world
capital market, unless the nature of the heterogeneity is such that the effect in a group
of countries is perfectly offset by the opposite effect in the rest of the world.
We propose a new methodology, factor augmented panel regression, to isolate id-
iosyncratic sources of fluctuations. It improves on existing studies since countries are
allowed to react with specific sign and magnitude to global shocks. We show that
the homogeneity restriction is rejected by the data and biases the estimation of the
saving-retention coefficient. Indeed, allowing for heterogeneous propagation mecha-
nism of global shocks, the saving-retention coefficient drops significantly from the 80’s
on, consistently with the increase in capital mobility across OECD countries.
The structure of the paper is the following. In section 2, we review commonly
used methods to control for global sources of fluctuations and propose the novel factor
augmented panel regression. Section 3 presents empirical results. Section 4 concludes.
9ECB
Working Paper Series No 873February 2008
2 General Equilibrium and the saving-retention coefficient
Many studies document the existence of strong cross country linkages in macroeco-
nomic fluctuations (for a survey see Kose, Otrok, and Whiteman, 2003). This suggests
that international fluctuations are driven by few common sources which can generate
positive correlation between saving and investment through general equilibrium mech-
anisms. Such positive correlation is not in contradiction with the partial equilibrium
Intertemporal Theory of the Current Account, whose predictions are conditional on
idiosyncratic (country specific or regional) shocks which, not affecting all the countries,
are unlikely to generate imbalance in the world capital market.
Formally, consider the following representation for saving (Sj,t) and investment (Ij,t)
rates2 of country j at time t:
Sj,t = λS1,jf1,t + . . . + λS
r,jfr,t + Sidj,t (1)
Ij,t = λI1,jf1,t + . . . + λI
r,jfr,t + Iidj,t (2)
where fi,t, i = 1, . . . , r are few global factors affecting saving and investment rates of all
countries while Sidj,t and Iid
j,t are the idiosyncratic components of saving and investment
rates that are assumed to be driven by non pervasive (idiosyncratic) shocks. The
factor loadings λSi,j , λI
i,j (j = 1, . . . , N , i = 1, . . . , r) are country specific and capture
the heterogeneity in the transmission mechanisms of global shocks. In particular, each
variable can react with a specific sign and intensity to the global factors fi,t (i = 1, .., r)3.
For the reasons outlined above, the Intertemporal Theory of the Current Account
refers to idiosyncratic components of saving and investment rates. We consider the
2Saving and investment rates are computed, respectively, as the ratio of saving and investment toGDP
3Heterogeneous dynamic responses of saving and investment rates of each country are also allowedsince some factors can be the lagged version of others. For example, a model with one global factorwith contemporaneous and lagged effects is a particular case of (1) and (2) with r = 2 and f2,t = f1,t−1.

10ECBWorking Paper Series No 873February 2008
following relationship
Iidj,t = αj + βSid
j,t + εj,t (3)
where β is the saving-retention coefficient conditional to idiosyncratic shocks or, in
terms of long run fluctuations,
1
T
T∑t=1
Iidj,t = αj + βL
1
T
T∑t=1
Sidj,t + εj (4)
Equations (1) and (2) imply that (3) and (4) can be rewritten in terms of observable
saving and investment rates as
Ij,t = αj + βSj,t + δ1,jf1,t + . . . + δr,jfr,t + εj,t (5)
and
1
T
T∑t=1
Ij,t = αj + βL
1
T
T∑t=1
Sj,t + δL1,j
1
T
T∑t=1
f1,t + . . . + δLr,j
1
T
T∑t=1
fr,t + εj (6)
where δi,j =(λI
i,j − βλSi,j
)and δL
i,j =(λI
i,j − βLλSi,j
). Notice that the coefficients δi,j
and δLi,j can vary along the cross section dimension since they are function of factor
loadings of domestic saving and investment rates in different countries. Assume, for
example, that β = 0 or βL = 0, in equation (3) and (4); in that case, the δi,j ’s or δLi,j ’s
would be equal across countries only if the λIi,j were equal across countries or, in other
words, if the response of the investment rates to common shocks was the same in all
countries.
Let us investigate the consequences of equation (5) and (6) for the methodologies
commonly used in the Feldstein-Horioka debate. We argue that, indeed, all of them
are not robust to the introduction of heterogeneity in the transmission mechanisms of
global shocks.
In their seminal paper, Feldstein and Horioka performed the following “long run”
11ECB
Working Paper Series No 873February 2008
regression:
1
T
T∑t=1
Ij,t = μ + βL
1
T
T∑t=1
Sj,t + ηj (7)
Temporal aggregation averages out from the data short and medium run fluctuations.
Therefore, the long run regression (7) is able to control for short and medium run
effects of global shocks on saving and investment. On the other hand, time aggregation
does not average out the long run effects of global factors. Whenever these effects
are significantly different across saving and investment rates in different countries, the
country specific long run effect of global shocks(δL1,j
1
T
∑Tt=1 f1,t + . . . + δL
r,j1
T
∑Tt=1 fr,t
)
will not be captured by the constant term μ and, hence, will be contained in the error
ηj . Since observed saving is also affected by global shocks, the estimation of βL is not
consistent.
Estimation methods alternative to the long run regression of Feldstein and Horioka
have been proposed in order to investigate the relation between saving and investment
rates and, invariably, they end up with results that point to a high correlation. Let us
start considering the consequences of estimating β by a “baseline panel regression” or,
more precisely,
Ij,t = αj + βSj,t + ηj,t (8)
when the data generating process is given by (1) and (2). From (5) it can be easily
seen that the error term ηj,t contains the common factors and is correlated with the
regressors. Then, the estimates based on equation (8) are not consistent.
A method generally proposed to correct for this problem consists in adding time
dummies to the ”baseline panel regression” (8) by specifying the following regression
equation
Ij,t = αj + γt + βSj,t + ζj,t (9)
where γt is the so called ”time effect”4. However this method is not always appropriate.
4For an application of this methodology to the Feldstein - Horioka debate, see, for example, Ventura(2003).
12ECBWorking Paper Series No 873February 2008
In fact, comparing equation (9) with equation (5), it is possible to see that time effects
can properly capture comovement only if each global factor has the same effect across
countries (i.e. δi,j = δi,h for each j, h). Otherwise, the estimate of β remains inconsis-
tent. Again, this specification doesn’t take into account the possibility of heterogeneous
transmission mechanisms of global shocks5.
In conclusion, if global shocks propagate heterogeneously across countries, the re-
lationship between idiosyncratic components of saving and investment rates cannot
be consistently estimated by the regressions commonly used in Feldstein and Horioka
type of analysis. However, equation (5) suggests that we can relax the homogeneity
assumption by plugging directly the common factors into the baseline panel regres-
sion, without imposing any restriction on the country specific coefficients (δi,j , j =
1, . . . , N, i = 1, . . . , r). The idea is to control for the factors that affect all countries, for
example oil shocks or global productivity shocks, and, hence, could create imbalance
on the world capital market. In addition, we could control for those variables that are
mainly affected by global shocks and capture the closed economy constraint for the
world economy, for example world investment and world interest rate. This approach
is problematic since global shocks or variables like the world interest rate are actually
unobservable.
Our approach consists in extracting the global factors directly from saving and in-
vestment rates by cross country aggregation. In fact, since the idiosyncratic components
are driven by non pervasive (country specific or regional) shocks, by worldwide aggre-
gation they are averaged out and what survives are only the factors affecting saving
and investment rates in all countries. More precisely, as shown by Forni, Hallin, Lippi,
and Reichlin (2000) and Stock and Watson (2002), the components of the factor model
in (1) and (2) are identified and the unobserved global factors (fi,t, i = 1, . . . , r) can be
5Idiosyncratic components of saving and investment can also be estimated as the deviation of savingand investment from their OECD wide counterparts as Ostergaard, Sorensen, and Yosha (2002) thatstudies the excess sensitivity of consumption in US states and provinces. However, it can be shownthat this methodology is equivalent to estimate equation 9 with time dummies as in Ventura (2003).

13ECB
Working Paper Series No 873February 2008
estimated, provided that the number of countries under analysis is large. Hence, we
plug estimated factors in equation (5), obtaining the following factor augmented panel
regression:
Ij,t = αj + βSj,t + δ1,j f1,t + . . . + δr,j fr,t + εj,t (10)
In order to implement this methodology, we need to estimate r, the number of global
factors and the global factors f1,t, . . . , fr,t themselves.
Forni and Reichlin (1998) and Pesaran (2006) have proposed to estimate the com-
mon factors by means of cross country aggregates, such as the global investment rate6.
As pointed out above, data aggregates converge to the common factors as the cross-
sectional dimension increases, because the idiosyncratic components are averaged out.
However, this approach may be problematic if there is more than one common factor.
Forni, Hallin, Lippi, and Reichlin (2000) and Stock and Watson (2002) have proposed to
estimate the common factors, f1,t . . . , fr,t, by means of the first r principal components.
Consistency of this estimator is achieved as both the number of series and observations
increase. These estimates are robust with respect to some form of non-stationarity
in the data7. Moreover, the estimated factors can be considered as they were known
provided that the number of countries is not too small relative to the sample size8.
For what concerns the number of the common factors, r, there have been different
proposals essentially based on the percentage of variance explained by each principal
component. A rule of thumb proposed in Forni and Reichlin (1998) suggests to retain
only principal components that explain more than a certain threshold percentage of
the panel variance. Bai and Ng (2002) formalize this idea by constructing a criterion
based on a data-dependent threshold.
6Computed as the ratio of global investment to global GDP7For time varying factor loadings and structural breaks see Stock and Watson (2002) while for unit
roots in the factors see Bai (2004).8More formally, authors’calculations based on Bai (2003) and Bai and Ng (2006) show that factors
can be treated as known if the number of countries is larger than the square root of the sample sizesince there is no generated regressor problem (Pagan, 1984; Bernanke and Boivin, 2003; Bai and Ng,2006)

14ECBWorking Paper Series No 873February 2008
Finally, while studying in depth the heterogeneity in the transmission mechanisms
of global shocks, we maintain throughout this and next section the assumption of a
fixed saving retention coefficient (β) across countries. Such coefficient is meant to
provide an overall assessment of the correlation between saving and investment left
over after properly controlling for global shocks, that is all we need to evaluate the
general equilibrium explanation of the Feldstein - Horioka puzzle.
3 Empirics
3.1 Global fluctuations
This section studies the features of the International Business Cycles focusing on their
implications for the saving and investment debate. Our database consists in annual data
on saving and investment rates of 23 OECD countries for the period 1970 - 20049. The
extent of cross-country linkages can be measured by the correlation of domestic saving
and investment with respect to their OECD wide counterpart. By regressing domestic
saving and investment rates onto the global OECD investment rates, we capture a
remarkable 48% of the variance, on average10. An other option is to look at OECD
wide aggregates that maximize the explainable variance. Principal components of the
covariance matrix of the data have this property.
INSERT TABLE 1 HERE
In table 1, we show that the first principal component explains 53% and the second
principal component about 13% of the variance of domestic saving and investment rates,
on average. Then, at least two principal components explain more than 10% of the panel
variance and capture, overall, about 66% of the panel variance. Consequently, the rule
9More details on data sources can be found in the data appendix at the end of the paper.10It is worth noticing that the difference between OECD wide saving and investment is insignificant
since the OECD countries as a whole can be seen as a closed economy.

15ECB
Working Paper Series No 873February 2008
of thumb proposed by Forni and Reichlin (1998) would suggest at least two common
factors11. On the other hand, the Bai and Ng (2002) criterion proves inconclusive in our
panel. These results show that cross country linkages in saving and investment rates
of OECD countries are strong. Following Forni, Hallin, Lippi, and Reichlin (2000) and
Stock and Watson (2002), we can conclude that the factor model representations (1)
and (2) describe well our data.
Moreover, the global factors have also a strong long run effect on saving and in-
vestment rates of OECD countries: one aggregate accounts for more than 67% of the
long run panel variance12. In addition, by looking at the percentage of the variance
of domestic saving and investment rates explained by global factors, it is evident how
their impact varies considerably across countries (see Figures 1 and 2).
INSERT FIGURES 1 and 2 HERE
These findings are consistent with Kose, Otrok, and Whiteman (2003), who high-
light both strong persistence and heterogeneity in the transmission mechanisms of
global shocks. This suggests that, in order to properly control for general equilib-
rium effects, it is important to take into account that countries react with specific sign,
magnitude and lag structure to global shocks.
As stressed in section 2, aggregates like those used above provide consistent esti-
mates of the global factors for large sample size and cross section dimension. Given
the existence of two global factors, a single aggregate like the OECD investment rate is
not sufficient to fully capture the effect of global shocks. Hence, the first two principal
components are the most appropriate estimators.
On the other hand, principal components have an important drawback with respect
to aggregates like, say, the global OECD saving or investment rate: they miss a clear
11Since the third principal component explains about 10% of the panel variance, we perform robust-ness checks of our empirical results assuming three common factors
12The aggregate we consider is the first principal component of the spectral density matrix at fre-quency zero. It is worth noting that the latter represents the covariance matrix of the sample mean.

16ECBWorking Paper Series No 873February 2008
intuition. While well suited to assess the strength of cross country linkages and to
estimate the factor space, in general they do not have an economic interpretation. In
order to get an intuition on the nature of the principal components, we look at their
relation with economic aggregates. In Figure 3, we plot the first principal component
and the Global OECD investment rate.
INSERT FIGURE 3 HERE
These two aggregates are very similar and their correlation coefficient is 0.94. A
good candidate for the second principal component should be a variable mainly driven
by common shocks and not collinear with the global investment rate. For example, the
Global OECD Saving rate is not appropriate because it satisfies the first but not the
second requirement. The world interest rate, on the other hand, is a good candidate
because, given its role in clearing the world capital market, it is expected to react to
shocks that tend to create imbalances between world investment and saving. Unfor-
tunately, a measure of the world interest rate is not available and its construction is
problematic (see Barro, 1991). For this reason we use two proxies, the long run US
interest rate and the average long run interest rate of the G7 countries. The correlation
between the second principal component and US long run interest rate is 0.86 while,
for the average of the G7 long run interest rates, it is 0.75. In Figure 4, we plot these
variables against the second principal component.
INSERT FIGURE 4 HERE
It is apparent how the two proxies of the world interest rate and the second principal
component have similar dynamic behavior and, notably, they peak at the same time
at the beginning of the 80′s. These results highlight the ability of our estimates of the
common factors to capture the global forces driving prices and quantities in the world
capital market.
17ECB
Working Paper Series No 873February 2008
3.2 Saving-Investment regressions
In this subsection, we present results on the Feldstein - Horioka puzzle. We analyze
the whole sample 1970 − 2004 and the three subsamples 1970 − 1979, 1980 − 1989 and
1990 − 2004 since we aim to study how the relation between saving and investment
rates has been affected by the fast process of integration of financial and good markets
in OECD countries. Our results are summarized in table 2. In order to investigate
the effects of misspecification of the number of global factors, we consider two different
specifications for the factor augmented panel regression, equation 10. The first with
only one factor estimated by the Global OECD Investment rate (Equation 10a), the
other with two common factors estimated by principal components (Equation 10b).
INSERT TABLE 2 HERE
Consider, first, results for the sample 1970−2004. It is evident that, once controlling
for general equilibrium effects, the Feldstein - Horioka puzzle is de-emphasized. Both
“long run” and ”baseline panel” regressions further document the puzzle: the estimated
saving - retention coefficient is high and significant. On the other hand, no matters
how we control for global comovements, the coefficient is significantly reduced, even
if it remains statistically different from zero. This is a clear evidence of the relevance
of general equilibrium effects for explaining the correlation of saving and investment.
However, if not properly taken into account, the heterogeneity of the transmission
mechanism of global shocks biases upwards the estimated saving retention coefficient.
In fact, in terms of point estimates, the coefficient is smaller for the factor augmented
panel regressions (Equations 10a - b)13. The mis-specification of the number of factors is
another source of upward bias: the saving-retention coefficient estimated by controlling
for one factor (Equation 10a) is higher than that estimated by controlling for two
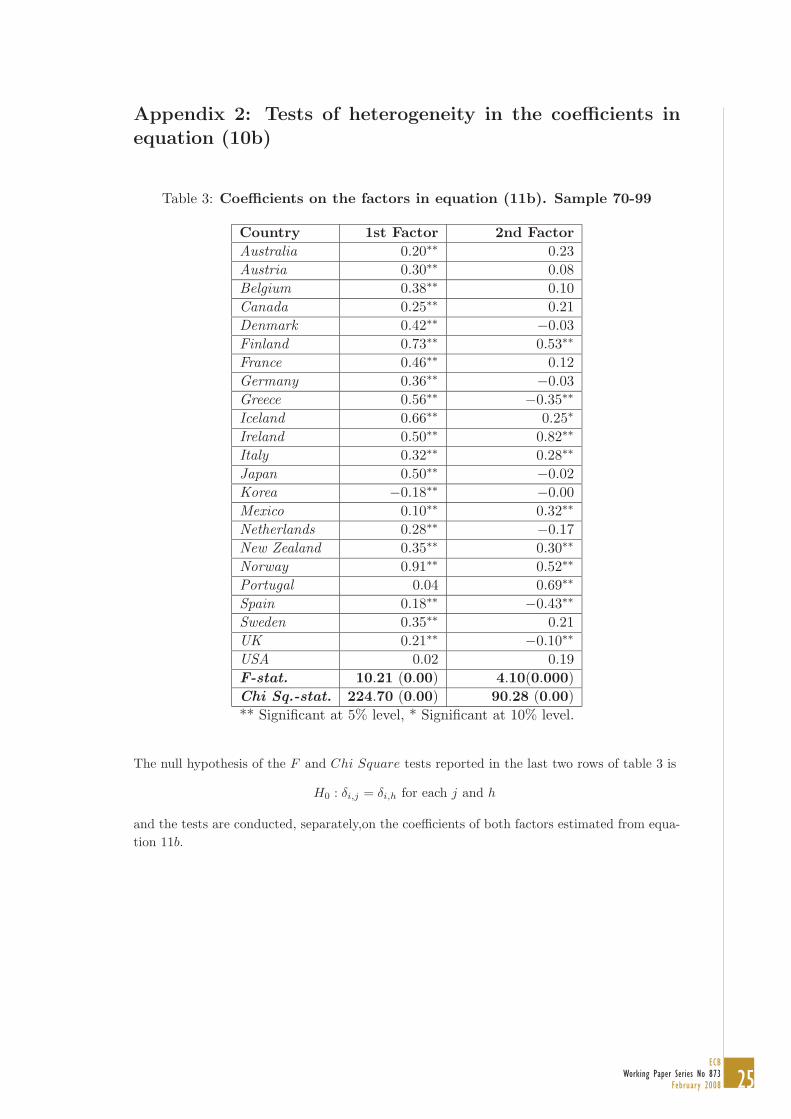
13Indeed, the homogeneity restriction δi,j = δi,h, (i = 1, 2), for each country (j, h) in equation 10b isstrongly rejected by the data (see Table 3 at the end).
18ECBWorking Paper Series No 873February 2008
factors (Equation 10b). Notice that the high number of significant coefficients (δ’s)
on the second principal component in Equation 10b provides further evidence that the
OECD wide investment rate is not able, alone, to account for the effects of global shocks
on saving and investment rates in OECD countries. On the other hand, by means of
principal components we are able to fully capture the closed economy constraint on
aggregate saving and investment without relying on specific unobservable variables
such as the world interest rate. However, further research is needed to give a structural
interpretation to our estimates of the global factors.
Results from sub-samples allow us to analyze the evolution over time of the saving
- retention coefficient14. From the baseline regression we would conclude that the
estimated saving-retention coefficient in the 80′s decreased relative to the 70′s but then
it stabilized, remaining high and significant. When controlling for global comovement,
we observe a marked reduction in the correlation between saving and investment rates.
In particular, using the appropriate number of aggregates and taking heterogeneity
of transmission mechanisms of global shocks into account, a clear break in the 80’s
appears: the saving - retention coefficient is high in the 70’s and, then, significantly
drops becoming insignificantly different from zero in the last 25 years15.
It is worth noticing that the temporal path in our estimates of the saving - retention
coefficient is consistent with the widely documented evolution in the degree of interna-
tional capital mobility that was low during the 70’s and has been steadily increasing
since the early 80’s.
14The common factors in equation 10 are computed by estimating the first two principal componentsin each subperiod under analysis. However, qualitative results do not change if we estimate factors onthe whole sample. This is not surprising, given the robustness of principal components estimators tosome forms of parameter instabilities (Stock and Watson, 2002).
15We performed two sets of robustness checks. First, results in table 2 refer to the full cross-sectionof countries. However, Mexico and Korea were not part of the OECD for a large span of our sample.However, excluding Mexico and Korea from our panel does not affect the results. Second,we performedregression 10b considering also a specification with three common factors. Except for a reduction of thecorrelation in the 70′s relative to the specification with two global factors, the results are not affectedby the inclusion of the third factor.

19ECB
Working Paper Series No 873February 2008
Summing up, the empirical evidence suggests that, as originally claimed by Feldstein
and Horioka in their seminal paper, the Intertemporal Theory of the Current Account
failed to explain the relation between saving and investment rates before the 80’s.
Instead, from the 80’s on, the relation between saving and investment has become
closer to what predicted by the Intertemporal Theory of the Current Account. Given
the partial equilibrium nature of this theory, if we do not isolate idiosyncratic sources
of fluctuations taking heterogeneous responses of saving and investment rates to global
shocks into account, this fact remains hidden.
4 Conclusions
This paper shows that, unlike what claimed by previous studies, general equilibrium
effects can partly rationalize the high correlation between saving and investment rates
observed in OECD countries. We develop a factor augmented panel regression that
enables to isolate idiosyncratic sources of fluctuations. Contrary to existing studies,
our approach allows for heterogeneous responses of saving and investment rates to
global shocks. Empirical results show that the homogeneity restriction that is usually
imposed biases upwards the estimated correlation between saving and investment rates.
Relaxing this assumption we find that the correlation among saving and investment
rates decreases over time becoming very small in the last two decades. This finding is
consistent with the empirical evidence that international capital mobility has increased
in the last decades.

20ECBWorking Paper Series No 873February 2008
References
Bai, J. (2003): “Inferential Theory for Factor Models of Large Dimensions,” Econo-
metrica, 71(1), 135–171.
(2004): “Estimating cross-section common stochastic trend in nonstationarypanels,” Journal of Econometrics, 122, 137–183.
Bai, J., and S. Ng (2002): “Determining the Number of Factors in ApproximateFactor Models,” Econometrica, 70(1), 191–221.
Bai, J., and S. Ng (2006): “Confidence intervals for diffusion index forecasts with alarge number of predictors,” Econometrica, 74(4), 1133–1150.
Barro, R. (1991): “World interest rate and investment,” NBER Working Paper 3849.
Bernanke, B., and J. Boivin (2003): “Monetary Policy in a Data-Rich Environ-ment,” Journal of Monetary Economics, 50, 525–546.
Blanchard, O., and F. Giavazzi (2002): “Current account deficits in the Euro Area:the end of the Feldstein-Horioka puzzle?,” Brookings Papers on Economic Activity,22, 147–209.
Coakley, J., F. Kulasi, and R. Smith (1998): “The Feldstein-Horioka Puzzle andCapital Mobility: A Review,” International Journal of Finance and Economics, 3(2),169–88.
Feldstein, M., and C. Horioka (1980): “Domestic saving and international capitalflows,” Economic Journal, 90, 314–329.
Forni, M., M. Hallin, M. Lippi, and L. Reichlin (2000): “The Generalized Dy-namic Factor Model: identification and estimation,” Review of Economics and Statis-
tics, 82, 540–554.
Forni, M., and L. Reichlin (1998): “Let’s get real: a factor analytic approach tobusiness cycle dynamics,” Review of Economic Studies, 65, 452–473.
Glick, R., and K. Rogoff (1995): “Global versus country-specific productivityshocks and the current account,” Journal of Monetary Economics, 35, 159–192.
Gregory, A., and A. Head (1999): “Common and country specific fluctuations inproductivity, investment and the current account,” Journal of Monetary Economics,44, 423–451.
Kose, A., C. Otrok, and C. Whiteman (2003): “International business cycles:world, region and country specific factors,” American Economic Review, 93, 1216–1239.
Obstfeld, M., and K. Rogoff (2000): “The six major puzzle in international eco-nomics: is there a common cause?,” NBER Working Paper 7777.

21ECB
Working Paper Series No 873February 2008
Ostergaard, C., B. Sorensen, and O. Yosha (2002): “Consumption and ag-gregate constraints: evidence from US states and Canadian provinces,” Journal of
Political Economy, 111, 634–645.
Pagan, A. (1984): “Econometric issues in the analysis of regressions with generatedregressors,” International Economic Review, 25, 221–247.
Pesaran, M. H. (2006): “Estimation and Inference in Large Heterogeneous Panelswith a Multifactor Error Structure,” Econometrica, 74(4), 967–1012.
Stock, J. H., and M. W. Watson (2002): “Macroeconomic Forecasting Using Dif-fusion Indexes,” Journal of Business and Economics Statistics, 20, 147–162.
Ventura, J. (2003): “Towards a theory of current account,” World Economy, pp.483–512.
Tables and Figures in main text
TABLES
Table 1: Share of the overall panel variance explained by static principal
components.
1st 2nd 3rd 4th 5th
Marginal 0.5292 0.1293 0.0998 0.0549 0.0371
Cumulative 0.5292 0.6585 0.7583 0.8132 0.8503
Table 2: Regression resultsSample
Type of Regression 70-04 70-79 80-89 90-04
Long Run regression (Eq. 7)0.60
[0.11]0.61
[0.13]0.62
[0.10]0.50
[0.11]
Baseline (Eq. 8)0.60
[0.03]0.60
[0.13]0.37
[0.08]0.34
[0.05]
Time Effects (Eq. 9)0.42
[0.03]0.62
[0.06]0.32
[0.07]0.29
[0.05]
G.I. rate (Eq. 10a)0.34
[0.03]0.53
[0.06]0.28
[0.07]0.23
[0.05]
2 Factors (Eq. 10b)0.29
[0.04]0.52
[0.11]0.14
[0.11]−0.03
[0.07]

22ECBWorking Paper Series No 873February 2008
FIGURES
Figure 1: Domestic Saving. Percentage of variance explained by the first two
factors.
Aus Aut Bel Can Den Fin Fra Ger Gre Ice Ire Ita Jap Kor Mex Net Nzl Nor Por Spa Swe UK USA0
0.1
0.2
0.3
0.4
0.5
0.6
0.7
0.8
0.9
1
First Factor Second Factor
Figure 2: Domestic Investment. Percentage of variance explained by the first
two factors.
Aus Aut Bel Can Den Fin Fra Ger Gre Ice Ire Ita Jap Kor Mex Net Nzl Nor Por Spa Swe UK USA0
0.1
0.2
0.3
0.4
0.5
0.6
0.7
0.8
0.9
First Factor Second Factor

23ECB
Working Paper Series No 873February 2008
Figure 3: First Principal Component
1970 1975 1980 1985 1990 1995 2000 20050.19
0.2
0.21
0.22
0.23
0.24
0.25
0.26Global OECD Investment ratioFirst Principal Component
Figure 4: Second Principal Component
1970 1975 1980 1985 1990 1995 2000 20052
4
6
8
10
12
14
16G7 Average l.t. interest rateUS l.t. interest rateSecond Principal Component
24ECBWorking Paper Series No 873February 2008
Appendix 1: Data
Data frequency is annual and the sample ranges from 1970 to 2004.
The source of the data for saving, investment and GDP is OECD, NationalAccounts, Annual Accounts, Disposable income and net lending - net bor-rowing.
Investment is Gross Capital Formation. Saving is the sum of Consumptionof Fixed Capital and Net Saving. Saving and Investment rates are calculatedby the authors as the ratio of Saving and Investment to GDP.
Long term Interest Rates of G7 countries are in OECD Economic OutlookStatistics and Projections/Financial Data.
Data refer to the following 23 countries: Australia, Austria, Belgium, Canada,Germany, Denmark, Spain, Finland, France, United Kingdom, Greece, Ire-land, Iceland, Italy, Japan, Korea, Mexico, Netherlands, Norway, NewZealand, Portugal, Sweden and United States.
25ECB
Working Paper Series No 873February 2008
Appendix 2: Tests of heterogeneity in the coefficients inequation (10b)
Table 3: Coefficients on the factors in equation (11b). Sample 70-99
Country 1st Factor 2nd Factor
Australia 0.20∗∗ 0.23
Austria 0.30∗∗ 0.08
Belgium 0.38∗∗ 0.10
Canada 0.25∗∗ 0.21
Denmark 0.42∗∗ −0.03
Finland 0.73∗∗ 0.53∗∗
France 0.46∗∗ 0.12
Germany 0.36∗∗ −0.03
Greece 0.56∗∗ −0.35∗∗
Iceland 0.66∗∗ 0.25∗
Ireland 0.50∗∗ 0.82∗∗
Italy 0.32∗∗ 0.28∗∗
Japan 0.50∗∗ −0.02
Korea −0.18∗∗ −0.00
Mexico 0.10∗∗ 0.32∗∗
Netherlands 0.28∗∗ −0.17
New Zealand 0.35∗∗ 0.30∗∗
Norway 0.91∗∗ 0.52∗∗
Portugal 0.04 0.69∗∗
Spain 0.18∗∗ −0.43∗∗
Sweden 0.35∗∗ 0.21
UK 0.21∗∗ −0.10∗∗
USA 0.02 0.19
F-stat. 10.21 (0.00) 4.10(0.000)
Chi Sq.-stat. 224.70 (0.00) 90.28 (0.00)
** Significant at 5% level, * Significant at 10% level.
The null hypothesis of the F and Chi Square tests reported in the last two rows of table 3 is
H0 : δi,j = δi,h for each j and h
and the tests are conducted, separately,on the coefficients of both factors estimated from equa-
tion 11b.

26ECBWorking Paper Series No 873February 2008
European Central Bank Working Paper Series
For a complete list of Working Papers published by the ECB, please visit the ECB’s website(http://www.ecb.europa.eu).
827 “How is real convergence driving nominal convergence in the new EU Member States?” by S. M. Lein-Rupprecht, M. A. León-Ledesma, and C. Nerlich, November 2007.
828 “Potential output growth in several industrialised countries: a comparison” by C. Cahn and A. Saint-Guilhem, November 2007.
829 “Modelling infl ation in China: a regional perspective” by A. Mehrotra, T. Peltonen and A. Santos Rivera, November 2007.
830 “The term structure of euro area break-even infl ation rates: the impact of seasonality” by J. Ejsing, J. A. García and T. Werner, November 2007.
831 “Hierarchical Markov normal mixture models with applications to fi nancial asset returns” by J. Geweke and G. Amisano, November 2007.
832 “The yield curve and macroeconomic dynamics” by P. Hördahl, O. Tristani and D. Vestin, November 2007.
833 “Explaining and forecasting euro area exports: which competitiveness indicator performs best?” by M. Ca’ Zorzi and B. Schnatz, November 2007.
834 “International frictions and optimal monetary policy cooperation: analytical solutions” by M. Darracq Pariès, November 2007.
835 “US shocks and global exchange rate confi gurations” by M. Fratzscher, November 2007.
836 “Reporting biases and survey results: evidence from European professional forecasters” by J. A. García and A. Manzanares, December 2007.
837 “Monetary policy and core infl ation” by M. Lenza, December 2007.
838 “Securitisation and the bank lending channel” by Y. Altunbas, L. Gambacorta and D. Marqués, December 2007.
839 “Are there oil currencies? The real exchange rate of oil exporting countries” by M. M. Habib and M. Manolova Kalamova, December 2007.
840 “Downward wage rigidity for different workers and fi rms: an evaluation for Belgium using the IWFP procedure” by P. Du Caju, C. Fuss and L. Wintr, December 2007.
841 “Should we take inside money seriously?” by L. Stracca, December 2007.
842 “Saving behaviour and global imbalances: the role of emerging market economies” by G. Ferrucci and C. Miralles, December 2007.
843 “Fiscal forecasting: lessons from the literature and challenges” by T. Leal, J. J. Pérez, M. Tujula and J.-P. Vidal, December 2007.
844 “Business cycle synchronization and insurance mechanisms in the EU” by A. Afonso and D. Furceri, December 2007.
845 “Run-prone banking and asset markets” by M. Hoerova, December 2007.
27ECB
Working Paper Series No 873February 2008
846 “Information combination and forecast (st)ability. Evidence from vintages of time-series data” by C. Altavilla and M. Ciccarelli, December 2007.
847 “Deeper, wider and more competitive? Monetary integration, Eastern enlargement and competitiveness in the European Union” by G. Ottaviano, D. Taglioni and F. di Mauro, December 2007.
848 “Economic growth and budgetary components: a panel assessment for the EU” by A. Afonso and J. González Alegre, January 2008.
849 “Government size, composition, volatility and economic growth” by A. Afonso and D. Furceri, January 2008.
850 “Statistical tests and estimators of the rank of a matrix and their applications in econometric modelling” by G. Camba-Méndez and G. Kapetanios, January 2008.
851 “Investigating infl ation persistence across monetary regimes” by L. Benati, January 2008.
852 “Determinants of economic growth: will data tell?” by A. Ciccone and M. Jarocinski, January 2008.
853 “The cyclical behavior of equilibrium unemployment and vacancies revisited” by M. Hagedorn and I. Manovskii, January 2008.
854 “How do fi rms adjust their wage bill in Belgium? A decomposition along the intensive and extensive margins” by C. Fuss, January 2008.
855 “Assessing the factors behind oil price changes” by S. Dées, A. Gasteuil, R. K. Kaufmann and M. Mann, January 2008.
856 “Markups in the euro area and the US over the period 1981-2004: a comparison of 50 sectors” by R. Christopoulou and P. Vermeulen, January 2008.
857 “Housing and equity wealth effects of Italian households” by C. Grant and T. Peltonen, January 2008.
858 “International transmission and monetary policy cooperation” by G. Coenen, G. Lombardo, F. Smets and R. Straub, January 2008.
859 “Assessing the compensation for volatility risk implicit in interest rate derivatives” by F. Fornari, January 2008.
860 “Oil shocks and endogenous markups: results from an estimated euro area DSGE model” by M. Sánchez, January 2008.
861 “Income distribution determinants and public spending effi ciency” by A. Afonso, L. Schuknecht and V. Tanzi, January 2008.
862 “Stock market volatility and learning” by K. Adam, A. Marcet and J. P. Nicolini, February 2008.
863 “Population ageing and public pension reforms in a small open economy” by C. Nickel, P. Rother and A. Theophilopoulou, February 2008.
864 “Macroeconomic rates of return of public and private investment: crowding-in and crowding-out effects” by A. Afonso and M. St. Aubyn, February 2008.
865 “Explaining the Great Moderation: it is not the shocks” by D. Giannone, M. Lenza and L. Reichlin, February 2008.
866 “VAR analysis and the Great Moderation” by L. Benati and P. Surico, February 2008.
28ECBWorking Paper Series No 873February 2008
867 “Do monetary indicators lead euro area infl ation?” by B. Hofmann, February 2008.
868 “Purdah: on the rationale for central bank silence around policy meetings” by M. Ehrmann and M. Fratzscher, February 2008.
869 “The reserve fulfi lment path of euro area commercial banks: empirical testing using panel data” by N. Cassola, February 2008.
870 “Risk management in action: robust monetary policy rules under structured uncertainty” by P. Levine, P. McAdam, J. Pearlman and R. Pierse, February 2008.
871 “The impact of capital fl ows on domestic investment in transition economies” by E. Mileva, February 2008.
872 “Why do Europeans work part-time? A cross-country panel analysis” by H. Buddelmeyer, G. Mourre and M. Ward, February 2008.
873 “The Feldstein-Horioka fact” by D. Giannone and M. Lenza, February 2008.
