working paper number 65 august 2005 - center for … paper number 65 august 2005 reliving the...
TRANSCRIPT

Working Paper Number 65 August 2005
Reliving the ‘50s: the Big Push, Poverty Traps,
and Takeoffs in Economic Development By William Easterly
Abstract
The classic narrative of economic development -- poor countries are caught in poverty traps, out of which they need a Big Push involving increased aid and investment, leading to a takeoff in per capita income -- has been very influential in development economics since the 1950s. This was the original justification for foreign aid. The narrative lost credibility for a while but has made a big comeback in the new millennium. Once again it is invoked as a rationale for large foreign aid programs. This paper applies very simple tests to the various elements of the narrative. Evidence to support the narrative is scarce. Poverty traps in the sense of zero growth for low income countries are rejected by the data in most time periods. There is evidence of divergence between rich and poor nations in the long run, but this does not imply zero growth for the poor countries. Moreover, this divergence is more associated with institutions rather than the disadvantages of initial income. The idea of the takeoff does not garner much support in the data. Takeoffs are rare in the data, most plausibly limited to the Asian success stories. Even then, the takeoffs are not associated with aid and investment as the standard narrative would imply.

2
Reliving the ‘50s: the Big Push, Poverty Traps, and Takeoffs in Economic Development1
William Easterly
NYU
1 I am grateful from comments from participants in a seminar at Northwestern University, the CESIfo Venice Summer Workshop on Political Economy and Development, and the IFPRI/Cornell Conference on Threshold Effects and Non-Linearities in Growth and Development, and from Daron Acemoglu, David Canning, Michael Clemens, Steven Durlauf, Ravi Kanbur, Aart Kraay, Michael Kremer, Chih Ming Tan and Xiaobo Zhang. I am very grateful for research assistance and comments from Julia Schwenkenberg.

3
The Big Push has returned to favor in the development policy-making community, after
half a century of exile. Indeed, 2005 is shaping up as the Year of the Big Push. Part of the
motivation is the international effort to meet the eight Millennium Development Goals (MDGs),
which are actually 18 targets for improvements in social and economic indicators in developing
countries by the year 2015. The UN Millennium Project, commissioned by Kofi Annan to assess
how to meet the Millennium Development Goals set for 2015, issued a large Report in January
2005 that argued that poor countries were in a “poverty trap.” Escaping the trap requires:
a big push of basic investments between now and 2015 in public administration, human capital (nutrition, health, education), and key infrastructure (roads, electricity, ports, water and sanitation, accessible land for affordable housing, environmental management).2 The Millennium Project recommends a series of technical interventions, such as planting
nitrogen-fixing leguminous trees, distributing bed-nets to protect against malaria, giving fertilizer
to farmers, building health clinics, constructing battery-charging stations, giving each village a
truck and a truck repairman, etc. In an appendix to its report, the Millennium Project lists 449
recommended interventions in all.
Jeffrey Sachs echoed this in his 2005 book, The End of Poverty, when he said
A combination of investments well attuned to local needs and conditions can enable African economies to break out of the poverty trap. These interventions need to be applied systematically, diligently, and jointly since they strongly reinforce one another. (p. 208) Sachs called upon developing countries to have an “Investment Plan, which shows the size,
timing, and costs of the required investments” as well a “Financial Plan to fund the Investment
Plan, including the calculation of the Millennium Development Goals Financing Gap, the portion
of financial needs the donors will have to fill.” (p. 273).
Sachs envisions an administrative apparatus to implement the Plans:
Each low income country should have the benefit of a united and effective United Nations country team, which coordinates in one place the work of the UN specialized agencies, the IMF, and the World Bank. In each country, the UN country team should be led by a single United Nations resident coordinator, who reports to the United Nations Development Program, who in turn reports to the UN secretary-general. (p. 285)
2 UN Millennium Project, Overview Report, 2005, p. 19

4
With these elements in place and adequate foreign aid, Sachs says that “success in ending the
poverty trap will be much easier than it appears.” (p. 289)
British Prime Minister Tony Blair likewise called at the World Economic Forum in
Davos in January 2005 for “a big, big push forward” in Africa, featuring a big increase in foreign
aid.3 Prime Minister Blair commissioned a Report on Africa, which released its findings in March
2005. Tony Blair had the Big Push in Africa at the top of the agenda of the G-8 summit meeting
in July 2005. The report summarized its findings as:
The actions proposed by the Commission constitute a coherent package for Africa. The problems they address are interlocking. They are vicious circles which reinforce one another. They must be tackled together. To do that Africa requires a comprehensive ‘big push’ on many fronts at once.4 The World Bank and IMF issued a joint report on the Millennium Development Goals in
April 2005, calling for “a big push in aid” They call upon developing countries and foreign aid
donors to implement the Big Push as follows:
For coherence and effectiveness, the scaling up of development efforts at the country level must be guided by country-owned and -led poverty reduction strategies (PRSs) or equivalent national development strategies. Framed against a long-term development vision, these strategies should set medium-term targets—tailored to country circumstances—for progress toward the MDGs and related development outcomes. And they should define clear national plans and priorities for achieving those targets, linking policy agendas to medium-term fiscal frameworks. Donors should use these strategies as the basis for aligning and harmonizing assistance. Official development assistance (ODA) must at least double in the next five years to support the MDGs, particularly in low-income countries and Sub-Saharan Africa. (p. xviii) 5 Judging by recent statements, a Big Push involves a combination of (1) a big increase in foreign
aid, (2) a simultaneous increase in investment in many different sectors, as well as a package of
complementary policy changes and technical interventions, and (3) a national plan and
administrative apparatus to direct the investments, technical interventions, and policy changes.
Do “Big Pushes” work? Does economic development happen mainly through Big
Pushes? There are three inter-related concepts that we can explore empirically: the Big Push, the
Poverty Trap, and the Takeoff. In the traditional development narrative, which has recently
regained favor, the least developed countries are caught in a Poverty Trap, from which they need
3 International Herald Tribune, Friday January 28, 2005, p. 1 4 OUR COMMON INTEREST: REPORT OF THE COMMISSION FOR AFRICA, March 2005, p. 13 5 IMF and World Bank, 2005.

5
a Big Push involving increased aid and investment to emerge, after which they will have a
Takeoff into self-sustained growth. What evidence is there for or against this narrative?
Note that the three concepts are related in the standard narrative, but don’t have to be.
One could find evidence for poverty traps, but not for takeoffs, or vice versa. One could accept
poverty traps, but still not believe in a Big Push to be implemented by the aid agencies. Also the
particular form of poverty trap here is restricted – it is one of stagnation, zero per capita growth,
which does not rule out other possible poverty traps. The specificity of the classic development
narrative makes it easier to test, and it is worth testing given its current popularity in policy
debates. However, I don’t intend to push the conclusions beyond a judgment on whether the
narrative holds.
Intellectual history
Paul Rosenstein Rodan wrote the founding article of development economics in 1943,
innocuously titled “Problems of Industrialization of Eastern and South-eastern Europe.” He called
for large-scale externally-financed investment in Eastern European industry, which would not
spontaneously emerge from the private sector because of external economies and
complementarities between industries. His idea was widely adopted as applicable to the problems
of all “Third World” economies and came to be known as the “Big Push.”
There are parallels between development economics of the 1940s and 1950s and the ideas
of the Big Push current today. Then, as now, there were economists who advocated a “Big Push”
to get countries out of a “poverty trap,” foreign aid to fill the “Financing Gap,” and action on all
fronts through comprehensive “planning”.6 The 1960 counterpart to Sachs’ 2005 The End of
Poverty was Walt Rostow’s best-selling The Stages of Economic Growth, which argued that
countries could emerge out of stagnation into self-sustained growth thanks to an aid-financed
increase in investment. It was Rostow that popularized the term “takeoff.”
6 A related classic development model is the “two-gap model”, which stresses the role of aid to “fill the gap” between actual investment and the investment required to reach a target growth rate. Easterly (1999) showed how this model also continues to be influential and rejected its predictions.

6
To be sure, development economists at that time advocated far more state intervention in
the poor economies than the advocates of the Big Push do now. The previous generation would
have been sympathetic to planning as an economic system, while today’s advocates of the Big
Push are clearly in favor of a free market as an economic system. However, there is still a
planning parallel, as today’s advocates argue that large-scale public action is needed to escape
from a poverty trap that keeps poor countries from the benefits of a free market, and these public
actions must be planned by someone at the center.
Jeffrey Sachs in his new book The End of Poverty is a representative statement on the
renewed attraction of the poverty trap story today. He has many ideas on how the poverty trap
happens, which seems to be influencing the above policymakers. One that is familiar from both
the old literature on poverty traps is that poor people do not save enough.
A second element in the poverty trap is a nonconvexity in the production function. Sachs
suggests there are increasing returns to capital at low initial capital per person. He gives the
example of a road with half of the road paved and half impassable due to missing bridges or
washed out sections. Repairing the impassable sections would double the length of road, but
would much more than double the output from the road. “This is an example of a threshold effect,
in which the capital stock becomes useful only when it meets a minimum standard.” (Sachs
2005,p. 250)
These two mechanisms have always been prominent in the development policy
community because they seem to create a simple way to break the poverty trap – give foreign aid.
According to Sachs, the role of foreign aid is to increase the capital stock enough to cross the
threshold level (the Big Push): “if the foreign assistance is substantial enough, and lasts long
enough, the capital stock rises sufficiently to lift households above subsistence… Growth
becomes self-sustaining through household savings and public investments supported by taxation
of households.” (Sachs 2005, p. 246) The last statement is the “take-off” hypothesis.
The UN Millennium Project and Jeffrey Sachs argue that it is the poverty trap rather than bad
government that explains poor growth of low income countries and the failure to make progress

7
towards the Millennium Development Goals (MDGs). Sachs says “the claim that Africa’s corruption
is the basic source of the problem {the poverty trap} does not withstand practical experience or
serious scrutiny.”7 Likewise the Millennium Project says “Many reasonably well governed countries
are too poor to make the investments to climb the first steps of the ladder.”8
The theory of poverty traps is quite appealing: there are many ways in which we could think
that countries could be caught in traps. The new growth literature has set out a number of interesting
poverty trap models over the past two decades. For example, the Lucas (1988) model could predict a
poverty trap in which low average skills in the population could discourage new entrants to the labor
force from getting skills, perpetuating a low skill trap. Murphy, Shleifer, and Vishny (1989) set out a
formal model of the Rosenstein-Rodan poverty trap and Big Push. Azariadis and Stachurski 2004
have a survey of many theoretical models of poverty traps.
Even if there is a poverty trap, it is not clear that a Big Push engineered by administrative
planners will work. Another interesting bit of intellectual history for evaluating the Big Push is
the debate about central planning versus markets in the mid 20th century. F.A. Hayek was the
leading critic of central planning.9 He pointed out that planners at the top do not have enough
information about the realities at the bottom to design the right interventions in the right place at
the right time. In his pithy phrase, “the success of action in society depends on more particular
facts than anyone can possibly know.”10 The information problem is particularly severe in foreign
aid, which gets little or no feedback from the voiceless poor on how to fix local problems or the
costs and benefits of doing so. The vast diversity of circumstances in poor countries calls for
more local knowledge than is usually available to Big Push planners.
A related problem many have pointed out with plans is one of incentives. In foreign aid
and in many other planning situations, the planner is not accountable to the planned and so does
not internalize the costs and benefits of action. To make things even worse, many different
7 Sachs 2005, p. 191 8 UN Millennium Project 2005, p. 34. 9 Hayek’s reputation is tainted somewhat by his extreme predictions that state intervention in democratic capitalist societies would lead inevitably to totalitarian socialism, a prediction that obviously did not come true. However, his sharp insights into the shortcomings of planning and the spontaneous emergence of markets should be judged independently for their intellectual contribution. 10 quoted in Lee 2005

8
foreign aid donors are contributing to the Big Push, which further weakens the incentive of any
one donor through the usual collective action problems. Even if the planner has good incentives,
plans can be decreed at the top, but must be implemented at the bottom. How to design principal-
agent contracts to give good incentives for aid agency officials and government civil servants to
do the interventions right and get results for the poor? This problem is particularly severe in
foreign aid, when the actions and outcomes at the bottom are often unobservable to the
administrators at the top, and where corruption is a problem in the civil service of poor countries.
Testing the poverty trap
Kraay and Raddatz (2005) have recently tested directly whether the savings and
increasing returns mechanisms hold in the data. They point out that saving would have to follow
an S-curve to generate a poverty trap, first increasing little with income, then increasing steeply,
then flattening out again. They reject the S-curve in the data on saving and per capita income.
They also fail to find evidence of the technological non-convexities that also are necessary to
create the poverty trap. They conclude there is little evidence for a poverty trap based on these
mechanisms.11
We can check further on some of the intermediate steps in the Big Push. Sachs said that
large aid increases would finance “…a ‘big push’ in public investments to produce a rapid “step”
increase in Africa’s underlying productivity, both rural and urban.”12 Over 1970-94, there is good
data on public investment for 22 African countries. These countries’ governments spent $342
billion on public investment. The donors gave these same countries’ governments $187 billion in
aid over this period. Unfortunately, the corresponding “step” increase in productivity, measured
as per capita growth over this period, was zero.
Has aid had the growth effects that the poverty trap model would predict? Decades of
research on aid and growth has failed to generate evidence for this prediction.13 The big stylized
facts certainly do not support the prediction that aid has big growth effects, helping countries to
11 Graham and Temple 2004 also use a calibrated model of multiple equilibria and find that only a small portion of the income gap between rich and poor can be explained by such a model. 12 Sachs et al., 2003. 13 Easterly 2003 summarizes some of this research.

9
escape from poverty traps: (1) growth is lower in aid-intensive countries than in developing
countries that get little aid, (2) aid has risen over time as a percent of income in Africa, but
Africa’s growth rate has fallen over time.
More sophisticated testing that would control for selection effects and reverse causality
fails to find a robust effect of aid on growth. Claims are periodically made for a positive growth
effect of aid, which later robustness checks fail to replicate. The latest round in this long literature
is Rajan and Subramanian 2005, which tests virtually all of the earlier positive claims that aid has
growth effects and finds no supporting evidence.
A blunt force approach to testing the poverty trap could just ask: do the poorest countries
have significantly lower per capita growth than the rest, and is their growth zero? We have data
on per capita income from 1950 to 2001 for 137 countries from a statistical compilation done by
the economist Angus Maddison (I exclude Communist economies and Persian Gulf oil producers
as special cases). We rank countries according to their per capita income in 1950. Did the
poorest countries remain stuck in poverty over the next half century? The poorest fifth of
countries in 1950 increased their income over the next five decades by a factor of 2.25 times. The
other four-fifths of countries increased their incomes by a factor of 2.47 times. The difference in
growth rates between the two groups is not statistically significant. We can reject that the growth
rate of the poorest countries as a group was zero.
To be sure, there were individual poor countries that failed to grow among the poorest
countries. Chad had zero growth from 1950 to 2001. Zaire/Democratic Republic of the Congo
actually had negative per capita growth over this period. However, this is offset by such success
stories as Botswana, which was the fourth poorest in 1950, but increased its income by a factor of
13 by 2001. Lesotho was the fifth poorest in 1950, but increased its income by a factor of 5 over
the half-century. Other subsequent success stories who were among the poorest in 1950 are China
and India.

10
Testing the poverty trap for long periods Per capita growth for: 1950-2001 1950-75 1975-2001 1980-2001 1985-2001
Poorest fifth at beginning of period indicated 1.6% 1.9% 0.8% 0.5%* 0.2%*All others 1.7% 2.5%** 1.1% 0.9% 1.3%**Reject stationary income for poorest fifth Yes Yes Yes Yes YesFail to reject nonstationary income for poorest fifth Yes Yes Yes Yes Yes*Poorest fifth not statistically distinguishable from zero **All others's growth statistically distinguishable from poorest fifth Sample: 137 countries. Statistical tests exclude 12 transition economies and Gulf oil states
There are further statistical tests we can do to assess the poverty trap hypothesis. If the
poverty trap hypothesis holds, then the poorest countries’ log per capita incomes should be
stationary. Income will fluctuate randomly around this level, but will always tend to return to it.
There are two ways we can test the hypothesis of stationarity in the panel data on log per capita
incomes. We can have stationarity as the null hypothesis and see whether the data reject the null
(the Hadri (2000) test), or we can have non-stationarity as the null hypothesis and see whether the
data fail to reject non-stationarity (the Im-Pesaran-Shin (2002) test). When we do a test for the
stationarity of income over the subsequent half century for the poorest fifth of countries in 1950,
we decisively reject the null hypothesis of stationarity. When we take non-stationarity to be the
null, the data provide no evidence against that hypothesis.
Perhaps it was aid that enabled poor countries to have non-stationary income? When I
break the sample in half into those poor countries that had above average foreign aid and below
average foreign aid, I find identical results on non-stationarity 1950-2001 in both halves as with
the above tests. Poor countries without aid had enough positive growth to reject the poverty trap
hypothesis.

11
Let us keep looking for confirmation of the two main predictions of the poverty trap
story: (1) that growth of the poorest countries is lower than other countries, and (2) per capita
growth of the poorest countries is zero. The poorest did have lower growth in an earlier period,
1950-75, than the others. However, this was not a poverty trap, as average growth of the poorest
during 1950-75 was still a very healthy 1.9 percent per year (roughly the same as the long-run
growth rate of the American economy, for example).There is still no evidence of lower growth
for the poorest countries for recent periods, like 1975-2001 or 1980-2001. The poorest fifth of
countries at the beginning of those periods had growth performance over the subsequent period
that was statistically indistinguishable from the other four-fifths of countries. Only when the
starting point is put in 1985 does there finally appear evidence that the poorest did worse.
The evidence that Jeffrey Sachs adduces for the poverty trap in his book The End of Poverty
is from this later period. So over 1985 to the present, it is true that the poorest fifth of countries have
significantly lower per capita growth than other countries, about 1.1 percentage points lower over. It
doesn’t help the poverty trap story that 11 out of the 28 poorest countries in 1985 had NOT been in the
poorest fifth back in 1950. They had gotten into poverty by declining from above, rather than being
stuck in it from below. Even for this period, we reject the hypothesis that all of the poorest countries
had stable per capita income for 1985 to the present.
The later period is when the stylized facts are most consistent with a poverty trap.
However, the poorest countries were getting more in foreign aid as a percent of their income in
the last 15 years, compared to the previous periods. Foreign aid is supposed to be helping the
poor countries escape from the poverty trap; hence the poorest countries in the recent decade
should have been LESS likely to be stuck in poverty than the previous decades with lower foreign
aid. In sum, the evidence for an aid-induced Great Escape from poverty is less than
overwhelming.
Research by Ricardo Hausmann, Lant Pritchett, and Dani Rodrik in 2004 studied “growth
accelerations,” episodes over 1950 to 2000 in which per capita growth rose by at least two percentage
points for at least 8 years. According to the poverty trap hypothesis, we should not expect to see these
growth accelerations for the poorest countries. However, Hausmann and co-authors found the

12
opposite: growth accelerations were more likely in the poorest quarter of the sample than for any other
group. As in my findings above, they found the poorest countries did better in earlier than in later
periods.14 Out of six sustained growth accelerations from the bottom rung of the sample (the bottom
20 percent of per capita incomes, with date of acceleration in parentheses) – Uganda (1989), Congo-
Brazzaville (1969), Indonesia (1967), Thailand (1957), China (1978), and Pakistan (1979)– only one
of them (Uganda) involved an above-average amount of aid at the time of the growth acceleration.
Divergence Big Time: Poverty Traps or Bad Government?
There is a big historical fact that could be consistent with a poverty trap. This is what
Lant Pritchett called “Divergence Big Time” (Pritchett 1997). The gap between the richest and
poorest countries widened drastically over the last two centuries, with the ratio of the max to the
min going from about 6 to about 70 today. There IS a positive correlation between per capita
growth from say 1820 to 2001 and the initial level of income in 1820, as shown in the table
below. Was this because the poor countries were stuck in a poverty trap? Well, first of all, the
data do not actually fit our definition of a poverty trap – per capita growth of the poorest countries
is not zero. The predicted level of annual per capita growth 1820-2001 for the poorest country in
the sample in 1820 (Nepal) has a 95 percent confidence interval {0.80, 1.26}. African countries
are not in the sample. However, Maddison gives an estimate for the continent as a whole
(including North Africa) in 1820 -- per capita growth in Africa from 1820 to 2001 is 0.7 percent
per annum.
However, Divergence Big Time still suggests poor countries are at some growth
disadvantage – does this reflect low savings and/or increasing returns to capital? The alternative
explanation is that Europe and its offshoots discovered some combination of democracy and
capitalism that made possible the industrial revolution. The institutions of democracy and
capitalism could be correlated with per capita income in 1820 and that could explain why
countries that were richer in 1820 subsequently grew faster. This would be closely related to the
“Reversal of Fortune” finding of Acemoglu, Johnson, and Robinson 2002. This could imply an
14 Hausmann, Pritchett, and Rodrik 2004

13
institutional poverty trap, but not the savings and technology poverty trap favored by the
traditional development narrative.
The table tests this story by using the Polity IV database on democracy since 1820 as a
proxy for institutional development. I average whatever Polity data is available on each country
over 1820-2001 (and then over 1870-2001), which implicitly assumes that any periods of missing
data showed the same democracy on average as those periods for which data is available. This
assumption is problematic, so I try two variants on this approach. First, I recognize that most
countries in the sample with missing data were under colonial administration, which is not
usually considered a very democratic institution. I make the assumption that colonial control
equates to the lowest democracy rating in Polity IV, and try the corrected variable as a measure of
democracy. Second, I simply omit any country that does not have at least 75 Polity IV
observations over 1820-2001 (or 1870-2001). It turns out that all three alternatives give similar
results: average democracy is significantly correlated with long term growth in most
specifications, and the coefficient on per capita income declines, turns insignificant, or even turns
negative once you control for institutions.
I do not intend these results as a major empirical statement on the contentious issue of the
effect of democracy on growth or development. There is a huge literature on institutions and
economic growth and development.15 We know from modern data that democracy is highly
correlated with other measures of good institutions like property rights, contract enforcement, or
controls on corruption, so it could be proxying for any of these things. I think of this as a simple
descriptive exercise to compare two alternative hypotheses: (1) Divergence Big Time was due to
a savings/technology poverty trap or (2) it was due to bad government/institutions. The stylized
facts emerging from this exercise support (2) strongly over (1), confirming previous literature on
institutions and development.
15 See references and discussion in Acemoglu et al. 2004, Easterly and Levine 2003, and Rodrik, Subramanian, and Trebbi 2002.
14
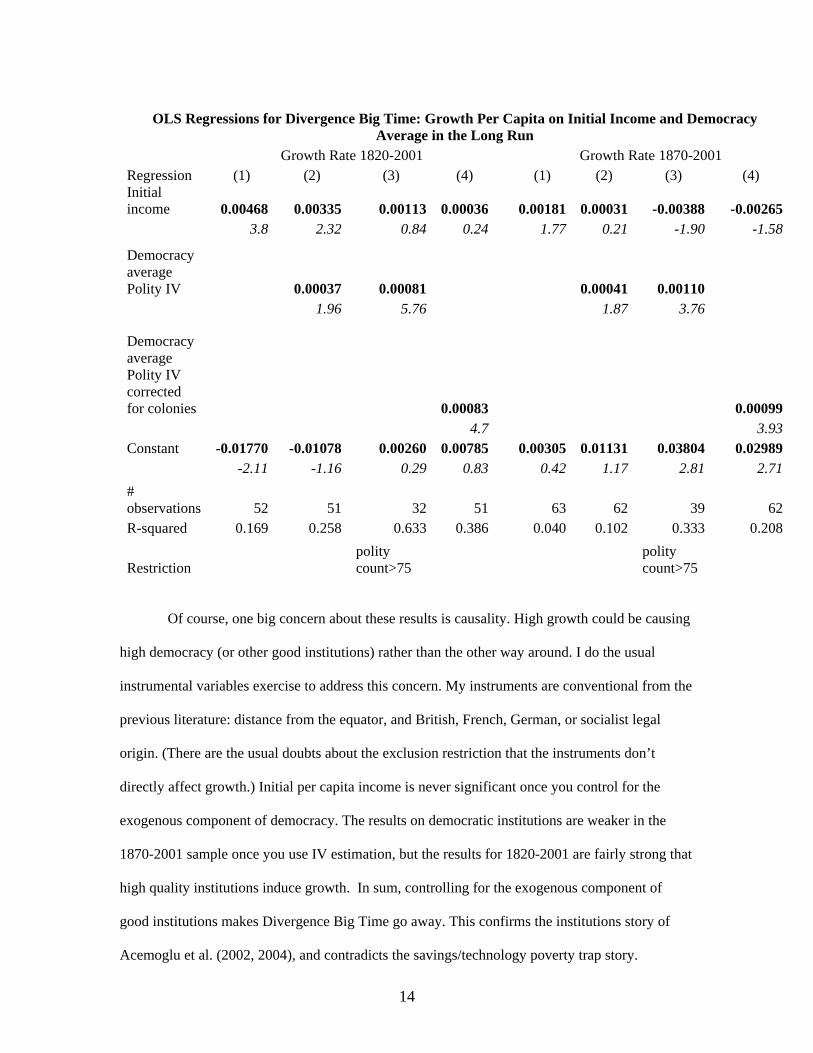
OLS Regressions for Divergence Big Time: Growth Per Capita on Initial Income and Democracy Average in the Long Run
Growth Rate 1820-2001 Growth Rate 1870-2001 Regression (1) (2) (3) (4) (1) (2) (3) (4) Initial income 0.00468 0.00335 0.00113 0.00036 0.00181 0.00031 -0.00388 -0.00265 3.8 2.32 0.84 0.24 1.77 0.21 -1.90 -1.58
Democracy average Polity IV 0.00037 0.00081 0.00041 0.00110 1.96 5.76 1.87 3.76
Democracy average Polity IV corrected for colonies 0.00083 0.00099 4.7 3.93Constant -0.01770 -0.01078 0.00260 0.00785 0.00305 0.01131 0.03804 0.02989 -2.11 -1.16 0.29 0.83 0.42 1.17 2.81 2.71# observations 52 51 32 51 63 62 39 62R-squared 0.169 0.258 0.633 0.386 0.040 0.102 0.333 0.208
Restriction polity count>75
polity count>75
Of course, one big concern about these results is causality. High growth could be causing
high democracy (or other good institutions) rather than the other way around. I do the usual
instrumental variables exercise to address this concern. My instruments are conventional from the
previous literature: distance from the equator, and British, French, German, or socialist legal
origin. (There are the usual doubts about the exclusion restriction that the instruments don’t
directly affect growth.) Initial per capita income is never significant once you control for the
exogenous component of democracy. The results on democratic institutions are weaker in the
1870-2001 sample once you use IV estimation, but the results for 1820-2001 are fairly strong that
high quality institutions induce growth. In sum, controlling for the exogenous component of
good institutions makes Divergence Big Time go away. This confirms the institutions story of
Acemoglu et al. (2002, 2004), and contradicts the savings/technology poverty trap story.

15
IV Regressions for Divergence Big Time: Growth Per Capita on Initial Income and Democracy Average in the Long Run
Per Capita Growth 1820-2001 Per Capita Growth 1870-2001 Regressions 1 2 3 4 5 6 Log initial income 0.00269 0.00184 -0.00069 -0.00025 -0.00263 -0.00415 1.64 1.03 -0.35 -0.12 -0.82 -1.61Polity IV Democracy Average over whole period 0.00067 0.00065 0.00062 0.00081 2.57 3.44 1.70 1.68
Polity IV Democracy Average Corrected for Colonies 0.00109 0.00135 3.74 3.13Constant -0.00791 -0.00142 0.01374 0.01407 0.03069 0.03860 -0.77 -0.12 1.13 1.09 1.48 2.34R-squared 0.304 0.599 0.507 0.128 0.303 0.282Observations 45 30 45 54 37 54
Restrictions
Polity count >75
Polity Count >75
Instruments: Distance from equator, British legal origin, French legal origin, socialist legal origin, German legal origin
I get similar results when I run a horse race between initial income and various measures of
quality of institutions in the modern data. There was still divergence in 1960-2002 according to the
following table. This does not contradict the evidence on lack of a poverty trap over 1960-2001
presented earlier, since the predicted growth rate of the lowest income group in the regression below is
still significantly above zero. I find both the following statements to be true: (1) we can reject that the
coefficient of growth 1960-2002 on initial income is zero, and (2) we cannot reject the hypothesis that
the poorest quintile had the same growth as the top four-fifths of the sample and we can reject that the
poorest quintile’s growth was zero. We could still detect a tendency towards absolute divergence with

16
the help of the middle income and high income observations, even though we cannot detect
abnormally low growth of the bottom quintile over the last 4 decades.
I use three widely used measures of institutions: (1) the Polity IV measure again, now
averaged over 1960-2002), (2) the Freedom House measure of political liberties (with the sign
reversed, since an increase in this measure means less liberty), averaged over all available years,
which are 1972-2002, and (3) Economic Freedom in the World from the Fraser Institute, averaged
over all available years, which are 1970-2002. All measures of institutions are strongly significant
predictors of growth 1960-2002, and make initial income negative in the regressions (significantly so
in the IV regressions). The institutions story makes Divergence go away in the more recent data as
well.16
16 This result echoes the huge “conditional convergence” literature. I do not intend to address issues in that literature; I am just testing whether institutions could account for divergence.

17
Regressions for divergence in 1960-2002 Dependent variable: per capita growth averaged over 1960-2002
Divergence OLS Regressions with
Institutions IV Regressions with
Institutions 1 2 3 4 5 6 7 Initial income 0.0043 -0.0009 -0.0031 -0.0035 -0.0124 -0.0177 -0.0145 3.12 -0.43 -1.49 -1.74 -2.13 -2.17 -2.21
Average Polity IV Democracy, 1960-2002 0.0016 0.0048 2.83 2.80 Average Freedom House Political Liberties, 1972-2002 0.0045 0.0126 4.01 2.52
Average Economic Freedom, 1970-2002 0.0102 0.0225 5.69 2.63Constant -0.0148 0.0153 0.0552 -0.0136 0.0855 0.1918 0.0007 -1.4 1.08 2.95 -1.16 2.42 2.48 0.05Observations 116 109 115 100 91 93 85R-squared 0.0553 0.1134 0.1739 0.2917
Instruments:
Distance from equator, British legal origin, French legal origin, socialist legal origin, German legal origin
I go back to the 1985-2001 period, where there was evidence of differential and zero growth
in the poorest countries. Let us test in this sample bad government against the poverty trap as a story
for poor economic growth. The earliest rating we have on corruption is from 1984, from the
International Country Risk Guide. We have a rating on democracy for the same year from a research
project at the University of Maryland called Polity IV. Let’s take countries that have the worst ratings
on both corruption and democracy, and call these countries “bad governments.” While poor countries
did worse, it’s also true that the 24 countries with bad governments in 1984 had significantly lower
growth 1985 to the present: 1.3 percentage points slower than the rest. There is some overlap between
these two stories, as poor countries are much more likely to have bad government. So which is it, bad

18
government or the poverty trap? When we control for both initial poverty and bad government, it is
bad government that explains the slower growth. We cannot statistically discern any effect of initial
poverty on subsequent growth once we control for bad government. This is still true if we limit the
definition of bad government to corruption alone. The recent stagnation of the poorest countries
appears to have more to do with awful government than with a poverty trap, contrary to the Sachs
hypothesis.
Testing for takeoffs Another staple of Big Push theories is that the Big Push will enable countries to break out
of the stagnant poverty trap into self-sustained growth. As the Big Push increases the capital
stock, consumers will rise above subsistence enabling them to save more. The increasing returns
to capital will be realized, allowing future investment to have attractive returns. This means aid
will only be needed temporarily, as it can be discontinued once self-sustained growth takes hold.
Rostow (1960) popularized the term “takeoff” for this transition; he identified specific dates that
takeoffs had begun in various countries. A similar concept abounds in the latest generation of Big
Push ideas. Rostow suggested aid could be discontinued after 10-15 years in 1960; Sachs today
talks about aid being discontinued in 2025. The prediction about growth is that a poor country
with a successful Big Push will move from a regime of zero per capita growth to a regime of
stable positive per capita growth.
The takeoff concept is independently accepted by some scholars who don’t believe in
poverty traps and Big Pushes, using alternative models. For example, Parente and Prescott 2000
have a notion very similar to takeoff in their story of barriers to technology adoption. Likewise
Acemoglu and Zilibotti 1997 have a takeoff story that depends on risk diversification. Hence,
testing of takeoffs may be of more general interest than just as part of the classic development
narrative.
Also there can be different varieties of takeoffs. The one I am examining is the definition
I have just given: a country that permanently shifts from per capita growth around zero to stable
positive per capita growth. I will first use some arbitrary mechanical rules to detect takeoffs, and
then I will use a more formal statistical procedure.

19
I arbitrarily take per capita growth that lies in the interval [-0.5%,0.5%] to be “zero
growth”, and define as stable positive per capita growth any subsequent growth that stays above
1.5 percent per year, measured over suitably long periods. The takeoff definition excludes cases
in which high positive per capita growth is preceded by negative growth (below -0.5 percent),
because part of the growth will simply be recovery to a previous level. To capture the idea of a
sudden takeoff, I also require that the shift be in adjacent periods. This is obviously sensitive to
the length of the period and the breakpoints for the periods. I try to define long enough periods to
allow for some time for takeoff to happen, and the breakpoints are given exogenously by the
years when the Angus Maddison (2003) dataset reports observations for a large # of countries.
After 1950, Maddison reports annual data through 2001. For rich countries, I used 1960 instead of
1950 as the last breakpoint because many European countries and Japan had artificially low
postwar output in 1950.
The following table shows that only one of today’s rich countries meet this definition of
“take-off”. This is the famous Japan take-off during the Meiji era.
In all other rich countries, we have gradual acceleration of growth rather than takeoff.
Growth slowly accelerated from a median value of 0.2 percent in 1600-1820 to 0.8 percent in
1820-1870, 1.3 percent in 1870-1913, 1.6 percent in 1913-1960, to 2.8 percent in 1960-2001.
This is not very consistent with a Big Push notion of a sudden switch from stagnation to vigorous
growth. The medians could smooth out variations in individual countries, but examining the latter
does not find much in the way of dramatic shifts either. The closest approximations would seem
to be in the late industrializers Ireland, Greece, Portugal, and Spain. The latter four did have a
dramatic acceleration of growth after 1960. However, the growth in these four countries was not
zero prior to the growth shift, as required by the takeoff hypothesis. Even in Japan, the takeoff
featured a smooth acceleration of growth rather than a one time movement from zero growth to
constant positive growth.
Is the definition of “zero growth” prior to the takeoff too stringent? A 0.5 percent per
capita growth rate cumulates to a 28 percent increase in income over 50 years and 65 percent

20
change over 100 years. It seems hard to argue that requiring annual per capita growth be below
this threshold to be counted as zero growth is overly stringent. Likewise, the requirement that
growth surpass 1.5 percent to be counted as a takeoff seems like a modest requirement. The
median growth rate of rich countries 1820 to 2001 is 1.6 percent, with very tight clustering of
growth rates around this median. This seems like as good a definition as any of a minimum
“normal” growth rate for a country that has “taken off.” Moreover, the movement from 0.5 to 1.5
is requiring a permanent change in growth of only 1 percentage point, which seems modest
compared to the expectations of enthusiasts for the “Big Push.”

21
Take-offs in rich countries (data from Maddison 2003)
1600-1700 1700-1820 1820-1870 1870-1913 1913-1960 1960-2001
1820-2001
Australia 3.7% 0.9% 1.1% 1.8% 2.1%Austria 0.2% 0.2% 0.8% 1.4% 1.3% 2.8% 1.6%Belgium 0.2% 0.1% 1.4% 1.0% 1.1% 2.7% 1.5%Canada 0.6% 1.3% 2.2% 1.4% 2.3% 1.6%Denmark 0.2% 0.2% 0.9% 1.6% 1.7% 2.4% 1.8%Finland 0.2% 0.2% 0.8% 1.4% 2.3% 2.9% 1.6%France 0.1% 0.2% 1.0% 1.4% 1.6% 2.5% 1.6%Germany 0.1% 0.1% 1.1% 1.6% 1.6% 2.2% 1.6%Greece 0.1% 0.2% 0.6% 1.4% 1.4% 3.4% 1.8%Ireland 0.2% 0.2% 1.4% 1.0% 1.0% 4.1% 1.6%Italy 0.0% 0.0% 0.6% 1.2% 1.8% 2.9% 1.9%Japan 0.1% 0.1% 0.2% 1.5% 2.2% 4.0% 1.4%Netherlands 0.4% -0.1% 0.8% 0.9% 1.5% 2.4% 1.7%New Zealand 1.2% 1.4% 1.2% Norway 0.2% 0.2% 0.5% 1.3% 2.3% 3.0% 1.5%Portugal 0.1% 0.1% 0.1% 0.6% 1.8% 3.8% 1.5%Spain 0.0% 0.1% 0.4% 1.2% 0.9% 4.0% 1.6%Sweden 0.2% 0.2% 0.7% 1.4% 2.2% 2.1% 1.7%United Kingdom 0.2% 0.3% 1.3% 1.0% 1.2% 2.1% 1.4%United States 0.7% 1.3% 1.8% 1.5% 2.3% 1.7%median growth of rich countries 0.2% 0.2% 0.8% 1.3% 1.6% 2.7% 1.6%
Unfortunately, the patterns of growth in developing countries in the long run are even
less supportive of the “take-off” concept. As Pritchett (2000) pointed out, the shape of various
developing countries log per capita income paths vary as “hills, plateaus, mountains, and plains”
in which there are unpredictable sequences of zero, positive, and negative growth. Easterly,
Kremer, Pritchett, and Summers (1993) pointed out the instability of growth, with a very low
correlation between who is growing in one period (measured as a decade, 15 years, 20 years, etc.)
and who is growing in the following period. If takeoffs dominated the data then we would expect
a stronger cross-period correlation as most countries would be in stable zero growth or positive
growth regimes, with only a few switchovers for those who began takeoffs in between the two
periods.

22
The following table shows data since 1820 for all developing regions from Maddison
(2003). Since developing countries were not so directly affected by World War II, I use 1950 as a
breakpoint (the breakpoints are again determined when data is available in Maddison for years
prior to 1950). I take advantage of the longer post-war period to split it into two periods divided
by 1975. It seems desirable to look at finer recent intervals for developing countries because the
takeoffs would presumably be more recent. I first examine data on developing country regions:
Looking for take-offs in developing country regions
Region 1820-1870 1870-1913 1913-1950
1950-1975
1975-2001
Africa 0.3% 0.6% 0.9% 1.8% 0.2%Caribbean countries (24) -0.3% 1.8% 1.4% 3.2% 1.0%East Asian countries (16 ) -0.1% 0.5% -0.1% 3.5% 3.4%East European Countries (7) 0.6% 1.4% 0.6% 3.7% 0.4%Latin America 0.0% 1.8% 1.4% 2.5% 0.8%West Asian countries (15) 0.4% 0.9% 1.3% 4.4% 0.2%
Only the East Asia region meets the definition of takeoff proposed above, since all the other
regions had growth dip below 1.5 percent in the period 1975-2001. Apparently growth was not so
“self-sustaining.” Latin America and the Caribbean also had already had an earlier proto-takeoff
period in 1870-1913, but failed to sustain it.
Looking at individual countries, Maddison has 44 developing countries with data
available at least as early as 1913. Five out of the 44 meet the definition of takeoff, using the
same periodization as above. The takeoffs (indicated with *, with periods of takeoff shown in
bold) are all well-known examples of success. The other 39 countries fail to meet the criteria of
takeoff of going from zero growth (between -0.5 percent and 0.5 percent) to sustained positive
growth (above 1.5 percent). The others did not meet the definition either because growth did not
stay above 1.5 percent after “take-off” (the most common reason), or because growth was above
0.5 percent in prior to the takeoff. Alas any mechanical rule will inevitably be arbitrary, but the
virtue of a mechanical rule is that one is not subjectively fiddling with the data.
I settled on this rule a priori and did not experiment with alternative rules. I will however
do one robustness check – suppose that we allow pre-takeoff growth to be between -1 and +1

23
percent, and still I require post-takeoff growth to permanently increase by 1 percentage point (so
now it must be above 2 percent). This adds 4 new takeoffs which will meet many observers’
priors as having had a takeoff – China, Indonesia, Taiwan, and Vietnam (shown with ** in the
table). However, three of the five original takeoffs no longer qualify – Hong Kong, India, and
Singapore all have intermediate way-stations of 1.5 percent growth, showing gradual acceleration
of growth rather than takeoff according to the new criteria. So according to the new rules, there
are six takeoffs in the data out of 44 countries.
The other striking thing about these takeoffs is that they are all happening in a
geographically concentrated region, amongst countries that have traditional ties with each other.
This seems to make them less than fully independent observations, and raises the question of
what could account for the spatial concentration.

24
Per capita growth and Takeoffs in historical data among developing countries
1820-1870
1870-1913
1913-1950
1950-1975
1975-2001 takeoff
Albania 1.4% 0.6% 3.3% 0.8% Algeria 1.0% 1.1% 0.4% 2.5% 0.4% Argentina 2.5% 0.7% 2.0% 0.0% Brazil 0.2% 0.3% 2.0% 3.7% 1.1% Bulgaria 1.4% 0.2% 5.0% -0.1% Burma 0.0% 0.7% -1.5% 2.1% 2.9% Chile 2.4% 1.0% 0.5% 3.2% China -0.2% 0.1% -0.6% 2.8% 5.4% ** Colombia 1.8% 1.5% 2.1% 1.3% Czechoslovakia 0.6% 1.4% 1.4% 3.0% 0.7% Egypt 0.6% 0.8% 0.0% 1.8% 2.9% Ghana 1.3% 1.0% 0.4% 0.2% Hong Kong 0.2% 1.5% 1.5% 4.6% 4.3% * Hungary 1.5% 0.5% 3.4% 1.0% India 0.0% 0.5% -0.2% 1.5% 3.0% * Indonesia 0.1% 0.8% -0.2% 2.3% 3.0% ** Iran 0.4% 0.8% 1.5% 4.9% -0.7% Iraq 0.4% 0.8% 0.8% 4.6% -4.6% Jamaica -0.5% 0.3% 2.1% 4.3% -0.2% Jordan 0.4% 0.8% 1.4% 1.8% 1.7% Lebanon 0.5% 1.1% 1.6% 1.4% 0.0% Malaysia 0.2% 0.7% 1.5% 2.1% 4.1% Mexico -0.2% 2.2% 0.8% 3.1% 1.2% Morocco 0.5% 0.5% 1.9% 0.9% 1.6% Nepal 0.0% 0.7% -0.2% 1.0% 1.8% North Korea 0.0% 0.7% -0.2% 5.2% -3.5% Peru 1.8% 2.1% 2.5% -0.6% Philippines 0.2% 0.7% 0.0% 2.6% 0.7% Poland 1.4% 0.9% 3.5% 1.0% Romania 1.5% -1.0% 4.6% -0.7% Singapore 0.2% 1.5% 1.5% 4.3% 4.6% * South Africa 1.5% 1.5% 1.2% 2.1% -0.1% South Korea 0.0% 0.7% -0.2% 5.7% 5.9% * Sri Lanka 1.1% 0.9% 0.0% 0.8% 3.2% Syria 0.5% 1.1% 1.6% 3.4% 1.2% Taiwan 0.2% 0.7% 0.6% 5.8% 5.4% ** Thailand 0.2% 0.4% -0.1% 3.5% 4.5% * Tunisia 0.8% 0.8% 0.6% 3.1% 2.5% Turkey 0.5% 0.9% 0.8% 3.5% 1.7% Uruguay 1.0% 0.9% 0.6% 1.3% USSR 0.6% 1.1% 1.7% 3.1% -1.1%

25
Venezuela 1.5% 5.2% 1.4% -0.8% Vietnam -0.1% 0.8% -0.3% 0.3% 3.7% ** Yugoslavia 1.3% 1.0% 4.5% -0.4%
Notes to table: data are all from Maddison 2003. All growth rates are for dates shown except for 1870-1913 for Chile, Colombia, and Peru, where the growth rates shown are for 1900-1913 – the earliest data available from Maddison
In sum, the episode analysis here examined the experience of 127 countries and found 9
takeoffs (according to two different definitions that are not consistent). To put it another way, the
contemporary and historical exercises for poor and rich countries together included 71 countries
that passed from an income of below $2000 (my arbitrary breakpoint for low income) to an
income above $2000 over some period. Excluding one takeoffs that is still below $2000 as of
2001 (India), 8 out of 71 countries emerging out of low income status did so by means of a
takeoff according to one definition or the other. This is not a very strong case for the hypothesis
that development usually happens through takeoffs.17
How do these takeoffs relate to foreign aid? I examine the 8 takeoffs that happened
around 1950-75 according to either definition, and collect aid statistics for 1960-75. Aid data on
the 1950s is not generally available. I was aware that there had been large US aid programs in the
1950s in South Korea and Taiwan, so further exploration tracked down a source of US aid to
these two countries from 1953 on, which is reflected in the numbers below.18 The median aid to
GDP ratio in the whole developing country sample for this period is 2.8 percent of GDP. Three of
the eight takeoffs are above this: Indonesia, South Korea, and Taiwan. Hence, we could describe
these three cases as fitting the pattern of an aid-financed takeoff, with Korea as the strongest
case.19 Of course, this does not necessarily give evidence that aid is associated with takeoffs, as
17 Pritchett (2000) did not explicitly set out to test for takeoffs, but he did look for structural breaks in growth rates in a way similar to what I am doing. Using PWT 5.6 data for 111 countries, he found 7 cases he called “Denver” (where the plains meet the Rocky Mountains), which are closely analogous to “takeoffs”. His methodology was to look for cases where growth was below 1.5 percent prior to a structural break and then above 1.5 percent after the break. The 7 cases were India, Sri Lanka, Indonesia, Chile, Uruguay, Ghana, and Mauritius. The different sample period and methodology explain different country selections, but the general result that few countries fit the pattern of “take-offs” is robust across my study and his. 18 Jacoby 1966 19However, Fox 1999 reviews the case study evidence on foreign aid and Korea, and questions the role of aid in Korea’s rapid growth (which began after US aid declined). Fox summarizes the studies as follows “foreign aid contributed only slightly to the Korean miracle and that rapid growth was due primarily to a combination of domestic factors and a favorable international environment.”

26
there were other countries that got high aid and did NOT have a takeoff. A probit regression for
the probability of takeoff as a function of aid to GNI over 1960-75 has an insignificant negative
coefficient on aid.
Takeoffs and aid, 1960-75
Country Name
Foreign aid as a percent of Gross National Income, 1960-75 except where noted
China #N/AHong Kong 0.11India 1.82Indonesia 3.93Korea, Rep./1 8.39Singapore 0.46Taiwan, China/1 3.75Thailand 0.90Median for whole sample 2.78/1 Data refer to average 1953-75
The other sign of a takeoff is supposed to be a large increase in investment as a share of
GDP. Unfortunately, we do not have data giving investment before 1950, so this prediction is
impossible to test directly. I am limited to examining the post take-off investment in the two
periods 1950-75 and 1976-2000, as shown in the following table, compared to the rest of the
cross-country sample. I list all countries that met either criteria for takeoff. Investment to GDP
ratios are undistinguished in China, India, Indonesia, South Korea, and Taiwan in 1950-75. They
are exceptional in Singapore and Hong Kong, and to a lesser degree in Thailand. If we do a probit
regression for who has a takeoff (according to either criteria or both), investment in 1950-75 is
not a significant predictor of these takeoffs. Investment in 1975-2000 is considerably more
exceptional in the takeoff countries, but this may be reverse causality, since this is long after the
takeoff started in these countries.
Investment to GDP ratios in Takeoff Countries

27
Percent of GDP Percentile ranking in the worldwide sample
1950-75 1975-2000 1950-75 1975-2000 China** 12.8 20.8 38% 77%Hong Kong* 30.8 25.2 86% 93%India* 11.0 12.2 31% 43%Indonesia** 9.2 17.7 26% 66%Singapore* 43.0 42.4 100% 100%South Korea* 19.0 36.0 59% 99%Taiwan** 14.0 19.9 46% 76%Thailand* 23.6 33.4 71% 98%Vietnam** 10.2 34%
*Takeoff according to first definition **Takeoff according to second definition Source for Investment/GDP ratios: Penn World Tables Version 6.1
Structural breaks and takeoffs
All my exercises thus far suffer from possible arbitrariness as to what and when is a
takeoff. As a robustness check, I also apply a more formal definition of takeoff to the annual time
series in Maddison since 1870. The number of years available is variable; all countries in this
sample have observations at least for 1950-2001, and a smaller sample have annual data for
longer periods. The sample with pre-1950 observations is smaller than in my previous use of this
data, because many countries have benchmark observations such as 1870, 1913, and 1950, but
don’t have annual data in between. On the other hand, I am now including countries that only
have data since 1950, which I did not include in the episode analysis above, so this makes the
sample bigger. The net effect is that I have a slightly bigger sample of 139 countries.
I use the Bai and Perron (1996, 2003) method of looking for structural breaks in time
series, in this case the log of per capita income. This method endogenously determines the
number of structural breaks in the trend of log income, and the dates of those breaks. The dates of
the breaks are chosen to maximize the fit to the data, and the number of breaks is chosen when
the improvement in fit from adding another break is sufficiently strong. For the minimum length
of a regime segment as a fraction of the sample period, the paper uses .25 for countries with only
post World War II data and .2 for longer time series (imposing a maximum of 2 breaks in the
former and 3 breaks in the latter). Experimenting with a larger number of maximum breaks did

28
not give different results. The procedure also calculates the statistical significance of the trend in
each sub-period.
My definition of a takeoff using this procedure is straightforward: any country that has a
continuous sequence of regimes of zero growth followed by a continuous sequence of regimes of
positive growth is called a takeoff. The appendix lists the results for 139 countries. Although the
takeoff hypothesis suggests only one break, the procedure found 2 or more breaks in 109
countries; none of the 30 countries with one break met the takeoff definition. I first define zero
and positive growth by estimated magnitudes as before: zero means lying in the interval [-.005,
.005] while positive means lying above .015. With this definition, there is only one takeoff in the
data! It is Costa Rica (1945). Of the previous takeoffs, China, Hong Kong, Indonesia, Singapore,
and Thailand did not have a continuous historical annual series when the takeoffs previously
shown took place. India, Japan, South Korea, and Taiwan do have a continuous historical series,
but the growth in the earliest periods is too high for the zero growth definition.
I next try an alternative definition of zero and positive growth based on statistical
significance. I define zero growth simply as growth that is not significantly different than zero,
while positive growth is growth that is significantly above zero. With this statistical definition,
Costa Rica again shows up as a takeoff, and Bolivia, Brazil, and Cape Verde are added:

29
Takeoffs using Bai-Perron structural breaks method
Country Bolivia Brazil Cape Verde Costa Rica
number of observations 57 132 52 82 number of breaks 2 3 2 3 date of first break 1957 1915 1962 1945 date of second break 1980 1941 1978 1964 date of third break 1970 1980 growth rate regime 1 -0.0005 0.0011 0.0142 0.0021 regime 2 0.0204 0.0154 -0.0053 0.0248 regime 3 0.0097 0.0292 0.0304 0.0288 regime 4 0.0104 0.0203 takeoff year 1957 1915 1978 1945 significantly different than zero at 5 percent levels shown in bold insignificant shown in italics
Bolivia, Brazil, and Cape Verde all failed to pass the previous criteria because either they had
growth above 0.5 percent prior to takeoff or growth below 1.5 percent after takeoff. The emphasis
on statistical significance rather than magnitude here gives different results.
This confusing picture of different takeoff countries for different methods shows mainly
that the takeoff is so elusive in the data that it is hard to find countries that robustly show takeoffs
according to what seem like simple, common-sense criteria. (Different data needs for different
methods and uneven data availability also complicate the picture.) What IS robust across all
methods for defining takeoffs is that takeoffs are uncommon in the data.
Conclusions
The classic narrative -- poor countries caught in poverty traps, out of which they need a
Big Push involving increased aid and investment, leading to a takeoff in per capita income -- has
been very influential in development economics. This was the original justification for foreign
aid. The narrative became less popular during the market-oriented 80s and 90s (even then the idea
of the “takeoff” remained widely accepted, as it still is), but has made a big comeback in the new
millennium. Once again it is invoked as a rationale for large foreign aid programs.

30
This paper applied very simple tests to the various elements of the narrative. Evidence to
support the narrative is scarce. Poverty traps in the sense of zero growth for low income countries
are rejected by the data in most time periods. There is evidence of divergence between rich and
poor nations in the long run, but this does not imply zero growth for the poor countries.
The idea of the takeoff does not garner much support in the data. Takeoffs are rare in the
data, most plausibly limited to the Asian success stories. Even then, the takeoffs do not seem
strongly associated with aid or investment in the way the standard Big Push narrative would
imply.
Coordination failures and poverty traps are fascinating objects for theoretical and
empirical exploration. However, the description of poverty traps, Big Pushes, and takeoffs as a
justification for foreign aid receives scarce support in the actual experiences of economic
development. The paper instead finds support for democratic institutions and economic freedom
as determinants of growth that explain the occasions under which poor countries grow more
slowly than rich countries. The institutional findings are not explored exhaustively in this paper
(since the area has been so well covered in the literature already). However, the stylized facts
presented in this paper are more consistent with a story of development in which development
happens when many agents have the institutional environment that allows and motivates them to
take small steps from the bottom, as opposed to development happening from a Big Push planner
at the top.

31
Bibliography
Acemoglu, Daron, Simon Johnson and James Robinson Reversal of Fortune: Geography and
Institutions in the Making of the Modern World Income Distribution, November 2002, Quarterly Journal of Economics, volume 117, pp. 1231-1294.
Acemoglu, Daron, Simon Johnson, and James A. Robinson, Institutions as the Fundamental
Cause of Long-Run Growth, April 2004 (forthcoming in Philippe Aghion and Steven Durlauf, editors, Handbook of Economic Growth).
Acemoglu Daron and Fabrizio Zilibotti, Was Prometheus Unbound by Chance? Risk,
Diversification and Growth, August 1997, Journal of Political Economy, volume 105, pp. 709-751.
Azariadis, Costas, and John Stachurski, (2004), “Poverty Traps”, Forthcoming in the Handbook
of Economic Growth, Aghion and Durlauf eds. Bai, Jushan and Pierre Perron (1996): "Estimating and Testing Linear Models with Multiple
Structural Changes," Econometrica, 1998, vol 66, 47-78 Bai, J. and P. Perron (2003): "Computation and Analysis of Multiple Structural Change Models,"
Journal of Applied Econometrics, 18, 1-22. Durlauf, Steven. Groups, Social Influences and Inequality: A Memberships Theory Perspective
on Poverty Traps, University of Wisconsin mimeo, August 2002 Easterly, William. “Can Foreign Aid Buy Growth?”, Journal of Economic Perspectives, Summer
2003 Easterly, W. and R. Levine, “Tropics, germs, and crops: the role of endowments in economic
development” Journal of Monetary Economics, 50:1, January 2003. Easterly, William. “The Ghost of Financing Gap: Testing the Growth Model of the International
Financial Institutions”, Journal of Development Economics, (60)2 December 1999, 423-438
Easterly, William & Kremer, Michael & Pritchett, Lant & Summers, Lawrence H., 1993. "Good
policy or good luck?: Country growth performance and temporary shocks," Journal of Monetary Economics, vol. 32(3), pages 459-483.
Fox, James S. Applying the Comprehensive Development Framework to USAID Experiences.
OED Working Paper Series No. 15 The World Bank Summer 2000 Graham, Bryan S. and Jonathan Temple, 2004. “Rich Nations, Poor Nations: How much can
multiple equilibria explain?,” mimeo, Harvard University. HADRI, KADDOUR Testing for stationarity in heterogeneous panel data. Econometrics Journal
(2000), volume 3, pp. 148–161 Hausmann, Ricardo, Lant Pritchett, and Dani Rodrik, GROWTH ACCELERATIONS, John F.
Kennedy School of Government, Harvard University, Revised, October 2004

32
Jacoby, Neil H. U.S. AID to Taiwan - A study of foreign Aid, Self-Help, and Development, Frederick A. Praeger, Inc Publishers: New York, 1966
Im, Kyung So, M. Hashem Pesaran, and Yongcheol Shin, 2002, Testing for Unit Roots in
Heterogeneous Panels, Cambridge University mimeo. IMF and World Bank, Global Monitoring Report 2005: Millennium Development Goals: from
Consensus to Momentum, Washington DC: Washington, 2005. Kraay, Aart and Claudio Raddatz, Poverty Traps, Aid, and Growth, World Bank mimeo, January
2005 Maddison, Angus. The World Economy: Historical Statistics. OECD. 2003 OUR COMMON INTEREST: REPORT OF THE COMMISSION FOR AFRICA, March 2005 Pritchett, Lant, 2000. "Understanding Patterns of Economic Growth: Searching for Hills among
Plateaus, Mountains, and Plains," World Bank Economic Review, vol. 14(2), pages 221-50.
Pritchett, Lant, 1997. "Divergence, Big Time," Journal of Economic Perspectives,
American Economic Association, vol. 11(3), pages 3-17. Raghuram G. Rajan and Arvind Subramanian, Aid and Growth: What Does the Cross-Country
Evidence Really Show? IMF mimeo, April 2005 Rodrik, Dani INSTITUTIONS FOR HIGH-QUALITY GROWTH: WHAT THEY ARE AND
HOW TO ACQUIRE THEM, Harvard University mimeo, October 1999 Rodrik, Dani , Arvind Subramanian and Francesco Trebbi, Institutions Rule: The Primacy of
Institutions over Geography and Integration in Economic Development, Harvard University mimeo, revised October 2002.
Sachs, Jeffrey D. The End of Poverty: Economic Possibilities for Our Time, The Penguin Press:
New York, 2005 Sachs, Jeffrey D., John W. McArthur, Guido Schmidt-Traub, Margaret Kruk, Chandrika Bahadur,
Michael Faye, and Gordon McCord, Ending Africa’s Poverty Trap, Paper presented at Brookings Panel on Economic Activity, 2003.
UN Millennium Project Report, Investing in Development: A Practical Plan to Achieve the
Millennium Development Goals: Main Report, United Nations: New York, 2005. UN Millennium Project, Investing in Development: A Practical Plan to Achieve the Millennium
Development Goals, Overview Report, UN: New York, 2005 .

33
Appendix: Bai-Perron Method for Estimating Structural Breaks, Results for 139 countries
selected by the sequential procedure suggested by Bai-Perron at 5% significance
coefficients in italics are not significant at 5% or above
Country nobs number
of breaks
date of
first break
date of second break
date of
third break
growth rate
regime 1
regime 2
regime 3
regime 4
Afghanistan 52 2 1969 1986 0.0039 0.0138 -0.0183
Albania 52 1 1971 0.0354 0.0005
Algeria 52 1 1976 0.0242 -0.0095
Angola 52 1 1973 0.0254 -0.0127
Argentina 102 2 1929 1967 0.0100 0.0151 0.0023
Australia 132 2 1928 1966 0.0059 0.0204 0.0185
Austria 132 2 1912 1953 0.0148 0.0071 0.0293
Bahrain 52 2 1969 1987 0.0269 0.0024 0.0177
Bangladesh 52 2 1970 1987 0.0076 0.0099 0.0318
Belgium 132 2 1939 1970 0.0085 0.0327 0.0189
Benin 52 2 1962 1978 -0.0088 -0.0004 0.0041
Bolivia 57 2 1957 1980 -0.0005 0.0204 0.0097
Botswana 52 2 1970 1987 0.0291 0.0623 0.0303
Brazil 132 3 1915 1941 1970 0.0011 0.0154 0.0292 0.0104
Bulgaria 52 2 1962 1975 0.0520 0.0391 -0.0112
Burkina Faso 52 1 1971 0.0198 0.0114
Burma 52 2 1964 1986 0.0297 0.0250 0.0504
Burundi 52 2 1968 1987 0.0084 0.0163 -0.0238
Cambodia 52 2 1968 1985 0.0229 0.0290 0.0131
Cameroon 52 2 1974 1987 0.0172 0.0403 -0.0075
Canada 132 2 1918 1971 0.0227 0.0246 0.0150
Cape Verde 52 2 1962 1978 0.0142 -0.0053 0.0304 Central African Republic
52 1 1961 0.0160 -0.0106
Chad 52 2 1962 1977 0.0155 -0.0062 0.0100
Chile 102 1 1980 0.0128 0.0434
China 52 1 1976 0.0209 0.0578
Colombia 102 2 1925 1970 0.0103 0.0171 0.0154 Comoro Islands 52 2 1973 1986 0.0299 0.0005 -0.0144

34
Congo 52 2 1966 1979 0.0146 0.0188 -0.0161
Costa Rica 82 3 1945 1964 1980 0.0021 0.0248 0.0288 0.0203
Côte d'Ivoire 52 2 1961 1981 0.0202 0.0163 -0.0208
Cuba 73 3 1943 1971 1986 0.0228 -0.0002 0.0224 -0.0178
Czecho- slovakia 54 2 1970 1987 0.0324 0.0115 0.0080
Denmark 132 2 1894 1957 0.0121 0.0153 0.0218
Djibouti 52 2 1968 1982 0.0081 -0.0256 -0.0335
Dominican Republic 52 2 1970 1983 0.0163 0.0208 0.0285
Ecuador 63 2 1956 1976 0.0313 0.0284 -0.0023
Egypt 52 1 1975 0.0204 0.0161
El Salvador 82 3 1945 1962 1979 0.0071 0.0162 0.0145 0.0159 Equitorial Guinea 52 2 1962 1987 0.0411 0.0093 0.1719
Eritrea and Ethiopia 52 1 1970 0.0225 -0.0026
Finland 132 3 1915 1942 1968 0.0139 0.0320 0.0371 0.0213
France 132 3 1922 1948 1974 0.0109 -0.0091 0.0394 0.0155
Gabon 52 2 1963 1976 0.0337 0.0743 -0.0215
Gambia 52 2 1964 1981 0.0203 0.0109 0.0034
Germany 132 2 1912 1954 0.0153 0.0116 0.0231
Ghana 52 2 1963 1980 0.0185 -0.0119 0.0160
Greece 81 2 1940 1970 0.0148 0.0548 0.0152
Guatemala 82 3 1941 1961 1980 0.0338 0.0126 0.0225 0.0069
Guinea 52 2 1961 1979 0.0267 0.0186 0.0039 Guinea Bissau 52 2 1969 0.0544 -0.0083
Haïti 57 2 1962 1978 -0.0016 0.0179 -0.0247
Honduras 82 2 1944 1975 -0.0115 0.0091 0.0025
Hong Kong 52 2 1961 1986 0.0373 0.0550 0.0178
Hungary 56 2 1965 1986 0.0401 0.0132 0.0069
India 118 3 1907 1944 1974 0.0070 -0.0001 0.0137 0.0308
Indonesia 53 1 1968 0.0083 0.0340
Iran 52 2 1961 1977 0.0306 0.0698 0.0051
Iraq 52 1 1977 0.0384 -0.0963
Ireland 81 3 1939 1955 1984 0.0110 0.0200 0.0330 0.0600
Israel 52 1 1970 0.0528 0.0189

35
Italy 132 2 1905 1954 0.0067 0.0080 0.0289
Jamaica 52 2 1963 1974 0.0649 0.0319 0.0054
Japan 132 1 1959 0.0158 0.0365
Jordan 52 2 1965 1978 0.0444 0.0258 -0.0092
Kenya 52 2 1967 1986 0.0097 0.0066 -0.0034
Kuwait 52 1 1979 -0.0213 0.0149
Laos 52 2 1974 1987 0.0097 0.0116 0.0229
Lebanon 52 2 1972 1985 0.0108 -0.0127 0.0462
Lesotho 52 1 1981 0.0341 0.0381
Liberia 52 2 1973 1987 0.0150 -0.0283 -0.0168
Libya 52 2 1963 1982 0.1257 -0.0289 -0.0371
Madagascar 52 2 1971 1987 0.0095 -0.0289 -0.0085
Malawi 52 2 1970 1986 0.0161 0.0033 0.0190
Malaysia 55 1 1962 0.0146 0.0437
Mali 52 0
Mauritania 52 2 1963 1982 0.0353 0.0021 0.0061
Mauritius 52 2 1966 1979 0.0202 0.0494 0.0475
Mexico 102 3 0.0098 0.0238 0.0317 0.0052
Mongolia 52 2 1974 1987 0.0296 0.0357 -0.0139
Morocco 52 2 1973 1987 0.0064 0.0210 0.0047
Mozambique 52 2 1974 1987 0.0175 -0.0269 0.0297
Namibia 52 1 1962 0.0235 0.0012
Nepal 52 2 1961 1978 0.0187 0.0029 0.0241
Netherlands 132 2 1939 1968 0.0098 0.0417 0.0176
New Zealand 132 3 1901 1935 1974 0.0047 -0.0006 0.0196 0.0108
Nicaragua 82 2 1934 1977 0.0041 0.0265 -0.0220
Niger 52 2 1961 1982 0.0160 -0.0183 -0.0134
Nigeria 52 2 1968 1981 0.0059 0.0006 0.0055
North Korea 52 2 1969 1983 0.0405 0.0059 -0.0753
Norway 132 3 1898 1924 1950 0.0088 0.0170 0.0195 0.0310
Oman 52 2 1966 1982 0.0441 0.0236 0.0072
Pakistan 52 2 1961 1983 0.0073 0.0268 0.0202
Palestine and Gaza 52 0
Panama 57 2 1959 1986 0.0072 0.0281 0.0223

36
Paraguay 63 2 1954 1976 -0.0138 0.0185 0.0030
Peru 102 1 1980 0.0222 -0.0029
Philippines 56 2 1958 1982 0.0521 0.0234 0.0093
Poland 52 2 1964 1979 0.0290 0.0330 0.0121
Portugal 132 2 1942 1968 0.0086 0.0396 0.0285
Puerto Rico 52 2 1973 1986 0.0546 0.0191 0.0295
Qatar 52 1 1981 -0.0014 -0.0249
Reunion 52 1 1965 0.0210 0.0110
Romania 52 1 1977 0.0448 -0.0195
Rwanda 52 2 1962 1978 0.0126 0.0305 -0.0186
São Tomé and Principe 52 2 1961 1979 0.0112 0.0282 -0.0131
Saudi Arabia 52 1 1981 0.0638 -0.0095
Senegal 52 1 1967 0.0098 -0.0011
Seychelles 52 1 1969 0.0124 0.0265
Sierra Leone 52 2 1967 1987 0.0224 -0.0028 -0.1004
Singapore 52 2 1967 1980 0.0189 0.0683 0.0468
Somalia 52 1 1962 0.0185 -0.0092
South Africa 52 1 1972 0.0231 -0.0038
South Korea 91 2 1943 1969 0.0159 0.0416 0.0620
Spain 132 2 1935 1962 0.0090 0.0269 0.0298
Sri Lanka 132 3 1907 1942 1971 0.0145 0.0027 0.0092 0.0324
Sudan 52 2 1961 1983 0.0201 0.0016 0.0133
Swaziland 52 1 1972 0.0551 0.0011
Sweden 132 2 1915 1968 0.0139 0.0295 0.0138
Switzerand 132 3 1911 1945 1973 0.0182 0.0178 0.0289 0.0089
Syria 52 2 1972 1985 0.0163 0.0145 0.0254
Taiwan 90 2 1942 1969 0.0175 0.0516 0.0538
Tanzania 52 2 1964 1979 0.0057 0.0088 -0.0035
Thailand 52 2 1961 1987 0.0241 0.0429 0.0313
Togo 52 1 1971 0.0355 -0.0247
Trinidad and Tobago 52 2 1961 1983 0.0538 0.0307 0.0223
Tunisia 52 2 1970 1984 0.0261 0.0279 0.0291
Turkey 79 2 1939 1970 0.0466 0.0293 0.0222

37
Uganda 52 2 1964 1977 0.0100 -0.0105 0.0137
United Arab Emirates 52 2 1963 1981 0.0321 -0.0040 0.0048
United Kingdom 132 2 1918 1944 0.0101 0.0210 0.0205
United States 132 2 1899 1939 0.0161 0.0086 0.0197
Uruguay 132 2 0.0078 0.0031 0.0148
USSR 56 2 1967 1985 0.0390 0.0157 -0.0387
Venezuela 102 3 0.0191 0.0464 0.0081 -0.0024
Vietnam 52 2 1965 1982 0.0188 0.0068 0.0471
Yemen 52 2 1971 1984 0.0149 0.0315 0.0087
Yugoslavia 55 1 1981 0.0460 -0.0332
Zaire 52 2 1971 1984 0.0091 -0.0315 -0.0794
Zambia 52 2 1963 1976 0.0274 -0.0053 -0.0157
Zimbabwe 52 1 1968 0.0199 -0.0015