working paper no. 688 december 2020
TRANSCRIPT
Paying more to wait less:
Estimating the cost of reducing Ireland’s public hospital waiting lists
Aoife Brick*a,b and Conor Keegan a,b
Abstract: Larger and longer waiting lists for public hospital appointments and treatment have been a
significant challenge in Irish healthcare for decades. The issue has been further exacerbated by Covid-
19 in 2020 with the cancellation of elective activity in public hospitals for several months. The aim of
this analysis is to estimate the activity and expenditure required to clear the accumulated backlog and
account for future service demand. We estimate that to clear the backlog of cases and keep pace with
demand over a period of five years, additional expenditure excluding any associated capital costs of
up to €1.1bn would be required.
*Corresponding Author: [email protected]
Keywords: acute hospitals, expenditure, waiting lists, waiting times
Acknowledgements: Financial support for this research was provided by the Department of Health.
The authors are grateful to staff at the National Treatment Purchase Fund and the Healthcare Pricing
Office for the provision of data.
______________________________
a Economic and Social Research Institute b Trinity College Dublin
ESRI working papers represent un-refereed work-in-progress by researchers who are solely responsible for the content and any views expressed therein. Any comments on these papers will be welcome and should be sent to the author(s) by email. Papers may be downloaded for personal use only.
Working Paper No. 688
December 2020

1
1. INTRODUCTION
Waiting lists are a feature of health systems worldwide. They form when the demand for elective
services outstrips supply. In order to best utilise hospital resources, to avoid under-utilised capacity
and efficiently utilise hospital services some patient waiting time may be required (Siciliani et al.,
2013). However, extended waiting can harm the health of patients. The challenge of managing
increasingly larger and longer waiting lists for elective services has been a feature of Irish healthcare
for several decades. The challenge of waiting time management was exacerbated by the cancellation
of all but urgent elective treatment in the months following the outbreak of the Covid-19 pandemic
at the end of February 2020.
The National Treatment Purchase Fund (NTPF) is an independent statutory body established by the
Minister for Health and Children in 2004 with the aim of expediting treatment for patients with the
longest waiting times on the public hospital in-patient waiting list for surgery. Its remit was expanded
in 2005 to include outpatient department (OPD) consultations. Consultations and treatments were
mainly purchased from private hospitals in Ireland, and over the period 2002–2011 almost 220,000
patients were treated, including outpatients, day patients, in-patients, and radiology. From mid-2011
the NTPF no longer procured consultations and treatments (National Treatment Purchase Fund, 2012).
One of its key functions was to collect, collate, and validate information on persons waiting for public
hospital treatment. As waiting lists continued to deteriorate in recent years the Government has
provided ring-fenced funding for the NTPF to ‘urgently address waiting lists for those waiting longest’
(Department of the Taoiseach, 2016) starting with €15m in 2017, followed by €55m in 2018 and €75m
in 2019 (National Treatment Purchase Fund, 2018). Thus, re-establishing the individual patient level
commissioning role of the NTPF.
The most recent strategy by policymakers in Ireland to tackle waiting lists was set out in the Sláintecare
Report. This proposed a target waiting time of 10 weeks for OPD appointments and 12 weeks for
admitted treatment, with hospitals being held accountable through, amongst other measures,
sanctions on senior staff (Houses of the Oireachtas Committee on the Future of Healthcare, 2017 - p9-
10). The Sláintecare implementation strategy proposed a 'policy framework for evidence-based
waiting list guarantee, incorporating consideration of legislation to support the guarantee'
(Government of Ireland, 2018a - Action 5.1.6, p46 ). The targets seemed ambitious given the numbers
waiting for long periods at the time, and a requirement was evident for significant ringfenced
investment and strategies to reduce the number of longest waiters in particular. Backlogs for elective
hospital treatment grew further in the months following the outbreak of the Covid-19 pandemic with
the cancellation of many elective appointments/treatment (Power, 2020).
Increasingly larger lists and, more importantly, longer waiting times for elective services in Ireland are
well-recognised symptoms of a chronically under-resourced system. The Sláintecare Report made
clear that the current system does not have the capacity to deliver timely planned hospital care
(Houses of the Oireachtas Committee on the Future of Healthcare, 2017). In the context of these
reforms, recent reports have highlighted the need for between 2,600 and 7,000 additional public
hospital beds to meet projected demand for care over the medium-term (Keegan et al., 2018; PA

2
Consulting, 2018). In line with the Sláintecare recommendations, the National Development Plan has
proposed that protected capacity for elective treatments should be provided through the building of
three dedicated ambulatory elective-only hospital facilities in Dublin, Cork and Galway (Government
of Ireland, 2018b).
However, in addition to capital investment, there is also a direct cost involved in terms of treating
additional patients such that backlogs can be reduced to manageable levels, and target waiting times
achieved and sustained. To date, we are not aware of any estimates of these expenditure
requirements. A better understanding of the expenditure required to reduce waiting lists would be
helpful for informing future funding requirements and resource allocation decisions to deliver on
proposals for timely access to acute public hospital services under Sláintecare.
The aim of this paper is to estimate the activity and expenditure required to reduce waiting times in
Ireland so that patients are treated in a timely manner in Ireland. As a working assumption we take
the target to be 12 weeks for both OPD and admitted treatment. We employ and refine a method
developed in the UK (Findlay, 2017) which has been applied to NHS data by both the Institute for Fiscal
Studies and the Health Foundation (Charlesworth and Johnson, 2018; Charlesworth et al., 2020).
2. CONTEXT
Figure 1 shows the numbers on waiting lists in Ireland for publicly funded OPD appointments and
admitted treatment from the beginning of 2015 to October 2020. Along with the numbers on waiting
lists at a point in time it also shows the number of monthly additions to each of the waiting lists over
the period.
For day patients, the numbers on the list increased until mid-2017 from which point they remained
relatively stable, albeit for a brief decrease in late 2018, until February 2020. For in-patients some
progress was made in reducing the numbers on the list from October 2018 to March 2019, at which
point they stabilised. In contrast, numbers on the OPD list increased almost every month from January
2016. The numbers waiting for an OPD appointment for more than 12 months increased by 362 per
cent between December 2015 and December 2019. As a proportion of those attending OPD
appointments will require day- or in-patient treatment, the gains made in reducing the numbers on
the day- and in-patient lists may be at least partly due to the bottleneck occurring at the OPD point of
the treatment pathway. Irish data do not currently allow for the tracking of patients from their
addition to the OPD list to hospital treatment, so it is not possible to ascertain how this bottleneck
may be affecting the waiting times of patients.
From March 2020 there were increases in the overall numbers waiting on all lists, due to the
cancellation of all but urgent elective activity in light of the Covid-19 pandemic. These figures again
underestimate the demand for day- and in-patient services as the cancellation of OPD clinics has
stemmed the flow of additions to these lists. More recent data from October 2020 have shown a
3
recovery in the number of additions to the lists since elective activity restarted. However, the numbers
waiting for long periods for an appointment or treatment is further deteriorating, with 16 per cent of
those on the day patient list, 30 per cent on the in-patient list and 42 per cent of those on the OPD list
waiting for more than 12 months.
The volume of additions to the waiting lists has been relatively predictable over the period. The
volume of additions to the OPD list has fluctuated between 60,000 and a little over 70,000 per month
over the period. Additions to the day-patient list fluctuate between 21,000 and 25,000 per month
while the additions to the in-patient list are around 4,500 per month. Much of the variation appears
seasonal.
In the pre-Covid period, the NTPF interventions, including the additional funding, appear to have at
least stabilised the day-patient list and reduced the in-patient list. However, the numbers waiting for
admitted treatment for more than 12 months has remained stubbornly stable over time. In addition,
the numbers waiting for OPD appointments, including those waiting for more than 12 months, have
increased substantially, and has likely served to keep numbers on the day- and in-patient lists
artificially low.

4
FIGURE 1 Number on waiting lists and number of additions, January 2015–October 2020
Outpatients Day patients
In-patients Additions
Source: NTPF, 2015–2020.
0
100
200
300
400
500
600
700Ja
n 1
5
Ap
r 1
5
Jul 1
5
Oct
15
Jan
16
Ap
r 1
6
Jul 1
6
Oct
16
Jan
17
Ap
r 1
7
Jul 1
7
Oct
17
Jan
18
Ap
r 1
8
Jul 1
8
Oct
18
Jan
19
Ap
r 1
9
Jul 1
9
Oct
19
Jan
20
Ap
r 2
0
Jul 2
0
Oct
20
N (
'00
0)
Total waiting
≥12 weeks
≥6 months
≥12 months
0
20
40
60
80
100
120
Jan
15
Ap
r 1
5
Jul 1
5
Oct
15
Jan
16
Ap
r 1
6
Jul 1
6
Oct
16
Jan
17
Ap
r 1
7
Jul 1
7
Oct
17
Jan
18
Ap
r 1
8
Jul 1
8
Oct
18
Jan
19
Ap
r 1
9
Jul 1
9
Oct
19
Jan
20
Ap
r 2
0
Jul 2
0
Oct
20
N (
'00
0)
Total waiting
≥12 weeks
≥6 months
≥12 months
0
5
10
15
20
25
30
35
Jan
15
Ap
r 1
5
Jul 1
5
Oct
15
Jan
16
Ap
r 1
6
Jul 1
6
Oct
16
Jan
17
Ap
r 1
7
Jul 1
7
Oct
17
Jan
18
Ap
r 1
8
Jul 1
8
Oct
18
Jan
19
Ap
r 1
9
Jul 1
9
Oct
19
Jan
20
Ap
r 2
0
Jul 2
0
Oct
20
N (
'000
)
Total waiting
≥12 weeks
≥6 months
≥12 months
0
10
20
30
40
50
60
70
80
90
Jan
15
Ap
r 1
5
Jul 1
5
Oct
15
Jan
16
Ap
r 1
6
Jul 1
6
Oct
16
Jan
17
Ap
r 1
7
Jul 1
7
Oct
17
Jan
18
Ap
r 1
8
Jul 1
8
Oct
18
Jan
19
Ap
r 1
9
Jul 1
9
Oct
19
Jan
20
Ap
r 2
0
Jul 2
0
Oct
20
N (
'000
)
Outpatients
Day patients
In-patients

5
3. DATA
The data for this analysis were provided by the NTPF and the Healthcare Pricing Office (HPO). For each
service, OPD, day- and in-patient, the NTPF provided data from June 2015 to October 2020 on the
number of additions to the waiting lists in each month, the total numbers waiting at the end of each
month, and the numbers waiting by time band. For this analysis only active waiting-list cases (including
those with a procedure date ‘pre-admit’) are considered. Cases waiting for a planned procedure, that
is, those waiting for recall for the next stage in a course of treatment, or a timed procedure in the
future are excluded. In addition, any case that has been suspended, i.e. the patient is temporarily
unavailable or clinically unsuitable for their procedure, is excluded (National Treatment Purchase
Fund, 2017). In addition to the aggregate data, the NTPF also provide individual micro data for
December 2018 to allow for the calculation of age and sex profiles of those waiting across the three
services. For the expenditure estimates, data on public elective patients from the Hospital In-Patient
Enquiry Scheme 2018 provided by the HPO have been used to calculate complexity weights. Unit cost
data for the three services and OPD activity data for 2018 were also provided by the HPO.
4. METHODS
Our methods draw on and refine for the Irish context methods developed by Rob Findlay, a specialist
in waiting times in England, in work published in 2017 (Findlay, 2017). In that work he estimates what
would be required, in terms of activity and expenditure, to return the NHS to a sustainable 18-week
wait from referral-to-treatment. The findings of this work were applied in recent projections of NHS
expenditure (Charlesworth and Johnson, 2018). The method was again employed by the Health
Foundation in recently published analysis which examined the scale of the challenge of Covid-19 on
waiting times (Charlesworth et al., 2020).
In this analysis, the relationship between the growth rates in the waiting list and additions over time
is more important than the changes in the individual series (Findlay, 2017). This is rooted in queuing
theory, specifically, Little’s Law (Little, 1961), which sets out that the waiting time in a system will be
equal to the size of the waiting list in the system divided by the effective addition rate. To ensure that
waiting times do not grow, the waiting list growth rate must be no faster than the addition growth
rate. If the waiting list growth rate is faster than the addition growth rate, recurring additional activity
is required so that waiting times do not grow. Figure 2 shows, separately for OPDs, day patients and
in-patients, the year-on-year growth rates in the waiting list, additions and the ratio between the two.
While the growth rate trends for the list and additions fluctuate substantially, the ratio between them
tends to be relatively stable.

6
FIGURE 2 Year-on-year growth rates and ratio between full list and additions, by patient type
Outpatient
Day patient
In-patient
Note: Author calculations. Source: NTPF, 2015–2020.
-15.0
-10.0
-5.0
0.0
5.0
10.0
15.0
20.0
-15.0
-10.0
-5.0
0.0
5.0
10.0
15.0
20.0
Feb
16
May
16
Au
g 1
6
No
v 1
6
Feb
17
May
17
Au
g 1
7
No
v 1
7
Feb
18
May
18
Au
g 1
8
No
v 1
8
Feb
19
May
19
Au
g 1
9
No
v 1
9
Feb
20
Full list/ad
ditio
ns
Year
-on
-yea
r gr
ow
th (
per
cen
t)
Year-on-year growthrate - full list
Year-on-year growthrate - additions
Full list/additions
-20.0
-15.0
-10.0
-5.0
0.0
5.0
10.0
15.0
20.0
25.0
30.0
-20.0
-15.0
-10.0
-5.0
0.0
5.0
10.0
15.0
20.0
25.0
30.0
Feb
16
May
16
Au
g 1
6
No
v 1
6
Feb
17
May
17
Au
g 1
7
No
v 1
7
Feb
18
May
18
Au
g 1
8
No
v 1
8
Feb
19
May
19
Au
g 1
9
No
v 1
9
Feb
20
Full list/ad
ditio
ns
Year
-on
-yea
r gr
ow
th (
per
cen
t)
Year-on-year growthrate - full list
Year-on-year growthrate - additions
Full list/additions
-20.0
-15.0
-10.0
-5.0
0.0
5.0
10.0
15.0
20.0
-20.0
-15.0
-10.0
-5.0
0.0
5.0
10.0
15.0
20.0
Feb
16
May
16
Au
g 1
6
No
v 1
6
Feb
17
May
17
Au
g 1
7
No
v 1
7
Feb
18
May
18
Au
g 1
8
No
v 1
8
Feb
19
May
19
Au
g 1
9
No
v 1
9
Feb
20
Full list/ad
ditio
ns
Year
-on
-yea
r gr
ow
th (
per
cen
t)
Year-on-year growthrate - full list
Year-on-year growthrate - additions
Full list/additions

7
Following Findlay’s method, (Findlay, 2017) we consider the problem in three parts: first, what
additional recurring activity would be required to stop waiting times from growing as demand for
services increase. Second, we estimate the level of non-recurring additional activity, or backlog, that
has built up in the system and which must be cleared to return lists to a manageable size. Finally, we
estimate how much additional expenditure would be required to meet the increase in activity.
Estimating recurring additional activity: The recurring additional activity (RA) required each year to
stop waiting times from growing is calculated by projecting forward the total list size (TL) at the end
of February 2020, the last full month pre-Covid, using the total list growth rate (gl) and the additions
growth rate (ga) [1]. These growth rates are the mean of year-on-year growth rates calculated for each
month between March 2015/16 and February 2019/20.1 The differential between the projected list
size based on the total list growth rate and that based on the additions growth rate estimates the
extra activity above the trend required to stop waiting times from growing.
𝑅𝐴 = 𝑇𝐿(𝐹𝑒𝑏 2020) × ((1 + 𝑔𝑙) - (1 + 𝑔𝑎)) [1]
RA is calculated separately for each of the OPD, day-patient, and in-patient waiting lists. A proportion
of the OPD RA each year will inevitably lead to additional day or in-patient treatment. In the current
NTPF system, cases cannot be followed through from the OPD list to the day- and in-patient lists, so a
conversion rate is not available. The conversion rate will likely vary widely by specialty but for this
high-level analysis we have applied a conversion rate of 33.3 per cent which is similar to that estimated
in the UK (36% - Charlesworth et al., 2020) where referral to treatment pathways are observable.
These cases are then apportioned to the day- and in-patient lists based on the historic trend (85 per
cent day patient and 15 per cent in-patient).2
The estimated total additional activity is distributed by age and sex by applying the age and sex
distribution of the appropriate waiting list at the end of December 2018 (see supplemental material
Figure S1 and S2). These activity volumes are then converted to a rate by dividing by age- and sex-
specific population volumes. This allows for the required recurring additional activity to be adjusted
in line with projected population growth.
Estimating non-recurring activity: The analysis assumes that waiting list pressures will stop growing at
the end of December 2020.3 First we apply the total list growth rate (gl) to the total number waiting
in each month (m) between November 2018 and October 2020 to estimate the projected total list size
1 While later data are available, February 2020 was selected as the cut-off to avoid COVID-19 unduly influencing the
growth rate as almost all elective treatments were postponed during the period. 2 A sensitivity analysis in which the conversion rate is set to 20 per cent shows that it has a substantial impact on the
estimated expenditure required. These results are presented in Table S1. 3 A sensitivity analysis in which waiting list pressures are assumed to stop growing in June 2021 is presented in the
supplemental Table S2.

8
at the end of December 2020 in each month [2].4 Similarly we apply the additions growth rate to the
number waiting between 0–12 weeks in each month between November 2018 and October 2020
estimating the projected manageable list (ML) size at the end of December 2020 in each month [2].
Differentials between the projected total list size and manageable list size provide estimates of the
size of the non-recurring activity or backlog (BL) requiring clearance [3]. BL is calculated separately for
each of the OPD, day-patient, and in-patient waiting lists. Given current uncertainty regarding
estimated activity and how this may impact on the size of the non-recurring backlog at the end of the
year we examine two scenarios, referred to as low clearance and high clearance. The low-clearance
scenario is the mean of the monthly (m) backlog estimates over the period November 2018–October
2020;
𝐵𝐿𝑎𝑣𝑔 =∑ (𝑇𝐿𝑚−𝑀𝐿𝑚)24
𝑚=1
24 [2]
and the high-clearance scenario is the maximum of the monthly (m) backlog estimates over the period
over the period November 2018–October 2020 [5]
𝐵𝐿𝑚𝑎𝑥 = 𝑀𝑎𝑥(𝑇𝐿𝑚 − 𝑀𝐿𝑚) [3]
As with the annual additional activity required, a proportion of the OPD backlog each year will
inevitably lead to additional day or in-patient treatment as it is cleared. These cases are then
apportioned, as before, to the day- and in-patient lists based on the historic trend (85 per cent day
patient and 15 per cent in-patient).
Expenditure requirements: the final step is to estimate how much additional expenditure would be
required to reduce the waiting lists to the point that cases are seen or treated within 12 weeks and
the lists are maintained within this limit. For the purpose of this analysis we assume five years is a
reasonable timeframe within which the non-recurring activity can be cleared. This assumes that one-
fifth of the backlog is to be cleared in each of the five years (2021–2025). It would be straightforward
to vary this assumption, with faster clearance implying greater annual expenditure during the catch-
up period and slower clearance implying lower annual expenditure.
For the OPD list we assume that the average cost of an appointment is unlikely to vary substantially
across specialties or the profile of the patient. Expenditure in the first five years while the backlog is
reduced [4], for t = 1 to 5, is
𝐸𝑥𝑝𝑒𝑛𝑑𝑖𝑡𝑢𝑟𝑒(𝑡)𝑂𝑃𝐷 = (𝑅𝐴(𝑡)𝑂𝑃𝐷 +𝐵𝐿𝑜𝑝𝑑
5) 𝑥 𝐶𝑜𝑠𝑡(𝑡)𝑂𝑃𝐷 [4]
4 The period considered covers two years (November 2018-October 2020), double that considered by Findlay. A longer
period is chosen as although waiting lists improved for a short period through 2019, given the challenges now faced in a Covid-19 environment it seems reasonable to include a time period in which waiting lists were more problematic.

9
However, for day- and in-patient waiting lists this is not the case. The cost will vary substantially
depending on the treatment a patient is waiting for and their profile; this requires a more nuanced
approach to costing. As part of the HPO costing process weighted units of activity are calculated which
take account of the relative complexity (that is, relative resource use) of individual discharges. This
process is described in detail elsewhere (Healthcare Pricing Office, 2015). To estimate the complexity
weighting of cases on the NTPF lists, the demographic characteristics of individual cases on the NTPF
day- and in-patient waiting lists are matched to similar cases in HIPE with the same principal procedure
code. The procedure-level average complexity-weighted units of the HIPE discharges is then applied
to the NTPF cases. This is done through an increasingly broad matching process. Initially, and most
specifically by sex, 5-year age groups, and procedure (67 per cent) (e.g. male, aged 25–29 years, day
patient, principal procedure 30473-01 Panendoscopy to duodenum with biopsy), then sex is removed
(+4.5 per cent), then age is removed and sex included (+12.2 per cent), then procedure only (+3.3 per
cent), then single year of age and sex without procedure (13.0 per cent). At each stage the match is
only valid if there are more than 10 discharges in HIPE included in the average weighted unit
calculation. For the day- and in-patient waiting lists, complexity-weighted profiles are generated for
the full list and for those waiting more than 12 weeks (see supplemental material Figure S3).
These distributions are then applied to the recurring additional activity (full list distribution) and the
non-recurring backlog (>12 weeks distribution), and the additions and backlog OPD conversions (full
list distribution) [5].
For t = 1 to 5,
𝐸𝑥𝑝𝑒𝑛𝑑𝑖𝑡𝑢𝑟𝑒(𝑡)𝑖 = (𝑅𝐴(𝑡)𝑤𝑢,𝑖 + 𝐵𝐿𝑤𝑢,𝑖
5+ 𝛽𝑖 (𝑅𝐴(𝑡)𝑤𝑢,𝑜𝑝𝑑 +
𝐵𝐿𝑤𝑢,𝑜𝑝𝑑
5) ) 𝑥 𝐶𝑜𝑠𝑡(𝑡)𝑖 [5]
Where i= day patient, in-patient; DP=0.28, IP=0.05; and 𝑅𝐴(𝑡)𝑤𝑢 and 𝐵𝐿𝑤𝑢 are the sum of the
weighted units for recurring and non-recurring additional activity, respectively.
The costs applied to estimate OPD, day-, and in-patient expenditure are projected from 2018 unit
costs provided by the HPO. In 2018, each day-patient weighted unit was costed at €885 while an in-
patient weighted unit was costed at €4,985. Annual cost projections generated from the ESRI’s
Hippocrates Model (Keegan et al., 2020) (Table 1) are applied to the projected activity.
TABLE 1 Projected unit costs (€) by patient type, 2021–2025
2021 2022 2023 2024 2025
OPD 182 187 192 197 202
DP 965 995 1,028 1,063 1,100
IP 5,354 5,490 5,640 5,804 5,973
Source: Keegan et al. (2020).

10
5. FINDINGS
Outpatients
Using the above outlined methodology, the OPD average monthly year-on-year growth rate between
March 2016 and February 2020 for the full list was 9.0 per cent and the additions growth rate was 1.2
per cent. We estimate that the backlog of OPD cases as on 1 January 2021 will be between 468,000
and 518,000. If this backlog were to be cleared over five years, that would imply an additional 94,000
to 104,000 additional first-time appointments per year would be required.
As the growth rate in the waiting list is greater than the growth rate in additions, to keep the waiting
times from growing, approximately 45,000 additional first-time appointments are required each year
to keep pace with increasing demand. The number of additions required will increase each year in line
with projected population change. Between 2021 and 2025, to clear the backlog and to increase
activity to keep pace with increasing demand, between 139,000 and 149,000 additional first-time
appointments would be required at an estimated additional expenditure of between €27m and €29m
per annum. This equates to an increase of 15–16 per cent on 2018 activity (see Table 2). The total
expenditure required to clear the backlog over five years and to increase activity to keep pace with
demand is estimated to be between €133m and €143m.
Day patients
The day-patient waiting list had an average monthly year-on-year growth rate between March 2016
and February 2020 of 3.4 per cent, compared to 2.6 per cent for the additions rate. We estimate that
the backlog of day-patient cases as on 1 January 2021 will be between 52,000 and 80,000 based on
the average or maximum backlog scenario. To this we must add the OPD backlog conversion of
between 133,000 and 147,000 treatments per year. For this to be cleared over five years would
require an additional 37,000 to 45,000 treatments per year.
As the growth rate in the waiting list is greater than the growth rate in additions, to keep waiting times
from growing, an additional 750 treatments in year one and adjusted in each subsequent year in line
with population growth, would be required to meet increasing demand. To this we must add the day-
patient portion of the annual population-adjusted OPD additions, amounting to a further 14,000
treatments in year one and adjusted in each subsequent year in line with population growth.
Between 2021 and 2025, to clear the backlog (including OPD conversion) and to increase activity to
keep pace with demand, between 51,000 to 59,000 additional day-patient treatments per year would
be required. This equates to an increase of 9–10 per cent on 2018 activity (see Table 2). Adjusting for
the age and sex distribution for day patients and weighting for average complexity, we project
additional expenditure of between €67m and €79m per year or between €335m and €393m over five
years would be required.
11
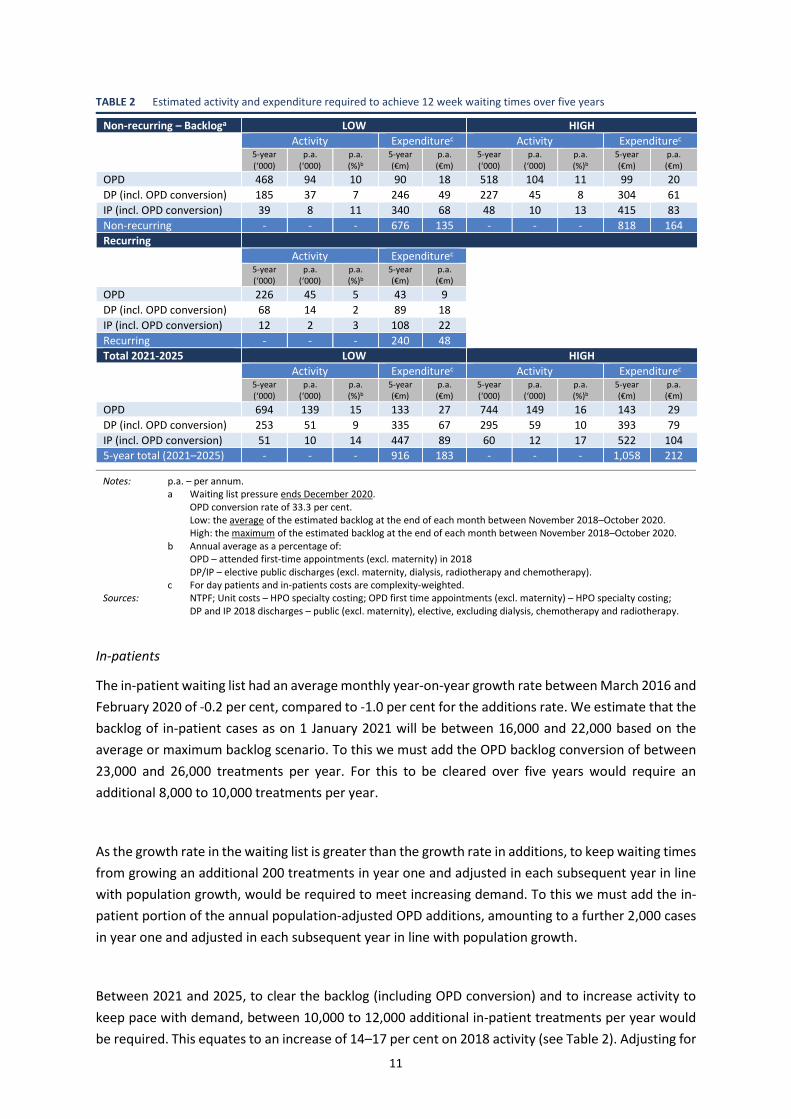
TABLE 2 Estimated activity and expenditure required to achieve 12 week waiting times over five years
Non-recurring – Backloga LOW HIGH
Activity Expenditurec Activity Expenditurec 5-year
(‘000) p.a.
(‘000) p.a. (%)b
5-year (€m)
p.a. (€m)
5-year (‘000)
p.a. (‘000)
p.a. (%)b
5-year (€m)
p.a. (€m)
OPD 468 94 10 90 18 518 104 11 99 20
DP (incl. OPD conversion) 185 37 7 246 49 227 45 8 304 61
IP (incl. OPD conversion) 39 8 11 340 68 48 10 13 415 83
Non-recurring - - - 676 135 - - - 818 164
Recurring
Activity Expenditurec
5-year (‘000)
p.a. (‘000)
p.a. (%)b
5-year (€m)
p.a. (€m)
OPD 226 45 5 43 9
DP (incl. OPD conversion) 68 14 2 89 18
IP (incl. OPD conversion) 12 2 3 108 22
Recurring - - - 240 48
Total 2021-2025 LOW HIGH
Activity Expenditurec Activity Expenditurec 5-year
(‘000) p.a.
(‘000) p.a. (%)b
5-year (€m)
p.a. (€m)
5-year (‘000)
p.a. (‘000)
p.a. (%)b
5-year (€m)
p.a. (€m)
OPD 694 139 15 133 27 744 149 16 143 29
DP (incl. OPD conversion) 253 51 9 335 67 295 59 10 393 79
IP (incl. OPD conversion) 51 10 14 447 89 60 12 17 522 104
5-year total (2021–2025) - - - 916 183 - - - 1,058 212
Notes: p.a. – per annum. a Waiting list pressure ends December 2020.
OPD conversion rate of 33.3 per cent. Low: the average of the estimated backlog at the end of each month between November 2018–October 2020. High: the maximum of the estimated backlog at the end of each month between November 2018–October 2020.
b Annual average as a percentage of: OPD – attended first-time appointments (excl. maternity) in 2018 DP/IP – elective public discharges (excl. maternity, dialysis, radiotherapy and chemotherapy).
c For day patients and in-patients costs are complexity-weighted. Sources: NTPF; Unit costs – HPO specialty costing; OPD first time appointments (excl. maternity) – HPO specialty costing;
DP and IP 2018 discharges – public (excl. maternity), elective, excluding dialysis, chemotherapy and radiotherapy.
In-patients
The in-patient waiting list had an average monthly year-on-year growth rate between March 2016 and
February 2020 of -0.2 per cent, compared to -1.0 per cent for the additions rate. We estimate that the
backlog of in-patient cases as on 1 January 2021 will be between 16,000 and 22,000 based on the
average or maximum backlog scenario. To this we must add the OPD backlog conversion of between
23,000 and 26,000 treatments per year. For this to be cleared over five years would require an
additional 8,000 to 10,000 treatments per year.
As the growth rate in the waiting list is greater than the growth rate in additions, to keep waiting times
from growing an additional 200 treatments in year one and adjusted in each subsequent year in line
with population growth, would be required to meet increasing demand. To this we must add the in-
patient portion of the annual population-adjusted OPD additions, amounting to a further 2,000 cases
in year one and adjusted in each subsequent year in line with population growth.
Between 2021 and 2025, to clear the backlog (including OPD conversion) and to increase activity to
keep pace with demand, between 10,000 to 12,000 additional in-patient treatments per year would
be required. This equates to an increase of 14–17 per cent on 2018 activity (see Table 2). Adjusting for
12
the age and sex distribution for in-patients and weighting for average complexity, we project
additional expenditure requirement of between €89m and €104m per year or between €447m and
€522m over five years.
As the backlogs for services, particularly OPD, are cleared and growth rates in additions to the day-
and in-patient lists stabilise it is important that the recurring activity analysis is repeated to ensure
that demand pressures going forward are met.
6. CONCLUSIONS
Our analysis has estimated the additional activity and expenditure required to bring public hospital
waiting lists to manageable levels and the activity and expenditure required to sustain waiting times
at 12 weeks into the future with a growing population. We find that over an initial five-year period
relevant activity across the three services would need to increase by between 10–18 per cent on 2018
levels depending on the service. The initial expenditure over the five-year period would be substantial
at between €916m–€1.1bn or €183m–€212m per annum. To put this in context, total acute public
hospital expenditure in 2018 was €5.9bn (Keegan et al., 2020). However, once the backlog is cleared,
given the historic stability of additions, additional activity above the trend of between 2 and 5 per cent
on 2018 levels would be required to maintain waiting times at 12 weeks. For example, we estimate
that over the following five years (2026–2030), once the initial backlog is cleared, the additional
expenditure required to maintain waiting times would be approximately €60m per annum.
For the additional activity estimated in this analysis to be realised there will also need to be significant
increases in staffing and capital funding to provide sufficient beds and physical facilities. Public
hospitals would likely struggle, all else being equal, to increase activity to the levels required to clear
the backlog so at least in the backlog period there could be a role for NTPF commissioning or direct
procurement of services from private hospitals. Additional funding provided to the NTPF in 2017–2019
did appear to have an impact on the number of long waiters in the system but clearly from the
numbers presented here substantially more would be required to have a lasting impact. A new Access
to Care fund of €210m announced as part of the Budget 2021 measures has the aim of improving
access to care for those significantly affected by the COVID-19 pandemic. Along with this an additional
€30m has been allocated to the NTPF bringing the total for 2021 to €130m (Government of Ireland,
2020). In addition, the Minister for Health has committed to a HSE/NTPF action plan for 2021 to
address the impact of COVID-19 on access to elective treatment. Recent work has shown that a
decrease in avoidable emergency in-patient hospitalisations for three of the most frequently recorded
conditions in Ireland (vaccine-preventable influenza and pneumonia, chronic obstructive pulmonary
disorder, and urinary tract infections (including pyelonephritis)) could go a substantial way to
offsetting the expenditure required to manage waiting lists (Keegan et al., 2020). Importantly,
however, as part of Budget 2021, it has also been recognised that long-acknowledged public hospital
capacity constraints need to be addressed as part of a longer-term solution to tackle waiting lists. As
a step in this direction, by the end of 2021, funding has been provided to increase the stock of public
acute hospital beds by 1,146 including accompanying funding for additional workforce (Government
of Ireland, 2020). The Elective Hospitals Oversight Group, set up under Sláintecare, is currently

13
analysing the separation of elective from non-elective care through the establishment of elective only
hospitals.
The OECD have highlighted the importance of both demand and supply interventions in addition to
waiting time guarantees are necessary for effective waiting time management. Once-off additional
funding can be effective in the short term but is unlikely to achieve sustained reductions in waiting
times (Siciliani et al., 2013). While maximum waiting time targets are the most commonly used policy
to reduce waiting times a range of other measures have been introduced across countries (OECD,
2020). Supply-side interventions such as increases in surgical capacity accompanied by demand-side
interventions such as clinical prioritisation and strengthening referral systems have shown success in
reducing and stabilising waiting times in other countries (e.g. New Zealand).
This paper has several limitations. First, for the day- and in-patient cost estimates we base our
complexity adjustment on treated cases with a similar profile to those waiting. This does not make
any adjustment for how the complexity of such cases may change depending on how long they have
been waiting. Second, the complexity adjustment is based on cases treated in 2018 and the analysis
assumes this has not changed in the interim. Third, we do not account for the specialty requirements
of the patients on the list and how that might impact on the ability of the system to deal with the
backlog of cases. That is, if the backlog is system-wide the backlog should be more straightforward to
clear than if the backlog is concentrated in a small number of specialties. If the latter is the case
clearance of the backlog may take longer as targeted recruitment may be required. Fourth, the
expenditure estimates are based on the costs of treatment in public hospitals and not on the potential
cost of commissioning treatment or increasing bed capacity. Fifth, the expenditure estimates include
the costs of the first OPD visits and day or in-patient treatments, the cost of subsequent OPD visits are
not included. Finally, we cannot account for the impact on public patient waiting times of the
treatment of private patients in public hospitals. While discharge records for private patients treated
in public hospitals are returned to HIPE there is no information available on private patients on waiting
lists in public hospitals.
There is potential to apply the methods used here at a specialty level, in which case it may be possible
to overcome many of the limitations outlined. For example, the estimation of a specialty specific OPD
conversion rate and new-to-return visit ratio may be possible with clinical input. In addition, it might
be possible to consider the potential impact of moving appropriate procedures from an in-patient to
a day-patient setting. While incremental progress could be made given existing data systems, the
limitations of this analysis provide another compelling reason to expedite the introduction of a unique
patient identifier in Irish healthcare.

14
REFERENCES
Charlesworth, A. and P. Johnson, Eds. (2018). Securing the future: funding health and social care to the 2030s. London, England, The Institute for Fiscal Studies.
Charlesworth, A., T. Watt and T. Gardner (2020). Returning NHS waiting times to 18 weeks for routine treatment. The scale of the challenge pre-COVID-19. The Health Foundation, London. https://www.health.org.uk/publications/long-reads/returning-nhs-waiting-times-to-18-weeks.
Department of the Taoiseach (2016). A Programme for a Partnership Government. Dublin, Ireland, Department of the Taoiseach.
Findlay, R. (2017). The cost of restoring 18 week waits. Health Services Journal. https://blog.gooroo.co.uk/2017/11/the-cost-of-restoring-18-week-waits/.
Government of Ireland (2018a). Sláintecare Implementation Strategy, Dublin, https://assets.gov.ie/9914/3b6c2faf7ba34bb1a0e854cfa3f9b5ea.pdf.
Government of Ireland (2018b). Project Ireland 2040: National Development Plan 2018-2027, Dublin, Ireland. Government of Ireland (2020). Expenditure Report 2021 Part II – Expenditure Allocations 2021. Government of
Ireland, Dublin, http://budget.gov.ie/Budgets/2021/Documents/Budget/Part%20II%20-%20Expenditure%20Allocations%202021.pdf.
Healthcare Pricing Office (2015). Introduction to the Price Setting Process for Admitted Patients. Health Service Executive, Dublin. V1.0, http://hpo.ie/seminar/pdf/2015/Fiachra_Bane_Introduction_to_Price_Setting_Process_for_Admitted_Patients.pdf.
Houses of the Oireachtas Committee on the Future of Healthcare (2017). Sláintecare Report. Houses of the Oireachtas, Dublin, http://www.oireachtas.ie/parliament/media/committees/futureofhealthcare/Oireachtas-Committee-on-the-Future-of-Healthcare-Slaintecare-Report-300517.pdf.
Keegan, C., A. Brick, A. Bergin, M.-A. Wren, E. Henry and R. Whyte (2020). Projections of expenditure for public hospitals in Ireland, 2018-2035, based on the Hippocrates model. ESRI Research Series Report 117. ESRI, Dublin. https://doi.org/10.26504/rs117.
Keegan, C., A. Brick, B. Walsh, A. Bergin, J. Eighan and M. Wren (2018). "How many beds? Capacity implications of hospital care demand projections in the Irish hospital system, 2015-2030." The International Journal of Health Planning and Management 34(1). https://doi.org/10.1002/hpm.2673.
Little, J.D.C. (1961). "A Proof for the Queuing Formula: L= λ W." Operations Research 9(3): 383-387. https://doi.org/10.1287/opre.9.3.383.
National Treatment Purchase Fund (2012). National Treatment Purchase Fund - Annual Report 2011. Dublin, National Treatment Purchase Fund.
National Treatment Purchase Fund (2017). National Inpatient, Day Case, Planned Procedure (IDPP) Waiting List Management Protocol. National Treatment Purchase Fund, Dublin.
National Treatment Purchase Fund (2018). NTPF exceeds treatment targets for 2018 - December 2018 Waiting Lists Published
OECD (2020). Waiting Times for Health Services: Next in Line. OECD Health Policy Studies, OECD Publishing, Paris. https://doi.org/10.1787/242e3c8c-en.
PA Consulting (2018). Health Service Capacity Review 2018 Department of Health, Department of Health, Dublin, Ireland.
Power, J. (2020). "Coronavirus: Hospital waiting lists lengthened during Covid-19 lockdown." Irish Times. https://www.irishtimes.com/news/health/coronavirus-hospital-waiting-lists-lengthened-during-covid-19-lockdown-1.4306523
Siciliani, L., M. Borowitz and V. Moran, Eds. (2013). Waiting Time Policies in the Health Sector What Works? OECD Health Policy Studies. Paris, OECD Publishing.

15
Supplementary Material
FIGURE S1 OPD – age- and sex-specific distribution of waiting lists, December 2018
Source: NTPF, 2018.
0.0%
1.0%
2.0%
3.0%
4.0%
5.0%
<5 5-9
10
-14
15
-19
20
-24
25
-29
30
-34
35
-39
40
-44
45
-49
50
-54
55
-59
60
-64
65
-69
70
-74
75
-79
80
-84
85
-89
90
+
Wai
tng
List
Male - Total Female - Total Male - >3 months Female - >3 months

16
FIGURE S2 Age- and sex-specific distribution of waiting lists and estimated mean complexity weights by patient type and time waiting, December 2018
Day patient In-patient
Full-
list
Wai
tin
g >1
2 w
eeks
0.0
0.2
0.4
0.6
0.8
1.0
1.2
1.4
1.6
1.8
2.0
0.0%
0.2%
0.4%
0.6%
0.8%
1.0%
1.2%
<1 3 6 9 12
15
18
21
24
27
30
33
36
39
42
45
48
51
54
57
60
63
66
69
72
75
78
81
84
87
90
+
WU
(Mean
)
Wai
tin
g lis
t
0.0
0.5
1.0
1.5
2.0
2.5
3.0
3.5
0.0%
0.2%
0.4%
0.6%
0.8%
1.0%
1.2%
1.4%
<1 3 6 9 12
15
18
21
24
27
30
33
36
39
42
45
48
51
54
57
60
63
66
69
72
75
78
81
84
87
90
+
WU
(Mean
)
Wai
tin
g lis
t
0.0
0.2
0.4
0.6
0.8
1.0
1.2
1.4
1.6
1.8
2.0
0.0%
0.2%
0.4%
0.6%
0.8%
1.0%
1.2%
<1 3 6 9 12
15
18
21
24
27
30
33
36
39
42
45
48
51
54
57
60
63
66
69
72
75
78
81
84
87
90
+
WU
(Mean
)Wai
tin
g lis
t
0.0
0.5
1.0
1.5
2.0
2.5
3.0
3.5
0.0%
0.2%
0.4%
0.6%
0.8%
1.0%
1.2%
1.4%
<1 3 6 9 12
15
18
21
24
27
30
33
36
39
42
45
48
51
54
57
60
63
66
69
72
75
78
81
84
87
90
+
WU
(Mean
)
Wai
tin
g lis
t
0.0
0.5
1.0
1.5
2.0
2.5
3.0
3.5
0.0%
0.2%
0.4%
0.6%
0.8%
1.0%
1.2%
1.4%
<1 3 6 9 12
15
18
21
24
27
30
33
36
39
42
45
48
51
54
57
60
63
66
69
72
75
78
81
84
87
90
+
WU
(Mean
)Wai
tin
g lis
t
Male - % Female - % Male - WU Female - WU

17
FIGURE S3 Day- and in-patients– age- and sex-specific unweighted and complexity-weighted profiles, December 2018
Day patients In-patients
Tota
l lis
t
Wai
tin
g >1
2 w
eeks
Source: NTPF, 2018; HIPE, 2018.
0
200
400
600
800
1,000
1,200
<1 3 6 9 12
15
18
21
24
27
30
33
36
39
42
45
48
51
54
57
60
63
66
69
72
75
78
81
84
87
90
+
Wai
tng
List
0
50
100
150
200
250
300
350
400
450
500
<1 3 6 9 12
15
18
21
24
27
30
33
36
39
42
45
48
51
54
57
60
63
66
69
72
75
78
81
84
87
90
+
Wai
tng
List
0
100
200
300
400
500
600
700
<1 3 6 9 12
15
18
21
24
27
30
33
36
39
42
45
48
51
54
57
60
63
66
69
72
75
78
81
84
87
90
+
Wai
tng
List
0
50
100
150
200
250
300
350
400
450
500
<1 3 6 9 12
15
18
21
24
27
30
33
36
39
42
45
48
51
54
57
60
63
66
69
72
75
78
81
84
87
90
+
Wai
tng
List
0
50
100
150
200
250
300
350
400
450
500
0 2 4 6 8 10 12 14 16 18 20 22 24 26 28 30 32 34 36 38 40 42 44 46 48 50 52 54 56 58 60 62 64 66 68 70 72 74 76 78 80 82 84 86 88 90+
Wa
itn
g Li
st
Male - Unweighted Female - Unweighted Male - Complexity-weighted Female - Complexity-weighted

18
TABLE S1 Sensitivity 1: Estimated cost of achieving 12 week waiting times over first five years – OPD conversion rate 20 per cent
Non-recurring – Backloga LOW HIGH
Activity Expenditurec Activity Expenditurec 5-year
(‘000) p.a.
(‘000) p.a. (%)b
5-year (€m)
p.a. (€m)
5-year (‘000)
p.a. (‘000)
p.a. (%)b
5-year (€m)
p.a. (€m)
OPD 468 94 10 90 18 518 104 11 99 20
DP (incl. OPD conversion) 132 26 5 177 35 168 34 6 227 45
IP (incl. OPD conversion) 30 6 8 258 52 37 7 10 324 65
Non-recurring - - - 525 105 - - - 651 130
Recurring
Activity Expenditurec
5-year (‘000)
p.a. (‘000)
p.a. (%)b
5-year (€m)
p.a. (€m)
OPD 226 45 5 43 9
DP (incl. OPD conversion) 42 8 2 55 11
IP (incl. OPD conversion) 8 2 2 68 14
Recurring - - - 167 33
Total 2021-2025 LOW HIGH
Activity Expenditurec Activity Expenditurec 5-year
(‘000) p.a.
(‘000) p.a. (%)b
5-year (€m)
p.a. (€m)
5-year (‘000)
p.a. (‘000)
p.a. (%)b
5-year (€m)
p.a. (€m)
OPD 694 139 15 133 27 744 149 16 143 29
DP (incl. OPD conversion) 174 35 6 232 46 211 42 7 283 57
IP (incl. OPD conversion) 37 7 10 326 65 45 9 13 393 79
5-year total (2021–2025) - - - 692 138 - - - 818 164
Notes: p.a. – per annum. a Waiting list pressure ends December 2021.
OPD conversion rate of 20 per cent. Low: the average of the estimated backlog at the end of each month between November 2018–October 2020. High: the maximum of the estimated backlog at the end of each month between November 2018–October 2020.
b Annual average as a percentage of: OPD – attended first-time appointments (excl. maternity) in 2018 DP/IP – elective public discharges (excl. maternity, dialysis, radiotherapy and chemotherapy).
c For day patients and in-patients costs are complexity-weighted. Sources: NTPF; Unit costs – HPO specialty costing; OPD first time appointments (excl. maternity) – HPO specialty costing;
DP and IP 2018 discharges – public (excl. maternity), elective, excluding dialysis, chemotherapy and radiotherapy.

19
TABLE S2 Sensitivity 2: Estimated cost of achieving 12 week waiting times over first five years – extended backlog projection
Non-recurring – Backloga LOW HIGH
Activity Expenditurec Activity Expenditurec 5-year
(‘000) p.a.
(‘000) p.a. (%)b
5-year (€m)
p.a. (€m)
5-year (‘000)
p.a. (‘000)
p.a. (%)b
5-year (€m)
p.a. (€m)
OPD 494 99 10 95 19 544 109 11 104 21
DP (incl. OPD conversion) 192 38 7 256 51 235 47 8 315 63
IP (incl. OPD conversion) 40 8 11 350 70 49 10 14 425 85
Non-recurring - - - 701 140 - - - 845 169
Recurring
Activity Expenditurec
5-year (‘000)
p.a. (‘000)
p.a. (%)b
5-year (€m)
p.a. (€m)
OPD 226 45 5 43 9
DP (incl. OPD conversion) 68 14 2 89 18
IP (incl. OPD conversion) 12 2 3 108 22
Recurring - - - 240 48
Total 2021-2025 LOW HIGH
Activity Expenditurec Activity Expenditurec 5-year
(‘000) p.a.
(‘000) p.a. (%)b
5-year (€m)
p.a. (€m)
5-year (‘000)
p.a. (‘000)
p.a. (%)b
5-year (€m)
p.a. (€m)
OPD 720 144 15 138 28 770 154 16 148 30
DP (incl. OPD conversion) 260 52 9 345 69 303 61 11 404 81
IP (incl. OPD conversion) 53 11 15 457 91 61 12 17 533 107
5-year total (2021–2025) - - - 940 188 - - - 1,085 217
Notes: p.a. – per annum. a Waiting list pressure ends June 2021.
OPD conversion rate of 33.3 per cent. Low: the average of the estimated backlog at the end of each month between November 2018–October 2020. High: the maximum of the estimated backlog at the end of each month between November 2018–October 2020.
b Annual average as a percentage of: OPD – attended first-time appointments (excl. maternity) in 2018 DP/IP – elective public discharges (excl. maternity, dialysis, radiotherapy and chemotherapy).
c For day patients and in-patients costs are complexity-weighted. Sources: NTPF; Unit costs – HPO specialty costing; OPD first time appointments (excl. maternity) – HPO specialty costing;
DP and IP 2018 discharges – public (excl. maternity), elective, excluding dialysis, chemotherapy and radiotherapy.