working paper - agecon searchageconsearch.umn.edu/bitstream/127787/2/cornell_dyson_wp0340.pdf ·...
TRANSCRIPT

1
WP 2003-40
December 2003
Working Paper Department of Applied Economics and Management Cornell University, Ithaca, New York 14853-7801 USA
Global Oil Resources and the Persian Gulf: Security and Democracy Duane Chapman

2
It is the Policy of Cornell University actively to support equality of
educational and employment opportunity. No person shall be denied
admission to any educational program or activity or be denied employment
on the basis of any legally prohibited discrimination involving, but not limited
to, such factors as race, color, creed, religion, national or ethnic origin, sex,
age or handicap. The University is committed to the maintenance of
affirmative action programs which will assure the continuation of such
equality of opportunity.
3
Acknowledgements
To Neha Khanna (Cornell and Binghamton Universities), for her significant contributions
to earlier work used here, and for her comments on this paper; to Darwin Hall (California State
University at Long Beach) for encouraging that earlier work; to Susan Greaves in Cornell’s Olin
map library for the very useful Figure 1; to Steven Reiss here for his outstanding research and
manuscript assistance; and to Richard Fullerton (U.S. Air Force Academy) and Matthew
Evangelista (Cornell) for their comments and criticism. Previous versions of this paper have
been presented at the U.S. Air Force Academy, Cornell Aerospace (ROTC) Studies, Cornell
Peace Studies Program, U.S. Ecological Economics Association Annual Meeting, Department of
Ecology-Iran, and the Western Economic Association International Annual Meeting.
fn: Global Oil WP 03-40 1-27-04
4
Abstract
The oil of the Persian Gulf has been of considerable interest to oil companies and
Western governments (and to Russia) for more than a century. Remaining global conventional
crude oil resources are on the order of 3 trillion barrels, with more than 50% of that amount in
the Persian Gulf. Since 1986, a price range framework has resulted in stable crude oil prices and
reliable supply. In economic terms, it is a Nash game theory equilibrium between Gulf
producers and Western (and Asian) consumers. Military support is an important part of the
system.
Given the very low cost of production in the region (about $5 per barrel) and the great
magnitude of resources, the oil wealth in the Gulf is on the order of $60 trillion. It is the
existence of past and potential efforts to seize this resource which creates a major policy problem
for the 8 countries in the region and for global security. The security framework which made a
stable world oil market possible has itself contributed to growing instability in individual
countries, the rise of Al Qaeda, and the U.S. occupation of Iraq.
There are three broad policy approaches to this dilemma. The dominant policy in the
1973-1990 period was generally a “hands off” position by the U.S. and Europe. In the years
following the Gulf War (1991-current) a security system has been organized and led by the
United States. A third type of security structure would be essentially international. The paper
concludes by discussing each approach in the context of 6 conditions or requirements for
democratic governments and a stable world oil market.

5
Table of Contents
Introduction
I. Brief History: Petroleum, the Persian Gulf, and the West .................................................. 1
II. The Tradeoff: Price Stability and Military Security .......................................................... 7
III. Military Security, Nuclear Weapons, Al Qaeda ............................................................... 9
IV. Global Oil Resources and the Persian Gulf; U.S. Imports ............................................. 15
V. The $60 Trillion Prize ...................................................................................................... 24
VI. Roads to the Future......................................................................................................... 26 Autonomy: “Hands Off” ............................................................................................ 26 American Security Framework .................................................................................. 29 International Security Framework ............................................................................. 30 Appendix A. Company Network Importing Oil into the U.S., Total and Persian Gulf ............................................................................................................... 35 Appendix B. Additional Data on International Trade in
Petroleum ................................................................................................................... 39
1
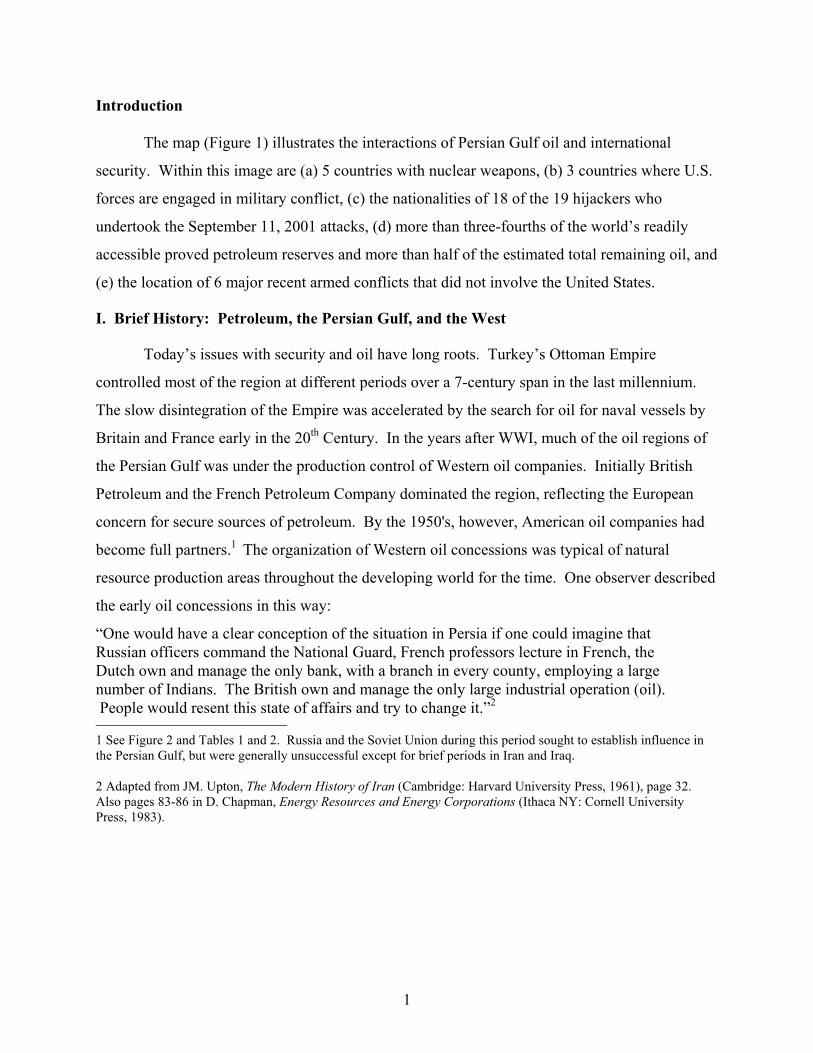
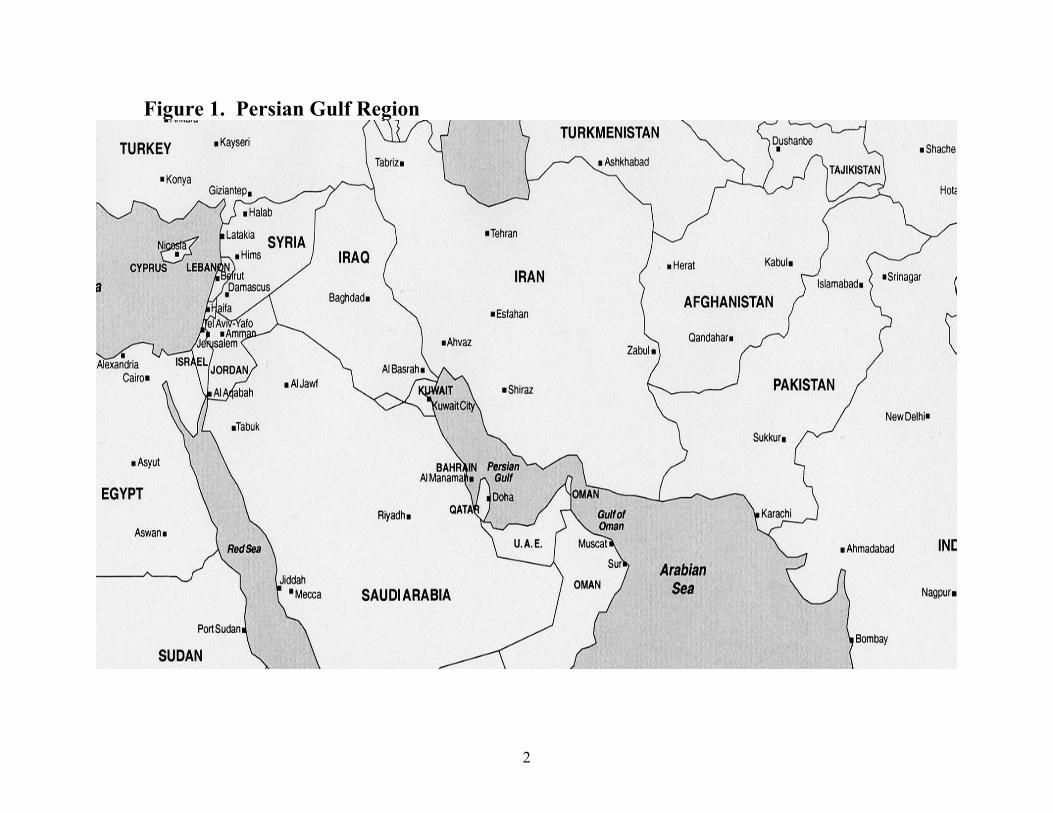
Introduction
The map (Figure 1) illustrates the interactions of Persian Gulf oil and international
security. Within this image are (a) 5 countries with nuclear weapons, (b) 3 countries where U.S.
forces are engaged in military conflict, (c) the nationalities of 18 of the 19 hijackers who
undertook the September 11, 2001 attacks, (d) more than three-fourths of the world’s readily
accessible proved petroleum reserves and more than half of the estimated total remaining oil, and
(e) the location of 6 major recent armed conflicts that did not involve the United States.
I. Brief History: Petroleum, the Persian Gulf, and the West
Today’s issues with security and oil have long roots. Turkey’s Ottoman Empire
controlled most of the region at different periods over a 7-century span in the last millennium.
The slow disintegration of the Empire was accelerated by the search for oil for naval vessels by
Britain and France early in the 20th Century. In the years after WWI, much of the oil regions of
the Persian Gulf was under the production control of Western oil companies. Initially British
Petroleum and the French Petroleum Company dominated the region, reflecting the European
concern for secure sources of petroleum. By the 1950's, however, American oil companies had
become full partners.1 The organization of Western oil concessions was typical of natural
resource production areas throughout the developing world for the time. One observer described
the early oil concessions in this way:
“One would have a clear conception of the situation in Persia if one could imagine that Russian officers command the National Guard, French professors lecture in French, the Dutch own and manage the only bank, with a branch in every county, employing a large number of Indians. The British own and manage the only large industrial operation (oil). People would resent this state of affairs and try to change it.”2
1 See Figure 2 and Tables 1 and 2. Russia and the Soviet Union during this period sought to establish influence in the Persian Gulf, but were generally unsuccessful except for brief periods in Iran and Iraq. 2 Adapted from JM. Upton, The Modern History of Iran (Cambridge: Harvard University Press, 1961), page 32. Also pages 83-86 in D. Chapman, Energy Resources and Energy Corporations (Ithaca NY: Cornell University Press, 1983).
2
Figure 1. Persian Gulf Region
3
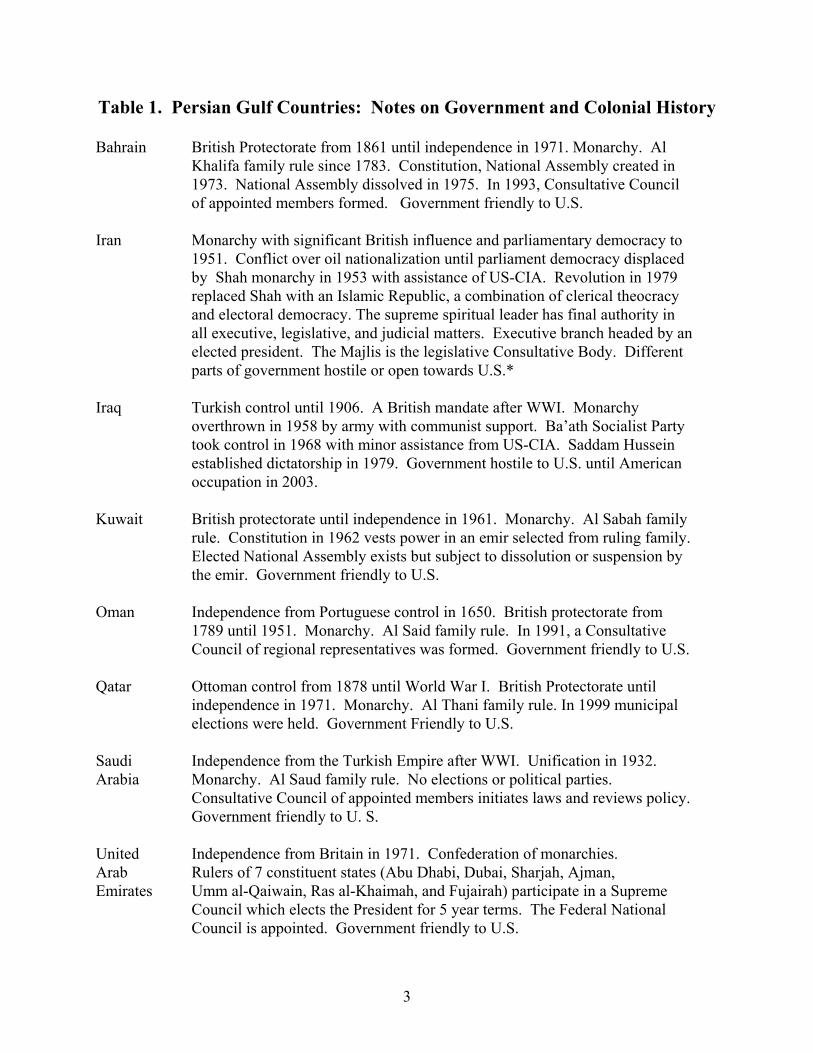
Table 1. Persian Gulf Countries: Notes on Government and Colonial History Bahrain British Protectorate from 1861 until independence in 1971. Monarchy. Al
Khalifa family rule since 1783. Constitution, National Assembly created in 1973. National Assembly dissolved in 1975. In 1993, Consultative Council of appointed members formed. Government friendly to U.S.
Iran Monarchy with significant British influence and parliamentary democracy to
1951. Conflict over oil nationalization until parliament democracy displaced by Shah monarchy in 1953 with assistance of US-CIA. Revolution in 1979 replaced Shah with an Islamic Republic, a combination of clerical theocracy and electoral democracy. The supreme spiritual leader has final authority in all executive, legislative, and judicial matters. Executive branch headed by an elected president. The Majlis is the legislative Consultative Body. Different parts of government hostile or open towards U.S.*
Iraq Turkish control until 1906. A British mandate after WWI. Monarchy
overthrown in 1958 by army with communist support. Ba’ath Socialist Party took control in 1968 with minor assistance from US-CIA. Saddam Hussein established dictatorship in 1979. Government hostile to U.S. until American occupation in 2003.
Kuwait British protectorate until independence in 1961. Monarchy. Al Sabah family
rule. Constitution in 1962 vests power in an emir selected from ruling family. Elected National Assembly exists but subject to dissolution or suspension by the emir. Government friendly to U.S.
Oman Independence from Portuguese control in 1650. British protectorate from
1789 until 1951. Monarchy. Al Said family rule. In 1991, a Consultative Council of regional representatives was formed. Government friendly to U.S.
Qatar Ottoman control from 1878 until World War I. British Protectorate until
independence in 1971. Monarchy. Al Thani family rule. In 1999 municipal elections were held. Government Friendly to U.S.
Saudi Independence from the Turkish Empire after WWI. Unification in 1932. Arabia Monarchy. Al Saud family rule. No elections or political parties.
Consultative Council of appointed members initiates laws and reviews policy. Government friendly to U. S.
United Independence from Britain in 1971. Confederation of monarchies. Arab Rulers of 7 constituent states (Abu Dhabi, Dubai, Sharjah, Ajman, Emirates Umm al-Qaiwain, Ras al-Khaimah, and Fujairah) participate in a Supreme
Council which elects the President for 5 year terms. The Federal National Council is appointed. Government friendly to U.S.

4
Notes to Table 1 Primary Source: US-CIA, The World Factbook 2002; Accessed 3/2/03 - 4/4/03, <http://www.odci.gov/cia/publications/factbook/index.html>. Other Sources: Arthur S. Banks & Thomas C. Muller, Political Handbook of the World (Binghamton, NY: CSA Publications, 1999). Encyclopedia Britannica Online; Accessed 3/2/03-4/4/03; <http://eb.com/>. Lord Kinross, The Ottoman Centuries (New York City: Morrow, 1977). George T. Kurian, Enyclopedia of the Third World, (New York City: Facts on File, 1992). Roger Morris, “A Tyrant in the Making”, New York Times, March 14, 2003. Kermit Roosevelt, Countercoup: The Struggle for Control of Iraq (New York City: McGraw-Hill, 1979). Anthony Sampson, The Seven Sisters: The Great Oil Companies and the World They Made (New York City: Viking, 1975). Daniel Yergin, The Prize: The Epic Quest for Oil, Money, and Power (New York City: Simon and Schuster, 1992). “*” means author’s opinion.
5
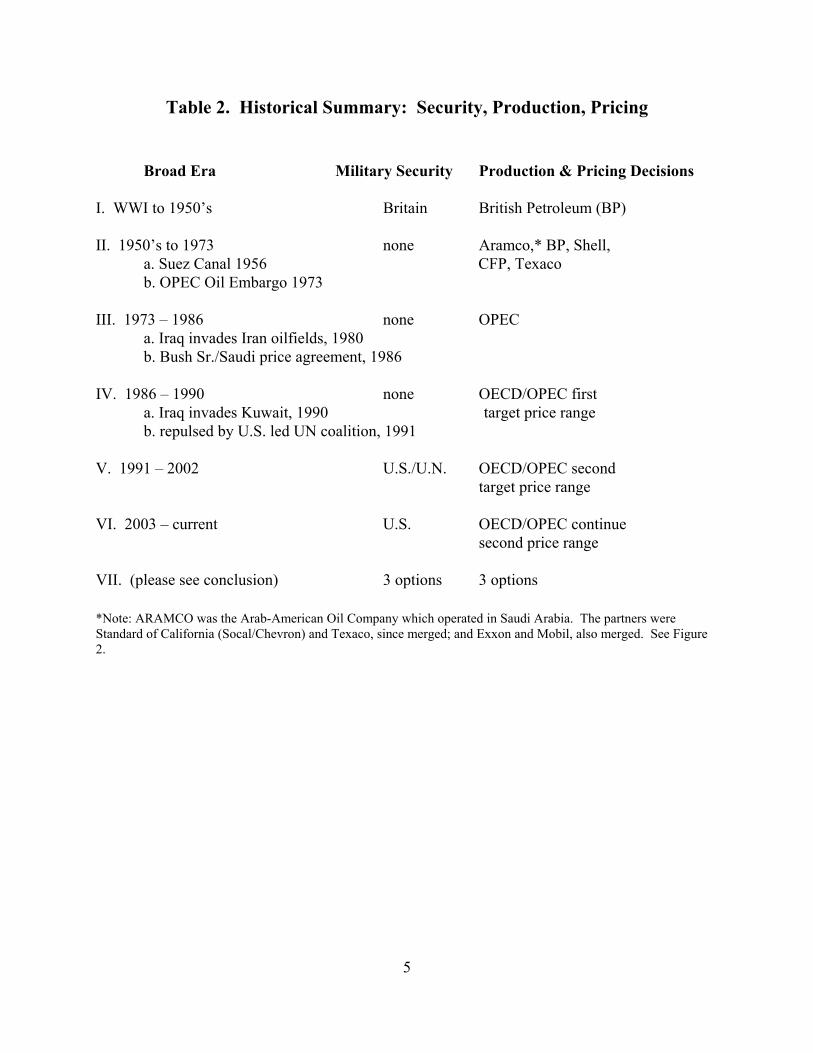
Table 2. Historical Summary: Security, Production, Pricing
Broad Era Military Security Production & Pricing Decisions I. WWI to 1950’s Britain British Petroleum (BP) II. 1950’s to 1973 none Aramco,* BP, Shell, a. Suez Canal 1956 CFP, Texaco b. OPEC Oil Embargo 1973 III. 1973 – 1986 none OPEC a. Iraq invades Iran oilfields, 1980
b. Bush Sr./Saudi price agreement, 1986
IV. 1986 – 1990 none OECD/OPEC first a. Iraq invades Kuwait, 1990 target price range
b. repulsed by U.S. led UN coalition, 1991 V. 1991 – 2002 U.S./U.N. OECD/OPEC second target price range VI. 2003 – current U.S. OECD/OPEC continue second price range VII. (please see conclusion) 3 options 3 options
*Note: ARAMCO was the Arab-American Oil Company which operated in Saudi Arabia. The partners were Standard of California (Socal/Chevron) and Texaco, since merged; and Exxon and Mobil, also merged. See Figure 2.
6
������������������������������������������������������������������������������������������������������ ��������������������������������������������������������������������������������������������������������������������������������������������������������������������������������������������������������������������������������������������������������������������������������������������������������������������������������������������������������������������������������������������������������������������������������������������������������������������������������������������������������������������������������������������������������������
���
���
��
��
��
��������������������������������������������������� ��� ��� ��� ��� ��� ��� ���
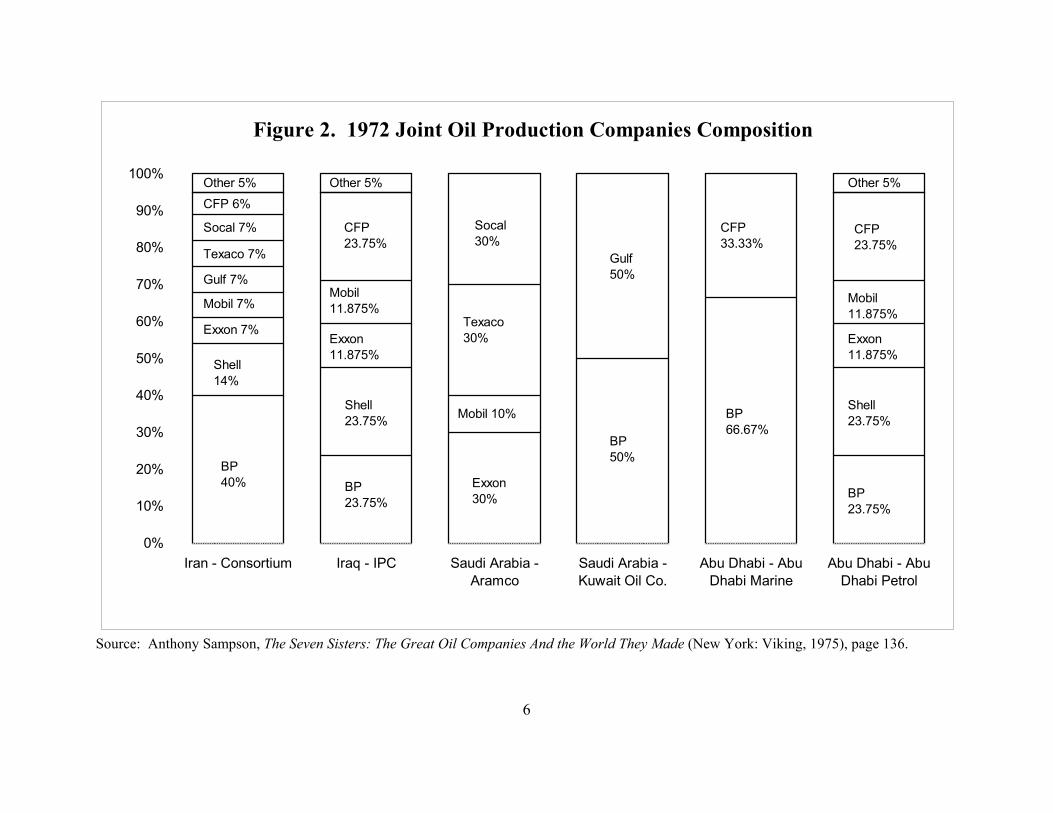
Figure 2. 1972 Joint Oil Production Companies Composition
0%
10%
20%
30%
40%
50%
60%
70%
80%
90%
100%
Iran - Consortium Iraq - IPC Saudi Arabia -Aramco
Saudi Arabia -Kuwait Oil Co.
Abu Dhabi - AbuDhabi Marine
Abu Dhabi - AbuDhabi Petrol
BP40% BP
23.75%
BP50%
BP66.67%
BP23.75%
Shell14%
Shell23.75%
Shell23.75%
Exxon 7%Exxon11.875%
Exxon11.875%
Mobil 7%Mobil11.875%
Exxon30%
Mobil 10%
Mobil11.875%
Gulf 7%Gulf50%
Texaco 7%
Texaco30%
Socal 7% Socal30%
CFP 6%
CFP23.75%
CFP33.33%
CFP23.75%
Other 5% Other 5% Other 5%
Source: Anthony Sampson, The Seven Sisters: The Great Oil Companies And the World They Made (New York: Viking, 1975), page 136.
7
II. The Tradeoff: Price Stability and Military Security
American and European oil companies managed production in the Persian Gulf much the
same way as in Texas or the North Sea. However, the 1973 Arab-Israeli war created a surge of
antagonism in the Arab world against the U.S. and Europe. The OPEC nations, led by Saudi
Arabia, seized the authority to control oil production within their countries. Their efforts to raise
oil prices were initially successful, nearly reaching $40 per barrel, but had collapsed by 1986
with crude prices at $10 per barrel.
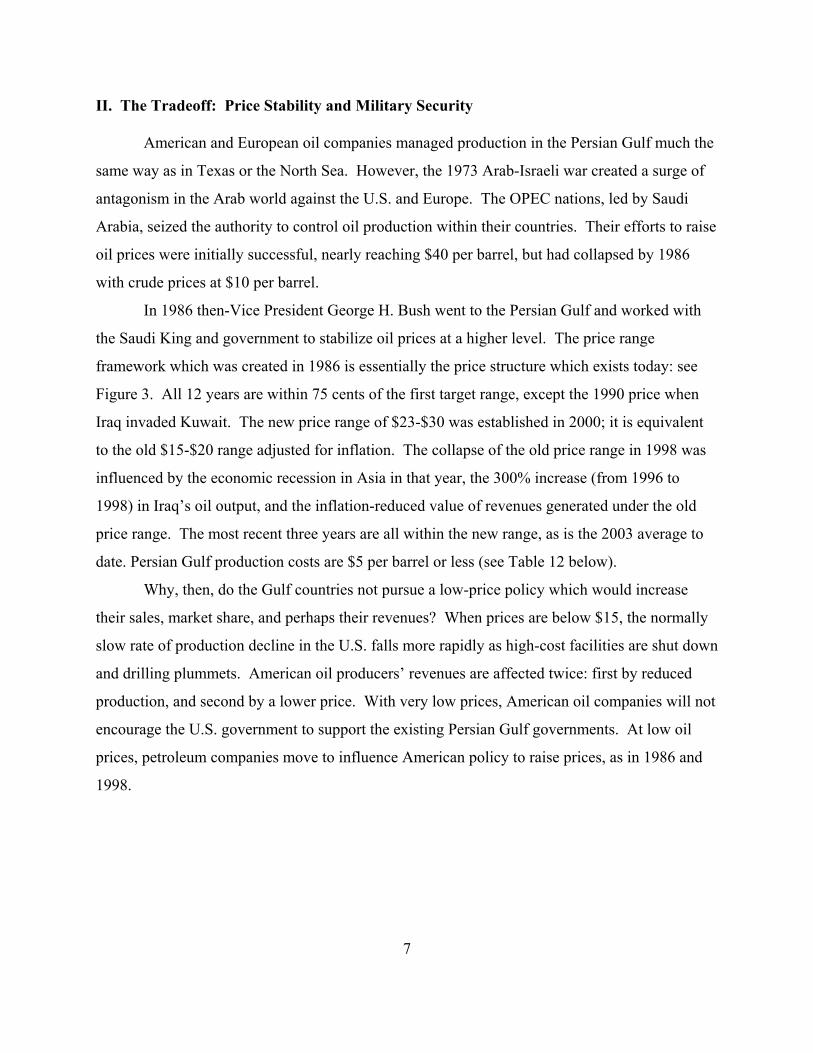
In 1986 then-Vice President George H. Bush went to the Persian Gulf and worked with
the Saudi King and government to stabilize oil prices at a higher level. The price range
framework which was created in 1986 is essentially the price structure which exists today: see
Figure 3. All 12 years are within 75 cents of the first target range, except the 1990 price when
Iraq invaded Kuwait. The new price range of $23-$30 was established in 2000; it is equivalent
to the old $15-$20 range adjusted for inflation. The collapse of the old price range in 1998 was
influenced by the economic recession in Asia in that year, the 300% increase (from 1996 to
1998) in Iraq’s oil output, and the inflation-reduced value of revenues generated under the old
price range. The most recent three years are all within the new range, as is the 2003 average to
date. Persian Gulf production costs are $5 per barrel or less (see Table 12 below).
Why, then, do the Gulf countries not pursue a low-price policy which would increase
their sales, market share, and perhaps their revenues? When prices are below $15, the normally
slow rate of production decline in the U.S. falls more rapidly as high-cost facilities are shut down
and drilling plummets. American oil producers’ revenues are affected twice: first by reduced
production, and second by a lower price. With very low prices, American oil companies will not
encourage the U.S. government to support the existing Persian Gulf governments. At low oil
prices, petroleum companies move to influence American policy to raise prices, as in 1986 and
1998.

8
������������������������������������������������ �������������������������������������������������������������������������������������������������������������������������������������������������������������������������������������������������������������������������������������������������������������������������������������������������������������������������������������������������������������������������������������������������������������������������������������������������������������������������������������������������������������������
��
��
��
�
������������������������������������������������ ��� ��� ��� ��� ��� ��� ��� ��� ��� ���
Figure 3. Target Price Ranges: Old and New
$0.00
$5.00
$10.00
$15.00
$20.00
$25.00
$30.00
$35.00
1985 1987 1989 1991 1993 1995 1997 1999 2001 2003
Year
All 12 years are within $0.75 of the first range,except Iraq-Kuwait, 1990
NEW $23 - $30 RANGE, 2000 - Current
OLD $15 - $20 RANGE, 1986 - 1997
NO TARGET RANGE,1998 - 1999
9
In contrast, with very high oil prices, American consumers and oil-using businesses
dominate American policy. Congressmen from states without oil production call for termination
or reduction of military support for Persian Gulf governments. American policy considers
withdrawing military and political support of the Gulf governments at either extreme of the price
spectrum.3
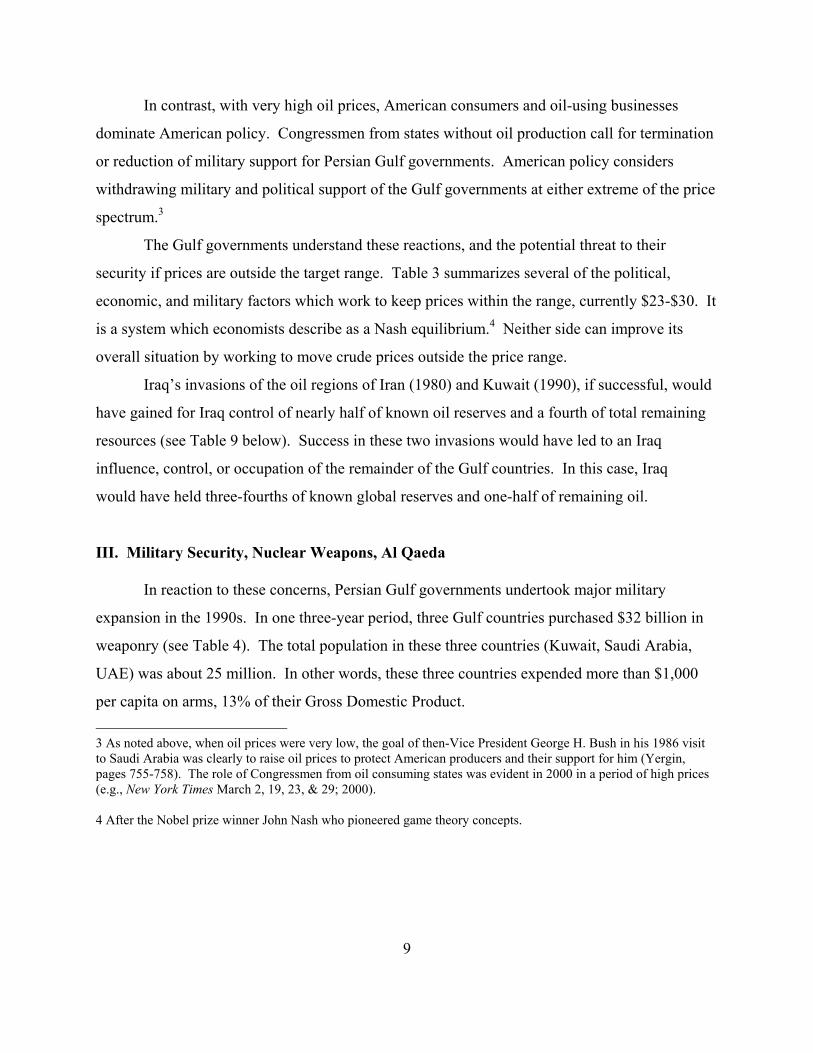
The Gulf governments understand these reactions, and the potential threat to their
security if prices are outside the target range. Table 3 summarizes several of the political,
economic, and military factors which work to keep prices within the range, currently $23-$30. It
is a system which economists describe as a Nash equilibrium.4 Neither side can improve its
overall situation by working to move crude prices outside the price range.
Iraq’s invasions of the oil regions of Iran (1980) and Kuwait (1990), if successful, would
have gained for Iraq control of nearly half of known oil reserves and a fourth of total remaining
resources (see Table 9 below). Success in these two invasions would have led to an Iraq
influence, control, or occupation of the remainder of the Gulf countries. In this case, Iraq
would have held three-fourths of known global reserves and one-half of remaining oil.
III. Military Security, Nuclear Weapons, Al Qaeda
In reaction to these concerns, Persian Gulf governments undertook major military
expansion in the 1990s. In one three-year period, three Gulf countries purchased $32 billion in
weaponry (see Table 4). The total population in these three countries (Kuwait, Saudi Arabia,
UAE) was about 25 million. In other words, these three countries expended more than $1,000
per capita on arms, 13% of their Gross Domestic Product. 3 As noted above, when oil prices were very low, the goal of then-Vice President George H. Bush in his 1986 visit to Saudi Arabia was clearly to raise oil prices to protect American producers and their support for him (Yergin, pages 755-758). The role of Congressmen from oil consuming states was evident in 2000 in a period of high prices (e.g., New York Times March 2, 19, 23, & 29; 2000). 4 After the Nobel prize winner John Nash who pioneered game theory concepts.
10
Table 3: General Economic Impact of Crude Oil Price Decision–Making
in a Game Theory Price Range Framework
Price per barrel
OECD Countries
Persian Gulf Oil Producers
$15 or less • higher GNP growth
• shut some domestic production
• greatly increased oil consumption
• much more imports
• more pollution, climate change
• end Persian Gulf political support by OECD oil industry
• loss of political support from OECD oil industry
• lower revenue, greater volume
• internal economic problems
• faster depletion
• higher market share
$23 - $30 • stable GNP growth
• stable OECD oil production
• slow growth in oil consumption
• slow growth in import share
• stable prices
• ANWR production feasible
• continued Persian Gulf support
• continued OECD political, military support
• stable revenue, rent
• stable market share
• cooperation with OECD oil industry
$40 • decline in GNP growth
• rapid near-term growth domestic production
• stable or declining consumption
• ANWR production profitable
• OECD Persian Gulf support opposed by oil consumers
• loss of OECD political, military support
• increased incentives for Central Asia, other non-OPEC production
• less market share
• less production, more profit, rent
• greater payoff to successful Iraq-type action

11
Table 4. Value of Arms Transfer Deliveries by Major Supplier and Recipient Country (Cumulative 1994-1996, millions of current dollars)
Supplier Recipient
Total US UK Russia France Germ- any
China Other NATO
Middle East
Other East
Europe
Other
West Europe
Other East Asia
All Others
World 119,565 67,210 16,405 8,490 6,675 4,045 1,970 4,610 3,070 2,130 2,485 595 1,880 Developed US Israel Russia France Germany Japan
52,070 3,330 2,865
50 695
2,710 6,020
38,760 -
2,600 30
550 2,600 6,000
1,355 950
0 0 0 0 0
845 40 0 - 0 0 0
2,160 160
0 0 - 0 0
3,025 320 150
0 0 - 0
40 40 0 0 0 0 0
1,990 950
5 0
40 60 0
1,310 330
0 0 5
10 0
180 30 10 20 0 0 0
1,370 140
0 0 0 0 0
200 200
0 0 0 0 0
835 170 80 0
80 0 0
Developing China Taiwan
67,495 2,565 4,090
28,450 120
3,330
15,050 0 0
7,645 2,000
0
4,515 0
775
1,020 0 0
1,930 - 0
2,620 0 0
1,760 320
0
1,950 30 0
1,115 0 0
395 0 0
1,045 80 0
OPEC Iran Kuwait Saudi Arabia UAE
36,080 1,025 3,405
26,585 2,270
15,150 0
1,900 11,700
800
12,915 0
675 11,200
260
1,625 320 750
0 200
3,040 0
60 2,000 750
190 0 0
60 0
525 500
0 0 0
940 10 0
775 0
85 10 0 0 0
310 80 20 0
20
860 10 0
850 0
150 50 0 0
40
290 5 0 0
200 NATO 25,525 18,150 1,195 230 1,300 1,470 40 1,785 580 45 275 200 255 Source: Prepared by Neha Khanna; from Chapman and Khanna, 2001, op. cit.

12
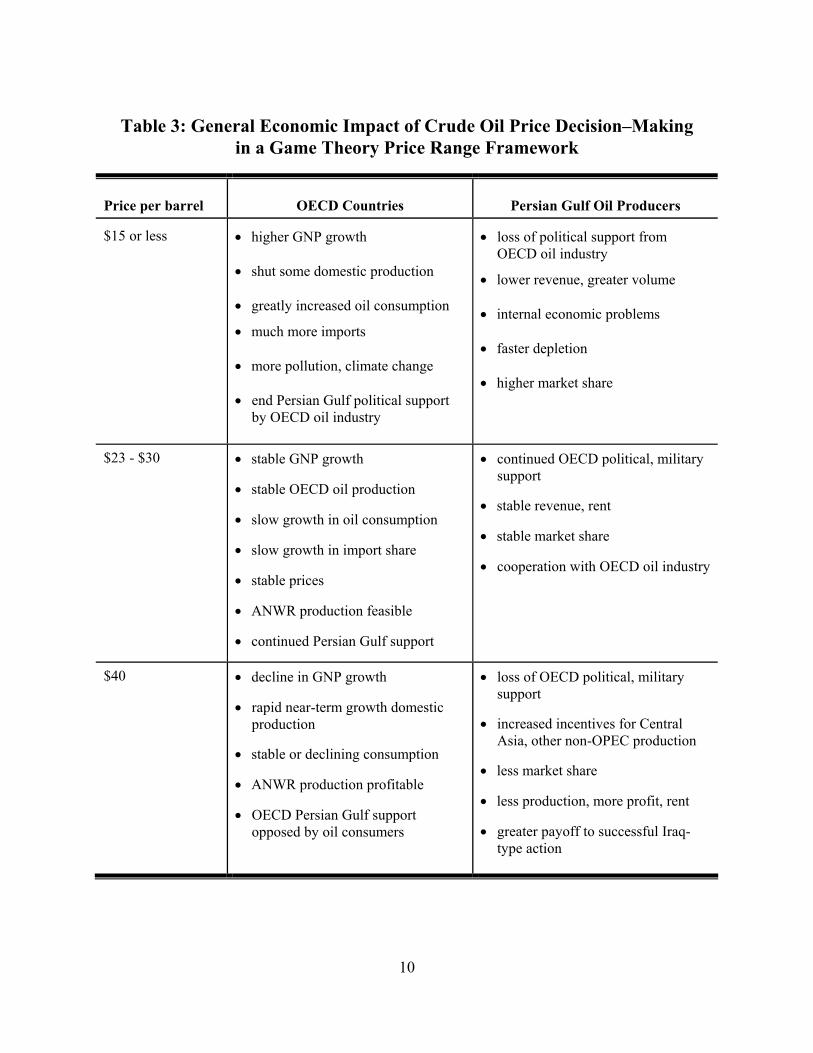
The importance of military policy and prices was noted above first with respect to the
price range framework, and then again in the context of Iraq’s attempt to control Persian Gulf
Oil. Table 5 shows another dimension of this relationship. There is a strong correlation between
arms trade and petroleum trade. Weapons exporters are likely to import oil (R = .74),5 and oil
exporters are likely to import weapons (R = .70).
Nuclear weapons are increasing in countries near the Persian Gulf; see Table 6. There is
no current threat to Gulf oil production or shipment with nuclear warheads as of this writing.
The many conflicts in nearby countries have existed independently of Persian Gulf oil.
However, nuclear weapons capability might at a future date be utilized by Israel, Pakistan, or
India. Each could threaten Persian Gulf oil production or transport to encourage greater U.S. and
European involvement in the Kashmir and Middle East conflicts. The small possibility of a
fundamentalist government assuming power in Pakistan translates into an equally small but real
possibility that Pakistan could employ a nuclear threat against Gulf countries, or shipping, or
American naval vessels and bases in the Gulf.6
Since any civilian nuclear power program can be the basis for manufacturing nuclear
weapons, Iran’s nuclear power development creates the potential for future weapons capability.
It is well known that 17 of the 19 September 11, 2001 hijackers were born in Persian
Gulf countries. In addition, 7 of the 9 apparently highest-ranking leaders of the Al Qaeda
organization are from Saudi Arabia or its neighbors.7 The May 2003 attacks against Westerners
in Saudi Arabia were made primarily by Saudis. Bin Laden and Al Qaeda apparently see the
governments of Saudi Arabia and the other southern Gulf nations as semi-colonial agents of the
United States. In part, the Al Qaeda political program is focused on the goal of replacing the
Persian Gulf monarchies because of their strong association with the U.S.8 5 Tables 4, 5, and 6 were prepared by Neha Khanna and used earlier in D. Chapman and N. Khanna, “An Economic Analysis of Aspects of Petroleum and Military Security in the Persian Gulf,” Contemporary Economic Policy, October 2001, 19(4): 371-381.
6 A point we made in Chapman and Khanna 2001, page 379.
7 Osama bin Laden, Khalid Shaikh Mohammed, Ramzi bin al-Shibh, Abd al-Rahim al-Nashiri, Walid Ba’Attash, Mustafah Muhammed Ahmad, and Mustafa Ahmed al-Hawsawi.
8 CNN March 1997 interview with Osama bin Laden, especially transcript pages 1, 2, and 5.
13
Table 5: Correlation Coefficients Correlation of
Pearson’s Correlation Coefficient
Arms exports with Oil imports
Arms imports with Oil exports
Total arms trade with Total trade
Total arms trade with Total oil trade
Total trade with Total oil trade
0.74
0.70
0.69
0.80
0.81 Variable definitions: All data are for 1995
Arms exports (imports): value of conventional weapons exports (imports)
Arms trade: sum of arms exports and arms imports
Oil imports (exports): total volume of crude oil and refined petroleum products imports
(exports)
Total trade: total value of merchandise imports and exports
Source: Chapman and Khanna, 2001, op. cit.

14
Table 6: Nuclear Weapons Capabilities
Name and history Arsenal (number of warheads)
Representative Missile Range (miles)
1. Countries with nuclear weapons capabilities United States First test: 1945 Total number of tests: 1,030 United Kingdom First test: 1952 Total number of tests: 45 France First test: 1961 Total number of tests: 210 Russia First test: between 1945-1952 Total number of tests: 715 China First test: 1964 Total number of tests: 45 India First test: 1974 Total number of tests: 6 Israel Known to have bomb Pakistan Began secret program in 1972 North Korea
12,070
380
500
22,500
450
65
64-112
15-25 ?
8,100
7,500
3,300
6,800
6,800
1,500
930
930 ?
2. Countries that terminated nuclear weapons programs Algeria, Argentina, Brazil, Belarus, Kazakhstan, Ukraine, South Africa. Source: Chapman and Khanna 2001.

15
To date there is no indication of competent Al Qaeda interest in nuclear weapons,
although a minor initiative was discovered and terminated.9 It would seem a likely possibility
that Al Qaeda or similar groups would seek to work with fundamentalist Islamic political groups
to gain control or influence over Pakistani nuclear weapons.10
IV. Global Oil Resources and the Persian Gulf; U. S. Imports
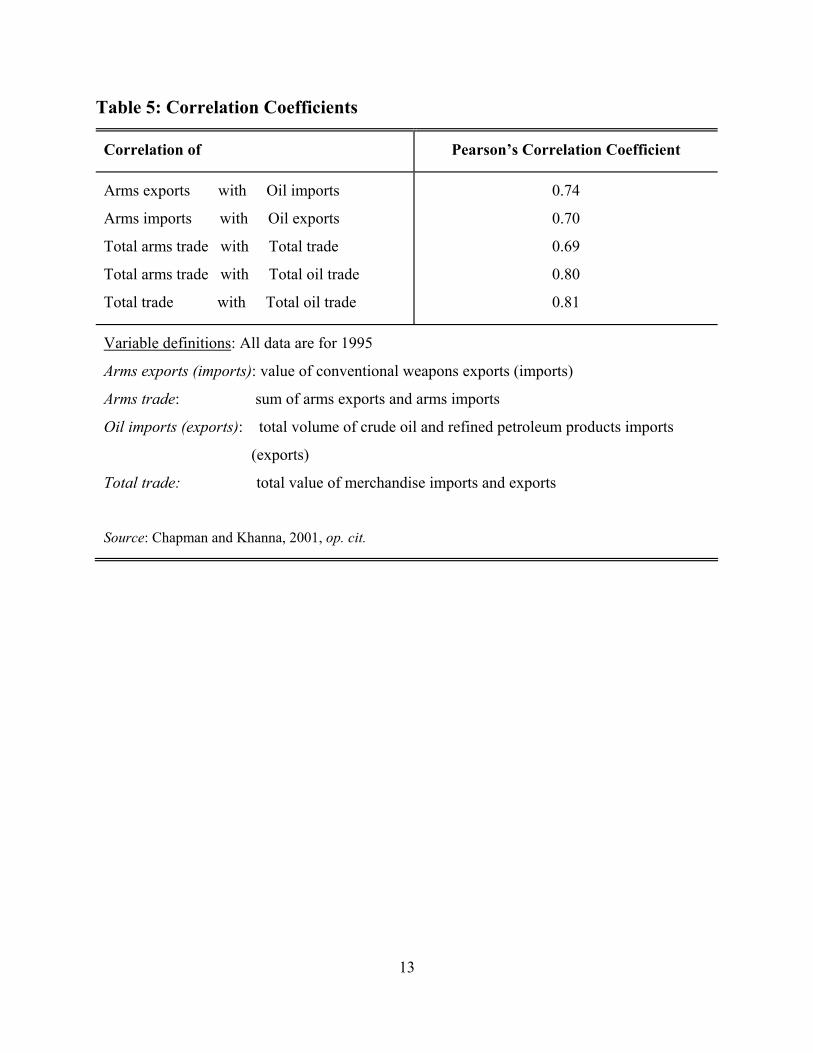
Tables 7 and 8 show the concepts that are utilized in estimating world oil resources.11
The total remaining resource estimate of 2.855 trillion barrels (in Table 8) is the sum of three
components. “Known Reserves” (similar in meaning to “Proved Reserves”) are relatively firm
values used in developing near-term production plans. It is the minimum amount of crude oil
that may be expected to be produced from a field or reservoir.
“Potential Reserve Expansion” is a best-guess estimate of future production at an existing
site which exceeds the proved reserves figure. As geological techniques have improved,
potential reserve expansion has become more important in petroleum resource planning. It is a
probabilistic concept. For an existing field under production, remaining resources would be the
sum of “Known Reserves” and “Potential Reserve Expansion.”
“Undiscovered Resources” is a term used by the U.S. Geological Survey (USGS). It
could be roughly translated “Approximate probability distribution estimates of oil resources in
areas which have not been explored in detail.” In general, it is a category which relies on
extrapolation. Suppose Area A is a region that has been producing for many years and has been
extensively investigated. Known reserves are set at 500 million barrels. Area B is the same size
with apparently identical geology. The undiscovered resource for Area B may have a mean
estimate of the same 500 million barrel figure, with a 95% probability of at least 400 million
barrels, and a 5% probability of 600 million barrels. 9 Jose Padilla is reported to have met with Al Qaeda members, and studied radiological weapons on the internet. Baltimore Sun, September 12, 2002; Washington Post, June 15, 2002.
10 New York Times, November 1 and December 17, 2001. Seymour Hersh, “Watching the Warheads,” November 5, 2001 New Yorker, pages 48-54.
11 Tables 7-9 and Figure 4 build upon recent work by Chapman or Chapman and Khanna. That work, in turn, uses basic data from the U.S. Geological Survey.
16
Table 7. Concepts in Resource Definition
A. Proved Reserves – Economically recoverable conventional crude oil at known fields and reservoirs, estimated directly by engineering as well as geological data. Similar to an inventory concept.
B. Potential Reserve Expansion –
Identified reserves expected to be developed in existing fields through improved recovery, extensions, revisions, and the addition of new reservoirs and pools.
C. Undiscovered Resources – Geological extrapolation of potential crude oil based upon knowledge of geological formations outside existing fields. A probabilistic concept.
D. Total Remaining Resources –
An estimate of total conventional crude oil available for recovery; the sum of the preceding categories.
E. Original Endowment – The amount of oil existing before production began in 1859. It combines the amount of cumulative production to date with the remaining resources estimate.
Sources: USGS, “1995 National Assessment of United States Oil and Gas Resources,” USGPO 1995. D. Chapman, “World Oil: Hotelling Depletion or Accelerating Use?” Nonrenewable Resources, Journal of the International Association for Mathematical Geology, Winter 1993, 2(4).

17
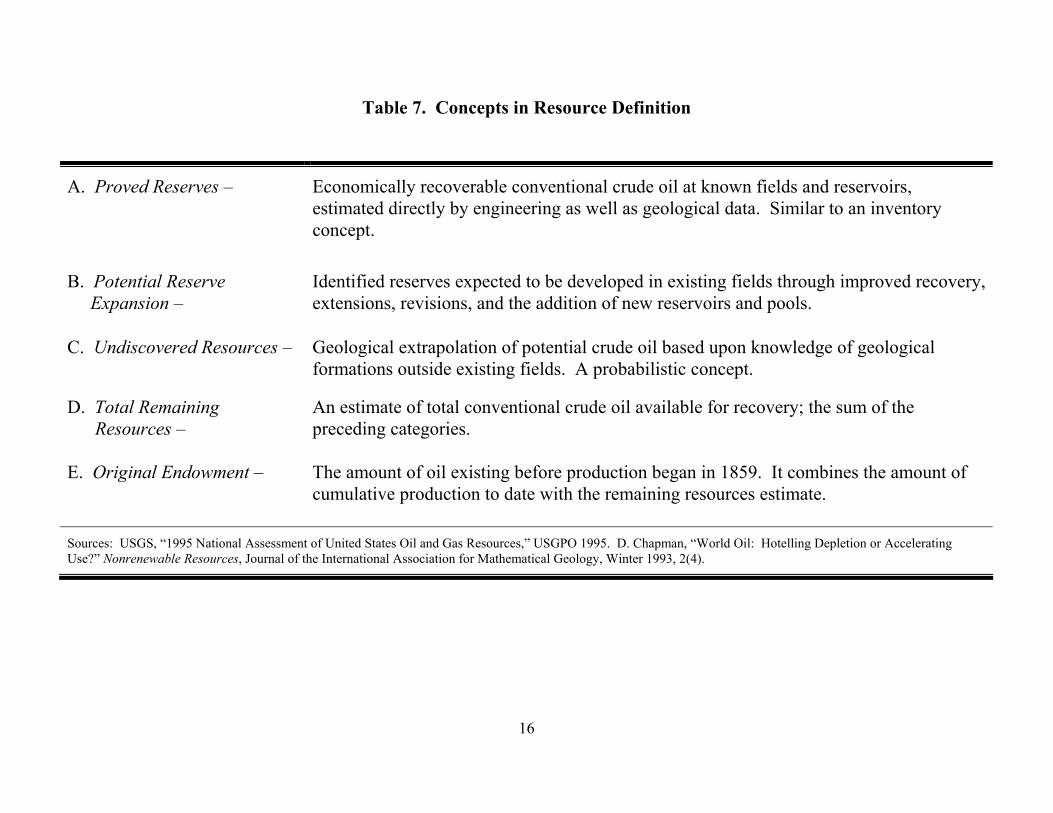
Table 8. Probability 5% of Remaining World Oil Resources (billion barrels)
Category
Amount
Known Reserves 883
Potential Reserve Expansion
682
Undiscovered Resources 1,290
Total Remaining Resources 2,855
Note: The 2000 Assessment data used a January 1, 1995 benchmark date. Production in the 8 years 1995-2002 was 192 billion barrels, implying a current remaining resource estimate of 2,663. World cumulative production 1859-2002 has been 931 billion barrels, implying an original endowment of 3.6 trillion barrels. The table is a revision of Table 1 in D. Chapman, “A Review of the New Undiscovered Conventional Crude Oil Resource Estimates and Their Economic and Environmental Implications,” Cornell AEM Working Paper 2001-22, December 2001.

18
These assessments are developed for individual regions throughout the world. A real
example for Russia: in Western Siberia, the Togur-Tyumen Petroleum System has 5 fields. The
95% probability estimate is 2.3 billion barrels, and the 5% probability estimate is 14.7 billion
barrels. For all of Russia, the USGS analyzed 45 assessment units with 331 oil fields. The
results: 95% probability of 25 billion barrels, and a 5% probability of at least 148 billion barrels;
this, recall, in the “Undiscovered Resource” category.
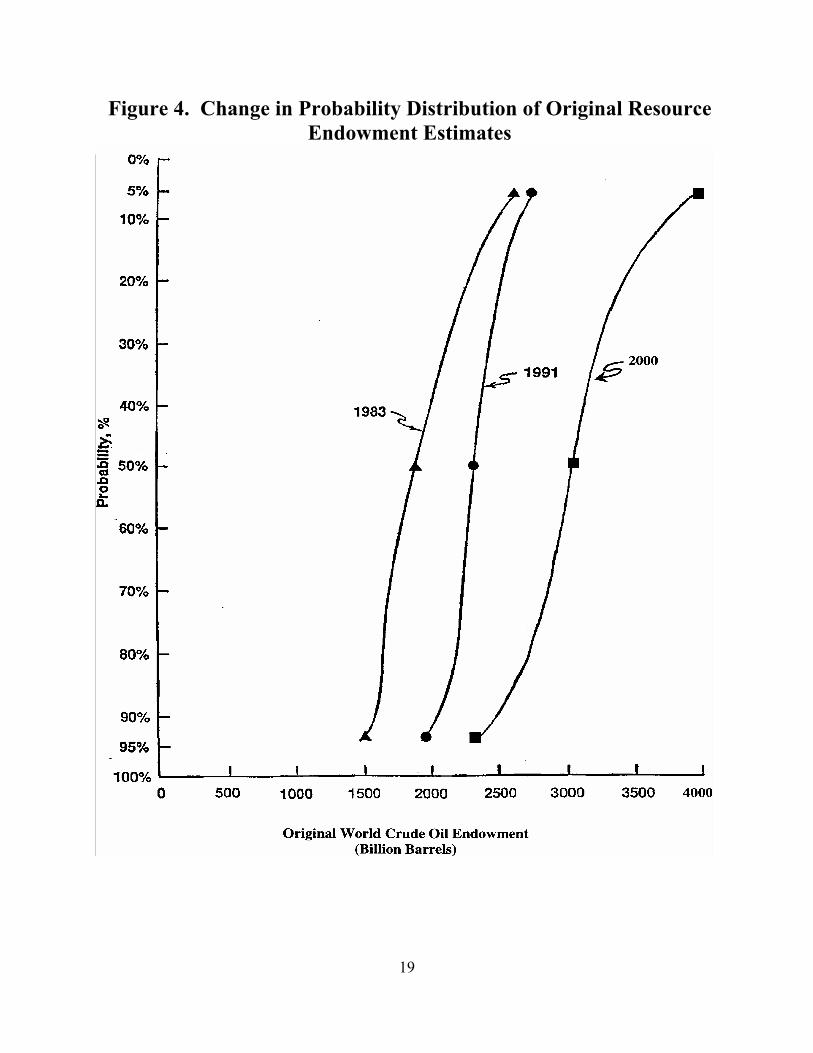
Figure 412 shows the changing nature of the probability distributions for “Original
Resources,” the 5th category in Table 7. At every probability level, the estimates have increased.
For the latest assessment, the range between high probability low resource estimates and low
probability high oil resource estimates has increased. For the 5% probability level, the estimate
of original endowment has grown by 1.5 Tbl (trillion barrels). Petroleum resources in the
Persian Gulf are shown in Table 9.13 (The terminology in Table 9 uses the concepts explained in
the discussion of Tables 7 and 8.) The dominant position of the Persian Gulf countries is
evident. The region holds 76% of known reserves and 54% of estimated total remaining
resources.
Since Persian Gulf oil costs are on the order of $5 per barrel, and U.S. and European
costs are on the order of $20 to $25 for new fields,14 the importance of the Gulf region in
quantity of resources is multiplied by its uniquely low production costs.
In the long run these factors will increase in importance. The U.S. including Alaska is
past its production peak, and production levels in the U.S. will continue to decline. North Sea
production is probably at its maximum. In contrast, the Persian Gulf has produced a much
smaller proportion of its original endowment than has the U.S.: 11% versus 38%. As American
and world oil consumption continues to grow, the role of the Persian Gulf countries will continue
to increase in importance, in both quantity and value.
A closer look at the U.S. (Tables 10 and 11) illuminates the global importance of the
Persian Gulf. U.S. imports are growing rapidly: nearly 4% annually. Two primary factors create 12 Figure 4 is from Chapman 2001, op. cit.
13 The 5% high resource estimates are used in Table 9 because the author assumes (a) the Figure 4 probability distributions will continue shifting rightward for some time, and (b) at some future date the real price of oil will pass $50, creating new incentive for increased recovery.
14 See discussion of costs below, and Table 12.
19
Figure 4. Change in Probability Distribution of Original Resource Endowment Estimates

20
Table 9. Persian Gulf, 2000 Assessment, billion barrels
Country Cum. Prod.
Known Reserves
Reserve Exp.
Undis. Resources
Original Endow.
Rem. Resource
RR % World
Bahrain 0.9 1.1 0.8 1.7 4.5 3.6 0%
Iran 33.7 105.0 74.8 100.5 314.0 280.3 10%
Iraq 22.4 100.1 71.3 83.9 277.7 255.6 9%
Kuwait & NZ 31.0 93.6 66.6 7.2 198.4 167.4 6%
Oman 3.6 7.3 5.2 7.3 23.4 19.8 1%
Qatar 5.0 9.2 6.6 6.4 27.2 22.2 1%
Saudi Arabia 72.8 283.5 201.9 160.9 719.1 646.3 23%
UAE 15.7 72.9 51.9 15.5 156.0 140.3 5%
Total Persian Gulf 185.1 672.7 479.0 383.4 1,720.2 1,535.1 54%
% World 26% 76% 70% 30% 40% 54%
World
708
883
682
1,290
3,563
2,855
100%
Row 539 859 612 1,107 3,117 2,578 90%
U.S. 169 24 70 183 446 277 10%

21
Notes to Table 9 1. Reserve expansion in Persian Gulf extrapolated from ratio of total Rest of World Expansion (612) to Known
Reserves (859), or .712. 2. Suppose reserve expansion in Persian Gulf extrapolated as 94.3% of mean undiscovered: 612/649 from FIG AR-
5 in Assessment 2000. Association of Reserve Expansion with Undiscovered Resources is obvious. Reserve Expansion= 193.1, instead of 479.0 in table.
3. Some rows and columns do not add exactly because of rounding. 4. Iraq’s goals in the last 25 years: Iran, Kuwait, and Saudi Arabia. These four constitute 66% of known reserves,
61% of reserve expansion, and 47% remaining resources; worldwide. 5. Current consumption per year: World, 24/25 Bbl.; U.S, 7 Bbl.; U.S. production: 2.1 Bbl. Imports, 3.4B crude,
.8B refined, .7B NGL. 6. “Rem. Resources” means remaining resources, the sum of the second, third, and fourth columns: “Known
Reserves”, “Reserve Expansion”, and “Undiscovered Resources”. Sources: USGS, “World Petroleum Assessment 2000 – Description and Results,” 2000, website www.usgs.gov., USGS, “National Assessment,” op. cit., U. S. Minerals Management Service, “Outer Continental Shelf Petroleum Assessment,” 2000, website www.mms.gov.

22
Table 10. Basic U.S. Petroleum Data (billion barrels)
1995
2002
Annual Changes
Consumption 6.47 7.21 +2.2%
Exports .35 .36 +0.6%
Imports
3.22 4.21 +5.5%
Domestic Production Total 3.15 2.94 -1.4% Alaska .54 .36 -7.8% Lower 48 1.85 1.74 -1.2% Natural Gas Liquids; Other .76 .84 +2.0%
Notes: Each entry includes both crude oil and petroleum products. Source is Monthly Energy Review, October 2003.
23
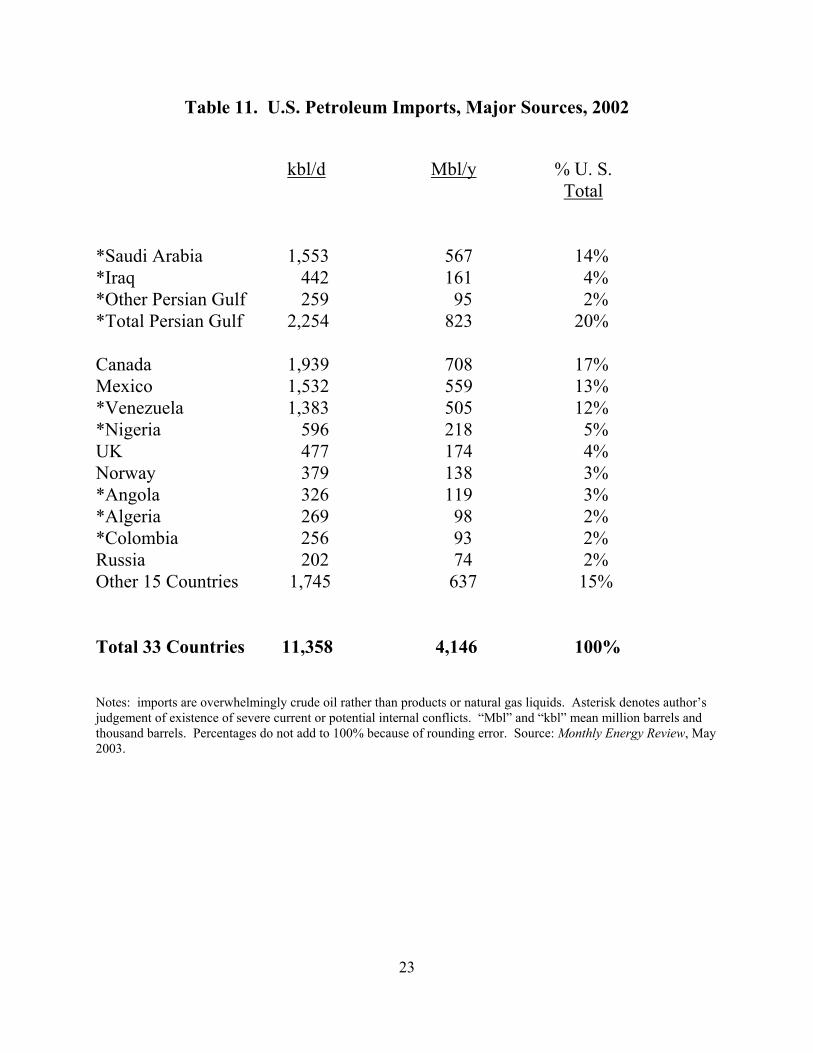
Table 11. U.S. Petroleum Imports, Major Sources, 2002 kbl/d Mbl/y % U. S. Total *Saudi Arabia 1,553 567 14% *Iraq 442 161 4% *Other Persian Gulf 259 95 2% *Total Persian Gulf 2,254 823 20% Canada 1,939 708 17% Mexico 1,532 559 13% *Venezuela 1,383 505 12% *Nigeria 596 218 5% UK 477 174 4% Norway 379 138 3% *Angola 326 119 3% *Algeria 269 98 2% *Colombia 256 93 2% Russia 202 74 2% Other 15 Countries 1,745 637 15% Total 33 Countries 11,358 4,146 100% Notes: imports are overwhelmingly crude oil rather than products or natural gas liquids. Asterisk denotes author’s judgement of existence of severe current or potential internal conflicts. “Mbl” and “kbl” mean million barrels and thousand barrels. Percentages do not add to 100% because of rounding error. Source: Monthly Energy Review, May 2003.
24
this result. First, American consumption continues to grow, and is now about 7 billion barrels
per year.15 Second, production continues to fall in Alaska and in the lower 48 states.
Imports (less exports) must continue to grow, even in the hypothetical event of stabilized
U.S. consumption. Oil production in the Alaskan National Wildlife Refuge would be costly in
both economic and environmental terms, but would only slow (not reverse) this trend of growing
imports. The current U.S. imports come from four continents. China is the only major oil
producer which does not export petroleum to the U.S.; China is also a net importer. Table 11
shows the 13 leading sources of U.S. petroleum imports. Eight of the 13 areas are now involved
in war or major internal conflict. The Appendix A lists all of the companies importing crude oil
into the U.S. in 2002, with their total imports and imports from the Persian Gulf. Given the
broad corporate network which handles world trade in crude and products, major production
losses in any one exporting country do not necessarily cause significant supply problems for
importing countries. (British Petroleum, owner of 80% of Prudhoe Bay production, is not
considered a major importer because it produces U.S. oil for use in the U.S.)
V. The $60 Trillion Prize
Persian Gulf oil is the lowest cost petroleum in the world. It is less than $5 per barrel.16
These cost figures in Table 12 include exploration, capital investment, a return on capital, and a
risk allowance. Throughout the Persian Gulf every dollar above $5 is a dollar of additional
profit. If the price is $45 the additional profit above a normal profit is $40.17
Assume that $40 per barrel represents the profit from Persian Gulf crude oil over the remainder
of the century. This gives an indicative figure of the value of remaining resources in the Persian 15 We use 26% of world consumption, a percentage which has not changed in 20 years. U.S. and world consumption have grown at the same rate.
16 Based on data in the Financial Times, February 21, 2003 (page 3), the comparable cost for Iraq is $2.40 per barrel before shipping.
17 In economic terminology, this is considered to be either producer surplus, or economic rent.

25
Table 12. Illustrative Production Cost
Possible Low Persian Gulf
Cost
Possible North Sea Cost
Investment in Development,
amortized (including profit)
55¢
$10
Operations, lifting
25¢
$5
Shipping
$2.00
included in operations
Total (rounded)
$3.00
$15
Source: Chapman and Khanna (2000) and Chapman (1993).

26
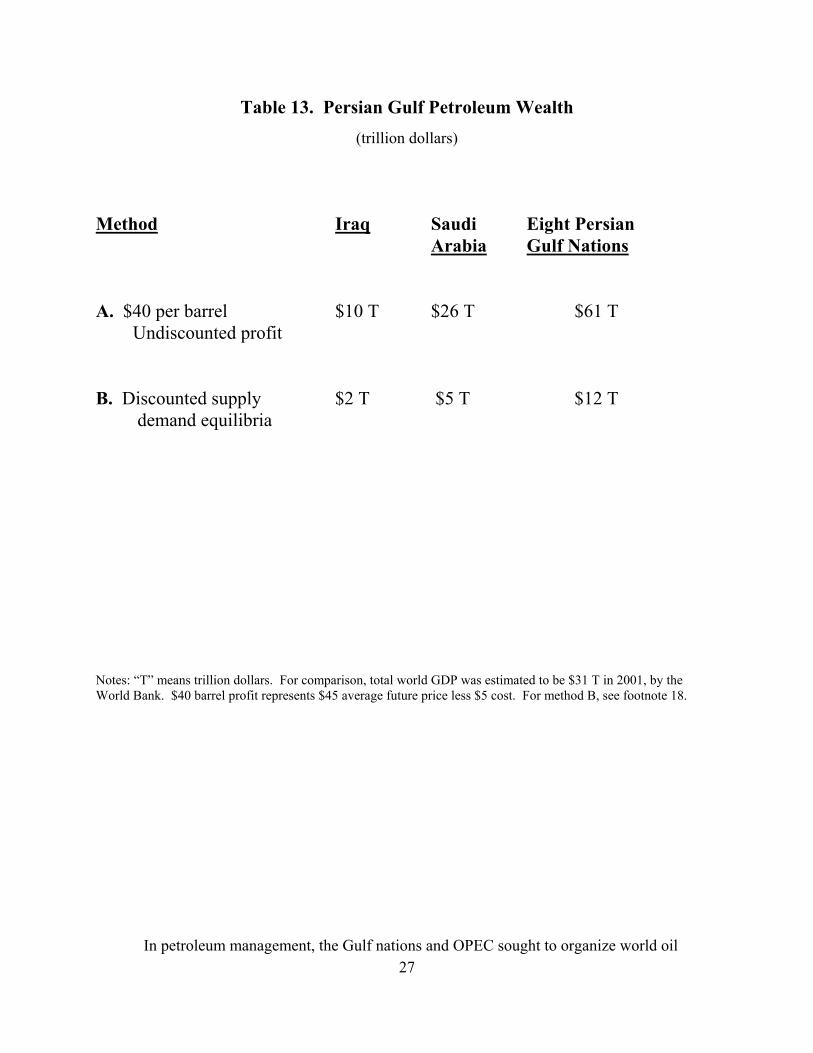
Gulf: $61 trillion.18 It is a result of multiplying the remaining resource estimates in Table 9 by
$40. Because production costs are so low in the Gulf, the Table 13 values are almost wholly
producer surplus.
This, then, is the global problem: $61 trillion in oil wealth, in an area with 120 million
people. In general terms, this is a serious world concern. The $61 trillion has been an attraction
to Western oil companies and governments. It was the goal of the Iraq invasions of Kuwait and
Iran. For the governments of the Gulf, recognition of the threats to their stability led to their
acquisition of considerable weaponry in the 1990s, and their alliance with the United States. At
the same time, the continuation of monarchies and dictatorships has been associated with the
growth of Al Qaeda, and the armed attacks against the U.S. on September 11, 2001 in the U.S.,
and elsewhere.
The problems of production and price stability have been solved in a reasonable
economic framework. However, political instability, the spread of nuclear and conventional
weapons, and the growing ferocity of the military conflicts and terrorist activities in, or
originating in the region show us that a breakdown of civil authority will lead to a collapse of the
economic framework of Persian Gulf oil exports. There are three broadly different approaches to
the problem.
VI. Roads to the Future
The three broad roads of choice have already seen heavy use. I describe them as the “hands off”
(or autonomy) approach, the American security framework, and an international framework.
A. Autonomy: “Hands Off”
Autonomy suggests self-government and sovereignty for each individual country. It
implies that other nations do not seek to dominate the region; or, if they seek to do so, they are
unsuccessful. The years 1973-1990 roughly approximate this picture. 18 Discounting of course gives different values. In one optimal control analysis where rising demand curves intersect a sequence of supply curves under a fixed constraint of remaining world oil of 3 trillion barrels, the discounted values are of course smaller than the Table 13 figures. See Chapman, December 2001, op. cit.
27
Table 13. Persian Gulf Petroleum Wealth (trillion dollars)
Method Iraq Saudi Eight Persian Arabia Gulf Nations A. $40 per barrel $10 T $26 T $61 T Undiscounted profit B. Discounted supply $2 T $5 T $12 T demand equilibria Notes: “T” means trillion dollars. For comparison, total world GDP was estimated to be $31 T in 2001, by the World Bank. $40 barrel profit represents $45 average future price less $5 cost. For method B, see footnote 18.
In petroleum management, the Gulf nations and OPEC sought to organize world oil
28
prices and production from 1973 (the “Oil Embargo”) to 1986 (Table 2). For most of this period
the West reacted to OPEC initiatives by developing alternative but high-cost oil supplies in
Alaska and the North Sea. Mexico and Russia became major exporters. These two
developments (OECD oil in the North Sea and Alaska, the emergence of major exports from
Mexico and Russia) unraveled OPEC’s hopes to control prices. In 1986 then-Vice President
George H. Bush organized the OECD/OPEC price framework (Figure 3, Table 3) which
continues to the present.
Persian Gulf governments more or less pursued their own destiny as they saw it during
this period. Iran replaced its monarchy, which had itself been reintroduced with the active
support of the US-CIA. Iraq (with minor support from the US-CIA) changed its government
from a military dictatorship supported by communists, to a Baath party dictatorship (Table 1).
Iraq invaded Iran. The U.S. sold arms to Iran in the Iran-Contra program, and provided limited
support to Iraq in its war with Iran. The other Gulf states continued as oil exporters under
independent monarchies dominated by leading families, without major civil disturbances.
The severe defect in this approach was made evident by Iraq. As we saw above (Table
9), Iraq sought control of Persian Gulf oil. It saw a $60 trillion prize, and fought to seize it
through war. The Iraq-Iran war dead are thought to be one million; Iraq’s invasion of Kuwait
and the first Gulf War to remove Iraq from Kuwait added perhaps another 100,000 dead. All
together, the first two Iraqi wars killed a million combatants and civilians, more or less.
National borders and world oil markets remained essentially unchanged.
Any global policy which leaves Persian Gulf nations undefended invites future
aggression from within or without the region, with the goal of that aggression to seize and hold
oil wealth. Of course aggression by Iraq is not today a threat to global stability. But the prize
remains, and the nuclear and conventional weaponry in the region continue to expand.
Those future aggressions are not visible today. Would a regional power (Turkey, Israel,
Pakistan, India?) seek to appropriate a share of petroleum wealth? Could Russia revive its old
goals of power and influence in Iran and Iraq? Is it possible that at some future date one or more
Western nations could make an effort to secure a share of the Gulf’s oil? Another of the Gulf
states?
If the Persian Gulf were to experience a return to the international laissez faire conditions
of 1973-1990, the only certainty is that new efforts will be made to lay hold of the oil. These
29
new efforts would involve the increasingly destructive power of conventional weaponry, and a
possibility of use of the growing arsenal of nuclear weapons.
This, then, is the powerful force which leads to the need for a Persian Gulf security
framework. Consideration of equity and practicality leads to several desirable characteristics of
a security system:
1. Stable oil production and the continuation of a price range mutually acceptable to
OECD consumers and Gulf exporters.
2. A level of revenues sufficient for Persian Gulf governments.
3. Sufficient military power to deter wars of expropriation of Gulf oil.
4. Political or military mechanisms to reduce the growing nuclear threat in the region.
5. Institutional protection against control of oil by the providers of military security.
6. Governments in the Gulf which are supported by their citizens.
B. An American Security Framework
Can the United States provide the necessary security? The United States has significant
assets which support an affirmative position on the issue. Most importantly, the U.S. has
demonstrated military strength which is clearly adequate to deter or defeat any Persian Gulf
nation or regional power which might consider the pursuit of Gulf oil.
On two other conditions, an American framework would be satisfactory for the
foreseeable future. The target price range with stable world supply is continuing as the
occupation of Iraq evolves. In addition, revenues to Persian Gulf governments continue at levels
acceptable to them.
The implications of the other three conditions are less supportive of a unilateral
American security structure. India and Pakistan may feel that with America’s attention focused
on the Persian Gulf, they each might consider expanding their nuclear arsenals without
provoking a strong negative reaction from the U.S. For Iran, the presence of American armed
forces on 10 of its borders is of strong concern. The acquisition of nuclear weapons will appeal
to some in Iran’s leadership as a means to deter possible U.S. invasion.
For Russia, China, and perhaps France, the maintenance or expansion of nuclear weapons
capability will seem a potential counterweight to growing American power. Overall, an
American security framework in the Persian Gulf is likely to expand rather than reduce nuclear
30
weapons capabilities, regionally and globally.
The implications of the fifth condition – protection against control of Persian Gulf oil by
the providers of military security – are perhaps impossible to evaluate today. The next few
months of the American occupation will give some insight into future management of Iraqi oil
by the U.S.
The last condition of popular support for Persian Gulf governments is particularly
challenging. If the American goal is the protection of stable global oil markets at reasonable
prices, then there is logical motivation to endeavor to encourage the democratization of
governments in the Gulf. Non-economic goals may constitute a second motivation which leads
the U.S. on a quest for democratization throughout the region.
A still different outcome might be that democracy and elections in some Gulf countries
could bring to power governments fundamentally opposed to the U.S. As outlined above, Al
Qaeda’s political support is based upon its fervent opposition to Gulf monarchies, American
influence, and secularism. An American security system linked to a continuation of the
monarchies would seem to accelerate popular support for Al Qaeda-type policies and actions.
C. An International Security Framework
An international approach would have some potential advantages. Given the success to
date with the current price range system (see Section II above), an international approach ought
to be able to manage stable oil production and prices, and sufficient revenues for Gulf
governments. With participation from the U.S. and others, it would be able to deter wars of
appropriation of Gulf oil. As an international group, it would be well placed to forestall control
of the region’s oil by security providers in the international organization. If an international
framework is satisfactory on these points, then the motivation for nuclear weapons in the region
is reduced.
The last requirement seems most problematic: how would an international organization
lead to increased democratization and governments which have a greater degree of popular
support by their citizens? Would more democratic governments and elections need to be
imposed upon the region? Would this, in turn, lead to greatly reduced incentives for Al Qaeda-
type organizations? Or would the opposite occur with greater public participation, would there
be a growth in hostility towards the U.S. and increased terrorism?

31
The elephant in this concept, certainly, is the nonexistence of any organization of the type
hypothesized. Any important and successful international structure must have the U.S. playing a
leadership role, and that generality applies here. American participation must be significant both
militarily and organizationally. The military dimension is perceivable as something roughly
patterned after NATO. As with NATO, a Persian Gulf Organization would include major
military powers, and also nations that see themselves as in need of military protection. As with
NATO, the organization would incorporate former enemies. Just as NATO now includes Poland
and Germany, Greece and Turkey, a Gulf organization would incorporate Iraq, Kuwait, Iran,
Saudi Arabia, and the other Gulf states.
There are also partial parallels here with the World Trade Organization, the European
Union, OPEC, the 1991 Persian Gulf Coalition, the Gulf Cooperation Council, and the UN
Security Council as well as with NATO.
Use “PGO” to suggest a Persian Gulf Organization or Authority. Potential participants
would be the 8 Persian Gulf States, the U.S., the U.K., China, France, Japan, Germany, Russia,
and perhaps members from Africa, Latin America, and the Middle East. It might be financed by
a tax on oil exported from the Gulf. Such revenues (both tax revenue and revenue from export
oil sales) could be allocated to Gulf states, and also utilized to support the military forces
employed to protect and stabilize the Persian Gulf.
Consider a current price of $30 per barrel at a tanker loading facility in the Gulf. This is
at the high end of the existing price range framework. The revenues might be distributed as
suggested in Table 14, with a total illustrative figure of $180 billion as annual revenue associated
with the current Gulf export level of 6 billion barrels. The $30 figure could be seen as the
current (June 2003) $25 price for Saudi oil, plus an additional $5 tax.
The first item in part B of the Table provides for the costs of production, development,
risk, and profit. The $5 figure is higher than the $3 estimate in Table 12. Iran may be at or
above a $5 cost; Iraq and Saudi Arabia may be lower. General inflation will work to increase
this amount, while continuing technological innovation will work to lower production cost.
Table 14. Hypothetical Illustration of Allocation of Persian Gulf Revenue by
a Persian Gulf Organization or Authority.

32
A. Assume: 6 Billion Barrels Exported @ $30 per Barrel. Revenue Equals
$180 Billion Annually.
B. Illustration of Revenue Allocation
#1. $30 B to oil production, development, profit ($5 per barrel).
#2. $90 B as revenue to Persian Gulf States ($15 per barrel).
#3. $60 B as support for military expense ($10 per barrel).

33
Ultimately, in some future decade, depletion will cause an increase in cost. But now and for the
next few years $5 is a reasonable approximation of cost (including a return to capital) for the
region.
Second: $90 billion as revenue to Persian Gulf states. This may be equal to or slightly
less than existing regional expenditures on civilian government functions. One consequence of
an effective PGO-type entity would be major reductions on military costs incurred by Gulf
states, establishing a much higher proportion of petroleum revenues available for nonmilitary
and security purposes.
Third: $60 billion available each year as financial support to the providers of Persian
Gulf security. This ought to approximate U.S. annual military expenditures for Persian Gulf
security during the non-war years 1992 to September 2001.19
The current unilateral U.S. security system inherently manifests what economists call the
“Free Rider Problem”20. The major consumers of Persian Gulf oil are Europe, Japan, South
Korea, Taiwan, and the Philippines (Table B2 in Appendix B). As long as the U.S. (and to a
lesser extent the U.K.) manage security, there is no incentive for these countries that consume
Persian Gulf oil to participate financially in security measures.
Similarly, the political and human cost is borne by the U.S. and Persian Gulf states, and
not those regions that actually depend upon and use Persian Gulf oil.
The unilateral approach suffers from a serious political defect. The U.S. will experience
considerable difficulty in attaining legitimacy as the sole governing authority in Iraq and
possibly in other Gulf states. In contrast, a multilateral system would have lesser problems with
legitimacy, internationally and in the Gulf region itself.
The conditions outlined on page 29 seem to be best met by a multilateral approach.
However, any multilateral or international security structure in the Persian Gulf must have the
U.S. as a leader and supporter, militarily and politically. The international political difficulties
surrounding the issues of Iraqi weapons, inspection, disarmament, and occupation all indicate the
problems to be encountered in establishing an international system. There is no certainty that an 19 In 1992, Darwin Hall estimated the incremental cost of Persian Gulf military expenditures for the U.S. to be $10 per barrel (adjusted to 1995 prices); D. Hall, November 1992 Energy Policy, 20(11) 1089-1096. In the mid ‘90s, Michael O’Hanlon estimated the military cost to the U.S. for Persian Gulf security to be $50 billion annually (New York Times December 30,1995, and September 18, 1996). Also see Chapman and Khanna 2000, page 7.
20 A point suggested by Richard Fullerton.
34
international structure is feasible with U.S. leadership; it cannot be considered without U.S.
leadership.
35
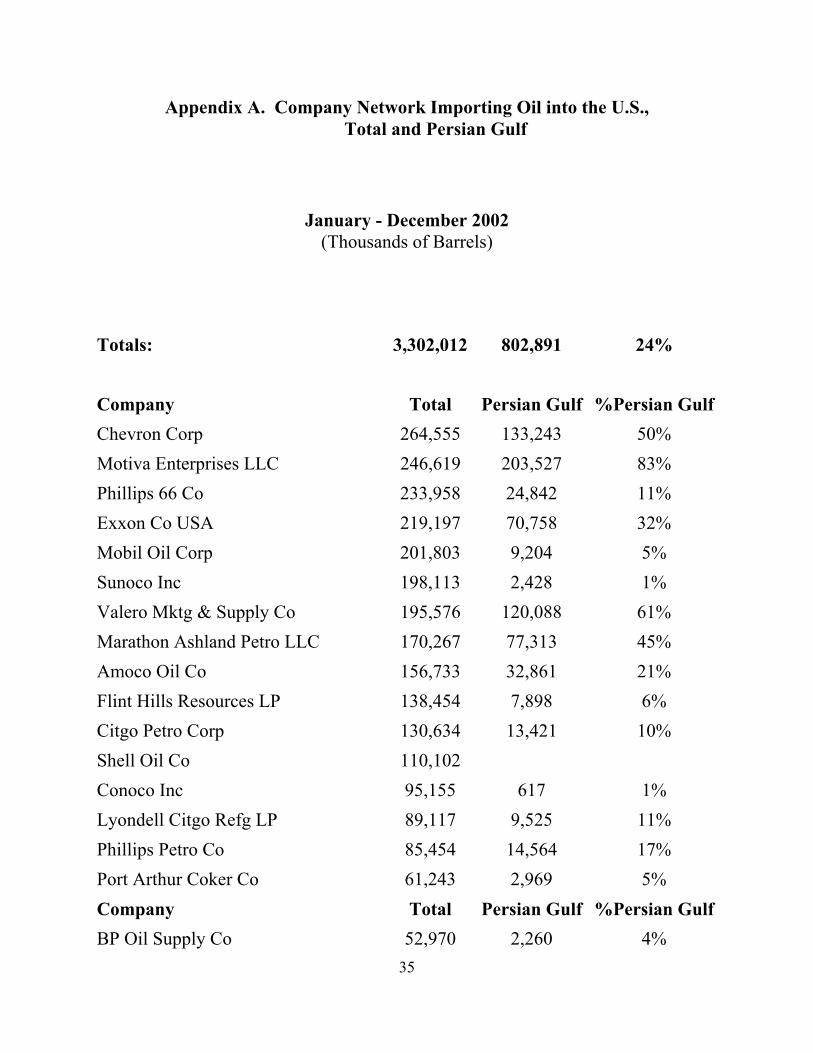
Appendix A. Company Network Importing Oil into the U.S., Total and Persian Gulf
January - December 2002 (Thousands of Barrels)
Totals: 3,302,012 802,891 24% Company Total Persian Gulf %Persian Gulf Chevron Corp 264,555 133,243 50% Motiva Enterprises LLC 246,619 203,527 83% Phillips 66 Co 233,958 24,842 11% Exxon Co USA 219,197 70,758 32% Mobil Oil Corp 201,803 9,204 5% Sunoco Inc 198,113 2,428 1% Valero Mktg & Supply Co 195,576 120,088 61% Marathon Ashland Petro LLC 170,267 77,313 45% Amoco Oil Co 156,733 32,861 21% Flint Hills Resources LP 138,454 7,898 6% Citgo Petro Corp 130,634 13,421 10% Shell Oil Co 110,102 Conoco Inc 95,155 617 1% Lyondell Citgo Refg LP 89,117 9,525 11% Phillips Petro Co 85,454 14,564 17% Port Arthur Coker Co 61,243 2,969 5% Company Total Persian Gulf %Persian Gulf BP Oil Supply Co 52,970 2,260 4%

36
Atofina Petrochemicals Inc 46,018 19,009 41% The Premcor Refg Group Inc 44,039 6,313 14% Orion Rfng Corp 44,007 1,447 3% El Paso Merchant Energy-Petro 42,490 Arco Prod Co 38,080 6,095 16% Murphy Oil USA Inc 36,810 7,012 19% Chalmette Refg LLC 32,387 Tesoro Petro Corp 30,311 Citgo Asph Refg Co 23,978 PDV Midwest Refg LLC 23,794 517 2% Equiva Tradg Co 21,383 United Refg Co 21,286 Tesoro Hawaii Corp 19,233 Williams Refg & Mktg LLC 18,628 Cenex Harvest States Coop 16,827 Shell Chem LP 16,766 Diamond Shamrock Refg & Mktg 15,522 2,415 16% Lion Oil Co 12,508 12,508 100% Shell US Tradg Co 12,161 Crown Central Petro Corp 11,774 Ultramar Inc 11,249 632 6%

37
Company Total Persian Gulf %Persian Gulf Hunt Crude Oil Supply Co 10,627 5,370 51% Sinclair Oil Corp 10,460 TPI Petro Inc 9,805 7,515 77% Giant Yorktown Inc 9,007 Fina Oil & Chem Co 8,882 4,039 45% Frontier Oil & Refg 8,438 Ergon Refg Inc 6,638 Strategic Petro Reserve 5,767 Koch Supply & Trading Co 5,656 1,039 18% Trigeant Ltd 5,421 Vitol S A Inc 4,667 Shell Oil Prodts US 4,499 Bayoil USA Inc 3,462 3,462 100% Edgington Oil Co 3,235 Farmland Indus Inc Cra 2,553 Montana Refg Co 2,183 Nexen Mktg 1,903 Flying Petro Inc 1,653 Statoil Mktg & Trdg (US) Inc 1,096 Morgan Stanley Capital Grp Inc 1,074 Husky Trdg Co 1,004 NCRA 971 Atlantic Trdg & Mktg Inc 948

38
Company Total Persian Gulf %Persian Gulf Equilon Enterprises LLC 882 Cannat Energy Inc 664 Hess Energy Trading Co LLC 548 Marquest Ltd Ptnrshp 406 Equistar Chemicals LP 252 Texaco Refg & Mktg Inc 110
*Notes: Several factors influence the source of a company's crude oil imports. For example, a company like Motiva, which is partly owned by Saudi Refining Inc., would be expected to import a large percentage from the Persian Gulf, while Citgo Petroleum Corporation, which is owned by the Venezuelan state oil company, would not be expected to import a large percentage from the Persian Gulf, since most of their imports likely come from Venezuela. In addition, other factors that influence a specific company's sources of crude oil imports would include the characteristics of various crude oils as well as a company's economic needs. While, in general, crude oil is fungible, i.e., one crude oil can be substituted for another, many refineries are optimized by refining crude oil with specific qualities (e.g., the API gravity, the amount of sulfur in the crude oil, etc.). Also, depending on the global crude oil market condition at the time, the price difference between heavy and light crude oils varies, thus changing the economic dynamics for different refineries. Therefore, many factors determine the source of a company's crude oil imports. The data are based upon operating companies; consequently Chevron and Texaco are separate entries; and so are Exxon and Mobil; and BP, Amoco, and Arco.
Source: Reproduced from Energy Information Association, Crude Oil Imports From the Persian Gulf 2002; www.eia.doe.gov/pub/oil_gas/petroleum/data_publications/company_level_imports/current/summary2002.html>. Accessed May 3, 2003.
39
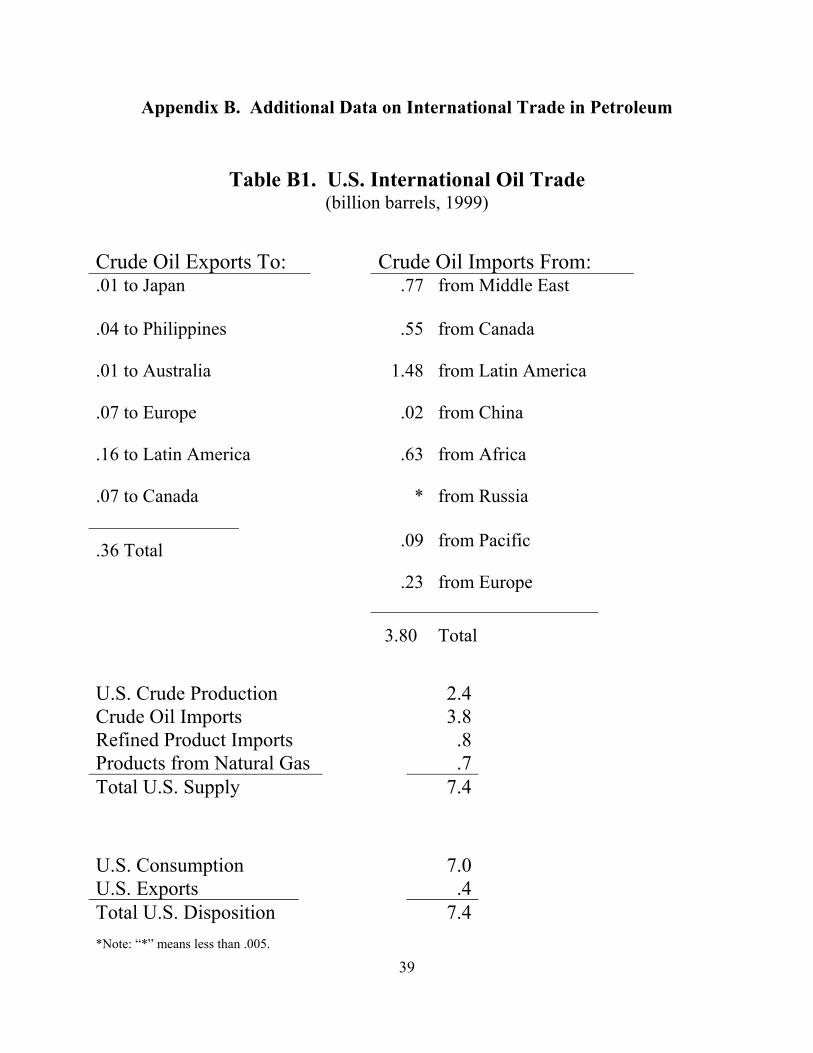
Appendix B. Additional Data on International Trade in Petroleum
Table B1. U.S. International Oil Trade
(billion barrels, 1999)
Crude Oil Exports To:
Crude Oil Imports From: .01 to Japan .77 from Middle East
.04 to Philippines .55 from Canada
.01 to Australia 1.48 from Latin America
.07 to Europe .02 from China
.16 to Latin America .63 from Africa
.07 to Canada * from Russia
.36 Total .09 from Pacific
.23 from Europe
3.80 Total
U.S. Crude Production 2.4 Crude Oil Imports 3.8 Refined Product Imports .8 Products from Natural Gas .7 Total U.S. Supply 7.4
U.S. Consumption 7.0 U.S. Exports .4 Total U.S. Disposition 7.4 *Note: “*” means less than .005.

40
Table B2. Middle East Exports
To --- Area Amount U.S .77
Europe 1.69
Japan 1.54
Philippines/Taiwan/Asia 2.27
Australia .06
Latin America .21
Africa .24
Other (Canada, other) .05
Total 6.83
*Note: Persian Gulf production is 85.5% of Middle East production. Data for 2001, from MER January 2003.
41
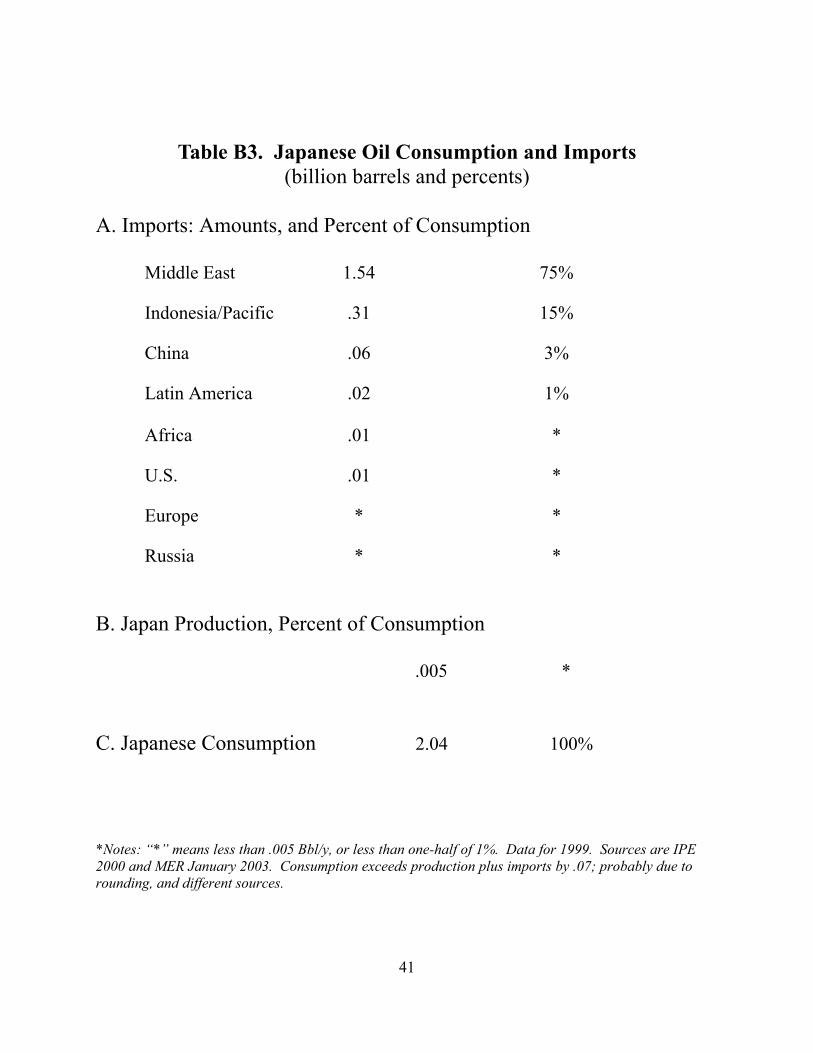
Table B3. Japanese Oil Consumption and Imports (billion barrels and percents)
A. Imports: Amounts, and Percent of Consumption
Middle East 1.54 75%
Indonesia/Pacific .31 15%
China .06 3%
Latin America .02 1%
Africa .01 *
U.S. .01 *
Europe * *
Russia * *
B. Japan Production, Percent of Consumption
.005 * C. Japanese Consumption 2.04 100%
*Notes: “*” means less than .005 Bbl/y, or less than one-half of 1%. Data for 1999. Sources are IPE 2000 and MER January 2003. Consumption exceeds production plus imports by .07; probably due to rounding, and different sources.

42
Table B4. Western Europe: Trade in Oil (billion barrels)
EXPORTS TO: IMPORTS FROM:
U.S. .23 Middle East 1.69
Canada .13 Africa 1.01
Russia .08 Russia .69
Africa .06 Latin America .17
Japan * U.S. .07
Philippines/Asia .02 Canada *
Latin America .02 Total 3.63
Total .53
CONSUMPTION: 5.54 PRODUCTION: 2.31
Total Consumption and Exports:
6.07 Total Production and Imports:
5.94

43
Table B5. Global Oil Trade, 1999
(billion barrels)
Produced and Consumed in Country of Origin: 10 42%
Traded in World Markets: 14 58%
Total Production/ Consumption: 24 100%
Sources: IPE 2000, MER January 2003

44
Table B6. World Leading Oil Producers
Country Rank Bbl/y Saudi Arabia 1 2.8 Russia 2 2.7 U.S. 3 2.1
China 4 1.2
Mexico 5 1.2 Norway 6 1.1 Venezuela 7 .9 UK 8 .8 UAE 9 .7 Nigeria 10 .7 Kuwait 11 .7
Indonesia 12 .4
Total 15.3
*Note: Neutral zone production split 50-50 between Kuwait and Saudi Arabia. These are countries with at least one million bl/d production in 2002. Total World Production was 24.4 Bbl.
45
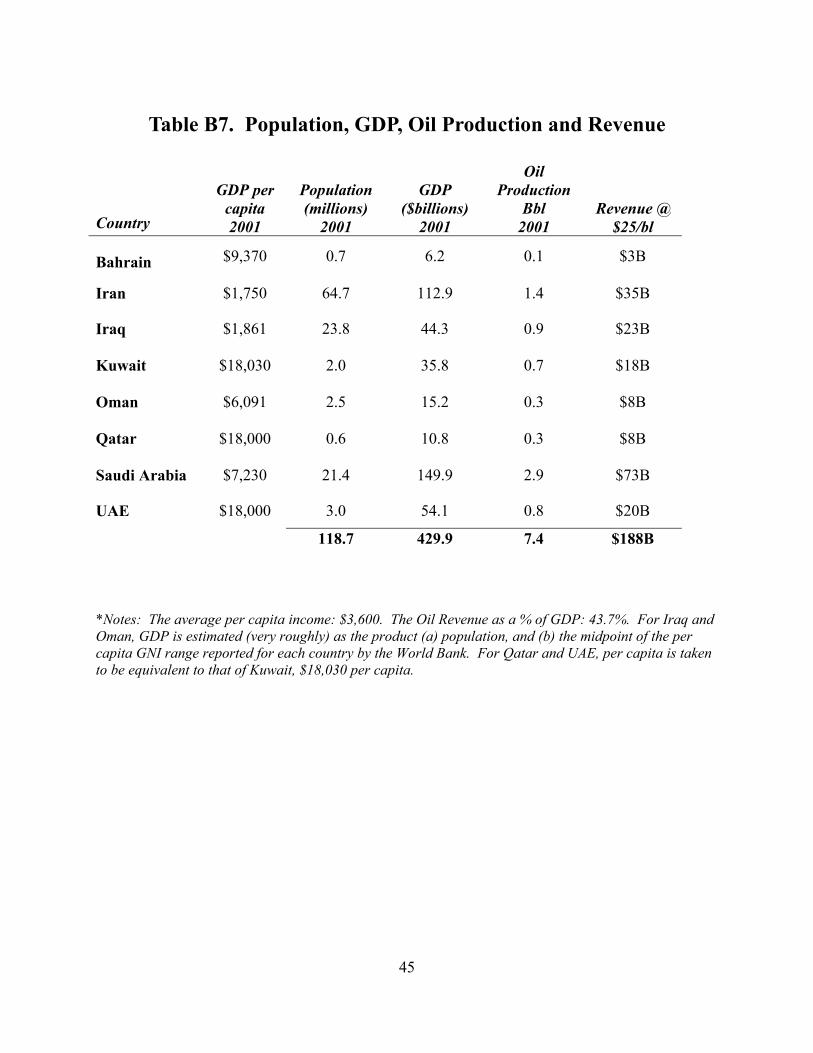
Table B7. Population, GDP, Oil Production and Revenue
Country
GDP per capita 2001
Population (millions)
2001
GDP ($billions)
2001
Oil Production
Bbl 2001
Revenue @ $25/bl
Bahrain $9,370 0.7 6.2 0.1 $3B
Iran $1,750 64.7 112.9 1.4 $35B
Iraq $1,861 23.8 44.3 0.9 $23B
Kuwait $18,030 2.0 35.8 0.7 $18B
Oman $6,091 2.5 15.2 0.3 $8B
Qatar $18,000 0.6 10.8 0.3 $8B
Saudi Arabia $7,230 21.4 149.9 2.9 $73B
UAE $18,000 3.0 54.1 0.8 $20B
118.7 429.9 7.4 $188B
*Notes: The average per capita income: $3,600. The Oil Revenue as a % of GDP: 43.7%. For Iraq and Oman, GDP is estimated (very roughly) as the product (a) population, and (b) the midpoint of the per capita GNI range reported for each country by the World Bank. For Qatar and UAE, per capita is taken to be equivalent to that of Kuwait, $18,030 per capita.