ttip: european disintegration, unemployment and instability
TRANSCRIPT
GLOBAL DEVELOPMENT AND ENVIRONMENT INSTITUTE
WORKING PAPER NO. 14-03
The Trans-Atlantic Trade and Investment Partnership:
European Disintegration, Unemployment and Instability
Jeronim Capaldo
October 2014
Tufts University
Medford MA 02155, USA
http://ase.tufts.edu/gdae
GDAE Working Paper No. 14-03: TTIP: European Disintegration, Unemployment and Instability
1
Abstract
According to its proponents, the Trans-Atlantic Trade and Investment Partnership will
stimulate growth in Europe and in the US. Projections endorsed by the European
Commission point to positive, although negligible, gains in terms of GDP and personal
incomes. In a paradox, these projections also show that any gains in Trans-Atlantic trade
would happen at the expense of intra-EU trade reversing the process of European
economic integration.
Furthermore, recent literature has pointed out several problems in the most influential
assessment of the TTIP’s effects. Projections by different institutions have been shown to
rely on the same Computable General Equilibrium model that has proven inadequate as a
tool for trade policy analysis.
In this paper we assess the effects of TTIP using the United Nations Global Policy
Model, which incorporates more sensible assumptions on macroeconomic adjustment,
employment dynamics, and global trade. We project that TTIP will lead to a contraction
of GDP, personal incomes and employment. We also project an increase in financial
instability and a continuing downward trend in the labor share of GDP.
Evaluated with the United Nations model, TTIP appears to favor economic dis-
integration, rather than integration, in Europe. At a minimum, this shows that official
studies do not offer a solid basis for an informed decision on TTIP.
Acknowledgments
I am grateful to Alex Izurieta for his help in developing the key ideas behind this study.
Thanks also to Ben Beachy, Kevin Gallagher, Todd Tucker, and Tim Wise for their
insights and comments, and to Richard Kozul-Wright and Tom Kruse for continuing
support.
GDAE Working Paper No. 14-03: TTIP: European Disintegration, Unemployment and Instability
2
Executive Summary
The European Union and the United States are currently negotiating the Trans-Atlantic
Trade and Investment Partnership (TTIP), a major trade agreement intended to further
integrate their economies.
As is common for trade agreements, TTIP negotiations have been accompanied by a
series of econometric studies providing medium-term projections of the agreement’s
economic effects. In the EU, advocates have pointed to four main studies mostly
projecting small net benefits for all countries involved and a gradual substitution of intra-
EU trade with Trans-Atlantic trade.
Recent literature has shown that the main studies of TTIP are not a good basis for policy
decision as they rely heavily on unsuitable economic models.
We offer an assessment of TTIP based on a different model and more plausible
assumptions on economic adjustment and policy trends. Using the United Nations Global
Policy Model we simulate the impact of TTIP on the global economy in a context of
protracted austerity and low growth especially in the EU and US.
Our results differ dramatically from existing assessments. For Europe we find that:
TTIP would lead to losses in terms of net exports after a decade, compared to the
baseline “no-TTIP” scenario. Northern European Economies would suffer the largest
losses (2.07% of GDP) followed by France (1.9%), Germany (1.14%) and United
Kingdom (0.95%).
TTIP would lead to net losses in terms of GDP. Consistent with figures for net
exports, Northern European Economies would suffer the largest GDP reduction (-
0.50%) followed by France (-0.48%) and Germany (-0.29%).
TTIP would lead to a loss of labor income. France would be the worst hit with a loss
of 5,500 Euros per worker, followed by Northern European Countries (-4,800 Euros
per worker), United Kingdom (-4,200 Euros per worker) and Germany (-3,400 Euros
per worker).
TTIP would lead to job losses. We calculate that approximately 600,000 jobs would
be lost in the EU. Northern European countries would be the most affected (-223,000
jobs), followed by Germany (-134,000 jobs), France (- 130,000 jobs) and Southern
European countries (-90,000).
TTIP would lead to a reduction of the labor share (the share of total income accruing
to workers), reinforcing a trend that has contributed to the current stagnation. The
flipside of its projected decrease is an increase in the share of profits and rents,
indicating that proportionally there would be a transfer of income from labor to
capital. The largest transfers will take place in UK (7% of GDP transferred from labor
to profit income), France (8%), Germany and Northern Europe (4%).
TTIP would lead to a loss of government revenue. The surplus of indirect taxes (such
as sales taxes or value-added taxes) over subsidies will decrease in all EU countries,
with France suffering the largest loss (0.64% of GDP). Government deficits would
GDAE Working Paper No. 14-03: TTIP: European Disintegration, Unemployment and Instability
3
also increase as a percentage of GDP in every EU country, pushing public finances
closer or beyond the Maastricht limits.
TTIP would lead to higher financial instability and accumulation of imbalances. With
export revenues, wage shares and government revenues decreasing, demand would
have to be sustained by profits and investment. But with flagging consumption
growth, profits cannot be expected to come from growing sales. A more realistic
assumption is that profits and investment (mostly in financial assets) will be sustained
by growing asset prices. The potential for macroeconomic instability of this growth
strategy is well known after the recent financial crisis.
Our projections point to bleak prospects for EU policymakers. Faced with higher
vulnerability to any crises coming from the US and unable to coordinate a fiscal
expansion, they would be left with few options to stimulate the economy: favoring an
increase of private lending, with the risk of fueling financial imbalances, seeking
competitive devaluations or a combination of the two.
We draw two general conclusions. First, as suggested in recent literature, existing
assessments of TTIP do not offer a suitable basis for important trade reforms. Indeed,
when a more realistic model is used, results change dramatically. Second, seeking a
higher trade volume is not a sustainable growth strategy for the EU. In the current context
of austerity, high unemployment and low growth, increasing the pressure on labor
incomes would further harm economic activity. Our results suggest that any viable
strategy to rekindle economic growth in Europe would have to build on a strong policy
effort in support of labor incomes.
GDAE Working Paper No. 14-03: TTIP: European Disintegration, Unemployment and Instability
4
The Trans-Atlantic Trade and Investment Partnership:
European Disintegration, Unemployment and Instability
Jeronim Capaldo1
October 2014
1. Introduction
The European Union and the United States are currently negotiating the Trans-Atlantic
Trade and Investment Partnership (TTIP), a major trade agreement intended to further
integrate their economies. In today’s low-tariff reality, TTIP focuses on removing non-
tariff trade barriers between countries, such as differing standards set in the EU and in the
US for given consumer goods and services2. The underlying logic is the same as in
traditional liberalizations: reducing the costs of trade – whether eliminating tariffs or
other impediments – is supposed to lead to a higher trade volume and overall economic
benefits. Unfortunately, experience has shown that this appealing reasoning is often
misleading.
As is common for trade agreements, TTIP negotiations have been accompanied by a
series of econometric studies projecting net economic gains for all countries involved. In
the EU, advocates have pointed to four main studies mostly projecting small and deferred
net benefits alongside a gradual substitution of intra-EU trade with Trans-Atlantic trade.
This leads the European Commission, TTIP’s main advocate in Europe, into a paradox:
its proposed policy reform would favor economic dis-integration in the EU.
TTIP might also lead to other serious consequences for the EU and its members. Recent
literature has shown that the main studies of TTIP do not provide a reliable basis for
policy decisions as they rely heavily on an unsuitable economic model.
In this paper we offer an assessment of TTIP based on a different model and more
plausible assumptions on economic adjustment and policy trends. Using the United
Nations Global Policy Model we simulate the impact of TTIP on the global economy in a
context of protracted austerity and low growth especially in the EU and US. Specifically,
we do not challenge existing projections of total trade expansion but we propose a
different assessment of its impact on the economy.
We find that TTIP would lead to net losses in terms of GDP, personal incomes and
employment in the EU. In particular, we project that labor incomes will decrease between
165 Euros and 5,000 Euros per worker depending on the country. We also project a loss
of approximately 600,000 jobs, a continuing downward trend of the labor share and
potentially destabilizing dynamics in asset prices.
1 Email: [email protected]
2 The agreement’s scope is defined in general terms in European Commission (2013). In official documents
non-trade barriers are also called “technical”.

GDAE Working Paper No. 14-03: TTIP: European Disintegration, Unemployment and Instability
5
Our projections point to bleak prospects for EU policymakers. Faced with higher
vulnerability to any crises coming from the US and unable to coordinate a fiscal
expansion, they would be left with few options to stimulate the economy: favoring an
increase of private lending, with the risk of fueling financial imbalances, seeking
competitive devaluations or a combination of the two.
We draw two general conclusions. First, as suggested in recent literature, existing
assessments of TTIP do not offer a suitable basis for important trade reforms. Indeed,
when a well-reputed but different model is used, results change dramatically. Second,
seeking a higher trade volume is not a sustainable growth strategy for the EU. In the
current context of austerity, high unemployment and low growth, requiring that
economies become more competitive would further harm economic activity. Our results
suggest that any viable strategy to rekindle economic growth in Europe would have to
build on a strong policy effort in support of labor incomes.
2. Existing Assessments of TTIP
Most assessments of TTIP predict gains in terms of trade and GDP for both the EU and
US. Some also predict gains for non-TTIP countries, suggesting that the agreement would
create no losers in the global economy. If this were the case, TTIP would be the key to a
more efficient allocation of global resources, with some countries achieving higher
welfare and all others enjoying at least the same welfare as before.
Unfortunately, as Raza and colleagues (2014) have shown, these desirable results rely on
multiple unrealistic assumptions and on methods that have proven inadequate to assess
the effects of trade reform. Furthermore, once the calculations are reviewed, it appears
that several of these studies share the same questionable economic model and database.
The convergence of their results is, therefore, not surprising and should not be taken as
providing independent confirmation of their predictions.
2.1. Methodological Problems
Quantitative arguments in favor of TTIP come mostly from four widely cited
econometric studies: Ecorys (2009), CEPR (2013), CEPII (2013) and Bertelsmann
Stiftung (2013)3. CEPR has been very influential: the European Commission has relied
on it as the main analysis of the economic effects of TTIP4 going as far as presenting
some of its findings as facts5. However, the EC’s reference to CEPR as an “independent
report” seems misleading since the study’s cover page indicates the EC as the client for
whom the study has been produced.. Ecorys was also commissioned by the EC as part of
a wider project encompassing economic, environmental and social assessments (Ecorys,
2014).
3 For simplicity, in the remainder of the paper all references to these studies are indicated as Ecorys, CEPR,
CEPII and Bertelsmann respectively. 4 CEPR figures prominently on the EC’s webpage on TTIP (ec.europa.eu/trade/policy/in-focus/ttip/about-
ttip, consulted on October 13, 2014). The EC also published a guide to the study’s results (EC, 2013). 5 See EC (2014), p. 2.
GDAE Working Paper No. 14-03: TTIP: European Disintegration, Unemployment and Instability
6
Methodologically, the similarities among the four studies are striking. While all use
World Bank-style Computable General Equilibrium (CGE) models, the first two studies
also use exactly the same CGE. The specific CGE they use is called the Global Trade
Analysis Project (GTAP), developed by researchers at Purdue University6. All but
Bertelsmann use a version of the same database (again from GTAP).7
The limitations of CGE models as tools for assessments of trade reforms emerged during
the liberalizations of the 1980s and 1990s8. The main problem with these models is their
assumption on the process leading to a new macroeconomic equilibrium after trade is
liberalized. Typically, as tariffs or trade costs are cut and all sectors become exposed to
stronger international competition, these models assume that the more competitive
sectors of the economy will absorb all the resources, including labor, released by the
shrinking sectors (those that lose business to international competitors). However, for this
to happen, the competitive sectors must expand enough to actually need all those
resources. Moreover, these resources are assumed to lack sector-specific features, so they
can be re-employed in a different sector. Under these assumptions, an assembly-line
employee of an automobile factory can instantly take up a new job at a software company
as long as her salary is low enough. Supposedly, this process is driven by speedy price
changes that allow an appropriate decrease of labor costs and, consequently, the
necessary expansion of the competitive sectors.
In practice, however, this “full employment” mechanism has rarely operated. In many
cases, less competitive sectors have contracted quickly while more competitive ones have
expanded slowly or insufficiently, leaving large numbers of workers unemployed9. One
need only look at the experience of Europe in the last decade to see that full employment
does not re-establish itself even if job seekers are willing to work informally and at
relatively low pay.
A critical point is that the distribution of gains and losses is rarely uniform within
economies. If workers in competitive sectors may benefit from higher salaries, while
those in shrinking sectors loose, the economy as a whole may be worse off. This is
because in some countries domestic demand is mostly supported by the incomes earned
in in traditional occupations. In practice, aside from their high social costs, these
transitions have led to a drop of domestic demand that CGE-based calculations have
often overlooked.
Moreover, most CGEs rely on misleading assumptions on the pattern of international
trade, imposing a fixed structure on the market share that each country has in its export
markets10
, and on a static analysis that does not explain how economies reach a new
equilibrium. For example, when Country A expands trade with Country B, the rest of the
6 For a history of GTAT, see https://www.gtap.agecon.purdue.edu/about/history.asp
7 For an explanation of World Bank CGEs in historical perspective, see Taylor (2011).
8 See Taylor and Von Arnim (2006), Ackermann and Gallagher (2004, 2008), Stanford (2003), Stiglitz and
Charlton (2004), Gunter et al. (2005). 9 See Polaski (2006) and references therein.
10 See the analysis of Armington elasticities (i.e. how trade volume patterns respond to price changes) in
Taylor and von Arnim (2006) and Ackerman and Gallagher (2008).
GDAE Working Paper No. 14-03: TTIP: European Disintegration, Unemployment and Instability
7
world's economies do not simply stand still. Countries C, D and E will find that they are
more or less competitive in these markets as a result of the A-and-B trade changes. This
effect is known as "trade diversion",11
and has been a significant by-product of recent
trade integration initiatives.12
Finally, the strategy chosen to simulate a “TTIP future” has a strong impact on the
results. Ecorys assumes that so-called "Non-Trade Barriers" impose a given cost on trade
and that TTIP can remove up to one half of them. CEPR and CEPII borrow this approach,
but assume a lower share13
. These barriers can include what other stakeholders refer to as
consumer and environmental regulations. Phasing them out may be difficult and could
impose important adjustment costs not captured by the models.
2.2. Empirical Results
All four assessments postulate multiple scenarios based on alternative assumptions on the
share of removable non-tariff barriers. In all cases, cuts of at least 25 percent are required
to generate visible gains. Results refer to the end of the simulation period in 2025 or 2027
depending on the study.
2.2.1. Trade
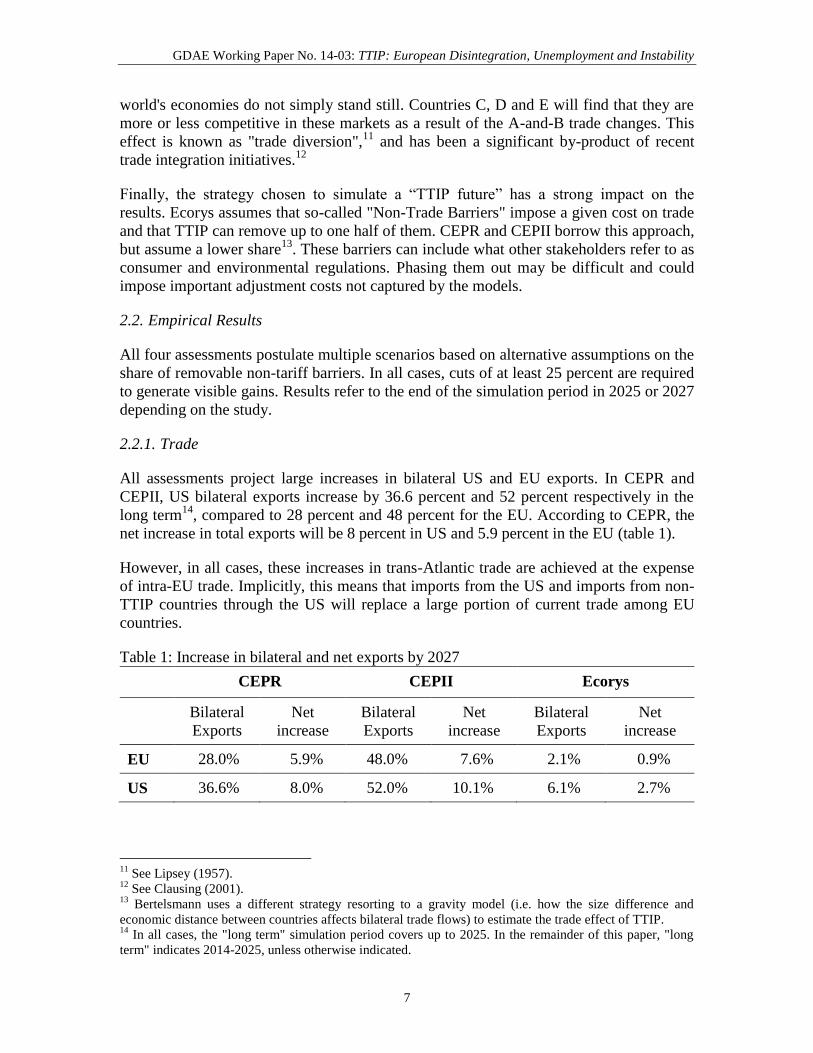
All assessments project large increases in bilateral US and EU exports. In CEPR and
CEPII, US bilateral exports increase by 36.6 percent and 52 percent respectively in the
long term14
, compared to 28 percent and 48 percent for the EU. According to CEPR, the
net increase in total exports will be 8 percent in US and 5.9 percent in the EU (table 1).
However, in all cases, these increases in trans-Atlantic trade are achieved at the expense
of intra-EU trade. Implicitly, this means that imports from the US and imports from non-
TTIP countries through the US will replace a large portion of current trade among EU
countries.
Table 1: Increase in bilateral and net exports by 2027
CEPR CEPII Ecorys
Bilateral
Exports
Net
increase
Bilateral
Exports
Net
increase
Bilateral
Exports
Net
increase
EU 28.0% 5.9% 48.0% 7.6% 2.1% 0.9%
US 36.6% 8.0% 52.0% 10.1% 6.1% 2.7%
11
See Lipsey (1957). 12
See Clausing (2001). 13
Bertelsmann uses a different strategy resorting to a gravity model (i.e. how the size difference and
economic distance between countries affects bilateral trade flows) to estimate the trade effect of TTIP. 14
In all cases, the "long term" simulation period covers up to 2025. In the remainder of this paper, "long
term" indicates 2014-2025, unless otherwise indicated.
GDAE Working Paper No. 14-03: TTIP: European Disintegration, Unemployment and Instability
8
If these projections were true, higher trans-Atlantic interdependence would heighten the
EU's exposure to fluctuations in US import demand. This is an under-examined
consequence of certain patterns of trade liberalization. Even if higher exports were to
bring higher demand and economic activity (a link that doesn’t always work in practice,
as discussed), more reliance on the US as an export market would also make the EU
vulnerable to macroeconomic conditions in North America.
If Europe could effectively implement countercyclical policies, this greater
interdependence would not necessarily be a problem. However, the EU's current
institutional structure lacks a central fiscal authority while in practice preventing national
governments, through the Maastricht treaty, from implementing any fiscal expansion.15
This constellation of factors indicates that the TTIP might usher in a period of higher
instability in Europe.16
The remaining two studies raise similar concerns. In Bertelsmann, aggregate figures for
bilateral export increase and net increase are not readily available but results exhibit the
same pattern as in other studies. While bilateral exports are predicted to increase by more
than 60 percent for the EU and more than 80 percent for the US, intra-EU exports are
expected to decrease between 25 and 41 percent. This implication raises the same
concerns about vulnerability to US economic shocks as the other studies.
Finally, as noted above, the rest of the world does not stand still when two economies
integrate. Applying Bertelsmann's percentages to recorded trade data with EU exports to
the world as a whole, Raza et al. (2014) calculate that the overall impact of TTIP on EU
global exports, including those to non-TTIP countries, would be negative. Furthermore,
Felbermayr and Larch (2013) find that TTIP will have a negative effect on non-TTIP
countries’ exports, in a pattern observed after other trade agreements17
. In other words,
both exports and imports of non-TTIP countries are projected to decrease, with uncertain
or negative net effects. CEPR and CEPII do not find negative effects on non-TTIP
countries assuming ad hoc effects (spill-overs) that allow exports in the rest of the world
to grow.
2.2.2. GDP and Personal Incomes
Given the small net effects on exports, most assessments predict small increases in TTIP
countries’ GDP (Table 2). In Ecorys, CEPR and CEPII, GDP increases less than 0.5
percent in both the EU and US. This means that, at the end of the simulation period in
2027, GDP would be 0.5 percent higher in a TTIP scenario than the baseline, non-TTIP
scenario, implying negligible effects on annual GDP growth rates.
This is a defining aspect of the results: Ecorys, CEPR and CEPII point to a one-time
increase in the level of GDP, not to an increase in the growth rate of GDP. Furthermore,
this one-time increase is small and projected to occur only over the course of 13 years.
15
Cameron (2012) argues that, even though EU member states favored a strong fiscal response to the crisis,
they were unable to implement one because of coordination difficulties in the EU. 16
On financial contagion within Europe and between US and EU, see Baele (2005). 17
See, for example, Romalis (2007).
GDAE Working Paper No. 14-03: TTIP: European Disintegration, Unemployment and Instability
9
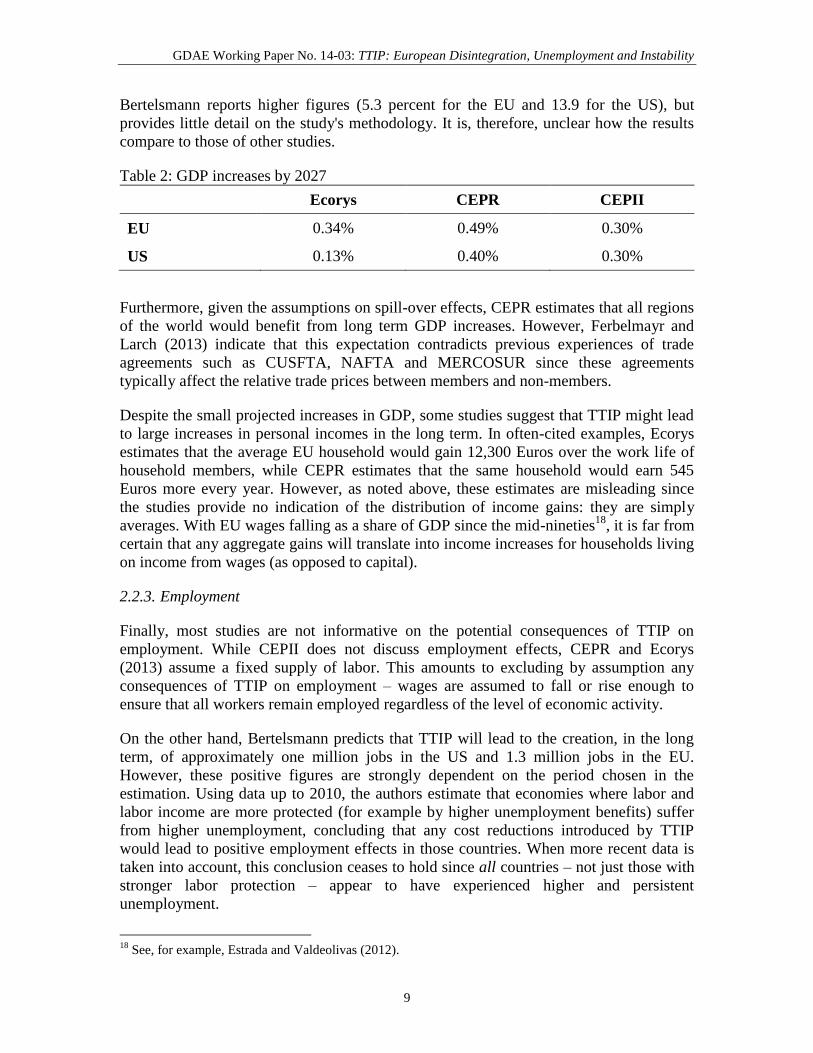
Bertelsmann reports higher figures (5.3 percent for the EU and 13.9 for the US), but
provides little detail on the study's methodology. It is, therefore, unclear how the results
compare to those of other studies.
Table 2: GDP increases by 2027
Ecorys CEPR CEPII
EU 0.34% 0.49% 0.30%
US 0.13% 0.40% 0.30%
Furthermore, given the assumptions on spill-over effects, CEPR estimates that all regions
of the world would benefit from long term GDP increases. However, Ferbelmayr and
Larch (2013) indicate that this expectation contradicts previous experiences of trade
agreements such as CUSFTA, NAFTA and MERCOSUR since these agreements
typically affect the relative trade prices between members and non-members.
Despite the small projected increases in GDP, some studies suggest that TTIP might lead
to large increases in personal incomes in the long term. In often-cited examples, Ecorys
estimates that the average EU household would gain 12,300 Euros over the work life of
household members, while CEPR estimates that the same household would earn 545
Euros more every year. However, as noted above, these estimates are misleading since
the studies provide no indication of the distribution of income gains: they are simply
averages. With EU wages falling as a share of GDP since the mid-nineties18
, it is far from
certain that any aggregate gains will translate into income increases for households living
on income from wages (as opposed to capital).
2.2.3. Employment
Finally, most studies are not informative on the potential consequences of TTIP on
employment. While CEPII does not discuss employment effects, CEPR and Ecorys
(2013) assume a fixed supply of labor. This amounts to excluding by assumption any
consequences of TTIP on employment – wages are assumed to fall or rise enough to
ensure that all workers remain employed regardless of the level of economic activity.
On the other hand, Bertelsmann predicts that TTIP will lead to the creation, in the long
term, of approximately one million jobs in the US and 1.3 million jobs in the EU.
However, these positive figures are strongly dependent on the period chosen in the
estimation. Using data up to 2010, the authors estimate that economies where labor and
labor income are more protected (for example by higher unemployment benefits) suffer
from higher unemployment, concluding that any cost reductions introduced by TTIP
would lead to positive employment effects in those countries. When more recent data is
taken into account, this conclusion ceases to hold since all countries – not just those with
stronger labor protection – appear to have experienced higher and persistent
unemployment.
18
See, for example, Estrada and Valdeolivas (2012).

GDAE Working Paper No. 14-03: TTIP: European Disintegration, Unemployment and Instability
10
3. An Alternative Assessment with the United Nations Global Policy Model
To obtain a more realistic TTIP scenario, we need to move beyond CGE models. A
convenient alternative is provided by the United Nations Global Policy Model (GPM),
which informs influential publications such as the Trade and Development Report.19
The
GPM is a demand-driven, global econometric model that relies on a dataset of consistent
macroeconomic data for every country. Two features make the GPM particularly useful
in the analysis of a large trade agreement.
Firstly, the model assumes a more realistic mechanism leading to macroeconomic
equilibrium. All models that make these types of projections necessarily make
assumptions on the way economies will stabilize after a policy change, which in this case
is the introduction of TTIP. The most important difference between the GPM and the
CGE models described Section 2 is that, in the GPM, the full-employment assumption is
replaced by the Keynesian principle of “effective demand” (Keynes 1936, Chapter 3).
This means that the level of economic activity is driven by aggregate demand rather than
productive efficiency. Consequently, a cost-cutting trade reform may have adverse effects
on the economy if the "costs" that it "cuts" are the labor incomes that support aggregate
demand. Unlike in CGE models, changes in income distribution contribute to
determining the level of economic activity. The absence of this mechanism in many
commonly used models has often led to major errors in assessing the impact of trade
reforms.20
Secondly, the GPM provides an explicit analysis of the macroeconomic workings of
every world region. This, in turn, has two important benefits. It means that the model can
provide well-founded information on the economic interactions among all regions, rather
than just assuming that a given proportion of a country’s income will be spent on imports
from other countries. It also means that the GPM allows us to assess whether a given
policy strategy is globally sustainable. For example, the GPM shows that, when sought
by every country, a strategy of export-driven growth may lead to adverse consequences
such as a net loss of trade.
A third valuable feature of the GPM is its estimation of employment. Using International
Labor Organization data, the GPM specifies how a given change in GDP growth affects
employment growth, and vice versa. A critical advantage of the specification used is that
these growth-and-employment relationships (which economists call "Okun's
relationships) are not constant over time. In this way, the GPM recognizes that different
factors might affect the relationship between output and employment at different
moments in history. Thus, the model is able to account for recent puzzles such as “jobless
growth.”
Given the large amount of data that must be processed to estimate and simulate the GPM,
we keep the analysis tractable by aggregating some countries into blocs. With this, we
lose specific analysis for these countries.
19
See Cripps and Izurieta (2014) for further documentation on the model. For the latest example of UN
policy simulations see UNCTAD (2014). 20
Ocampo et al. (2009).
GDAE Working Paper No. 14-03: TTIP: European Disintegration, Unemployment and Instability
11
Despite its limitations, the GPM offers a useful perspective on the consequences of
agreements such as TTIP. Indeed, it offers a “big picture” and insights into several
important adjustment mechanisms that are often overlooked by other models.
3.1. Simulation Strategy: Global Implications of Existing Trade Projections
Our country aggregation leaves the world’s largest economies as independent units. In
the TTIP area, the United States, United Kingdom, Germany, France and Italy appear as
stand-alone economies. The remaining countries are aggregated into two blocs: "Other
Northern and Western Europe" (including Finland, the Netherlands and Belgium) and
"Other Southern and Eastern Europe" (including Greece, Spain, Portugal and eastern
European economies).
But European nations and the US are not the only countries in the world. One benefit to
macroeconomic models is that we can estimate the effect of a policy change like TTIP on
countries outside of the potential trade bloc. Accordingly, we are able to estimate how
TTIP will affect individual countries like Argentina, Brazil, Canada, China, the
Commonwealth of Independent States (CIS), India, Indonesia, Japan, South Africa and
Turkey (which we count as independent units, much as we did with the US). All other
countries are grouped into two blocs per continent.
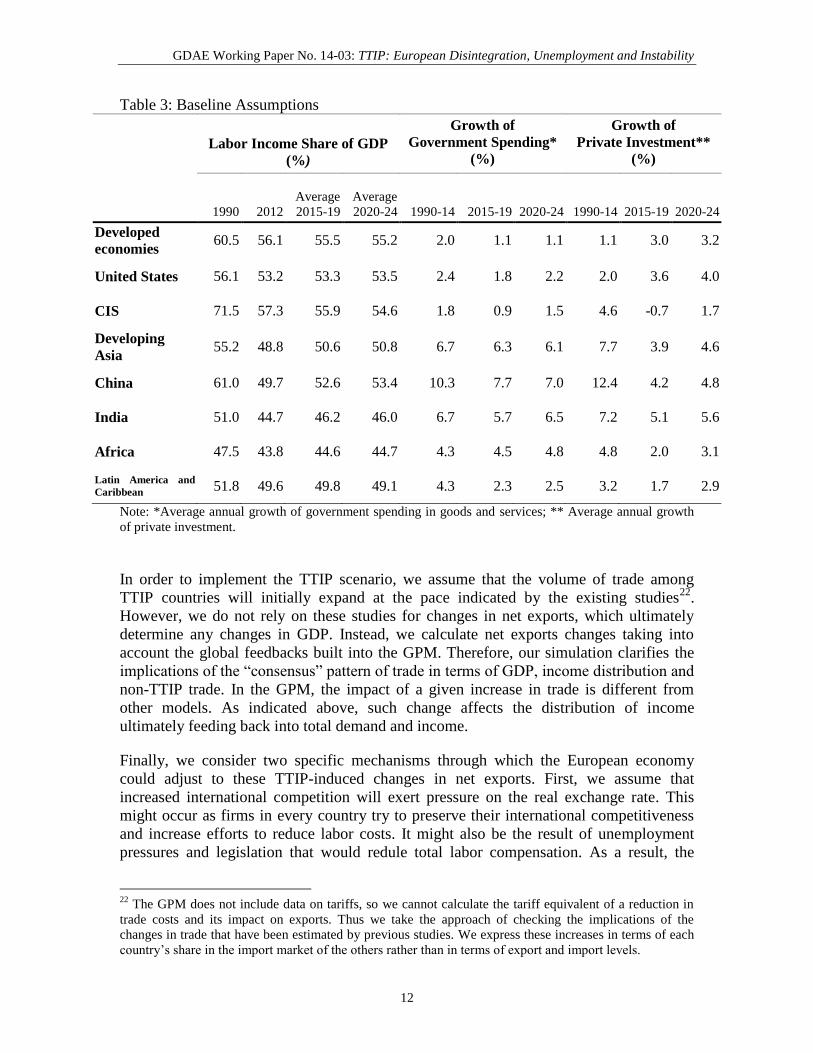
As in other simulation exercises, we first project a baseline path for the economy of every
country or country bloc from 2015 to 2025 in order to match previous studies. We then
determine counterfactual values that are implied by the adoption of the TTIP. To
determine the baseline, we use all information available on countries' past and present
policies and spending patterns (Table 3). We use the same baseline assumptions as
UNCTAD (2014). For example, we assume that governments in TTIP countries and in
some non-TTIP countries will not reverse their commitments to fiscal austerity21
.
Therefore, even in the baseline scenario, we do not expect fiscal spending to expand
aggregate demand even though historically this has been an important channel. This
confirms a major advantage to GPM-type models that we noted above: they allow for
greater realism about the likely path of policy in the foreseeable future. (For more
information about how these assumptions on the path of different countries' policies were
constructed, see UNCTAD, 2014).
21
This seems necessary given recent remarks by the European Commission indicating the intention to
enforce budget rules strictly (See, for example, http://www.ft.com/intl/cms/s/0/b1520212-3a8b-11e4-a3f3-
00144feabdc0.html#axzz3G6zxUwwP and http://www.eurozone.europa.eu/newsroom/news/2014/09/euro
group-moves-ahead-with-structural-reform-agenda/)
GDAE Working Paper No. 14-03: TTIP: European Disintegration, Unemployment and Instability
12
Table 3: Baseline Assumptions
Labor Income Share of GDP
(%)
Growth of Government Spending*
(%)
Growth of Private Investment**
(%)
1990 2012 Average 2015-19
Average 2020-24 1990-14 2015-19 2020-24 1990-14 2015-19 2020-24
Developed
economies 60.5 56.1 55.5 55.2 2.0 1.1 1.1 1.1 3.0 3.2
United States 56.1 53.2 53.3 53.5 2.4 1.8 2.2 2.0 3.6 4.0
CIS 71.5 57.3 55.9 54.6 1.8 0.9 1.5 4.6 -0.7 1.7
Developing
Asia 55.2 48.8 50.6 50.8 6.7 6.3 6.1 7.7 3.9 4.6
China 61.0 49.7 52.6 53.4 10.3 7.7 7.0 12.4 4.2 4.8
India 51.0 44.7 46.2 46.0 6.7 5.7 6.5 7.2 5.1 5.6
Africa 47.5 43.8 44.6 44.7 4.3 4.5 4.8 4.8 2.0 3.1
Latin America and
Caribbean 51.8 49.6 49.8 49.1 4.3 2.3 2.5 3.2 1.7 2.9
Note: *Average annual growth of government spending in goods and services; ** Average annual growth
of private investment.
In order to implement the TTIP scenario, we assume that the volume of trade among
TTIP countries will initially expand at the pace indicated by the existing studies22
.
However, we do not rely on these studies for changes in net exports, which ultimately
determine any changes in GDP. Instead, we calculate net exports changes taking into
account the global feedbacks built into the GPM. Therefore, our simulation clarifies the
implications of the “consensus” pattern of trade in terms of GDP, income distribution and
non-TTIP trade. In the GPM, the impact of a given increase in trade is different from
other models. As indicated above, such change affects the distribution of income
ultimately feeding back into total demand and income.
Finally, we consider two specific mechanisms through which the European economy
could adjust to these TTIP-induced changes in net exports. First, we assume that
increased international competition will exert pressure on the real exchange rate. This
might occur as firms in every country try to preserve their international competitiveness
and increase efforts to reduce labor costs. It might also be the result of unemployment
pressures and legislation that would redule total labor compensation. As a result, the
22
The GPM does not include data on tariffs, so we cannot calculate the tariff equivalent of a reduction in
trade costs and its impact on exports. Thus we take the approach of checking the implications of the
changes in trade that have been estimated by previous studies. We express these increases in terms of each
country’s share in the import market of the others rather than in terms of export and import levels.
GDAE Working Paper No. 14-03: TTIP: European Disintegration, Unemployment and Instability
13
labor share of GDP would further decrease in Europe in a downward trend toward the
lower US share, weakening aggregate demand.23
Finally, this adjustment mechanism
might also play out through a nominal devaluation. This might indeed help an economy
gain higher market shares abroad, but it may also generate a race to the bottom at the end
of which no country will have gained higher exports.
The second mechanism recognizes a policy strategy that has become central in recent
decades assuming that, in order to stimulate flagging domestic demand, policy authorities
may increase lending24
. As a result, asset prices (including some financial assets) might
increase, setting off the unstable dynamics that have become apparent after the 2009
financial crisis.
It is worth pointing out that each of these assumptions is model driven. Policymakers face
choices about how and when to respond to trade-induced wage and demand pressures.
The advantage of "effective demand" Keynesian models is that they make simplifying
assumptions about the policymaking process that enable easier computations. While these
models cannot predict the path that policymakers will actually take, they allow us to
make reasonable projections about possible GDP, employment and income changes that
are not achievable without the simplifying assumptions.
4. Simulation Results
Our simulation results paint a picture substantially different from that offered in existing
studies, with TTIP leading to net losses in the EU in terms of all main variables (Table 4).
It is important to note that all percent figures refer to the difference between the
simulated scenario and the baseline scenario. In this sense they indicate the difference
between two hypotheses on the state of the world economy in 2015 (TTIP is introduced
or not introduced). In particular, the figures do not indicate annual increases or increases
over 2014 values.
4.1. Net exports and GDP
Our simulations show that the assumed trade expansion among TTIP countries will cause
a net export loss for all EU economies. Losses would be a drag on aggregate demand for
all EU economies. Northern European Economies would suffer the largest decreases
(2.07% of GDP by 2025) followed by France (1.9%), Germany (1.14%) and the UK
(0.95%). On the other hand, US net exports would be higher by slightly more than one
percent.
A likely explanation for how EU-US trade could expand while EU net exports to the
world could decline is that, in the EU’s stagnating economy, domestic demand for lower-
value added manufactures – in which the EU is relatively uncompetitive – will crowd out
higher-value added ones. Indeed, our figures show an increase of net exports in almost
every other region of the world except Europe, suggesting that higher demand for low-
value added product will lead to higher net imports from Asian and African economies
23
For an explanation of the relationship between labor costs and the labor share of GDP, see Appendix A. 24
Implicitly, we assume that policy authority can actually affect private bank lending.
GDAE Working Paper No. 14-03: TTIP: European Disintegration, Unemployment and Instability
14
and from the US25
. Alternatively or additionally, TTIP could facilitate EU imports of
manufactures assembled in the US with parts made in China and other regions.
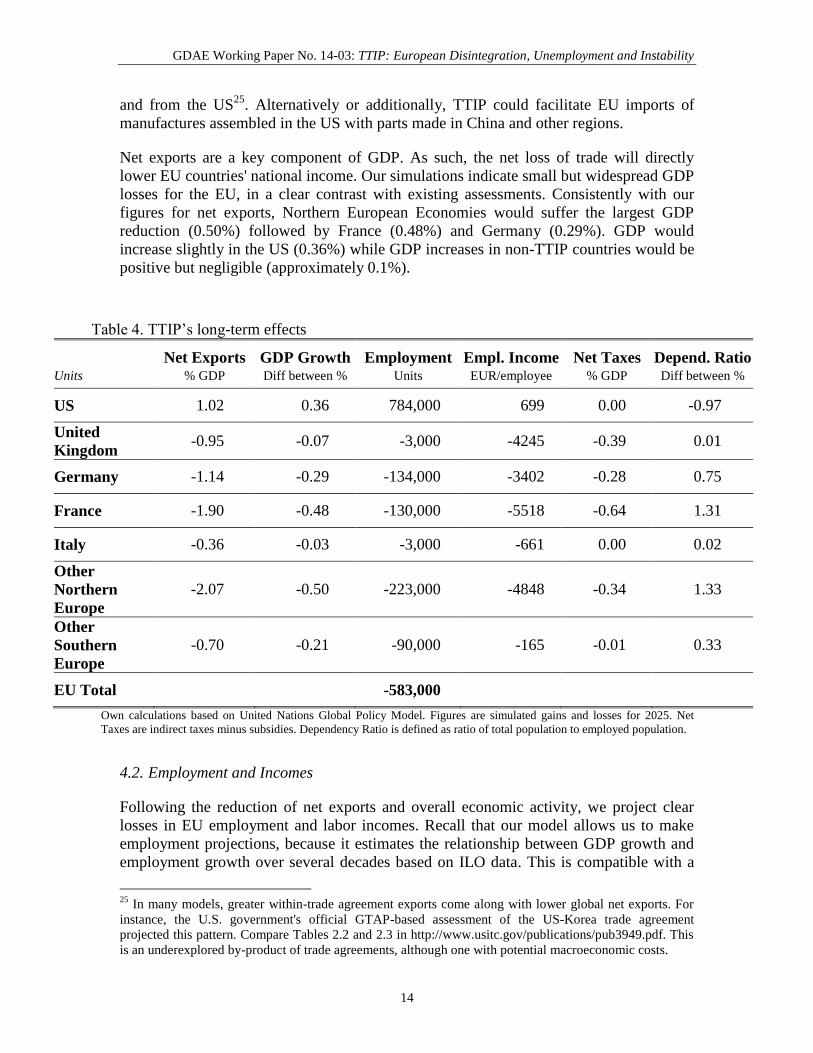
Net exports are a key component of GDP. As such, the net loss of trade will directly
lower EU countries' national income. Our simulations indicate small but widespread GDP
losses for the EU, in a clear contrast with existing assessments. Consistently with our
figures for net exports, Northern European Economies would suffer the largest GDP
reduction (0.50%) followed by France (0.48%) and Germany (0.29%). GDP would
increase slightly in the US (0.36%) while GDP increases in non-TTIP countries would be
positive but negligible (approximately 0.1%).
Table 4. TTIP’s long-term effects
Net Exports GDP Growth Employment Empl. Income Net Taxes Depend. Ratio Units % GDP Diff between % Units EUR/employee % GDP Diff between %
US 1.02 0.36 784,000 699 0.00 -0.97
United
Kingdom -0.95 -0.07 -3,000 -4245 -0.39 0.01
Germany -1.14 -0.29 -134,000 -3402 -0.28 0.75
France -1.90 -0.48 -130,000 -5518 -0.64 1.31
Italy -0.36 -0.03 -3,000 -661 0.00 0.02
Other
Northern
Europe
-2.07 -0.50 -223,000 -4848 -0.34 1.33
Other
Southern
Europe
-0.70 -0.21 -90,000 -165 -0.01 0.33
EU Total -583,000
Own calculations based on United Nations Global Policy Model. Figures are simulated gains and losses for 2025. Net
Taxes are indirect taxes minus subsidies. Dependency Ratio is defined as ratio of total population to employed population.
4.2. Employment and Incomes
Following the reduction of net exports and overall economic activity, we project clear
losses in EU employment and labor incomes. Recall that our model allows us to make
employment projections, because it estimates the relationship between GDP growth and
employment growth over several decades based on ILO data. This is compatible with a
25
In many models, greater within-trade agreement exports come along with lower global net exports. For
instance, the U.S. government's official GTAP-based assessment of the US-Korea trade agreement
projected this pattern. Compare Tables 2.2 and 2.3 in http://www.usitc.gov/publications/pub3949.pdf. This
is an underexplored by-product of trade agreements, although one with potential macroeconomic costs.
GDAE Working Paper No. 14-03: TTIP: European Disintegration, Unemployment and Instability
15
tendency toward specialization in higher-value added, lower-employment-intensity
products, which would lead to export and output gains in a few sectors while adversely
affecting many others26
. As a result, we calculate that the EU as a whole would lose
approximately 600,000 jobs by 2025, most of which are in Northern Europe, France and
Germany. By comparison, this is more jobs than the EU lost in the crisis years of 2010
and 2011 – clearly Europe must avoid another job loss of this magnitude even if gradual
and spread over many years.
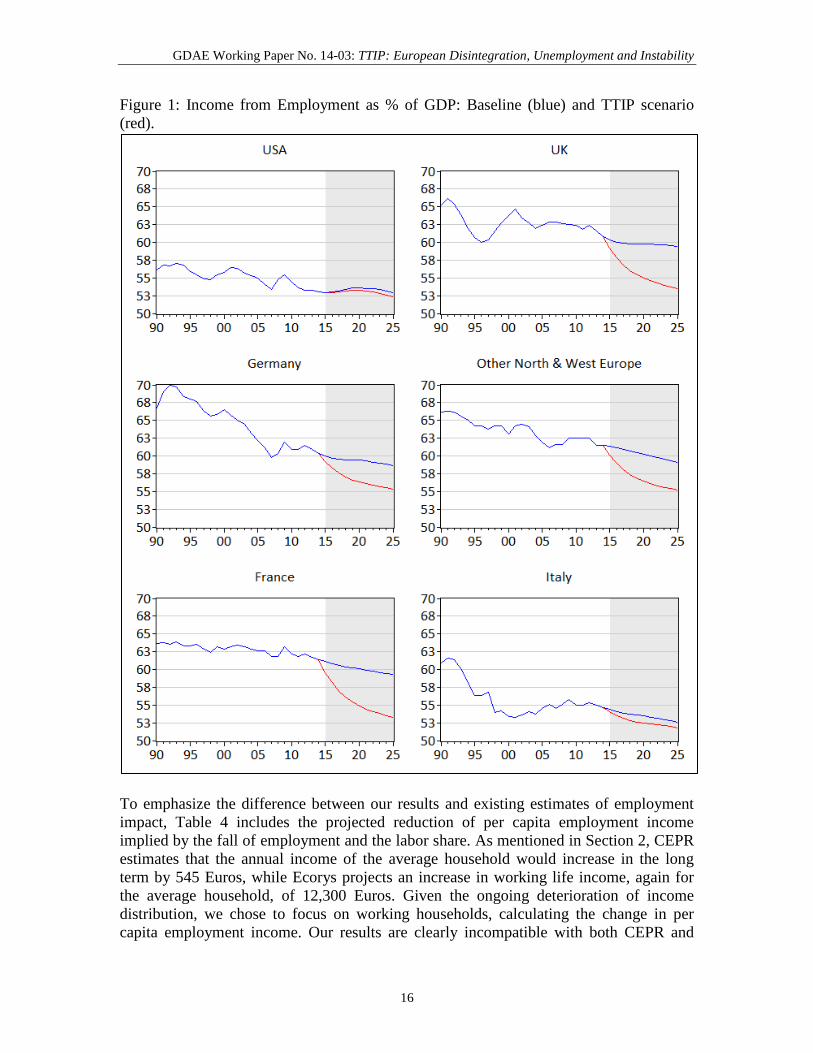
The loss of employment would further accelerate the reduction of incomes that has
contributed to the EU’s current stagnation. Indeed labor income will continue its steady
decrease as a share of total income, weakening consumption and residential investment
while likely exacerbating social tensions. The flipside of this decrease is an increase in
the share of profits and rents in total income, indicating that proportionally there would
be a transfer of income from labor to capital. The largest reductions will take place in UK
(with 7% of GDP transferred from labor to profit income), France (8%), Germany and
Northern Europe (4%), reinforcing a negative trend that has continued at least since the
early 2000s (Figure 1).
26
It is worth emphasizing that this is not a results of the model but a possible explanation of trends
projected with it.
GDAE Working Paper No. 14-03: TTIP: European Disintegration, Unemployment and Instability
16
Figure 1: Income from Employment as % of GDP: Baseline (blue) and TTIP scenario
(red).
To emphasize the difference between our results and existing estimates of employment
impact, Table 4 includes the projected reduction of per capita employment income
implied by the fall of employment and the labor share. As mentioned in Section 2, CEPR
estimates that the annual income of the average household would increase in the long
term by 545 Euros, while Ecorys projects an increase in working life income, again for
the average household, of 12,300 Euros. Given the ongoing deterioration of income
distribution, we chose to focus on working households, calculating the change in per
capita employment income. Our results are clearly incompatible with both CEPR and
GDAE Working Paper No. 14-03: TTIP: European Disintegration, Unemployment and Instability
17
Ecorys. Indeed, we project losses of working incomes per capita ranging from 165 to
more than 5,000 Euros. France would be the worst hit with a loss of 5,500 Euros per
worker, followed by Northern European Countries (4,800 Euros), United Kingdom
(4,200 Euros) and Germany (3,400 Euros). For a household with two working persons,
the loss ranges from 330 to more than 10,000 Euros. By contrast, in the US there would
be an increase of employment income.
The loss of economic activity and the weakening of consumption in the EU means that
tax revenue will be less than it would have been in the absence of the TTIP. We estimate
that the surplus of indirect taxes (such as sales taxes or value-added taxes) over subsidies
will decrease in all EU countries, with France suffering the largest loss (0.64% of GDP or
slightly more than 1% of total government budget). Government deficits would also
increase as a percentage of GDP in every EU country, pushing public finances closer or
beyond the Maastricht limits.27
The loss of employment and labor income will increase pressure on social security
systems. Using GPM employment projections and UN population data we can calculate
the economic dependency ratio, that is the ratio of total population to employed
population. This indicates how many people are supported by each job, either through
family relationships or social security contributions. According to our calculations, the
ratio would increase throughout the EU announcing more troubled times for European
social security systems. By contrast in the US, indirect taxes would not be affected while
the economic dependency ratio would slightly improve.
4.3. Asset Price Inflation and Real Devaluation
Policymakers will have a few options to adjust to the shortfall in national incomes
projected by our study. With wage shares and government revenues decreasing, other
incomes must sustain demand if the economy is to adjust. These adjustments have to be
profits or rents but, with flagging consumption growth, profits cannot be expected to
come from growing sales. A more realistic assumption is that profits and investment
(mostly in financial assets) will be sustained by growing asset prices. The potential for
macroeconomic instability of this growth strategy is well known.
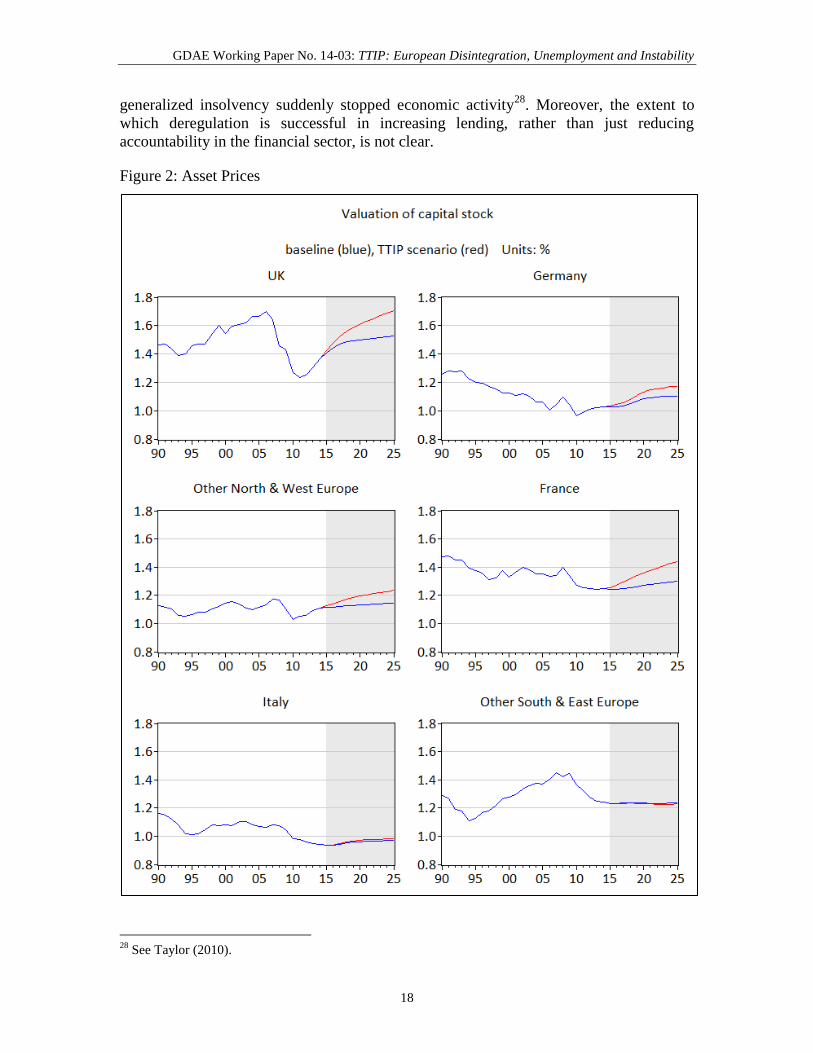
In this adjustment scenario, there would be a strong increase in asset prices where
financial markets are more developed, especially in the United Kingdom, Germany,
Other Western and Northern European Countries and France (Figure 2). Aggregate
demand in these economies would be sustained by a recovery of the financial sector,
stimulated by domestic landing and growing profits. However, it is critical to note that
such growth would last only as long as asset prices keep growing, requiring ever-rising
levels of lending. In the current context of weak commercial lending, this might require
intentional policy interventions, such as further deregulation. This road to growth has
been taken before and its risks have proven extremely high. During the most recent
economic crisis, individuals and businesses quickly ran up unsustainable debts until
27
These limits generally require budget deficits to stay under three percent of GDP.
GDAE Working Paper No. 14-03: TTIP: European Disintegration, Unemployment and Instability
18
generalized insolvency suddenly stopped economic activity28
. Moreover, the extent to
which deregulation is successful in increasing lending, rather than just reducing
accountability in the financial sector, is not clear.
Figure 2: Asset Prices
28
See Taylor (2010).
GDAE Working Paper No. 14-03: TTIP: European Disintegration, Unemployment and Instability
19
Of course, a run-up in asset prices is not the only policy and economic response to the
drop in aggregate demand. But it appears to be slightly more viable than alternative
adjustment mechanisms. For example, it is often suggested that an opportunity might
come from real devaluation. Countries might be tempted to seek this alternative by way
of a nominal depreciation, a reduction of real labor costs or both. In light of the
discussion in section 3, the latter channel does not appear viable. This is because it would
prove counter-productive when applied by many countries. In other words, if the incomes
of workers in every country are reduced, the demand hole is dug even deeper. Moreover,
the magnitude of the cuts required could be socially unsustainable after decades of falling
labor shares. On the other hand, a substantial nominal depreciation of the Euro would
probably trigger defensive depreciation in other currencies before any improvement in
competitiveness is achieved.
According to our projections, a real devaluation would have some effect in Germany and
France but nothing that might strongly stimulate aggregate demand (Figure 3).
Furthermore, attempts at strong devaluations are often followed by a race to the bottom in
which the trading partners of the country that devalues try to regain the lost ground by
devaluing as well. But even when a race to the bottom does not happen, lasting periods of
real devaluation might lead to the accumulation of external debts as Europe’s deficit
countries has experienced after 1999.29
To reiterate, our model requires some form of adjustment to compensate for the drop in
aggregate demand. The precise path that future policymakers will choose (if any) is of
course unknowable at present. But our model sheds light on the likely macroeconomic
consequences of a TTIP-induced change in trade volumes, and also on the policy
responses that are more or less likely to fill the demand gap.
5. Discussion and Conclusion
Existing studies on TTIP have focused on the impact the agreement would have on
aggregate economic activity in member countries. They have done so based on detailed
sectoral analyses of TTIP economies, but have neglected the impact of income
distribution and other important dimensions of macroeconomic adjustment.
Our assessment of TTIP is based on the United Nations Global Policy Model, which has
proven a convenient tool to estimate the impact of policy changes involving large areas of
the world economy. Our simulation does not question the impact of TTIP on total trade
flows estimated by existing studies. Rather we analyze their implications in terms of net
exports, GDP, government finance, and income distribution.
Our analysis points to several major results. First, TTIP would have a negative net effect
on the EU. We find that a large expansion of the volume of trade in TTIP countries is
compatible with a net reduction of trade-related revenues for the EU. This would lead to
net losses in terms of GDP and employment. We estimate that almost 600,000 jobs would
29
See Flassbeck and Lapavitsas (2013).
GDAE Working Paper No. 14-03: TTIP: European Disintegration, Unemployment and Instability
20
be lost as a result of TTIP. Secondly, TTIP would reinforce the downward trend of the
labor share of GDP, leading to a transfer of income from wages to profits with adverse
social and economic consequences. Policymakers would face a few options to deal with
this demand gap. Our model suggests that asset price inflation or devaluation could
result, leading to higher economic instability.
In this paper we have focused on trade and its consequences, leaving the investment
component of TTIP on the sidelines. Going forward, valuable insights could be drawn by
further extending the analysis of TTIP’s financial effects.
GDAE Working Paper No. 14-03: TTIP: European Disintegration, Unemployment and Instability
21
6. References
Ackerman, F., and K. Gallagher. 2004. “Computable Abstraction: General Equi- librium
Models of Trade and Environment.” In The flawed foundations of General Equilibrium:
critical Essays on Economic theory, ed. F. Ackerman and A. Nadal, 168–80. New York:
Routledge.
Ackerman, Frank, and Kevin P. Gallagher, 2008, “The Shrinking Gains from Global
Trade Liberalization in Computable General Equilibrium Models”, International Journal
of Political Economy, vol. 37, no. 1, Spring, pp. 50–77.
Baele, L., 2005, “Volatility Spillover Effects in European Equity Markets”, The Journal
of Financial and Quantitative Analysis, Vol. 40, No. 2 (Jun.), pp. 373-401.
Bertelsmann, 2013, Transatlantic Trade and Investment Partnership (TTIP), Bertelsmann
Stiftung.
Cameron, D., 2012, Fiscal Responses to the Economic Contraction of 2008-09, Yale
University: https://www.princeton.edu/piirs/research/research-clusters/politics-economic-
crisis/Fiscal-Responses-to-the-Economic-Contraction.pdf
CEPII, 2013, Transatlantic Trade: Whither Partnership, Which Economic
Consequences?, Centre d’Etudes Prospectives et d’Informations Internationales, Paris.
CEPR, 2013, Reducing Transatlantic Barriers to Trade and Investment, Centre for
Economic Policy Research, London.
Clausing. K. A., 2001, “Trade creation and trade diversion in the Canada – United States
Free Trade Agreement”, Canadian Journal of Economics/Revue canadienne
d'économique, Volume 34, Issue 3, pages 677–696, August.
Cripps, F. and A. Izurieta, 2014, The UN Global Policy Model: Technical Description,
United Nations Conference on Trade and Development, Geneva, CH
Ecorys, 2009, Non-Tariff Measures in EU-US Trade and Investment – An Economic
Analysis, ECORYS Nederland BV.
Estrada, A., and E. Valdeolivas, 2012, The Fall of the Labour Income Share in Advanced
Economies, Documentos Ocasionales N.º 1209.
European Commission, 2013, Trade Cross-cutting disciplines
and Institutional provisions, Initial EU Position Paper, available at:
http://trade.ec.europa.eu/doclib/docs/2013/july/tradoc_151622.pdf
European Commission, 2014, The Transatlantic Trade and Investment Partnership
(TTIP), TTIP Explained, available at:
http://trade.ec.europa.eu/doclib/docs/2014/may/tradoc_152462.pdf
Felbermayr, G. J., M. Larch, 2013, The Transatlantic Trade and Investment Partnership
(TTIP): Potential, Problems and Perspectives. In: CESifo Forum, 2/2013, 49-60.
Flassbeck, Heiner and Costas Lapavitsas, 2013, The Systemic Crisis of the Euro – True
Causes and Effective Therapies, Rosa Luxembourg Stiftung:

GDAE Working Paper No. 14-03: TTIP: European Disintegration, Unemployment and Instability
22
http://www.rosalux.de/fileadmin/rls_uploads/pdfs/Studien/Studien_The_systemic_crisis_
web.pdf
Gunter, B.G.; L. Taylor; and E. Yeldan, 2005. “Analysing Macro-Poverty Linkages of
External Liberalisation: Gaps, Achievements and Alternatives.” Development Policy
Review 23, no. 3: 285–98.
Keynes, J. M., 1936, The General Theory of Employment, Interest and Money, Palgrave
MacMillan.
Lipsey, R., 1957, “The Theory of Customs Unions: Trade Diversion and Welfare”
Economica, New Series, Vol. 24, No. 93 (Feb.), pp. 40-46.
NELP, 2014, The Low-Wage Recovery, Industry Employment and Wages Four Years
into the Recovery, National Employment Law Project, Washington, D.C.
Ocampo, J. A., C. Rada and L. Taylor, 2009, Growth and Policy in Developing
Countries, Columbia University Press, New York, NY.
Polaski, S. 2006. Winners and losers: Impact of the Doha Round on Developing
Countries, Washington, DC: Carnegie Endowment for International Peace.
Raza, W., J. Grumiller, L. Taylor, B. Tröster, R. von Arnim, 2014, Assess_TTIP:
Assessing the Claimed Benefits of the Transatlantic Trade and Investment Partnership
(TTIP), OFSE, Vienna.
Romalis, J., 2007, “NAFTA’s and CUSFTA’s Impact on International Trade”, Review of
Economics and Statistics 89, 416–435.
Stanford, J., 2003, “Economic Models and Economic Reality: North American Free
Trade and the Predictions of Economists.” International Journal of Political Economy
33, no. 3: 28–49
Stiglitz, J.E., and A.H. Charlton, 2004. “A Development-Friendly Prioritization of Doha
Round Proposals”, IPD Working Paper. Initiative for Policy Dialogue, New York.
Taylor, Lance, and Rudiger von Arnim, 2006, Modeling the Impact of Trade
Liberalization, Oxfam International.
Taylor, L., 2010, Maynard’s Revenge, the Collapse of Free Market Macroeconomics,
Harvard University Press, Cambridge, MA.
Taylor, L., 2011, “CGE applications in development economics”, SCEPA Working Paper
2011-1, Schwartz Center for Economic Policy Resarch, The New School, New York.
UNCTAD, 2014, Trade and Development Report 2014, United Nations Conference on
Trade and Development, Geneva, CH.
GDAE Working Paper No. 14-03: TTIP: European Disintegration, Unemployment and Instability
23
Appendix A: Labor Share and Labor Cost
We show that labor cost is equivalent to the labor share of GDP. We start with the
output-income identity:
,
where P is the average price level, X is the aggregate level of output, w is the average
wage, L the total number of hours worked and is the profit share. Consequently, wL and
represent total wages and profits respectively. Rearranging, we obtain an expression
for cost-based pricing:
where is the mark up (related to the profit share by the relationship
) and the
last term of the right-hand side is the nominal cost of labor per unit of output (the wage-
productivity ratio or hourly wage divided by the units of output produced employing one
hour of labor). Indicating labor productivity with we can rewrite the latter as:
If the profit share and, therefore, the mark-up are to remain constant, the only way to
reduce the price of output and become more competitive is to reduce the unit labor cost.
This can be done by cutting hourly wages or increasing productivity. In both cases, the
consequences can be paradoxical.
We can obtain real unit labor cost dividing the nominal cost by the price level:
where is the real wage. But the first equality can also be restated as:
which shows that real unit labor cost is equal to the ratio of the wage bill to the value of
output, that is the wage share .
GDAE Working Paper No. 14-03: TTIP: European Disintegration, Unemployment and Instability
24
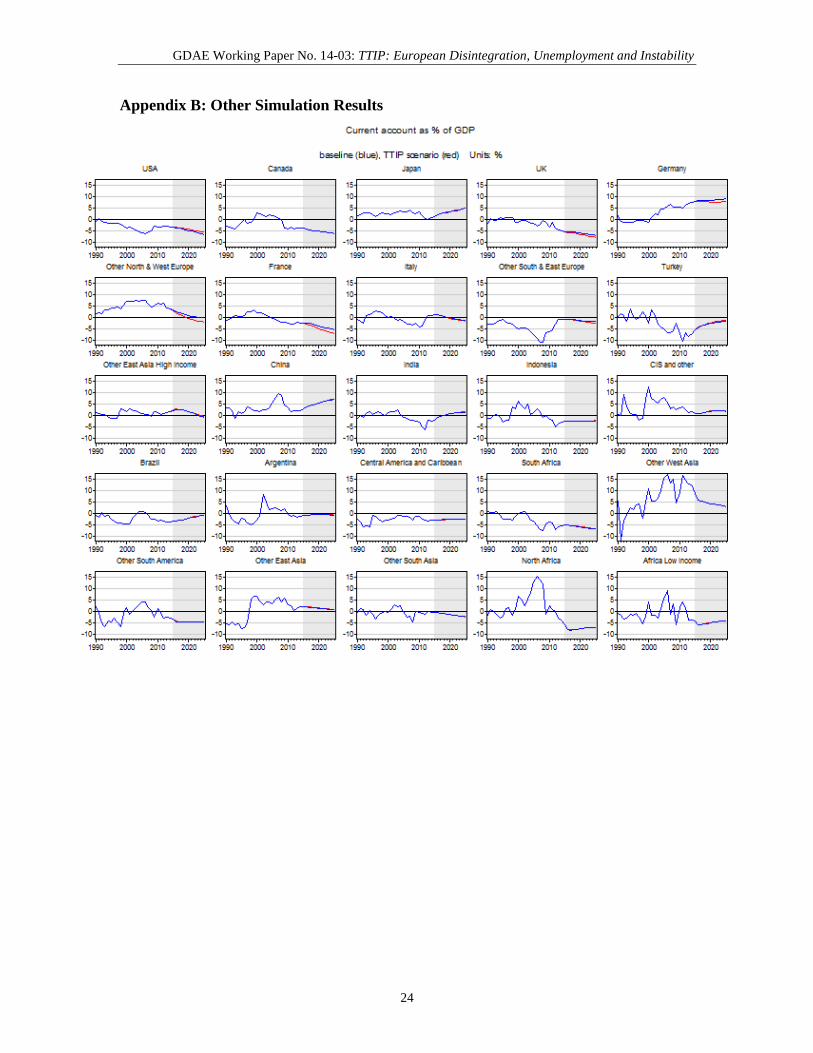
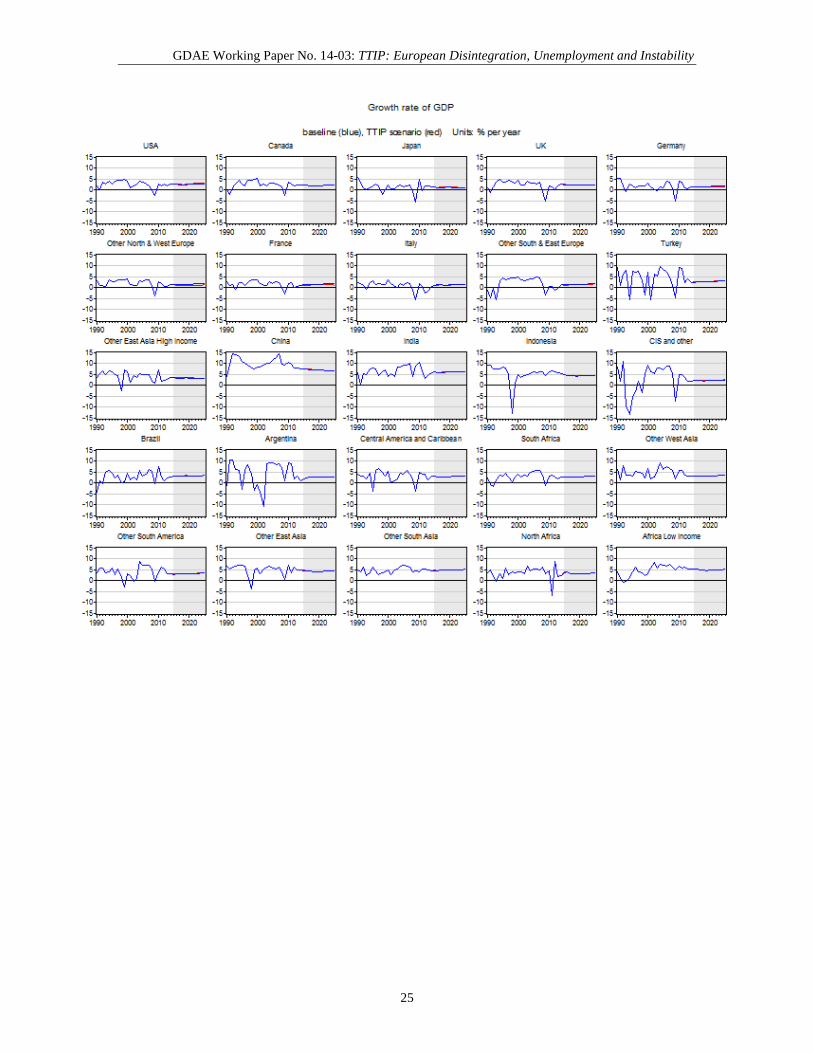
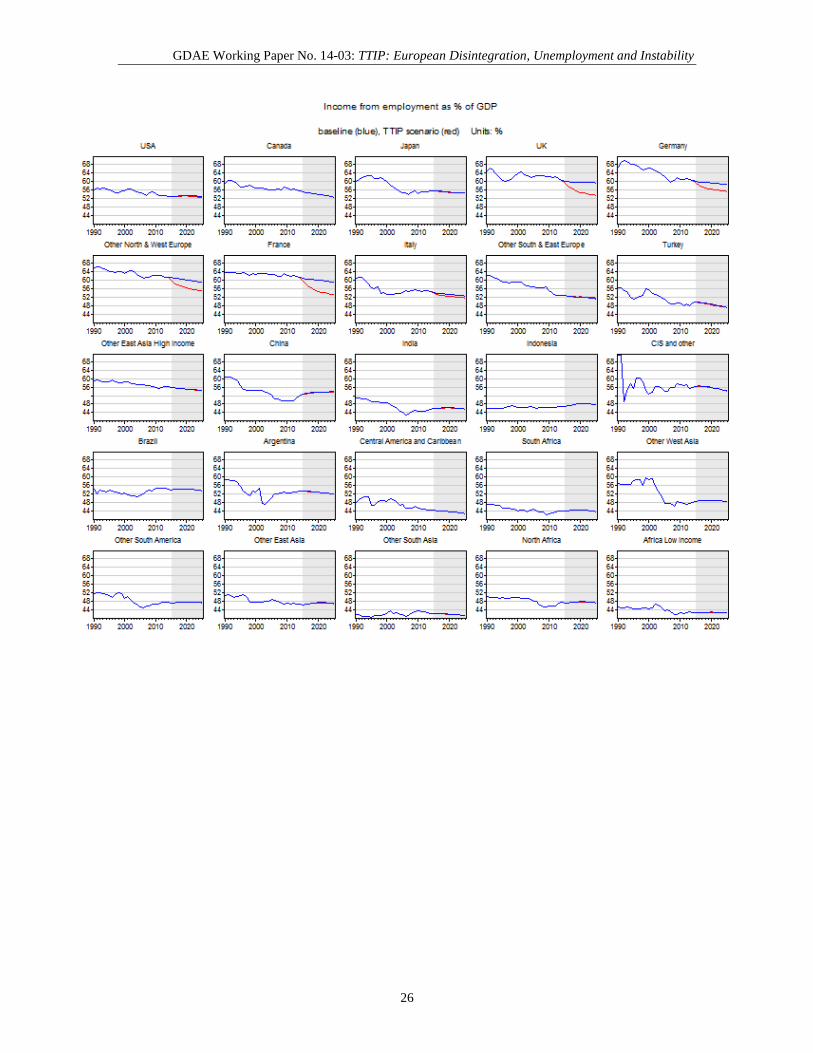
Appendix B: Other Simulation Results
GDAE Working Paper No. 14-03: TTIP: European Disintegration, Unemployment and Instability
25
GDAE Working Paper No. 14-03: TTIP: European Disintegration, Unemployment and Instability
26
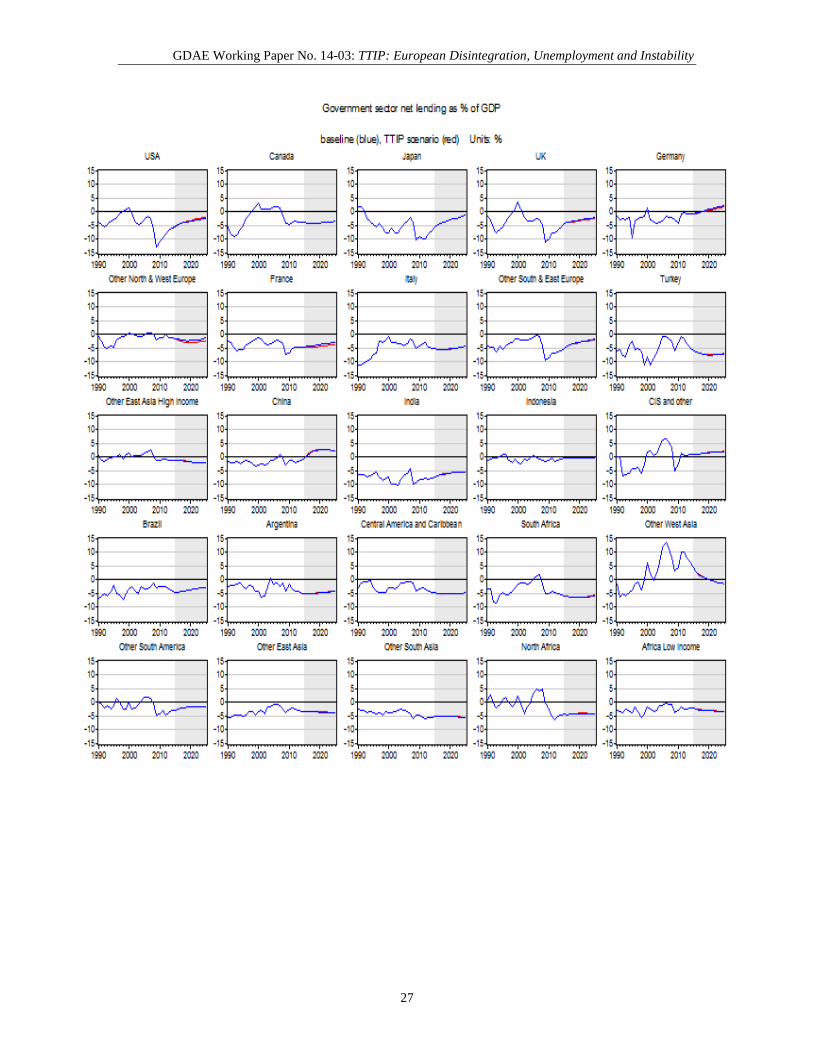
GDAE Working Paper No. 14-03: TTIP: European Disintegration, Unemployment and Instability
27
View the complete list of working papers on our website:
http://www.ase.tufts.edu/gdae/publications/working_papers/index.html
The Global Development And Environment Institute GDAE is a research institute at Tufts University dedicated to promoting a better understanding of how
societies can pursue their economic goals in an environmentally and socially sustainable manner. GDAE
pursues its mission through original research, policy work, publication projects, curriculum development,
conferences, and other activities. The “GDAE Working Papers” series presents substantive work-in-progress
by GDAE-affiliated researchers.
We welcome your comments, either directly to the author or to GDAE:
Tufts University, 44 Teele Ave, Medford, MA 02155; Tel: 617-627-3530; Fax: 617-627-2409
Email: [email protected]; Website: http://ase.tufts.edu/gdae.
Recent Papers in this Series:
14-03 The Trans-Atlantic Trade and Investment Partnership: European Disintegration,
Unemployment and Instability (Jeronim Capaldo, October 2014)
14-02 Trade Hallucination: Risks of Trade Facilitation and Suggestions for Implementation
(Jeronim Capaldo, June 2014)
14-01 Prices and Work in The New Economy (Neva Goodwin, March 2014)
13-04 Can We Feed the World in 2050? A Scoping Paper to Assess the Evidence (Timothy A.
Wise, September 2013)
13-03 Population, Resources, and Energy in the Global Economy: A Vindication of Herman
Daly’s Vision (Jonathan M. Harris, February 2013)
13-02 Green Keynesianism: Beyond Standard Growth Paradigms (Jonathan Harris, Feb 2013)
13-01 Climate Impacts on Agriculture: A Challenge to Complacency? (Frank Ackerman and
Elizabeth A. Stanton, January 2013)
12-07 Poisoning the Well, or How Economic Theory Damages Moral Imagination (Julie A.
Nelson, October 2012)
12-06 A Financial Crisis Manual: Causes, Consequences, and Lessons of the Financial Crisis
(Ben Beachy, December 2012)
12-05 Are Women Really More Risk-Averse than Men? (Julie A. Nelson, September 2012)
12-04 Is Dismissing the Precautionary Principle the Manly Thing to Do? Gender and the
Economics of Climate Change (Julie A. Nelson, September 2012)
12-03 Achieving Mexico’s Maize Potential (Antonio Turrent Fernández, Timothy A. Wise, and
Elise Garvey, October 2012)
12-02 The Cost to Developing Countries of U.S. Corn Ethanol Expansion (Timothy A. Wise,
October 2012)
12-01 The Cost to Mexico of U.S. Corn Ethanol Expansion (Timothy A. Wise, May 2012)
11-03 Would Women Leaders Have Prevented the Global Financial Crisis? Implications for
Teaching about Gender, Behavior, and Economics (Julie A. Nelson, September 2012)
11-02 Ethics and the Economist: What Climate Change Demands of Us (J. A. Nelson, May
2011)
11-01
Investment Treaty Arbitration and Developing Countries: A Re-Appraisal (Kevin P.
Gallagher and Elen Shrestha, May 2011)
10-06
Does Profit-Seeking Rule Out Love? Evidence (or Not) from Economics and Law (Julie
A. Nelson, September 2010)
10-05
The Macroeconomics of Development without Throughput Growth (Jonathan Harris,
September 2010)