working paper 651 january 2020 - esri
TRANSCRIPT
A review of the methodologies used in compiling owner-occupiers’ housing indices
Achim Ahrensa, Keelan Beirnea, Philip Economidesa, Ilias Kostarakosa,b, Kieran McQuinna,b and Conor O’ Toolea,b
Abstract: This paper examines the manner in which owner-occupiers housing costs are incorporated in the official inflation index. In particular, the focus is on the net acquisitions and the payments approach, which are currently used by the Central Statistics Office (CSO). The paper provides a detailed overview of the two approaches, along with some suggestion for further refinement.
*Corresponding Author: [email protected]
Acknowledgements: We would like to acknowledge the comments of Barra Casey, Joseph Keating and Viacheslav Voronovich (CSO) and Karl Whelan (UCD) for comments on a previous draft.
a The Economic and Social Research Institute, Dublin b Department of Economics, Trinity College, Dublin
January 2020
Working Paper 651
ESRI working papers are not ESRI reports. They represent un-refereed work-in-progress by researchers who aresolely responsible for the content and any views expressed therein. Any comments on these papers will bewelcome and should be sent to the author(s) by email. Papers may be downloaded for personal use only.

2
Introduction
The incorporation of (owner-occupied) housing costs into the headline measure of inflation is an issue
that has long been debated among statisticians and economists. To this day, there is little consensus
as to whether the costs related to owner occupied housing (OOH) should be included in the measure
of inflation; and, if they should be, which methodology should be used in order to produce an accurate
measurement of the costs necessary to meet the requirements of a general inflation measure (such
as the CPI). Most statistical institutes opt for the exclusion of housing costs from the measure of
inflation, arguing that the opposite would imply the incorporation of an asset into an index whose
scope is to measure the change in prices of consumption goods and services. For example, a recent
report by the European Commission (2018) argued, almost 20 years after the publication of the first
pilot study in 2001, against the inclusion of the owner-occupied housing index in its current form into
the Harmonized Index of Consumer Prices (HICP) (the inflation and price stability indicator utilized by
the European Central Bank (ECB)). The report also raises issues about the practical implementation of
an owner-occupying index and, in particular, the timeliness of the release of the indicator1. In Ireland,
the treatment of housing in the CPI has been examined by the CSO for almost a decade. In 2010, a
report by the National CPI Review Group was published, which highlighted a number of issues relating
to the measurement of housing costs and the appropriate methodology of incorporating such costs
into the measure of inflation.
Housing related expenditures constitute a significant part of households’ final consumption
expenditures. Evidence from the EU SILC survey indicate that in 2017, for the EU-19, 25% of the
population spends more than a quarter of their disposable income on owner occupation related costs,
with the corresponding figure for Ireland being 14.4% of the population. Another statistic indicating
the importance of owner-occupied housing is that almost 70% of households are owner-occupiers; in
particular, for the EU-19, 26.5% of the households lived in an owner-occupied home with a mortgage
and a loan, while 42.8% lived in an owner-occupied home without a mortgage or a loan. The
corresponding figures for Ireland are 31.8% and 37.8%, respectively. Moreover, from a more
aggregate perspective, the importance of housing and its impact on overall macroeconomic
performance and consumption expenditures (e.g. see Leamer (2008)) indicate that the accurate
measurement of housing related costs and their incorporation into the general inflation measure
could prove to be useful for the design of macroprudential and monetary policy (e.g. see Hampl and
1 As per the European Commission guidelines, the HICP measure needs to be compiled and released by the member-states within 15 calendar days after the end of the reference month. This is not feasible given the current form and implementation approach of the owner-occupied housing index.

3
Havranek, 2017 and Ambrose et al., 2018). Furthermore, understanding the impact of housing cost on
consumption is critical to determining the macroeconomics dynamics of consumer spending. In an
Irish context, for example, McCarthy and McQuinn (2017), using a combination of loan-level and
survey data, estimate that the elasticity of consumption with respect to house prices is 11 per cent,
which they note as being quite high by international standards.
This paper is the first output of a research project between the Economic and Social Research Institute
(ESRI) and the Central Statistics Office (CSO), which is examining the manner in which housing costs
are incorporated in official measurements of inflation. As such the purpose of this paper is to examine
the net acquisitions and the payments approach to measuring the cost of housing in inflation. These
measures are currently those used by the CSO for the compilation of an owner-occupied housing
index. The paper provides an overview of the two methods, along with a review of their
implementation by the CSO and some suggested improvements. Future research in the project will
focus on the use approach and in particular the rental equivalence method.
From an academic perspective, the first to argue for the inclusion of housing prices in the measure of
inflation were Alchian and Klein (1973), who claimed that the inclusion of such prices in the CPI was
necessary to ensure an accurate measurement of inflation. In the same vein, Goodhart (2001) argues
for the importance of including housing prices in the inflation measure and presents econometric
evidence which suggest that changes in house prices are closely related to changes in inflation and,
output. However, Goodhart states that the Alchian and Klein approach is infeasible as it would require
assigning large weights on asset prices relative to goods prices. Diewert and Nakamura (2009) argue
that a direct measure of house prices, instead of rents, should be included in the CPI, to accurately
capture the housing cost component. On the other hand, some economists (see, for example,
Bernanke and Gertler (2000)) argue that the inclusion of asset prices in the CPI should be avoided, as
they are quite volatile and would, as a result, render the CPI measure unstable and, therefore, not
useful for the conduct of monetary policy. As already mentioned, another argument against the
inclusion of owner-occupied housing in the CPI is that while houses are a durable good, they require
a substantial investment by the household. Consequently, the investment component of the house is
often quite large compared to the consumption component, which argues for its exclusion from the
CPI.
National statistical institutes typically follow one of three approaches in measuring OOH costs: the
payments approach, the net acquisitions approach and the use approach (which has two forms, the
4
user cost approach and rental equivalence approach2). In general, the payments approach tries to
measure the actual cash flow of households with respect to owner occupation costs (such as, property
taxes, mortgage payments etc.), the net acquisitions approach measures the spending on net
purchases of dwellings by households and the associated maintenance and repair costs, while the use
approach tries to approximate the cost of own occupation using actual, observable rents paid by
private renters.
The rest of the paper is organized as follows: section 2 provides an overview of the methods used for
the calculation of owner-occupied housing costs. Sections 3 and 4 present, in detail, the net
acquisitions and the payments approach, respectively, along with some suggestions for a refinement
of the methods as currently implemented by the CSO. A final section, Section 5, offers some
concluding thoughts.
An Overview of the Methods
As already stated, the lack of consensus concerning the appropriate approach for measuring owner
occupied costs has been highlighted in a number of surveys: first, a survey conducted by the ONS3
indicates that out of the 29 countries surveyed, 13 used the rental equivalence approach, 3 used the
net acquisitions approach and only one, Ireland, the payments approach4. It is interesting to note that,
the second most popular choice of Statistical Institutes surveyed at the time was to exclude owner
occupied costs from their headline CPI measure. Data presented in Hampl and Havranek (2017) show
that if owner occupied housing costs are to be included in the CPI, then the rental equivalence
approach is chosen by the majority of Statistical Institutes, while the OECD (2018) reports that 11 of
the G20 economies still exclude these costs from their headline CPI measure and the majority of the
rest utilize the rental equivalence approach5.
The payments approach assumes that owner-occupied housing services are the same in each period
and its aim is to measure the ongoing costs of living in the dwellings. It focuses on the costs incurred
by households when purchasing housing goods and services and, in particular, the actual payments
2 However, the user cost approach has been used by a very small number of National Statistical Institutes 3 See, Johnson (2015), pg. 125 4 Hill et al. (2019) mention that Austria is also using the payments approach for the calculation of the owner-occupied housing costs. The ONS in the UK also produces an index based on the payments approach; however, they clarify that it is a purely experimental index to be used with caution. 5 It should also be noted that all EU member-states, following the guidelines set by the European Commission, produce a quarterly owner-occupied housing index following the net acquisitions approach. This is in addition to the approach that each national statistical institute has chosen for the production of the domestic indicator.

5
made to cover these purchases. These payments include, among others, mortgage interest payments,
insurance costs, maintenance etc. Despite the fact that under this approach there is no need to impute
prices, the inclusion of interest payments is somewhat troublesome in the context of the CPI, as it
does not necessarily represent consumption but, rather, the cost of borrowing money6.
The net acquisitions approach assumes that the dwelling comprises of an asset component, namely
the land on which it is built, and a consumption component, the structure. Its focus is on measuring
the change in the transaction prices of dwellings that are new to the household sector, as well as the
goods and services purchased by households in their capacity as owner-occupiers. Under this
approach, prices are recorded at full market prices and the overall value of the acquisition is allocated
in its entirety to the time of the purchase, irrespective of when the consumption of the good actually
starts. Although this assumption may conceptually seem at odds with the fact that a dwelling is a
durable good with longer life compared to other durables, it ensures that all durables are treated in
the same way and, additionally, it ensures consistency with all the other elements of the CPI. An
important limitation of the net acquisitions approach is that by taking into account the full transaction
price of the dwellings, inevitably the price of land is incorporated into the index, which is at odds with
the scope of any CPI measure (the measurement of changes in the prices of consumption goods and
services). In order to circumvent this problem and ensure that the net acquisitions approach is
compatible with the CPI requirements, the value of the land is excluded from the calculation of the
expenditure weights related to dwellings. However, given the absence of data for land prices, the
separation of the structure and the land price components is made possible using various modelling
approaches (e.g. hedonic regressions). This implies that the resulting index will not be based solely on
actual monetary transactions but, rather, on a combination of actual and imputed prices.
Finally, the use approach method has two forms, namely the rental equivalence and user cost.
Generally, it assumes that the cost of owner-occupied housing consumption services is the
opportunity cost of occupying a property. The rental equivalence approach assumes that the
consumption stream from OOH is identical to that of rented property, ignoring favorable tax
treatment and capital market imperfections. The user cost approach assumes that owner-occupied
housing and rented property are distinct goods, and the cost of consumption services from owner-
occupied housing is equal to the opportunity cost of holding the home in terms of maintenance,
depreciation, credit costs and forgone investment income.
6 Moreover, the inclusion of interest payments implies that the index is sensitive to changes in the interest rates. For more details, see section 4 and the discussion related to the payments index of the ONS.

6
In Ireland, as already stated in the introduction, the CSO produces an owner-occupied housing cost
index utilizing two of the abovementioned approaches, namely the payments and the net acquisitions
approach. In particular, the payments approach is used for the computation of owner-occupied costs
for the domestic CPI, while the net acquisitions approach is used for the computation of the HICP
index, which is compiled on a quarterly basis and is submitted to Eurostat, as per EU regulations.
1. Net Acquisitions Approach
The choice of an index of owner-occupied housing is heavily influenced by how the consumption of
housing services and the associated costs are interpreted. The net acquisitions approach interprets
expenditure on land as an asset purchase and, consequently, outside the scope of the CPI.
Furthermore, the structure is treated as a durable consumer good for which the cost accrues in the
period of purchase. The approach measures the cost of additions to the housing stock of the
household sector, thus excluding transactions of existing dwellings between households. As such, it
measures the purchasing power of the household sector in terms OOH services as the cost of adding
new dwellings to the sector’s stock of housing. As is the case in the national accounts methodology,
these measures only include additions to the stock of structures, rather than transactions of land
ownership. However, unlike the national accounts, this approach measures these purchases as
purchases of consumption goods rather than capital goods.
Of the three primary approaches to the incorporation of owner-occupied housing (OOH) in the CPI,
the net acquisitions approach is the most conceptually simple, and is the stated preference of Eurostat
for inclusion in their HICP measure. The net acquisitions approach essentially treats owner-occupied
housing as a non-durable good, with services of purchases in a given period being fully accounted for
in that period. This decision avoids the issue of distributing the cost over the lifetime of the dwelling.
The approach implicitly assumes dwellings are made up of a pure asset component, the land, and a
purely consumption component, the structure. The price which is recorded is the per-unit cost of the
house which has been acquired by the household sector; this tends to be primarily composed of new
dwelling purchases, regardless of when consumption of the good starts and how it is paid for. This
method aligns with the stated conceptual bounds of the HICP, which specify the index should include
only monetary transactions associated with the purchase of consumption services by the household
sector. Moreover, this method isolates the cost of the consumption, independent of the means by
which it is financed (mortgage costs). In that regard the approach is a similar treatment to other

7
components of the inflation index. However, in calculating OOH in this manner, it should be noted
that the net acquisitions approach does overlook the consumption services provided by the existing
stock of housing, the consumption services provided by land and the conceptual difficulty of defining
the structure of a house as a non-durable consumption good (that is, disregarding the fact that the
structure will provide a future stream of consumption services to the household).
Brief Overview of method
The net acquisitions method is explored in detail in Eurostat’s “Technical manual on Owner-Occupied
Housing and House Price Indices” (see Eurostat (2017)). Here, we provide an overview of the basic
method used in the compilation of the index; we discuss the CSO’s contribution towards an OOH index
measure, which is provided to Eurostat on a quarterly basis, and we also focus on several key issues
involved in the calculation of the index.
The expenditure of households on owner-occupied housing consumption services in each period is
defined under net acquisitions by Hill et al. (2019) as
𝑌 = 𝑁𝑃 + 𝑀&𝑅 + 𝑇𝐶 (1)
• 𝑌 - expenditure on OOH consumption services
• 𝑁𝑃 - net purchases of dwellings by the household sector excluding land
• 𝑀&𝑅 - expenditure on major renovations and repairs
• 𝑇𝐶 - all service costs associated with the acquisition and ownership of homes, including
taxes, real estate fees etc.
This is simply the household sector’s expenditure on new housing, accounting for the costs associated
with such acquisitions.
In general, the owner-occupiers’ housing related expenditures can be classified into two broad
categories, namely “Acquisition of Dwellings” and the “Ownership of Dwellings”.
The “Acquisition of Dwellings” category is the most significant component of these expenditures.
Indicatively, in 2018, 69.2 per cent of overall OOH consumer expenditure was attributed to new
dwellings in Ireland. This term captures the additions to the household sectors stock of owner-
occupied dwellings through purchases of new dwellings (which are assigned the largest weight), self-

8
build projects by the owner-occupier and major renovation expenditures. Purchases of new dwellings
can be expressed as the difference between dwelling purchases and sales of the household sector,
excluding transactions of land.
In order to provide a clearer definition of what the net purchases of new dwellings encompass,
consider an exposition analogous to that given by the Eurostat manual. Define
• ℎ/ℎ - purchases by households from other households (within sector transactions)
• 𝑛ℎ/ℎ - purchases by the non-household sector from households (e.g. a home which was
previously owner occupied being put on the rental market)
• ℎ/𝑛ℎ - purchases by the household sector from the non-household sector (purchases of
new dwellings, self-built homes, homes previously rented now being owner-occupied etc.).
Now net purchases of dwellings by the household sector can be defined as
𝑁𝑃 = (ℎ/𝑛ℎ + ℎ/ℎ) − (ℎ/ℎ + 𝑛ℎ/ℎ) = ℎ/𝑛ℎ − 𝑛ℎ/ℎ = 𝑃 − 𝑆 (2)
where 𝑃 denotes total purchases of dwellings by households and 𝑆 denotes total sales of dwellings by
households. This shows that net purchases of dwellings by the household sector can be interpreted as
the difference between total purchases and total sales by households. The exclusion of land is a key
feature of the approach, and one, which raises several difficulties. Most fundamentally, the
separability of the land upon which the house is built and the structure itself is conceptually difficult.
To see this, note that expenditure on private rental accommodation is interpreted as consumption
expenditure. Yet, the cost of rental expenditure for identical structures varies significantly between
locations, even for houses of a similar quality.7 Consumption services for a given home are effectively
dependent on the value of the land upon which it is built. The net acquisitions approach, which treats
land as purely an asset, should estimate similar costs for homes in Leitrim and Dublin 2, when in reality
much of the variance in rents, which are purely consumption service purchases, are due to variations
in location and thus the underlying land rents. If the consumption stream derived from a unit of
housing is dependent on its location, and, thus, the land on which it is built, then only considering
purchases of structures could, in theory, cause a mismeasurement.
7 For example, the average monthly rent for a five-bedroom house in Leitrim in 2019 was €683, according to
the Daft.ie 2019 Q1 rental price report, while the monthly rent of a corresponding house in Dublin 2 was €3,599, over five times higher (Daft.ie-Lyons, 2019).
9
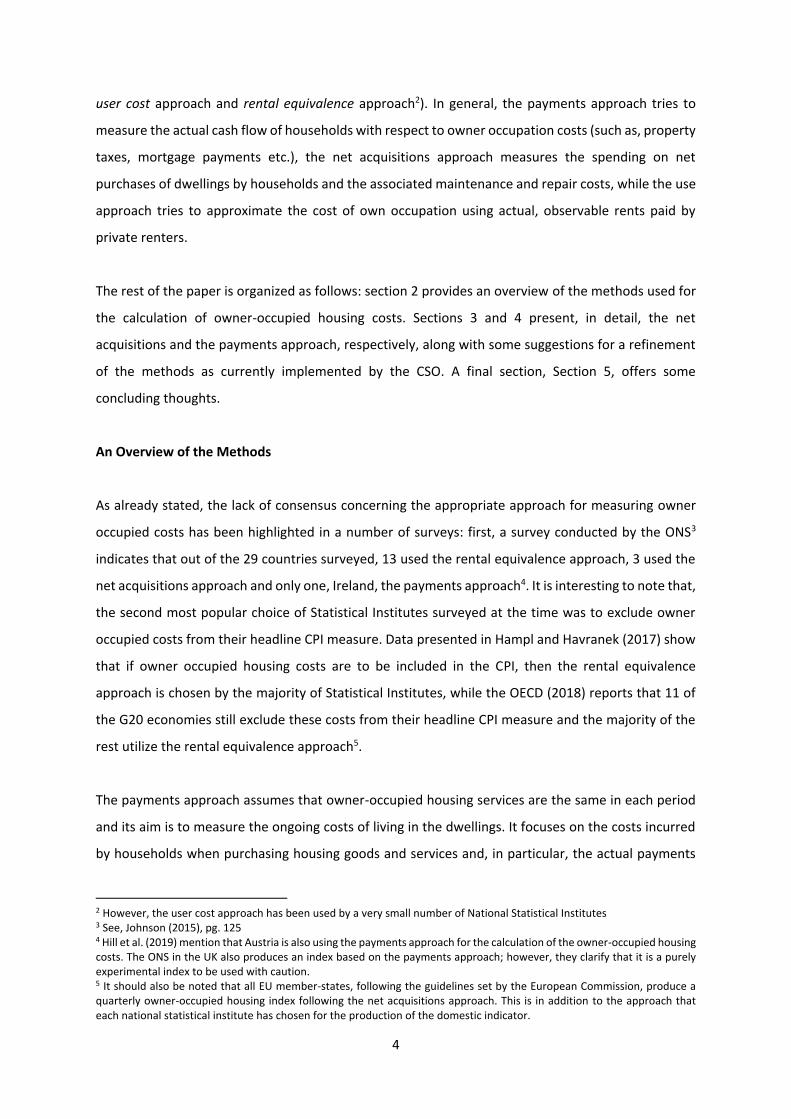
In practice, Eurostat has recommended a “gross price, net weight” index, which means that weights
are calculated excluding land values, while the price index is calculated using gross prices, which
include the value of land. This same approach is applied by the CSO, with a simple site-to-building cost
(SBC) ratio. The ratio is calculated from Stamp Duty data, sourced from the Revenue Commissioners.
Though most Stamp Duty does not include a separation of property cost by site and building costs, 10
per cent of submitted forms do provide values for site and building costs. A ratio of the total cost of
these two sub-items is generated for each year and this average ratio is applied to total expenditure
on the purchase of new dwellings to exclude land values.8
The “Self-build” expenditure category comprises dwellings built by individuals themselves, or by
professional builders employed by said household, for their own occupation. The “Major renovations”
expenditure generally increases both the value and quality of a dwelling in an effort beyond preserving
value which would otherwise be considered routine maintenance. The household is therefore
acquiring greater effective services from occupying by enhancing the structure itself. As a result, both
of these items contribute to the total expenditure based on the acquisition of dwellings. Finally, the
‘Other services related to the acquisition of dwellings’ acts as the last item with respect to Acquisition
of Dwellings and in the Irish case is associated with costs relating to estate agent commissions, legal
conveyance fees, engineer & surveyor reports as well as stamp duty payments. This category is
assigned the smallest weight in terms of the calculation of the overall index. On a country-by-country
basis, these other service costs often comprise of various differing items, each set being deemed most
appropriate in representing country-specific housing market characteristics.
The second major item with respect to compiling the OOH (NA) index relates to expenditure attributed
towards the ownership of dwellings. This is comprised of “Major repairs and maintenance”
expenditures, which represent more than 90% of the weights attributed to this item, “Insurance
connected with dwellings” and “Other services related to the ownership of dwellings”. Major repairs
and maintenance captures any activities, which preserve the current value and expected lifespan of
an existing dwelling. Insurance acts as another country-specific tool in which contributing data can
vary across member states. In Ireland’s case, though both building insurance and mortgage protection
are listed by the CSO in constructing this measure, mortgage protection is given a zero weight due to
no data currently being available for this item. Other service costs are explored on an individual
8 In 2018, approximately 3,700 transactions included such figures, suggesting land comprised of 30 per cent
of total OOH purchases of new dwelling. Rather than taking a simple average of these two totals and applying this discount factor to dwellings values, it would be advisable to compare the features of this sub-sample of Stamp Duty returns to the overall sample and form a weighted average of the ratio.

10
country by country basis but can include the banking fees linked to mortgages, legal certificate costs,
valuation services, ongoing property tax payments and potentially required costs associated with
energy efficiency and gas safety certificates. In the Irish case, the CSO uses costs associated with
attaining BER certificates and valuation costs as its two service charges linked to the ownership of
dwellings.
Important aspects of implementation
• Weights
The Eurostat technical manual highlights some of the main issues involved in the implementation of
this approach, both in terms of estimating weights and house price indices. The approach states that
national accounts are used to calculate the weight of OOH housing in the CPI. Data are derived from
the gross fixed capital formation section of national accounts, which is at odds with the assumption
that dwellings are a purely consumption good.
In order to obtain weights for the ‘Acquisitions of new dwellings’ and the ‘Major repairs and
maintenance categories’, the actual rentals weight from the HICP is utilized, combined with data from
the national accounts and, in particular, the Gross Fixed Capital Formation account. The following
equation is used:
𝑤𝑁𝐴&𝑀 =𝐸𝑋(𝑅𝐹𝐶𝐹)
𝐸𝑋(𝑃𝑅)𝑤𝑅 (3)
where 𝑤𝑅 is the HICP weight for actual rentals, 𝐸𝑋(𝑅𝐹𝐶𝐹) is the expenditure on residential fixed
capital formation by households and 𝐸𝑋(𝑃𝑅) is the expenditure on actual rentals for housing, as
estimated in the national accounts. These weights can be further decomposed into two components,
one reflecting the expenditure on the purchase of dwellings and another reflecting major repairs and
maintenance.
Since what is needed for the computation of an owner-occupied housing cost index is an estimate of
the expenditures on owner-occupied residential dwellings, equation (3) is modified as follows:
𝑤𝑁𝐴&𝑀 =𝐸𝑋(𝑅𝐹𝐶𝐹)[1−𝛼]
𝐸𝑋(𝑃𝑅)𝑤𝑅 (3)
where 𝛼 denotes the proportion of the expenditure on residential dwellings devoted to the rental
market. The Eurostat manual indicates that information on 𝛼 can sourced either from the national
accounts or from the census (in particular, information regarding tenure of the stock of dwellings
based on which an estimate of the proportion of buy-to-let can be obtained).
The data used in the calculation of these weights should be primarily sourced from the national
accounts, as this is a reliable and consistent source across EU member states. Table 1 gives the

11
recommended data sources for the various categories of expenditure under this approach, given by
Eurostat. It should be noted that data regarding the household sector’s acquisition of existing
dwellings is absent from the index, essentially meaning the index exclusively covers the acquisition of
new dwellings. In practice, Ireland is among eleven countries9 that contribute weights toward the net
purchase of existing dwellings between the household and non-household sectors, although these
expenditure levels are quite marginal relative to other forms of acquisition10.
Table 1: Sources of weights data recommended by Eurostat
Acquisition of Dwellings Ownership of Dwellings
OOH (NA)
Indices
Acquisitions
of New
Dwellings
(exc. Land)
Self Builds &
Renovations
Existing
Dwellings
new to the
OOH Sector
Services
Related to
Acquisition
Major Repairs
&
Maintenance
Insurance
Connected
with Dwelling
Services
Related to
Ownership
Source of
Weight
Data
Gross Fixed
Capital
Formation
Gross Fixed
Capital
Formation
No Weight
Household
Final
Consumption
Expenditure &
Gross Fixed
Capital
Formation
Household
Final
Consumption
Expenditure
Household
Final
Consumption
Expenditure
Not Addressed
Source: Eurostat (2017)
The use of national accounts data to derive weights for consumption services from OOH is somewhat
inconsistent, given the fact that this expenditure is included in the national accounts as gross fixed
capital formation. In fact, the national accounts system recognises owner-occupied households as
unincorporated businesses, providing rental services to themselves, which are recorded as part of
national income (Eurostat, 2017). This essentially amounts to separating the acquisition of a house as
capital expenditure and use of the house as consumption in each period.
In the case of Ireland, Stamp Duty data is instead used by the CSO to inform weight estimates for both
acquisitions of “New Dwellings” and ‘Existing Dwellings New to Households’. The national accounts
are used to inform weights of “Self-Builds”, “Net Major Renovations”, and “Major Repairs and
Maintenance”. Remaining items, mostly ‘other services’ linked to the acquisition and ownership of
property, are estimated through a combination of average prices taken from CPI data multiplied by
the number of relevant transactions for the specific period.
9 According to the Owner-Occupied Housing Price Index (last updated 10th July 2019), these countries include:
the Czech Republic, Denmark, Ireland, Latvia, Lithuania, the Netherlands, Austria, Poland, the UK, Iceland and Norway.
10 It should also be noted that the current weight assigned to the “Existing dwellings new to the OOH sector” category is zero

12
• Price Indices
Although the net acquisitions method is the stated preference of Eurostat due to its reliance on
monetary as opposed to imputed transactions, some element of imputation is still required. While the
weights of OOH in the HICP could indeed be calculated directly from measured data, the construction
of house price indices does require some form of quality adjustment usually through estimation, in
order to account for the inherent heterogeneity of dwellings. This quality adjustment is not unique to
the OOH index but is also common across various components of the consumer price index.
Several methods for generating indices of house price indices are discussed by Diewert, Nakamura
and Nakamura (2009), based upon a variant of the repeat sales method introduced by Summers
(1973). These methods essentially estimate a time trend for repeat sales, and assume this trend holds
for dwellings of all characteristics. A preferable method is described by the Eurostat technical manual
and utilised by Hill et. al. (2019), which allows for the price of given characteristics to change over
time. This method gives the price index as the geometric mean of hedonic indices based on data from
sales in each period. The model essentially assumes a log linear relationship between the price of a
dwelling and the various characteristics which determine this price (expect a given rise in price due to
a percentage increase in explanatory variables e.g. size). The model is estimated for sales in each
period, with estimated models then being used to calculate the expected price of a dwelling with given
characteristics in any year. The index of price increases from one year to the next can be calculated as
the change in the estimated price of the house sold in one of the two periods. In practice it may be
preferable to use the geometric mean of both indices11. A more rigorous discussion of the construction
of such indices is provided below.
A hedonic model is estimated from sales in each period, which usually takes a log linear form
ln(𝑃𝑡,𝑖) = 𝒙𝒕,𝒊′ 𝜷𝒕 + 휀𝑡,𝑖 (4)
where 𝜷𝒕 is a vector of coefficients, 𝒙𝒕,𝒊 is a vector of characteristics, and 휀𝑡,𝑖 is an error term. The
estimated vector of coefficients �̂�𝒕 can be used to create an estimated value for a home of any
11 This is analogous to the discussion of using current or base period weights in index construction. As Blinder
(1980) points out a Laspeyres index (base period weights) tends to overstate price inflation while a Paasche index underestimates it, due to ignored substitution effects. This motivates taking the geometric mean of both indices.
13
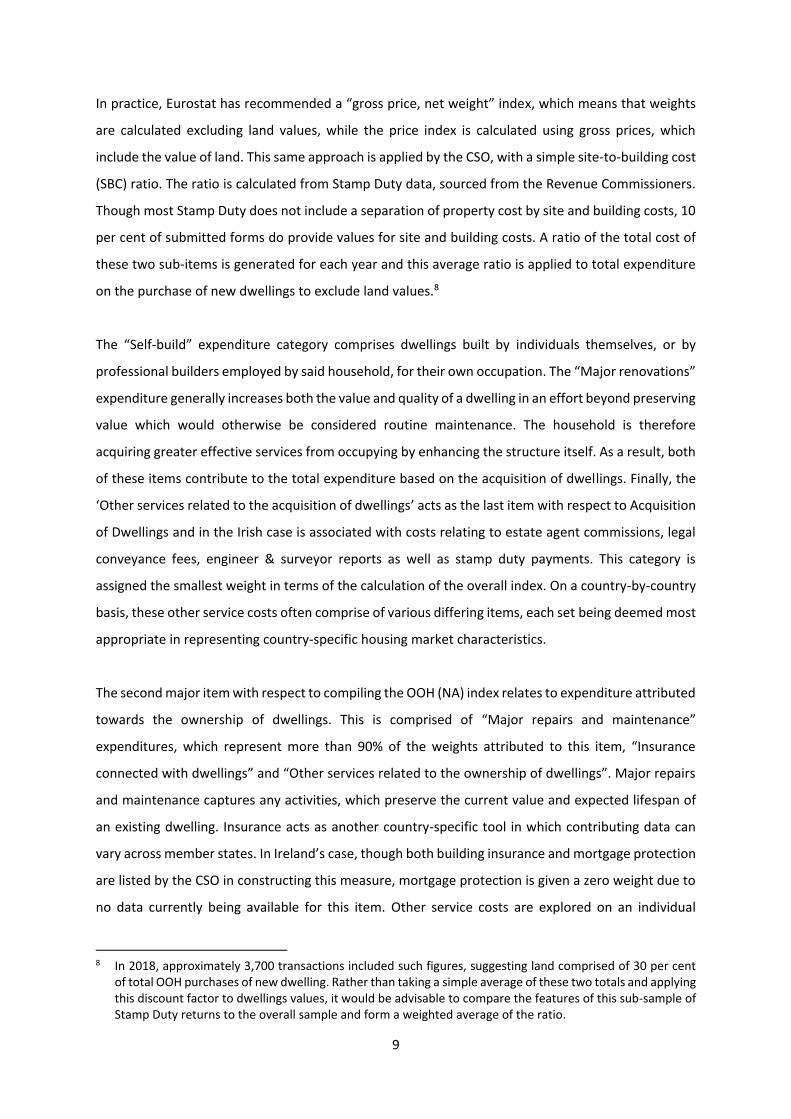
characteristics 𝒙𝒕,𝒊. The hedonic index is then generated by the equation
𝑃𝑡+1
𝑃𝑡= ∏ [
�̂�𝑡+1(𝒙𝒕,𝒊)
𝑝�̂�(𝒙𝒕,𝒊)
𝑛𝑡𝑖=1 ]𝑛𝑡 = ∑ exp (
1
𝑛𝑡
𝑛𝑡𝑖=1 𝒙𝒕,𝒊
′ [�̂�𝒕+𝟏 − �̂�𝒕]) (5)
Where �̂�𝑡+1,ℎ(𝑥𝑡,ℎ) is the estimated price in period t of a house with characteristics 𝑥𝑡,ℎ from the
hedonic model, and 𝑛(𝑡) is the number of houses sold in period t. The second relation follows from
the log linear form of the hedonic model (4), and shows that the change in prices is the sum of changes
in the price of the relevant characteristics (including a constant term). The final index is taken as the
geometric mean of this index and the equivalent index calculated using houses sold in period t+1. Of
the five primary models suggested by the Eurostat manual, all involve the estimation of a hedonic
model of house prices to account for heterogeneity in houses sold.
A similar kind of estimation is necessary to estimate the contribution of land to the price of a house,
so the price of the consumption aspect of the dwelling (the structure) can be estimated. Such a
method is implemented by Larson (2015). This method assumes the price of a dwelling is a linear
combination of the value of the land upon which it is built, and the structure, given by
𝑃𝑖 = 𝛼𝐿𝑖 + 𝛽𝐴𝑖 + 휀𝑡,𝑖 (6)
where 𝐿𝑖 is the land area of the dwelling and 𝐴𝑖 is the floor area of the structure. Thus 𝛼 can be
interpreted as the price of land, and a land price index can be generated from the estimated values �̂�.
Kuminoff and Pope (2013) estimate a similar model, with a log functional form similar to (4), with the
log area of land included as an independent variable in the equation.
As already mentioned, Eurostat have stated that member states should use gross price indices rather
than using hedonic methods to account for the price of land. This implies that unless the value of land
remains constant over time, the index will capture some movement in asset prices. Knoll et al. (2014)
use data for 24 advanced economies since 1870 to provide evidence that the bulk of house price
increases have historically been due to rising land values, rather than construction costs. However, as
we have argued before, it is impossible in practice to separate the value of a dwelling in terms of an
asset and a consumption goods using hedonic methods, unless the price is a separable function of the
asset part and the consumption component, and a suitable variable is available to isolate the asset
component.

14
Overall, the Eurostat approach essentially assumes that changes in the price of the asset component
of the dwelling are proportional to the increases in price of the consumption component (the
structure).
Implementation for CSO
Constructing an OOH index and RPPI
The Eurostat manual states that an OOH index should be calculated which is distinct from the broader
Residential Property Price Index (RPPI). Crucially the OOH index only covers net acquisitions rather
than all transactions of dwellings, and also includes renovations and other costs. The CSO index covers
all purchases by the household sector, therefore excluding self builds, renovations and services. It also
includes between household transactions, which are outside the scope of the HCIP under the net
acquisitions approach. The CSO have identified households and non-households from the stamp duty
data, so excluding between household transactions is relatively straightforward. Any stamp duty
returns including a first name are considered household sector activities whereas submissions under
company names are tied to the non-household sector.
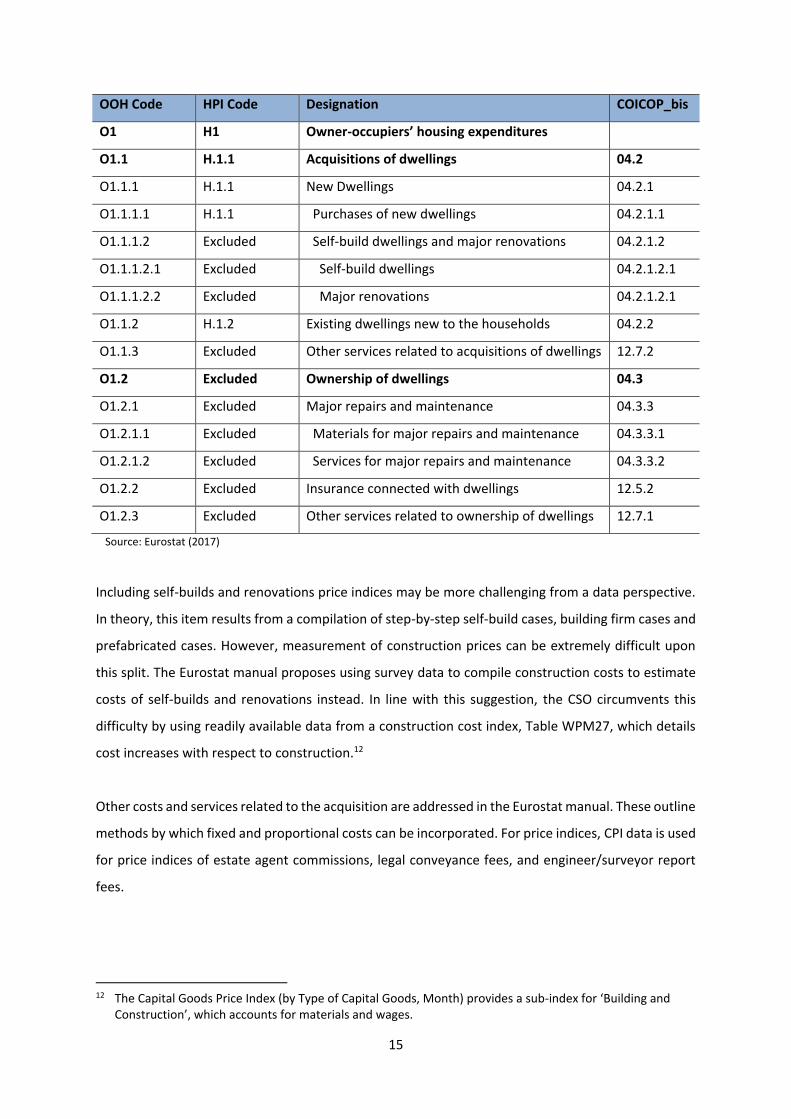
The Eurostat manual makes a clear distinction between the house price index and the index for OOH
to be used in the HCIP, as illustrated in Table 2. Their comparison between the two indices is given as
follows:
“From Table 2, it is clear that the [House Price Index] HPI covers market transactions of residential
properties, regardless of which institutional sector they were bought from and the purpose of the
purchase. The two categories of ‘new dwellings purchased’ and ‘purchase of existing dwellings’
(HPI categories H1.1 and H1.2) enter into the compilation and should conceptually be more or less
comparable with the OOHPI categories O.1.1.1.1 and O.1.1.2 respectively.
Dwellings purchased by households for investment purposes (e.g. for renting) are covered by the
HPI as are dwellings purchased by companies. *(RPPI excludes this)
Major repairs and other services related to the purchase of a dwelling, which are covered in the
OOHPI, are ruled out from the HPI since the emphasis given in this indicator is on the price of a
dwelling and not on the total cost of acquiring, owning and maintaining it. Likewise, self-builds
could be excluded in the HPI on the grounds that no market price exists.”
Table 2: Classification system from price indices related to dwelling acquisition and ownership
15
OOH Code HPI Code Designation COICOP_bis
O1 H1 Owner-occupiers’ housing expenditures
O1.1 H.1.1 Acquisitions of dwellings 04.2
O1.1.1 H.1.1 New Dwellings 04.2.1
O1.1.1.1 H.1.1 Purchases of new dwellings 04.2.1.1
O1.1.1.2 Excluded Self-build dwellings and major renovations 04.2.1.2
O1.1.1.2.1 Excluded Self-build dwellings 04.2.1.2.1
O1.1.1.2.2 Excluded Major renovations 04.2.1.2.1
O1.1.2 H.1.2 Existing dwellings new to the households 04.2.2
O1.1.3 Excluded Other services related to acquisitions of dwellings 12.7.2
O1.2 Excluded Ownership of dwellings 04.3
O1.2.1 Excluded Major repairs and maintenance 04.3.3
O1.2.1.1 Excluded Materials for major repairs and maintenance 04.3.3.1
O1.2.1.2 Excluded Services for major repairs and maintenance 04.3.3.2
O1.2.2 Excluded Insurance connected with dwellings 12.5.2
O1.2.3 Excluded Other services related to ownership of dwellings 12.7.1
Source: Eurostat (2017)
Including self-builds and renovations price indices may be more challenging from a data perspective.
In theory, this item results from a compilation of step-by-step self-build cases, building firm cases and
prefabricated cases. However, measurement of construction prices can be extremely difficult upon
this split. The Eurostat manual proposes using survey data to compile construction costs to estimate
costs of self-builds and renovations instead. In line with this suggestion, the CSO circumvents this
difficulty by using readily available data from a construction cost index, Table WPM27, which details
cost increases with respect to construction.12
Other costs and services related to the acquisition are addressed in the Eurostat manual. These outline
methods by which fixed and proportional costs can be incorporated. For price indices, CPI data is used
for price indices of estate agent commissions, legal conveyance fees, and engineer/surveyor report
fees.
12 The Capital Goods Price Index (by Type of Capital Goods, Month) provides a sub-index for ‘Building and
Construction’, which accounts for materials and wages.

16
- Estate Agent Commissions price index uses CPI data relating to ‘Professional and Legal
Services’, specifically listed as ‘Estate agents fees’. Its weight is determined by National
Account data.
- Legal conveyance fees uses ‘Solicitors fees’ from the same category of miscellaneous
consumption items. Its weight is determined by National Account data.
- Similarly, to BER certificates’ CPI measure, engineer/surveyor fees provided for through
‘Engineers/surveyors fees’ listed under the same heading of ‘Professional & legal services’.
To estimate expenditure, it uses an average price of such services and multiplies by the
number of net purchases (new + existing transactions) for a total expenditure measure.
-
The approach taken with respect to Stamp duty is different. An index dealing with taxes that are
proportional to dwelling transaction values is measured as it would be for existing HICP framework on
the treatment of service charges proportional to transaction values. The overall expenditure on
housing, according to Stamp Duty data, is calculated. The percentage share of stamp duty with respect
to this total expenditure value is calculated and then compared against the same ratio from a fixed
base-period. Adjusting for changes in house prices, the percentage change in this Stamp Duty-to-
Housing Value ratio is taken.13
Price indices relating to the costs of ownership are split into “Major repairs and Maintenance”,
“Insurance connected to the dwelling” and “Other services related to the ownership of the dwelling”.
The source of the weights for the “Major repairs” category is data from the EU SILC survey, while for
the “Insurance” category the weights are based on data sourced from the Central Bank of Ireland.
According to the CSO template sent on to the ESRI, dwellings insurance entirely captures the ‘Building
Insurance’ aspect of the OOH index. Mortgage protection uses ‘dwelling insurance’ as a proxy for now
but maintains a zero weight contribution to the index’s overall value.
For the last two items, which form the ‘Other Services related to the Ownership of Dwelling’, BER
Certification data are utilized and the weight is generated using an average price of such services and
multiplying it by the number of transactions. In this case, the transactions used are taken from the
Sustainable Energy Authority of Ireland (SEAI transactions), who issue BER certificates. To calculate a
weight, the index uses an average price of such services and multiplies by the number of purchases
(existing transactions) for a total expenditure measure.
13 See Eurostat (2017) Technical Manual on OOH and HPI, Section 3.9.2 for details on Treatment of Costs
Proportional to the Transaction Value.

17
Improvements to the construction of price indices
Based on the CSO technical paper, we propose several potential improvements for the estimation of
house price indices (both for the RPPI and OOH indices).
• Hedonic method
The CSO use a rolling time dummy hedonic method to estimate house price inflation. This method
assumes the price of relevant characteristics (Eircode, floor area, type and deprivation index) are
constant over the duration of the sample, with price differences driven by trend variables (time-
dummies).
The model estimated follows the process
𝑙𝑛𝑝𝑖𝑡 = 𝛿𝑡𝑑𝑡 + 𝒙𝒊𝒕𝛽 + 휀𝑖𝑡 , 𝐼𝑡 =𝑒𝛿𝑡
𝑒𝛿𝑡−1. 𝐼𝑡 (7)
With 𝑑𝑡 representing time dummy variables. This method is conceptually simple and works well if we
have a small sample size, as the full panel is used in estimation. It also avoids the distinction between
indices calculated using transaction data from periods 𝑡 and 𝑡 − 1, as the time dummy is constant
across dwellings. This assumption however comes at the cost of some accuracy, as changes in
preferences, input prices etc. could plausibly cause the price of distinct characteristics to change. The
assumption that dwellings of all type experience identical trends of inflation, even in the short term,
seems implausible based upon this reasoning.
A more comprehensive hedonic method could potentially be utilized, if sample sizes for each period
are sufficiently large. The model described by equations (4) and (5) describe the most comprehensive
of such models, as recognized by Eurostat. These models allow the price of certain characteristics in
each period to vary, thus incorporating price changes of individual qualities as well as aggregate
inflation. However, this method requires the estimation of a hedonic model of price increases in each
period. Therefore, whether this method would be practically applicable depends on the volume of
transactions in a given period. This issue could potentially be surmounted by assuming that the price
of existing dwellings is determined in the same manner as dwellings new to the sector. This would
allow the use of data for all transactions to be used in estimating the coefficients of equation (4). The
data specific to net acquisitions would then be used to calculate the price index using these estimates,
as in (5). On an intuitive level, it is reasonable to suggest that dwellings purchased from outside the
household sector provide the same consumption services as those purchased from other households,

18
and thus follow the same data generating process. One caveat which may cause new dwellings to
follow a distinct data generating process than existing dwellings is self builds. Self-builds are by
construction unique homes which are built to the owner’s specification and customization, therefore
they may not be readily substitutable by existing dwellings. However, given that self-builds are not
included in the presently used data, this should not be an issue, implying that the assumption seems
reasonable.
2. Payments Approach
As we saw in the previous section, the net acquisitions approach aims to measure the spending on net
purchases of the consumer element of housing and all the related costs, limiting its scope to the
purchases that occur outside of the household sector, i.e. excluding all the within the household sector
purchases.
An alternative approach to calculating owner-occupied housing costs is the payments or cash-flow
approach. As the name suggests, this approach focuses only on the actual cash flows that are related
to expenses associated with owner-occupied housing, including mortgage interest payments,
insurance, property taxes and maintenance and repair costs among others.14
Despite the fact that this approach has been referred to as a sometimes reasonable compromise when
it comes to accounting for owner-occupied housing costs (Diewert (2003)), it is the least common
approach utilized by national statistical institutes, currently being used only in Austria and Ireland15.
The relevant literature has identified a number of drawbacks that point against the use of the
payments approach (see Goodhart (2001), Diewert (2003), Diewert and Shimizu (2018) and Hill et al.
(2018)). The main disadvantage of the payments approach is the inclusion of mortgage interest
payments based on nominal rates. Although this seems to be quite intuitive, as mortgage payments
are one of the major expenses of households concerning owner-occupied housing, it is incorrect from
an analytical point of view. Since a mortgage interest payment reflects the cost of money rather than
the cost of consumption it does not fall within the scope of the CPI (Eurostat (2017)) and, as such, its
inclusion causes the payments approach to be unsuitable for purposes such as inflation targeting
14 The ILO manual mentions that cash flows such as down payments, mortgage principal repayments and payments for alterations and additions do not fall into the scope of the payments approach, since they are related to capital transactions that do not alter the balance sheet of the household – see ILO (2004) 15 As already mentioned, the ONS produces an owner-occupied housing index based on the payments approach, but they use it as an experimental index only, rather than the headline measure for such costs.

19
(Johnson (2015)).
Mortgage interest payments are mainly affected by changes in the domestic mortgage interest rates
and the general level of inflation. The importance of changes in the nominal interest rates are evident
from recently published data by the ONS. Starting with the first quarter of 2018, and following an
increase in base rate of the Bank of England, changes in mortgage payments had a positive
contribution to the changes in the owner occupied housing index for the first time since the second
quarter of 2015. In particular, the increases in the mortgage payments have been contributing, on
average, almost 1.5 percentage points to the quarterly growth of the index up to the first quarter of
2019 (last available data).
In assessing the implications for general inflation of the use of the payments approach, Diewert (2003)
argues that in periods of high general inflation mortgage interest rates will increase. However, due to
its construction, the index does not provide any offsetting benefit to house owners, as the
appreciation of the housing asset is not taken into account. Diewert and Shimizu (2018) contend that
the approach is subject to the following objections as a result; it ignores the opportunity costs of
holding the equity in the owner occupied dwelling, it ignores depreciation and it uses nominal
interest rates without any offset for inflation in the price of land and the structure. Furthermore,
Diewert and Shimizu (2018) argue that, in general, the payments approach will tend to lead to much
smaller monthly expenditures on owner occupied housing than other approaches, except during
periods of high inflation. In such a case the nominal mortgage rate term may become very large
without any offsetting item for inflation. However, given that the purpose of such a measure is
the incorporation of owner-occupied housing costs into the CPI measure, it seems
counterintuitive to include offsets for inflation.
Another issue that has been raised regarding the usefulness of the payments approach is related to
the fact that it has become more common for households to draw down on the equity they have on
their home and take new mortgages in order to finance other activities. This implies that, if the cost
of such activities is significant, then it would be necessary to allocate a proportion of the overall
mortgage interest charges as a cost of general financial services, else a (potentially significant) miss-
measurement will be present. The issue goes well beyond refinancing. This kind of measure is
sensitive to how housing purchases are financed via debt and equity. An increase in equity financing
– such as via the Irish mortgage rules – does not actually reduce the cost of home ownership, nor does
a lengthening in the average term of a mortgage.

20
Finally, caution needs to be exercised when the costs of repairs and maintenance are taken into
account, as these costs are irregular by nature and constitute a significant part of the owner occupied
housing costs.
One argument for using a payments approach based owner-occupied housing index is provided by
Fenwick (2009, 2012), who argues that statistical agencies should produce a range of indexes that suit
different purposes (not necessarily the pricing of owner-occupied housing services).
Overall, the evidence from the literature indicate that the payments approach does not seem to be
appropriate for pricing the services stemming from owner-occupied housing, however, they are useful
in terms of comparison with the other approaches employed and can also be useful for other purposes
(such as the issue of housing affordability).
In what follows, we will focus on the implementation of the payments approach as is currently
implemented by the CSO, along with the presentation of some initial results from an alternative
owner-occupied housing cost index based on basic payments.
Current Methodology for OOH
In this section, we will summarise and review the current methodology with a focus on mortgage cost,
which accounts for the largest share of OOH costs.
Mortgage Cost
The mortgage cost index (MCI) is calculated as
𝑀𝐶𝐼𝑡 = 𝑅𝑡 × ∑ 𝐻𝑡−𝑖𝑤𝑡−𝑖𝑇𝑖=1 (8)
where
𝑅𝑡 = Current average mortgage interest rate
𝐻𝑡 = National house price index
𝑤𝑡−𝑖 = Mortgage weights
𝑇 = Length of mortgage, assumed to be 240 months (20 years).

21
The source for the average interest rate 𝑅𝑡 is a monthly survey of seven banks which report average
interest rates of existing mortgages by mortgage type. 𝑅𝑡 is calculated as the weighted average across
mortgage types and banks where the weights are taken from the Central Banks’ Credit and Banking
Statistics.16
The house price measure 𝐻𝑡 is the Residential Property Price Index (RPPI) published by the CSO. The
RPPI is incorporated with a 2-month time lag due to a delay in the publication of the RPPI.17
The summation term ∑ 𝐻𝑡−𝑖𝑤𝑡−𝑖𝑖 is an indicator of mortgage debt outstanding, which the ILO (2014)
refers to as the debt index. The CSO refer to the weights 𝑤𝑡−𝑖 as adjusted capital outstanding. They
are calculated as the product of two components: the capital outstanding and the termination factors.
Capital outstanding is the remaining mortgage at time 𝑡 − 𝑖 for an exemplary 20-year fixed-rate
mortgage. The mortgage outstanding after 𝑡 years is
𝑀𝑡 = 𝑀𝑡−1 × (1 + 𝑅) − 𝑃 for 𝑡 = 1, … ,20. (9)
where 𝑀0 is the initial mortgage, 𝑅 the fixed interest rate and 𝑃 denotes the payment. In the latest
worksheet file available, a €10,000 mortgage with 8.94% fixed interest rate and annual payments of
€1,090.78 was used.
Termination factors are the share of mortgages that have not been terminated “early” after 𝑡 years.18
The CSO states that their methodology is based on Section 10.20 in ILO (2004). Indeed, the ILO propose
to derive the MCI as the product of a debt index and a nominal interest index as described above.
However, the CSO seems to deviate from the ILO approach when calculating the weights. CSO (2016)
states that “the relative weights decline with the age of mortgage reflecting the reduction in interest
payable over time” (2016, p. 23). The ILO on the other hand recommends to choose the weight to
reflect the age profile of mortgages based on data from mortgage providers (§10.32). We therefore
recommend that the CSO explores options to extend the survey with mortgage providers in order to
get detailed data on existing mortgages and their age profile.
In particular, a potential refinement of the approach that could be investigated is the use data from
each bank regarding the average repayment across loans and the number of respective customers.
Based on these data an average repayment figure could be obtained and its changes could be tracked
16 https://www.centralbank.ie/statistics/data-and-analysis/credit-and-banking-statistics 17 We refer to the RPPI documentation for details on the compilation of the house price index:
https://www.cso.ie/en/methods/prices/residentialpropertypriceindex/methodologydocuments/ 18 The data source of these factors is not known.

22
over time. A potential advantage of this refinement is that it will incorporate the heterogeneity of the
repayment schedules faced by households, given that each one faces different interest rate types,
terms etc.
Technical Remarks:
1. The capital outstanding depends on the interest rate 𝑅𝑡. It seems that in the calculations a
fixed interest rate was assumed and not updated on a regular basis. This is although average
interest rate data is collected by the CSO.
2. The calculation of capital outstanding assumes a 20-year fixed-rate mortgage. While this
might be a valid simplifying assumption, the CSO could explore whether it is feasible to
directly collect data on average mortgage payments from the building societies.
Other Items
The other goods and services that are associated with OOH follow a more standard approach where
the price development is tracked over time based on supplier surveys. For example, the building
material component is based on a survey of 4 suppliers and 4 goods, which are chosen to represent a
general basket of building materials. A complication arises when calculating expenditure weights for
house building insurance. The CSO derives weights based on actual gross payments whereas Eurostat
and the HICP use a net approach that incorporates payments of insurance payments.
Constructing a Basic Payments-based OOH Index
We construct three variations of a simplified OOH index referred to as OOH1, OOH2 and OOH3. The
data source is the CPI database with a detailed breakdown of 615 items included in the CPI. We have
data available for January 2017 to April 2019. In the calculation of the indices we have incorporated
the change in base weights in January 2018 and January 2019.
OOH1 uses a narrow definition of the OOH index that only includes the OOH-related items that are
included in the CPI but are excluded from the HICP (see above). OOH2 are services for the maintenance
and repair of the dwelling. OOH3 also adds materials for the maintenance and repair of the dwelling.
The assumption is that these goods and services are predominantly purchased by owner-occupiers
and landlords. The following table provides a list of items included in OOH1 and OOH2.

23
Table 3: Item list for three alternative OOH indices
OOH1 • 4.2.1 (1) Mortgage interest
• 4.3.1 (8) Building materials
• 12.5.2 (2) House insurance - contents
(non-service)
• 12.5.2 (3) House insurance - dwelling
• 12.7 (10) Miscellaneous goods &
services
OOH2 includes OOH1 plus: 4.3.2 Services for the maintenance and repair of
the dwelling:
• Plumbers services
• Electricians services
• Services for maintenance of heating
systems
• Painters services
• Carpenters services
• Other house maintenance services
OOH3 includes OOH2 plus: 4.3.1 Materials for the maintenance and repair
of the dwelling:
• Floor Tiles
• Paint
• Paint Brush
• Paint roller
• Varnish
• DIY household maintenance products
• Taps/Mixer Taps
We should note that the analysis of this section excludes stamp duties, which should be included in a
payments-based OOH index. Thus, the following preliminary results have to be interpreted with

24
caution.
We compare the indices OOH1-OOH3 with the joint index of private and local authority rents, which
are incorporated in the CPI (4.1.1). Figure 2 reveals a significant discrepancy between rental price
growth and OOH cost estimates based on a simplified payments approach; see also Figure 2.A in the
Appendix. Over the time period considered, rental data suggests a 13.7% increase in OOH costs, while
the three payments-based indicate cost increases by between 2.1% and 2.4%.
Figure 2: OOH1, OOH2 and OOH and rental price index
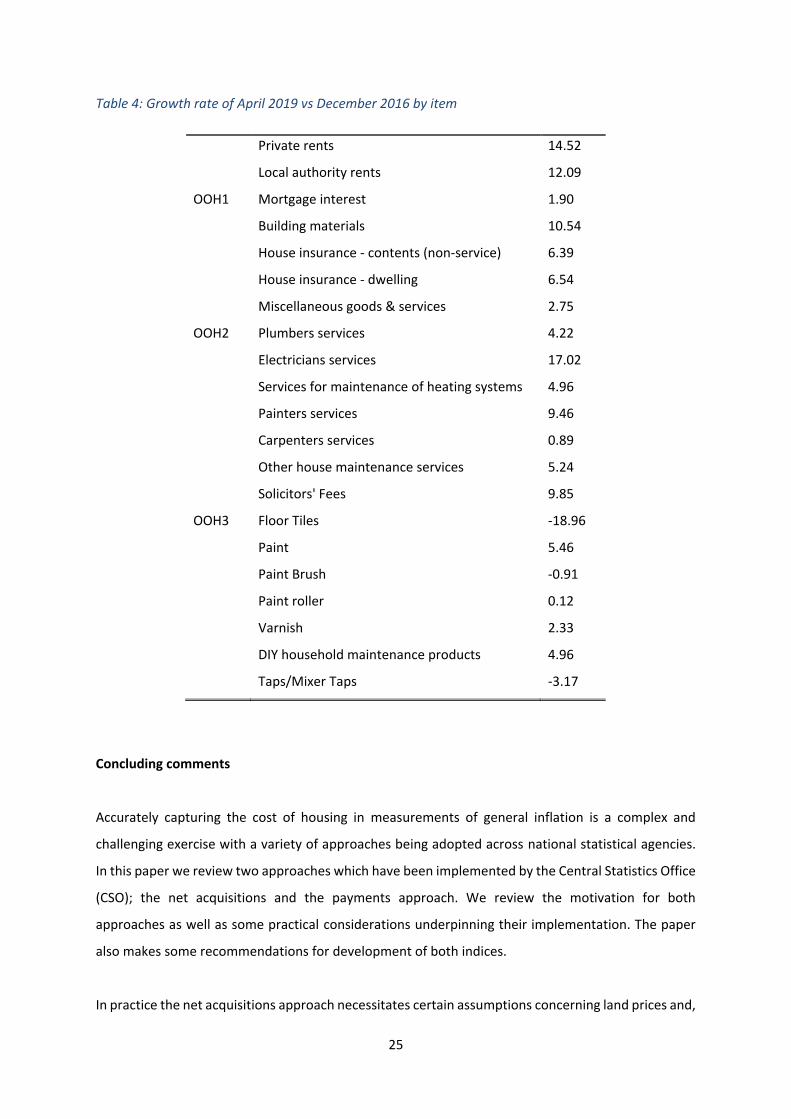
Table 4 lists growth rates over the period December 2016 to April 2019 by item. Both private and local
rents have experienced strong growth, with 14.5% and 12.1%, whereas mortgage interest payments,
the main component of OOH costs according to the payments approach only exhibit a growth rate of
1.9%. This indicates a significant divergence between rental prices and mortgage interest payments,
which is expected given that during the period under consideration the general level of inflation has
been quite low thus leading a payments-based approach to produce expenditure levels that are lower.
However, the observed difference casts some doubt on the current methodology for calculating OOH
costs. Furthermore, the sharp contrast between the estimates and the rental series reinforces the
comments of Diewert and Shimizu (2018) that the payments approach results in smaller monthly
expenditures on owner occupied housing than indicated by other approaches.
90
95
100
105
110
115
Dec
-16
Jan
-17
Feb
-17
Mar
-17
Ap
r-1
7
May
-17
Jun
-17
Jul-
17
Au
g-1
7
Sep
-17
Oct
-17
No
v-1
7
Dec
-17
Jan
-18
Feb
-18
Mar
-18
Ap
r-1
8
May
-18
Jun
-18
Jul-
18
Au
g-1
8
Sep
-18
Oct
-18
No
v-1
8
Dec
-18
Jan
-19
Feb
-19
Mar
-19
December 2016 = 100
OOH1 OOH2 OOH3 Private + LA rents
25
Table 4: Growth rate of April 2019 vs December 2016 by item
Private rents 14.52
Local authority rents 12.09
OOH1 Mortgage interest 1.90
Building materials 10.54
House insurance - contents (non-service) 6.39
House insurance - dwelling 6.54
Miscellaneous goods & services 2.75
OOH2 Plumbers services 4.22
Electricians services 17.02
Services for maintenance of heating systems 4.96
Painters services 9.46
Carpenters services 0.89
Other house maintenance services 5.24
Solicitors' Fees 9.85
OOH3 Floor Tiles -18.96
Paint 5.46
Paint Brush -0.91
Paint roller 0.12
Varnish 2.33
DIY household maintenance products 4.96
Taps/Mixer Taps -3.17
Concluding comments
Accurately capturing the cost of housing in measurements of general inflation is a complex and
challenging exercise with a variety of approaches being adopted across national statistical agencies.
In this paper we review two approaches which have been implemented by the Central Statistics Office
(CSO); the net acquisitions and the payments approach. We review the motivation for both
approaches as well as some practical considerations underpinning their implementation. The paper
also makes some recommendations for development of both indices.
In practice the net acquisitions approach necessitates certain assumptions concerning land prices and,

26
in particular, the manner in which land prices change through time and across geographical areas. One
obvious addition to the implementation of the acquisitions approach would be the provision of
national and a regional series of land prices. This would help to provide arguably a more accurate
distinction between changes in the cost of housing due to the consumption and the investment
component. The paper also contains a specific proposal for enhancing the estimation of house price
indices both in the case of the residential property price indicator and for the OOH indices. In
particular, the model proposed would allow for the price of certain characteristics of a house in each
period to vary, therefore resulting in an index, which included changes due to individual qualities, as
well as more general, aggregate inflation.
While the payments approach provides a useful insight in terms of its focus on households’ disposable
income and the related issue of housing affordability, a number of conceptual and empirical issues
arise with its implementation. These include the indices focus on the cost of mortgage finance rather
than the cost of consumption. As it typically ignores the appreciation of the housing asset, it has been
argued that the approach tends to lead to smaller monthly expenditures on OOH than other
approaches. Indeed, the comparison of a rental price index with certain payment type indices
calculated in this paper would offer some support to this conclusion. In terms of some of the
parameters and assumptions used to calculate the approach, greater use of bank level data and
possibly the official loan level data maintained by the Central Bank of Ireland would be recommended.
This could ensure that the most up to date and representative information on the mortgage interest
rates actually paid by households as well as the tenure of mortgage contracts was being fully
incorporated into the index.
Overall, given the issues, which arise with the different approaches, it is clear that having a suite of
such indicators is a prudent strategy in gauging the cost of housing in inflation measures. In that vein,
future research in this research project will explore the possibility of the use approach and, in
particular, the rental equivalence approach to measuring housing costs.

27
Bibliography
1. Alchian, A. and B. Klein, 1973. On a Correct Measure of Inflation. Journal of Money, Credit and
Banking, 5(1), pp. 173-191
2. Bernanke, B and M. Gertler, 2000. Monetary Policy and Asset Price Volatility, NBER Working
Paper No. 7559
3. Blinder, A. 1980. The Consumer Price Index and the Measurement of Recent Inflation.
Brookings Papers on Economic Activity, 2
4. Central Statistics Office., 2016. RPPI Technical Paper. CSO, Cork.
5. Diewert, E., 2019. Measuring the Services of Durables and Owner Occupied Housing (No.
erwin_diewert-2019-5). Vancouver School of Economics.
6. Diewert, W.E., Nakamura, A.O. and Nakamura, L.I., 2009. The housing bubble and a new
approach to accounting for housing in a CPI. Journal of Housing Economics, 18(3), pp.156-171.
7. Eurostat, 2017. Detailed Technical Manual on Owner-Occupied Housing for Harmonised Index
of Consumer Prices, Eurostat, Luxembourg.
8. European Commission, 2018. Report on the Suitability of the Owner-Occupied Housing (OOH)
Index for Integration into the Harmonised Index of Consumer Prices (HICP) Coverage,
COM(2018), 29.11.2018
9. Goodhart, C., 2001. What weight should be given to asset prices in the measurement of
inflation? The Economic Journal, 111(472), pp.335-356.
10. Hampl, M. and T. Havranek., 2017. Should Monetary Policy Pay Attention to House Prices?
The Czech National Bank Approach.
11. Hill, R.J., Steurer, M. and S.R. Waltl. 2018. Owner Occupied Housing in the CPI and Its Impact
on Monetary Policy During Housing Booms and Busts. Luxembourg Institute of Socio-Economic
Research (LISER) Working Paper, (2018-05).
12. ILO, 2004. Consumer Price Index Manual – Theory and Practice.
13. Johnson, P., 2015. UK consumer price statistics: A review. UK Statistics
Authority, 8.https://www.statisticsauthority.gov.uk/wp-content/uploads/2015/12/images-
ukconsumerpricestatisticsarevie_tcm97-44345.pdf
14. Knoll K., Schularick M., and T. Stege. 2017. No Price Like Home: Global house prices, 1870-
2012. American Economic Review. 107(2), pp, 331-53.
15. Kuminoff, N.V. and J.C. Pope. 2013. The Value of Residential Land and Structures during the
Great Housing Boom and Bust. Land Economics, 89(1), pp.1-29.
16. Larson, W. 2015. New Estimates of Value of Land of the United States. Bureau of Economic
Analysis Working Paper

28
17. Leamer, E.E., 2007. Housing is the business cycle. Proceedings – Economic Policy Symposium
– Jackson Hole, Federal Reserve Bank of Kansas City, pp. 149-233
18. Lyons, Ronan. 2019. The Daft.ie Rental Price Report. Daft.ie, Dublin.
https://www.daft.ie/report/2019-Q1-rentalprice-daftreport.pdf
19. McCarthy Y. and K. McQuinn 2017. Price expectations, distressed mortgage markets and the
housing wealth effect. Real Estate Economics, 45(2), pp. 478 - 513, Summer.
20. OECD, 2018. Methodological Notes – Compilation of a G-20 Consumer Price Index
21. ONS, 2019. Measures of Owner-Occupiers' Housing Costs, UK: January to March 2019.
22. Summers, R., 1973. International price comparisons based upon incomplete data. Review of
Income and Wealth, 19(1), pp.1-16.