working on the margins - center on policy initiatives · working on the margins acknowledgements ii...
TRANSCRIPT


Working on the MarginsCalifornia’s Growing Temporary Workforce
Sundari Baru, Ph.D.
Foreword by
Amy B. Dean
January 2001
Center on Policy InitiativesCopyright 2001, Center on Policy Initiatives
Dede AlpertCalifornia State Senate, District 39
Judy Beal, PresidentCommunications Workers of America Local 9509 San Diego
Jerry Butkiewicz, Secretary-TreasurerSan Diego-Imperial Counties Labor Council
Prof. Lisa CatanzariteDept. of Sociology, U.C. San Diego
Prof. Paula ChakravarttyDept of Communication, U.C. San Diego
Ed Chiera, PresidentEdward Chiera Associates
Gloria CooperSan Diego Organizing Project
Tim CostelloCampaign on Contingent Work, Boston
Prof. Ellen DanninCalifornia Western School of Law
Amy DeanSouth Bay AFL-CIOWorking Partnerships USA
Prof. Robert HorwitzDept of Communication, U.C. San Diego
Xema Jacobson, Business ManagerSan Diego County Building Trades Council
Christine KehoeCalifornia State Assembly, District 76
Tom Rankin, PresidentCalifornia Labor Federation, AFL-CIO
Edie Rasell, EconomistEconomic Policy Institute, Washington D.C.
Jean Ross, Executive DirectorCalifornia Budget Project
Catherine Ruckelshaus, Litigation DirectorNational Employment Law Project,New York
Leon Sompolinsky, Information ActivistImpact ResearchData Center, Oakland
Mark SpieglerFisher, Spiegler, Ginsburg, Ladner andAttarian, LLP
Nik TheodoreCenter for Urban Economic DevelopmentUniversity of Illinois, Chicago
Tom Tosdal, Attorney at LawTosdal, Levine, Smith and Steiner
Juan VargasCalifornia State Assembly, District 79
David West, Executive DirectorCenter for a Changing Workforce, Seattle
Advisory Board
Center on Policy InitiativesMary Grillo, Chair
Executive Director, SEIU Local 2028

Center on Policy
Initiatives
I
Working on the Margins
Acknowledgements ii
Foreword iii
Executive Summary v
I. Introduction 1
The New Corporate Structure 2
II. Contingent and Nonstandard Work Arrangements 5
Contingent and Non-Standard Works Arrangements Defined 5The Consequences of Contingent Work 8
III. The Rise in Temporary Employment in The United States 13
Reasons for the Rise in Temporary Employment 14Temporary Workers in the United States 16
IV. Temporary Workers in California 21
Temporary Workers in California — A Snapshot 21Wages of Temporary Workers in California 27
V. Regional Analysis of Temporary Employment in California 29
Temporary Employment in California in the 1990s 29Temporary Employment in the 15 Largest Counties in California 29Occupational Projections for Temporary Jobs 34
VI. Discussion 47
Solutions and Recommendations 48California Policy Recommendations 51
VII. Appendix A — Data Methodology 53
VIII. Appendix B — Types of Employment Agencies 57
IX. Appendix C — Organizations and Resources 61
X. Bibliography 63
Table of Contents

Sundar i Baru received her Ph.D. in Economics from the University of
Michigan, Ann Arbor. Her research focused on the impact of the import of
intermediate goods on skilled labor employment in the United States. She is
currently the research director at the Center on Policy Initiatives. She is the co-
author of the CPI report Planning for Shared Prosperity or Growing Inequality:
An In-Depth Look at San Diego’s Leading Industry Clusters.
CPI would like to thank Bob Brownstein, Ed Chiera, Ellen Dannin, Rebecca
Davis, Jordan Einbinder, Mary Grillo, Robert Horwitz, Edie Rasell, Jean Ross,
Cathy Ruckelshaus, and Nik Theodore for their thoughtful comments on earli-
er drafts of the paper.
The author would particularly like to thank Edie Rasell and the research staff
at the Economic Policy Institute in Washington, D.C. for analyzing Census
Bureau data for California. Dr. Rasell’s expertise in this area and her advice
helped make for a clearer presentation of the paper. We also appreciate the
knowledge of the data shown by the staff at the Labor Market Information
Division of the California Employment Development Department in San
Diego and Sacramento and the promptness with which they provided the data.
This report benefited greatly from the advice and guidance provided by Donald
Cohen, president of the Center on Policy Initiatives. The author would like to
also thank the entire staff of CPI for their patient readings of and suggestions
on various drafts of the report.
This report was made possible by the financial support of the Rosenberg
Foundation. We also offer thanks to the Rockefeller Foundation, Unitarian
Universalist Veatch Program at Shelter Rock, the French American Charitable
Trust, Solidago Foundation, ARCA Foundation, Bauman Foundation, New
World Foundation, Annie E. Casey Foundation, McKay Foundation and
Christopher Reynolds Foundation.
Acknowledgements
California’s Growing Temporary Workforce
Center on PolicyInitiatives
II

Center on Policy
Initiatives
III
Working on the Margins
In his most recent book, The Fourth Great Awakening, Nobel Prize-winning
economist Robert William Fogel observed that “political realignments are set
in motion by the lag between new technologies and the human capacity to
cope with the ethical and practical complexities that these new technologies
entail.” This latest report by the Center on Policy Initiatives, Working on the
Margins: California’s Growing Temporary Workforce, is a part of the realign-
ment that is developing in California and around the world in response to the
New Economy’s impact on the lives of millions of working families.
During the last few decades, extraordinarily rapid advances in information
technology have produced what can seriously be described as a new industrial
revolution. Under the economic realities of this evolving era, the survival of a
corporation depends primarily on its ability to innovate and its ability to bring
the products spawned by innovation to commercial markets at a breathtaking-
ly rapid pace. In order to respond to this wildly changing and unstable environ-
ment, firms have sought to utilize different kinds of workforce arrangements —
particularly forms of nonstandard or contingent labor. By employing contin-
gent labor, corporations are able to focus management’s attention on product
innovation and development and often lower costs at the same time.
CPI’s report clearly documents the scope and directions of these trends. It
reveals the demographic composition of California’s temporary work force,
and it suggests that the unprecedented growth in the temporary employment
sector is likely to continue into the future. To its credit, the report does more
than compactly present these facts. It also demonstrates that the use of these
forms of contingent work are in fact mechanisms through which corporations
shift the costs of the New Economy’s instability away from their own bottom
line. The victims of this shift are the temporary workers themselves.
Temporary work is characterized by income instability, low wages, a lack of
health insurance, limited access to training, and an absence of employer-sup-
ported retirement programs. The increased flexibility for the firm has been
secured by constraining the opportunities for a decent life on the part of con-
tingent employees.
The political realignment of which Professor Fogel wrote will require the kind
of analysis and evidence that the Center on Policy Initiatives is producing.
Foreword
California’s Growing Temporary Workforce
Center on PolicyInitiatives
IV
It will also depend on the development of public policy proposals that can
maintain the vitality of the New Economy while sharing its prosperity and pro-
tecting workers from its excesses. In particular, government action can provide
the framework to allow new forms of workforce organization to emerge. These
forms can be designed to meet the needs of workers — for stability, for health
care, for upward mobility — at the same time that they allow corporations to
compete successfully.
The tasks noted above are the ones that have been accomplished by every Social
Contract that eventually brings socio-economic stability to industrial revolu-
tions. The last structural economic upheaval in the United States produced
such a contract through the legislative agenda of the New Deal. Many of those
laws and institutions have been rendered ineffective by the dynamics of the
New Economy. For those who value equity and social justice, it is time to head
back to the drawing boards. Fortunately, organizations like the Center on
Policy Initiatives are already there, laying the groundwork for a coming genera-
tion of organizing and activism.
No one can say precisely what all of the components of this Social Contract for
the New Economy will be. What we can say with confidence is that it will be
constructed. The New Economy with all of its entrepreneurship and openness
and vitality is unthinkable outside of a democratic political context.
Democracy demands — sooner or later — that economic systems produce wide-
spread benefits. With this report, the Center on Policy Initiatives is taking one
of what will be many necessary steps to assist the New Economy to reconstruct
the American Social Contract and meet the requirements of a democratic
social order.
Amy B. Dean
Executive Officer, South Bay AFL-CIO Labor Council
Founding Director, Working Partnerships USA

Center on Policy
Initiatives
V
Working on the Margins
The United States is experiencing unprecedented economic prosperity.
Unemployment rates are at historic lows, inflation appears to be curbed, and
new millionaires are being created almost daily. However, this prosperity has
not guaranteed job security for all workers. In fact, we are seeing a dramatic
rise in what can be seen as “non-secure” employment, or nonstandard work
arrangements that do not provide the stability and benefits of regular, full-
time work.
These nonstandard arrangements, including independent contractors, on-call
workers, contract company workers and part-time workers, have all been
increasing at high rates. The most astounding rate of growth has been in the
number of workers hired through a Temporary Help Agency (THA). This report
analyzes state and county data for THA workers in California. Throughout this
report, we refer to THA workers as “temporary workers” or “temps.” The work
done by THA workers will be referred to as “temporary work” and employment
obtained through THAs will be referred to as “temporary employment.”
Researchers at the Economic Policy Institute found that in 1997, 28.7% of the
United States workforce was employed in nonstandard work arrangements.
Researchers at the Bureau of Labor Statistics found that between 1995 and
1997, total employment in the U.S. grew by 2.8%, while temporary employment
grew by 10%. The American Staffing Association, the trade association that repre-
sents the temporary help industry, estimates that its members placed over 3 mil-
lion workers a day in 1999, increasing from 1.2 million a day in 1990, a 150%
rate of growth.
The growth in temporary work raises serious issues for workers, including that
of income security, health and pension benefits and career advancement.
Research has shown that temporary workers earned lower wages than other
workers with similar characteristics and were less likely to have medical and
pension benefits. Only 7% of temporary workers in the United States had health
insurance through their employer while 3.7% had pension coverage through
their employer. Additionally, temporary workers typically get little, or any, on the
job training, restricting the opportunity for career and wage advancement.
Temporary employment is often justified by the staffing industry on the
grounds that it provides flexibility for today’s workers. However, a 1997 survey
of temporary workers showed that 59% of temps would prefer to be in a “tradi-
Executive Summary
Only 7% of temporaryworkers in the United
States had healthinsurance through their
employer while 3.7%had pension coverage
through their employer.

California’s Growing Temporary Workforce
Center on PolicyInitiatives
VI
tional” work arrangement. It is more likely that the corporations utilizing tem-
porary workers are the ones seeking more flexible arrangements. The use of
temporary workers gives firms an essentially expendable workforce, one that
does not need to be provided with medical and pension benefits. Although a
recent National Labor Relations Board ruling has made it easier for temporary
workers to join the unionized bargaining unit at their worksites, it is difficult
for temporary workers to form new bargaining units because they do not stay at
one location or with one employer for long.
To begin addressing these issues, this paper focuses on temporary employment
in California and its 15 most populous counties. Of California’s 58 counties,
these counties together account for 83% of the population. We examine cur-
rent trends in temporary employment, as well as projections for the future
direction of growth. The analysis of the demographics of temporary workers
employed data from the U.S. Census Bureau for the years 1997-1999. Our analy-
sis of individual California counties used data from the California Employment
Development Department for the years 1991-1998.
What we found to be particularly remarkable is that the shares of temporary
jobs in all counties stayed fairly steady through the recession years of the early
1990s, but they increased tremendously during the booming mid and late
1990s. This runs counter to our expectations that the uncertain economic cli-
mate during the recession would have spurred the creation of temporary jobs
and that the low unemployment rates of the late 1990s would have reduced
the supply of workers willing to take on jobs with uncertain duration and few
benefits. This is, perhaps, an indication that the share of temporary jobs is not
dependent on the business cycle but is, in fact, part of an ongoing structural
change in the way we work.
Findings
1. The number of temporary jobs has grown in all regions of California. In
the majority of counties there has been an increase of over 100%.
• The number of jobs in the temporary help industry in California more
than doubled between 1991 and 1998, from 156,000 jobs to 334,000
jobs. During the same period, the number of jobs in all industries grew by
just 10%, from 12.7 million jobs to 14 million jobs.
• Between 1991 and 1998, 11 of the 15 counties studied doubled or more
than doubled the percentage of total jobs that were temporary.
• Riverside County more than tripled the share of temporary jobs, the largest
proportional increase of all the counties in this analysis. San Francisco
County experienced the smallest percentage increase, about 27%.
The shares oftemporary jobs in allcounties stayed fairly
steady through therecession years of theearly 1990s, but they
increased tremendouslyduring the boomingmid and late 1990s.

Center on Policy
Initiatives
VII
Working on the Margins
2. Temporary workers’ hourly wages were less than that of traditional, full-
time workers with similar personal and job characteristics.
• Controlling for personal characteristics such as race, age, urban status
and education, male temporary workers earned 13.5% less than their
permanent, full-time counterparts, and female temporary workers
earned 5.4% less than their permanent, full-time counterparts.
• Controlling for the above characteristics, as well as job characteristics
such as industry and occupation, male temporary workers still earned
8.8% less than their permanent, full-time counterparts, and female
temporary workers earned 6.7% less than their permanent, full-time
counterparts.
3. In California, the temporary workforce had higher proportions of women
and Blacks than the regular, full-time workforce. Additionally, workers
were more likely to be younger and less-educated.
• 57.7% of temporary workers were women, compared to 41.1% of workers
in the permanent, full-time workforce.
• 12.4% of temporary workers were Black, compared to 6.6% of workers in
the permanent, full-time workforce.
• 20.4% of temporary workers were between 18 and 24 years old, com-
pared to 10.8% of workers in the permanent, full-time workforce.
• 38% of temporary workers had either completed a few years of College or
had an Associate degree, compared to 30% of permanent, full-time work-
ers. A slightly smaller percentage (18%) of temporary workers had their
BA degree - compared to 21% of permanent, full-time workers.
• 42.2% of female temporary workers worked in Administrative Support
occupations, compared to 24.8% of women in the traditional workforce.
• Among male temporary workers as well, Administrative Support occupa-
tions employed the largest fraction of workers (24%) compared to 7.8%
among male permanent, full-time workers. A close second was Laborer
occupations which employed 22.9% of male temps, compared to 5.8% of
males in the regular, full-time workforce.
4. Temporary jobs in both high-skilled and low-skilled occupations in the
15 counties studied are projected to increase between 1995 and 2002.
• Overall, the 15 largest counties in California are projected to experience
a 43% growth in the number of temporary jobs between 1995 and 2002.
• The largest percentage growth, nearly 60%, is projected to be in
Production, Construction and Material Handling Occupation.
• The second fastest growth is expected in the high-skilled Managerial and

California’s Growing Temporary Workforce
Center on PolicyInitiatives
VIII
Administrative Occupation.
• In 2002, the largest number of temporary jobs is still expected to be in
Clerical and Administrative Support occupations.
• Central Valley Counties are expected to see the lowest rate of growth in
temporary jobs, while the Bay Area and Inland Empire Counties are
expected to experience the fastest growth.
• San Francisco County is expected to have the fastest rate of growth in
temporary jobs at a rate of growth of 124.8%. Alameda County is expect-
ed to have the slowest rate of growth in temporary jobs, growing by
15.4% between 1995 and 2002.
Conclusions
As companies in today’s New Economy increasingly come to rely upon the use
of temporary workers, it is clear that these workers need protection to weather
the uncertainties that come from temporary work. Solutions should focus on
providing greater economic security to temporary and other non-standard
workers, rather than completely eliminating their use. The dramatic growth of
non-standard work — from temp agencies to independent contracting and sub-
contracting — requires a broad rethinking of employment law at all levels of
government and employment practices in American business and government.
The following are some of the policy and institutional reforms that advocates
across the country are pursuing to meet the challenges of the new American
workplace. We list some policy and legal solutions that would level the playing
field for all workers.
1. Review impact of existing laws on non-standard workers and recommendchanges in the law.
Several states have passed or are considering passage of laws requiring stud-
ies to evaluate wages, benefits and other workplace protections available to
contingent workers relative to the wages, benefits and protections for regu-
lar, full-time workers.
2. Extend all workplace rights to non-standard workers.
Different categories of contingent workers (i.e. temporary and leased work-
ers, part-time, independent contractors) are treated differently under state
and federal employment laws such as the Fair Labor Standards Act (FLSA),
Family Medical Leave Act (FMLA), and unemployment and workers com-
pensation laws. Extending equal workplace rights to all workers would pre-
vent discrimination against temporary workers.

Center on Policy
Initiatives
IX
Working on the Margins
3. Ensure equal treatment of temporary and contingent workers.
Equal treatment policies require that temporary and contingent workers be
paid the same wages, offered the same benefits and have the same work-
place protections as traditional, full-time workers doing the same job at
that worksite.
4. “Right to Know” for Temp Workers.
Right to Know policies would require temp agencies to disclose wage rates,
client rates and conversion fees to temporary workers so they can choose
temporary agencies that provide the greatest opportunities for wages, bene-
fits and career advancement.
5. Use public dollars to create secure jobs with benefits.
Taxpayer dollars, through direct hiring of public employees, contracting for
services or economic development incentives create large numbers of jobs
at the local, state and national level. The jobs created with taxpayer dollars
should be full-time, permanent jobs with full benefits.
6. Establish Codes of Conduct for temporary agencies.
Having temporary help agencies abide by a set of rules in conducting their
business will ensure that common abuses do not occur. The National
Alliance for Fair Employment (NAFFE), an alliance of organizations that
focus attention on contingent work, lists a code of conduct for temp agen-
cies (www.fairjobs.org).
7. Create non-profit and worker-centered agencies.
Union hiring halls in seasonal or ‘project-based’ industries such as con-
struction or hotels have developed mechanisms to provide worker security,
training and decent wages and benefits in inherently insecure jobs. In addi-
tion, a new generation of non-profit temporary agencies, such as Working
Partnerships Staffing Services in Silicon Valley, is setting new standards for
paying living wages, providing portable benefits and occupational training
to expand opportunities for workers.
California Policy Recommendations
We make four policy recommendations for California policy makers specifical-
ly aimed at the rapid growth of temporary work in the state.
1. Study the impact of and review all employment, benefit and workplace law
California should charge the appropriate state agencies with the task of
studying the changing structure of work in California and reviewing all
California employment, workplace and benefit laws and regulations to deter-
California’s Growing Temporary Workforce
Center on PolicyInitiatives
X
mine which should be updated to address economic security and career
development issues for contingent workers.
2. Establish standards for public dollars to create permanent jobs
We urge the State of California and public bodies across the state to establish
standards for all public spending in the use of temporary and contingent work-
ers. These standards would apply to public agencies and contractors doing
business with local or state agencies and include:
• Limits on the number and tenure of temporary workers
• Wage and benefit parity for all temporary and non-standard workers
• Minimum wage and benef i t s tandards for temporar y and
non-standard workers
• Protections against the displacement of permanent jobs with
temporary jobs
• Codes of conduct for temporary help agencies
3. Establish equal pay and benefits for non-standard workers
California should require equal pay and benefits for temporary and non-
standard workers doing the same work as permanent employees.
4. Disclosure and accountability
California should require labor intermediaries such as temporary and leasing
agencies to disclose payment rates, client rates, conversion fees, training pro-
grams and tenure statistics for agency employees.
These policies represent some efforts to deal with the insecurities arising from
temporary work. In addition, we support the development of similar policies
that will address worker insecurity in other forms of contingent labor such as
independent contractors, subcontracted work and employee leasing.
This report has demonstrated that the structure of work is changing rapidly
and that it limits opportunity for many working people. An equally rapid and
vigorous response will ensure that vibrant economic growth will be accompa-
nied by greater security and prosperity for California’s working families.

Center on Policy
Initiatives
1
Working on the Margins
Since the end of World War II, the United States has experienced a dramatic
transformation in its economy. The industrial structure has changed and along
with it, the nature of work. The twenty years after the War saw the rise of the
military-industrial complex and big corporations.1 As consolidation and mech-
anization eliminated rural jobs, workers leaving rural and agricultural jobs
found employment in large corporations. Despite an increasing supply of
workers, however, unions and growing prosperity combined to ensure lifetime
employment for the workers, with family-supporting wages and health and retire-
ment benefits.
In the 1970s, technological innovations and the increasing use of machines
to do jobs once performed by skilled workers eliminated many jobs that had
been union jobs with good pay and benefits. Companies moved their sub-
assembly operations and, in some cases, state-of-the-art manufacturing facili-
ties first to the southern states and then abroad, where labor was abundant
and cheap. This “outsourcing” increased the pressure to lower wages here in
order to keep jobs in the country.
Job security and well-paying jobs were further eroded in the 1980s with the
deregulation of industries and increased foreign competition. Industries with
high unionization rates, such as automobile manufacturing and steel, faced low-
priced competition from abroad and began to lay off workers, while those work-
ers lucky enough to have jobs faced lower wages. Entire functions, such as pay-
roll administration, were outsourced in order to minimize costs. Even
white-collar workers were “downsized” as large corporations adopted the “lean
and mean” strategies that were rewarded by Wall Street.
In the unprecedented boom of the mid- and late-1990s, there has been an
acceleration towards building a lean corporate structure. Rapidly changing
technology has required corporations to move more nimbly to meet the chal-
lenges of the marketplace.
The skill-sets that a corporation requires of its workers have diverged. On the one
hand, some functions now require higher degrees of skill, and more complex skills
than were once needed. Workers with the requisite skills for these tasks are being
richly rewarded.
IntroductionI
1 “Who Built America: Working People and the Nation’s Economy, Politics, Culture and Society, Volume 2,” American SocialHistory Project, Pantheon Books, New York, 1992.

California’s Growing Temporary Workforce
Center on PolicyInitiatives
2
On the other hand, some tasks have become standardized and corporations have
responded by re-engineering their operations. “Teams” of workers performs jobs
that are defined into units of work that require little skill to perform. In addi-
tion, “flexibility” in responding to changing demand for a corporation’s prod-
ucts has lead to changes in the institutional structure of the corporation.
The New Corporate Structure
The last seismic shift in the way work was organized came with the Industrial
Revolution and the perfection of the assembly-line production method. In the
years when the manufacturing sector was larger in the U.S. economy, the work-
er was assured of rising wages that came from climbing up a well-defined
career ladder. The rungs in the ladder were clearly marked and the ladder was
accessible to all, although gender and racial discrimination determined how
far up one could climb. The corporate structure was symbolized by a pyramid;
the solid foundation was provided by the workers, who reported to a smaller
number of supervisors, who in turn reported to a smaller number of their
supervisors, and so on until there was only one Chief Executive Officer at the
top of the pyramid. For those who wanted the pyramid to flatten out, their
dream has come true.
The corporation in the New Economy, according to sociologist Robert Parker,
is a series of concentric circles.2 In his opinion, the new structure provides the
corporation with the functional, numerical and financial flexibility that they
seek to achieve in their efforts to retain competitiveness and increase prof-
itability.
• The inner “core” consists of the upwardly mobile executives and technicians
who provide the functional flexibility by allowing themselves to be trans-
ferred between plants or within a division.
• The next ring, the “inner periphery,” consists of full-time jobs but the career
path is less clear, leading to high turnover. Jobs in this periphery include
clerks, assemblers and supervisors — jobs that provide security but are dead-
end jobs. This allows for a high degree of numerical flexibility, i.e., flexibility
in the number of employees that a corporation has on its payroll.
• The next ring, the “second periphery,” consists of part-time workers, job-shar-
ing arrangements and workers on short-term contracts. These workers, like
workers in the inner periphery, also provide numerical flexibility, i.e., the flexi-
bility to hire or lay-off workers as the business cycle fluctuates.
2 Robert Parker, “Flesh Peddlers and Warm Bodies: The Temporary Help Industry and Its Workers,” Arnold and Caroline RoseMonograph Series, Rutgers University Press, New Jersey, 1994.
Center on Policy
Initiatives
3
Working on the Margins
• Finally, there are the “externals,” temporary workers and sub-contractors,
who can provide functional, financial and numerical flexibility to the corpo-
rations. The “second periphery” of workers and the “externals” are workers
with “non-standard work arrangements” (NSWAs).
Among the non-standard work arrangements, that of temporary work is the
main focus of this report. In general usage, temporary work can be taken to
mean work that is of limited duration. In some instances, the term “temporary
work” has also been used to describe part-time work. Throughout this report,
we use the term “temporary workers” or “temps” to describe workers hired
through and paid by Temporary Help Agencies (THAs).
Temporary work has experienced phenomenal growth in the 1990s, growing
faster than overall employment. Between 1995 and 1997, according to
researchers at the Bureau of Labor Statistics, total employment grew by 2.8%
while temporary employment grew by 10%. According to the American
Staffing Association, the average number of temporary workers that its mem-
bers placed daily increased by 150% in the 1990s. Researchers have also shown
that temporary workers earned lower wages than other workers with similar
characteristics and were less likely to have medical and pension benefits.
This report studies the issue of temporary employment in California and its 15
most populous counties, grouped into 4 regions. We examine the demograph-
ics of temporary workers in California and the trends in temporary employ-
ment in these 15 counties. We also examine the future growth projections by
occupation in temporary jobs.
Section II below defines the various non-standard work arrangements.
Section III details the reasons for the growth in temporary employment in the
United States and the results of other research on temporary employment in the
United States.
Section IV provides a snapshot of the demographics and wages of temporary
workers in California.
Section V shows the growth in temporary jobs in 4 regions of California and
the projections for growth.
Section VI lists our conclusions and recommendations.
According to theAmerican StaffingAssociation, the
average number oftemporary workers that
its members placeddaily increased by150% in the 1990s.

California’s Growing Temporary Workforce
Center on PolicyInitiatives
4

Center on Policy
Initiatives
5
Working on the Margins
Contingent and Non-StandardWork ArrangementsII
Contingent Work and Non-Standard Work Arrangements Defined
Contingent Work
The Bureau of Labor Statistics (BLS) defines contingent work as “any job in
which an individual has no explicit or implicit contract for long-term
employment.” The BLS uses three measures of contingent work, with varying
degrees of restrictions regarding the current duration of the job and expected
job tenure.3 In the least restrictive measure, a worker was counted as contin-
gent if, regardless of how long they had worked at their current job, they did
not expect to keep their job for long. Under this interpretation of the term, a
regular, full-time worker who has been on the job for, say, five years, but who
does not expect her job to last would qualify as a contingent worker. However,
a temporary worker who expects to be continuously employed through the
temporary help agency, even if she moves from one assignment to another,
does not qualify as a contingent worker.
A work arrangement that would fall under BLS’s definition of contingent work
is that of the direct-hire temp, a temporary worker who is hired by a firm for
short-term employment. Seasonal workers, such as those hired during the
Christmas shopping season or at amusement parks in the summer, are typical-
ly direct-hire temporary workers.
In popular jargon, however, contingent work has come to mean any work in
which the worker is not employed by the company that uses her services, and
any work that is not full-time work. We follow the BLS definition of contin-
gent work and refer to work that is not regular, full-time work as a Non-
Standard Work Arrangement (NSWA).
Non-Standard Work Arrangements
The BLS defines work arrangements that are made through an intermediary,
such as a temporary help agency, or work whose time, place, and quantity are
unpredictable, as “alternative” work arrangements.4 Included in this term are
four categories of workers: independent contractors, workers whose services
are provided through contract companies, workers paid by temporary help
agencies, and on-call workers.
3 Anne E. Polivka, “Contingent and Alternative Work Arrangements, Defined,” Monthly Labor Review, October, 1996.
4 Ibid.

California’s Growing Temporary Workforce
Center on PolicyInitiatives
6
The Economic Policy Institute broadens the scope of work arrangements that
are not the regular, full-time jobs and uses the term Non-Standard Work
Arrangement to describe them.5 We list below all classifications of work that
can be described as being non-standard.
• Independent Contractors — These are workers who obtain customers on their
own to provide a service or a product. In essence, the independent contrac-
tor’s work contract is with herself. A common example of an independent
contractor is a computer programmer or consultant who works on a specific
product for a client for a flat fee; or a free-lance writer for a magazine who
generates occasional articles for publication. An independent contractor’s
continued employment depends on her ability to find clients willing to pay
her for her work. The independent contractor works with no instruction or
training from the client, no financial investment from the firm in the work-
er’s equipment, and no benefits such as health insurance, pension plans,
and workers compensation from the client. Further, no permanence in the
relationship between the contractor and the client can be expected.
• Contract Company Workers — These workers are employed by a company that
provides a service to a client firm, and the workers typically work at the
client’s work-site. Contract companies contract for services such as janitori-
al work and landscaping. The jobs of these workers depend upon the ability
of the contract company to win contract bids for its service.
• Temporary Help Agency Workers (or Temporary Workers or Temps) — These
workers are hired and paid by a temporary help agency, which supplies their
services to a client company. The most common tasks performed by temps
have been secretarial and clerical work, although this has been changing, as
this report will show. The agency’s ability and willingness to place her at a
client site determine the temporary worker’s paid employment. While the
jobs are typically of short duration, there is an increasing awareness of cases
of perma-temps, or long-term temporary workers, most visibly the recent
case at Microsoft (see box on page 11), and the King County, WA, case (see
box on the next page).
• Leased Workers (or Payrolling) — Leased workers are hired by a company that
then puts them on the payroll of a leasing company to relieve itself of
administrative and benefit costs. Leasing is generally done through interme-
diaries called Leasing Agencies or Professional Employers organization (PEOs).
5 This section follows closely the definitions from Arne L. Kalleberg, Edie Rasell, et.al., “Nonstandard Work, Substandard Jobs:Flexible Work Arrangements in the U.S.,” Economic Policy Institute, Wash., D.C. and Women’s Research and EducationInstitute, 1997.

Center on Policy
Initiatives
7
Working on the Margins
• On-Call Workers — These workers belong to a pool, such as a union
hiring hall, and are called to work only as needed. But when called,
they may work for several weeks or days. Examples are substitute
teachers, nurses, and union construction workers.
• Day Labor — As the name suggests, a person is hired for a day
to perform a task. This type of NSWA has workers receiving
work either through a labor agency or from the street corner.
Light industrial work and other blue-collar work is typically
done through a labor agency, which places workers for a day
at a time at a client’s work-site. Most workers are hired for
blue-collar/construction work, and more commonly for farm
labor, from a street corner where they wait for employers to
pick them up and transport them to the work-site. It is these
workers, who wait at a place to be picked up by employers to
work for the day, that were included in the Bureau of Labor
Statistics’ Contingent Workers Supplement to the Current
Population Surveys.
• Self-Employment — As the name suggests, these are workers who
report being self-employed, for example, as shop or restaurant owners.
• Regular Part-Time Workers — The workweek for part-timers is
fewer than 35 hours. They do not belong to any of the other
work arrangements described above. They are hired by the
firm that uses their services, but the firm arranges their work
schedule such that they are not occupied full-time. Common
examples include Retail Salespersons and Cashiers, and
Office Administrative Assistants.
Analyzing data from the February 1995 Current Population
Survey (CPS), researchers at the Economic Policy Institute
found that 29.4% of the United States workforce was employed
in these Non-Standard Work Arrangements.6 In a study of Silicon Valley, Chris
Benner estimated that between 27% and 40% of the Santa Clara County work-
force belonged to these work arrangements.7
All the NSWAs described above, with the exception of Regular Part-Time Work,
are characterized by the lack of an explicit direct or a long-term relationship
6 Ibid.
7 Chris Benner, “ Shock Absorbers in the Flexible Economy: The Rise of Contingent Employment in Silicon Valley,” WorkingPartnerships USA, 1997.
King County, Washington’sPerma-temps
This case involved county workers whowere put on the payroll of temporaryagencies even though they worked for thecounty. By hiring them through a temporaryhelp agency, the client firm was notobligated to pay for health and retirementbenefits. Other “perks” such as sick leaveand vacation pay were also denied to these workers.
Six King County workers filed a lawsuit onbehalf of themselves and a large class ofworkers (more than 125), some of whom hadbeen temps for five years. Evidence showedthat King County set the pay for the workersand also trained, supervised and evaluatedthe workers.
However, since they were paid throughoutside agencies, the county did notconsider them eligible for benefits. Thelawsuit was settled in June 2000, and theclass members were compensated for past benefits based on their length ofemployment.
Part of the settlement amount also wentinto retirement credit and future benefits.The county also agreed to create 55 new posit ions and to convert 1 1 of the“provisional” positions held by the classmembers to career service jobs.
Class members will also receive vacationand sick leave that were accrued duringtheir years of service. Some of theworkers, whose career as “contractworker” was not considered in setting their wages, will also receive back pay.

California’s Growing Temporary Workforce
Center on PolicyInitiatives
8
between the workers and the principal entity that uses their services. This rela-
tionship is marked by the presence of a labor market intermediary such as a tem-
porary help agency. The Independent Contractor has an employment relation-
ship with herself, by virtue of having to independently obtain work. Contract
workers, temporary agency workers, and leased workers, and day laborers are
paid through a labor market intermediary, although they may be hired by the
client firm to deliver goods or services. On-call workers and direct-hire tempo-
rary workers are hired and paid by the end-user, although the employment rela-
tionship may be of short duration. As we discuss below, the loosening of direct
ties between the corporation and its employee has had other consequences for
workers and families.
While H-1B visa workers fall outside the purview of the current discussion on
non-standard work, this arrangement can also be considered to be temporary
work. These workers are typically employed in high-tech companies and their
numbers have been on the rise. The H-1B visa allows a worker to work in the
United States for a three-year period and can be extended for another three
years, at the end of which the worker is required to leave the country. The U.S.
Congress has recently approved increasing the number of these workers to
195,000 per year for the next three years. Companies that use these workers
claim a shortage of qualified workers, but opponents accuse the companies of
using these visas to hold down the wages of American workers (see box on next
page). These visas are also used by temporary help agencies to bring in quali-
fied workers whom they place on assignments with their clients. Although the
H-1B workers are typically bachelor’s degree holders, they are paid less than
similarly qualified workers in the United States. It is alleged that this arrange-
ment has held down the pay of U.S. workers who have to compete with the visa hold-
ers for jobs. (See box on next page.)
The Consequences of Nonstandard Work
1. The Lowering of Wages: Research done at the Economic Policy Institute
found that, nationally, non-standard workers were “more likely than regu-
lar workers to receive low and poverty-level wages.”8 Forty-nine percent of
female temps and 42% of male temps earned too little to raise a family of
four out of poverty if they worked full-time all year round. This compares
to 23% of women and 15% of men in the regular workforce who earned
poverty-level wages.
8 Ken Hudson, “No Shortage of ‘Nonstandard’ Jobs,” Economic Policy Institute Briefing Paper, Washington, D.C., December1999.
Forty-nine percent offemale temps and
42% of male tempsearned too little to
raise a family of fourout of poverty.

Center on Policy
Initiatives
9
Working on the Margins
When compared to regular, full-
time workers with similar personal
and job characteristics, nonstan-
dard workers had lower earnings.
For example, female temps earned
4% less than female regular full-
time workers with similar charac-
teristics, while male temps earned
1% more than their counterparts
in regular, full-time jobs. Regular
part-time women and men had a
6% and 8% wage gap respectively
when compared to regular full-
time workers. Independent con-
tractors, on the other hand,
earned a premium over regular
full-time workers; the wage premi-
um for females was 13% and for
males, 20%. However, they are
responsible for paying payroll taxes
as well as purchasing health insur-
ance and pension plans on their
own, which may explain their
wage premium.
Using Unemployment Insurance
data from Washington State,
researchers at the Federal Reserve
Bank, Chicago found that the
temps earned 10% below what
they might have earned in non-
temporary situations. 9
On a macroeconomic scale, Katz and Krueger10 found that states that had a
higher share of temporary employment in total employment in the late
1980s had lower than expected wage growth in the 1990s. They found that
a 0.25 percentage point increase in the share of temporary workers slowed
wage growth by 0.2% a year.19 Lewis M. Segal and Daniel G. Sullivan, “Wage Differentials for Temporary Services Work: Evidence from Administrative
Data,” Federal Reserve Bank of Chicago Working Paper Series, No. WP-98-23, December 1998.
10 Lawrence F. Katz and Alan B. Krueger, “The High Pressure U.S. Labor Market of the 1990s,” Brookings Papers on EconomicActivity, 1999:1, pp. 1-87.
The H-1B VisaThe H-1B visa is a visa that allows professionals to work in the United
States. The visa is issued for a period of 3 years and can be renewed for afurther period of 3 years. The visa requires (a) “theoretical and practicalapplication of a body of highly specialized knowledge, and (b) attainment ofa bachelor’s or higher degree in the specific specialty, or its equivalent.”
In the absence of a bachelor’s degree, the rule of thumb has been torequire 3 years of work experience for each year of the bachelor’s degree.A person with a high school diploma, for example, would require 12 years ofwork experience to qualify for a H-1B visa.
High-tech jobs account for the majority of H-1B visa issued, and hencehave acquired the name “high-tech” visas. Oracle Corp., Cisco Systems Inc.and Intel Corp. are some of the biggest sponsors of these “high-tech” visas.
In September 2000, the U.S. Senate approved an increase in the numberof H-1B visas to 195,000 each year for the next 3 years. It has been allegedthat the visas have been used by companies to get cheaper labor fromabroad. While the companies are required to pay the ”prevailing wage” tothese visa holders, there are few enforcement mechanisms and few otherrequirements such as proving a shortage of U.S. workers.
A Department of Labor report from 1996 found that 19% of these visaholders were not being paid the wage they had been promised (“High Tech’sPassport to Nowhere,” Los Angeles Times, Sept. 21, 2000). Complaints fromthese workers have been few because of their dependence on their employerto continue working in the United States. The Los Angeles Times also quotesa manager who claims to pay a consultant with an H-1B visa less than halfthe wage that he pays to an American consultant doing the same job.
Temporary help agencies sponsor H-1B visas in order to find high-techworkers for their clients. The plight of these workers is similar to that of atemporary worker being paid less than others doing comparable work andliving in fear of being laid-off. Unlike temporary workers, however, thesehigh-tech visa holders are most often provided health coverage as well as a pension plan.
Opponents of the visa say that, despite claims of a labor shortage by thehigh-tech industry, there are American workers available who can take thejob with minimal training. They claim that while the workers are brought in at the prevailing wage, pay raises are lower than that for the permanentworkforce. This also dampens the wage for American workers who have the training and qualifications to do the same job.

California’s Growing Temporary Workforce
Center on PolicyInitiatives
10
Our analysis for California (see Table 3.1) also finds
that temps earn less than regular, full-time workers with
similar personal and job characteristics.
2. Low Access to Medical and Pension Benefits: Temporary
workers had the lowest access to medical and pension
coverage among workers in nonstandard arrange-
ments.11 Only 7% of temps enrolled in medical coverage
provided by their employer, while 26% of them were eli-
gible for such employer-provided coverage. The low
enrollment rate in employer-provided coverage may be
the result of the high cost of purchasing it, or of the
temps having other sources of coverage. Only 46.4% of
temps had any kind of health coverage (for example,
through a spouse), compared to 83% of regular full-
time workers.
Almost 20% of on-call workers and over 50% of contract company workers
had medical coverage provided by their employer, compared to 71% of full-
time traditional workers that had employer-provided health coverage.
Independent contractors are responsible for purchasing medical insurance
for themselves and for investing for retirement. This is a plausible explana-
tion for their relatively higher wages. (See box this page for an innovative
approach to providing benefits for independent contractors in New York).
Only 3.7% of temps had pension coverage, although 10.5% were eligible for
employer-provided pension plans. Nineteen percent of on-call workers, 36% of con-
tract company workers and 57% of regular full-time workers had pension coverage.
3. Ineligibility for Employee Stock Purchase Plans: A “New Economy benefit”
that many companies have started to offer in order to attract the talent
they need, has been the Employee Stock Purchase Plan. Under this plan, an
employee on the company’s payroll has the right to purchase her compa-
ny’s shares at a discount. Nonstandard workers are typically ineligible for
this benefit, since they are not directly on the payroll of the company in
which they are placed. A ruling in the class-action suit filed by Microsoft’s
contingent workers, using the common-law definition of an employee, gave
temps a right to this benefit (see box next page).
11 Sharon R. Cohany, “Workers in Alternative Employment Arrangements: A Second Look,” Monthly Labor Review, Vol 121:11,November 1998.
Temporary workershad the lowest access
to medical andpension coverageamong workers in
nonstandardarrangements.
Help for the IndependentContractor
Working Today, a non-profit membershiporganization based in NewYork City, wasfounded to aid the growing numbers ofcontingent workers in the United States.
Apart from education and advocacy onbehalf of the contingent workforce, theyprovide members access to health care aswell as dental and alternative care. They alsooffer free consumer-oriented legal, tax andretirement planning advice.
Their Portable Benefits Plan provides NewYork’s new-media freelancers access to healthinsurance, dental discounts and retirementplans. By bringing workers together todiversify their risk-pool, they provide a safetynet that is affordable as well as portable.

Center on Policy
Initiatives
11
Working on the Margins
4. Exemptions and Loopholes in Labor
Laws: Laws that govern the work-
place, including Unemployment
Insurance laws, ERISA , FML A,
and anti -discr imination laws,
either do not explicitly cover non-
standard workers or can be selec-
tively applied only to regular, full-
t ime worker. This a l lows
employers to preclude non-stan-
dard workers from coverage for
such benefits as company 401(k)
plans or leave to care for a sick
family member.
Other perks that corporations pro-
vide their payroll employees in the
normal course are not analyzed here
for lack of data. These include sick
leave, paid vacation time, and senior-
ity in promotions. Temporary workers
receive little, if any, job training and
are also kept off the corporate ladder
that is vital to career development
and wage growth. Nonstandard work-
ers have to contend with all of these
disadvantages in their quest for a
secure livelihood.
Microsoft’s Perma-tempsAt its heart, the case of Vizcaino vs. Microsoft is concerned with
defining employment relationships. The case began when Microsoftmisclassified workers as “independent contractors,” thus ridding itself of the obligation of paying payroll taxes. The IRS began to examine thisbroad-based tax evasion. In reparation, Microsoft gave the option to theworkers to either convert to temps or lose their jobs. Once converted totemporary employees, these workers were paid through a payrollingagency. This ensured that payroll taxes were indeed being paid, but still denied the workers the benefits and perks that were available toMicrosoft’s regular employees, some of whom were being supervised by the “payrolled” workers.
The class, said to number more than 10,000 workers, sued for pensionbenefits and the right to participate in the Employee Stock Purchase Plan(ESPP). The U.S. Ninth Circuit Court of Appeals ruled that the class wasentitled to the ESPP that had been denied them and determined thatMicrosoft was indeed their employer. The Court’s used a five-factor testthat considered recruitment, training, duration of employment, the right toassign additional work, and control of the relationship between the agencyand the worker. The class included not only those ordered re-classified bythe IRS, but those that Microsoft voluntarily reclassified as temps.
In December 2000, Microsoft settled the lawsuit for $97 million, whichcovers compensation to class members, attorneys’ fees and the expensesof litigation. The Settlement Agreement states: "Since 1997, Microsoft hasmade important changes in its staffing and worker classification practices.
In its most recent fiscal year, Microsoft hired over 3,000 Class Membersas its W-2 employees entitled to participate in its employee benefit plansand programs. It has adopted practices to ensure the proper classificationof independent contractors, temporary agency employees, and other staff,including a comprehensive review of practices regarding independentcontractor classifications which took place in 1997. It has conductedreviews of ongoing work and has instituted practices designed to limit thelength of temporary agency employees' assignments for Microsoft."http://techlawjournal.com/courts/vizcaino/19990512.htmand http://www.bs-s.com/msoft.htm.

California’s Growing Temporary Workforce
Center on PolicyInitiatives
12

Center on Policy
Initiatives
13
Working on the Margins
Temporary employment embodies some of the greatest disadvantages among
non-standard work arrangements. While there are highly skilled, higher-paid
temps, it is generally a low-paying employment opportunity, where workers
earn less than comparable regular, full-time workers doing the same job. Temps
also have low rates of medical and pension coverage. This work arrangement
has been growing rapidly in the last decade. According to Michael D. Yates, the
use of temps has grown three times faster than total employment since 1982.12
Researchers at the Bureau of Labor Statistics found that between 1995 and
1997, total employment increased by 2.8% while temporary agency employ-
ment increased by 10% (from 1.18 million to 1.3 million).13
The rate of growth in temporary employment is much larger if we use data
reported by the American Staffing Association (ASA), the trade association
that represents the staffing industry. The ASA estimates that its members
placed over 3 million workers a day in the fourth quarter of 1999, increasing
from 1.2 million a day in 1990, a 150% rate of growth.
While the rise in temporary employment has been astonishing, it
has been shown that there could be larger numbers of temporary
help agency workers in the future.14 Using data from the February
1995 Contingent Workers Supplement to the Current Population
Survey, Anne Polivka estimated that there were 3.3 million direct-
hire temps, more than three times the number of Temporary
Help Service (THS) temps. Her research showed that if the wage
mark-ups of temporary help agencies equals the search and con-
tracts costs to the user firm, more of these firms would use
Temporary Help Agencies to obtain temps for occupations that
required fewer years of schooling. For occupations that require
more education, an improvement in the ability of Temporary Help
Agencies to obtain such high-skilled workers would lead to more
temps being hired through a temporary help agency. She con-
cludes that substitution between THS temps and direct-hire temps
is likely to be occurring and could occur in the future. In other
The Rise in Temporary Employmentin the United StatesIII
12 Michael D. Yates, “Longer Hours, Fewer Jobs: Employment and Unemployment in the United States,” Monthly Review Press,New York, 1994, pp. 45.
13 From data reported in Sharon R. Cohany, “Workers in Alternative Employment Arrangements,” Monthly Labor Review,October 1996 and Sharon R. Cohany, “Workers in Alternative Employment Arrangements: A Second Look,” Monthly LaborReview, November, 1998.
14 Anne E. Polivka, “Are Temporary Help Workers Substitutes for Direct Hire Temps? Searching for an Alternative Explanation ofGrowth in the Temporary Help Industry,” paper presented at the Society of Labor Economists Conference, May 3-4, 1996.
Awareness of the growth in non-standardwork has increased among the Americanpublic. A poll conducted for the NationalAlliance for Fair Employment (NAFFE) foundthat 61% of the general public has eitherworked as or known someone who in thepast 10 years had worked in a non-standardposition (www.fairjobs.org).
More than two-thirds said they believed it was unfair that part-time, temporary, andcontract workers are paid lower hourlywages than regular employees doing thesame job.
Sixty percent said they would be willing to vote for a Congressional candidate whosupported legislation requiring parity in payand benefits between part-time, temporaryand contract workers and regular, full-timeworkers doing the same job.
Polivka estimated thatthere were 3.3 million
direct-hire temps, morethan three times the
number of TemporaryHelp Service (THS) temps.

California’s Growing Temporary Workforce
Center on PolicyInitiatives
14
words, corporations can be expected to increasingly outsource
the function of hiring temporary workers to temp agencies.
Reasons for the Rise in Temporary Employment
There have been several explanations given for the rise in tem-
porary employment and what has been making Temporary Help
Agency workers increasingly attractive to businesses in the
United States over the last decade. The changing corporate
structure, resulting from technological changes and competi-
tive pressures, has combined with legal changes and the eco-
nomics of Wall Street to spur the rise in temporary employ-
ment. While no definitive causal links to the rise in temporary
employment have been established, the reasons listed below
indicate probable causes.
• Firms cite flexibility as an important ingredient in company
operations.15 That flexibility comes from having an essentially
expendable workforce — the temps. The competitive pressures
that arise from having interconnected global markets are given as
a reason for the importance of flexibility in the workforce.
• Another commonly cited reason, and one that has been corrob-
orated in interviews with firms, is that they can save on medical
and pension costs that they would otherwise have to provide to
permanent, full-time workers.
• The firm is absolved of Unemployment Insurance (UI) costs in the event of
layoffs. When the employment relationship between the company and the
temporary workers is terminated on completion of the specified task, the
temporary help agency is legally responsible for UI benefits. In several states,
temporary help agencies have lobbied successfully to pass bills that make it
very difficult for a temporary worker to claim UI benefits. For example, if a
temp turns down what the temporary help agency deems to be a “suitable”
placement, she is denied UI benefits (see box this page).
•Other laws that govern the workplace, such as the family and medical leave act
(FMLA), anti-discrimination laws and workplace safety laws, to name a few, do
not apply to temporary workers. The client company is not required to apply
these laws to temps since they are not included among the company’s employees.
15 Lewis Segal and Daniel Sullivan, “The Growth of Temporary Services Work,” Federal Reserve Bank of Chicago Working PaperSeries (WP-96-26), December 1996. This paper provides a very good debate of several of the items in this list.
Changing State UnemploymentInsurance Requirements
In Washington State, the temporarystaffing agencies have suggested changesin Unemployment Insurance (UI) rules thatwill affect the number of temporaryworkers that can qualify for it.
One suggestion is that temporaryworkers call the temporary agency first, as soon as an assignment has terminated,prior to applying for UI benefits. Anothersuggested change is that temporaryworkers call their agency every week in order to maintain benefit eligibility.
These two changes wi l l place anadditional burden on temporary workers,a burden that is not placed on “traditional”workers when they apply forunemployment insurance.
Similar legal changes have passedsuccessfully in 19 states. The difficulty in qualifying for UI makes it harder for a temp to break out and get into thetraditional workforce, since she may nothave the resources to pay her bills whilelooking for full-time employment.

Center on Policy
Initiatives
15
Working on the Margins
• Temps have been used to inhibit unionization among a com-
pany’s workforce due to the fact that the National Labor
Relations Act (NLRA) had made it very hard for temps to
unionize. Therefore, by hiring temps to work alongside its
regular workforce, companies could inhibit the latter from
unionizing. A recent ruling by the National Labor Relations
Board has changed the landscape by making it easier for
temps to join the collective bargaining unit at their work-
site.16 (See box on this page). However, temporary workers
may still find it difficult to form new collective bargaining
units since they do not stay with one employer or in one
location for long; and they are easily dismissed if a union
organizing campaign begins in a workplace.
• Standardization and de-skilling in technical fields has made
firm-specific knowledge less important, making room for
temporary workers who can move easily from one firm to
another. For example, standardization and widespread use
of computer software such as Excel has made firm-specific
knowledge of accounting systems less relevant.
• Simultaneously, technological advances have necessitated the
acquisition of very narrow skills. Small firms, and perhaps
even some large firms, are not able to keep such skilled work-
ers occupied full-time. Temporary agencies are then called on
to provide such skilled workers as and when they are needed.17
• Temporary workers are paid through a temporary help
agency and therefore do not appear on the payroll (or
“headcount”) of the client firm. This often results in artifi-
cially high productivity numbers. Temps also reduce a firm’s
labor costs. These two factors combine to keep investors
happy and the company’s stock prices up on Wall Street.
• Having a flexible workforce obviates the necessity for layoffs, which lower
morale among the regular workforce and are a psychologically difficult task
for managers.
16 M.B. Sturgis, Inc. and Textile Processors, Service Trades, Health Care, Professional and Technical Employees InternationalUnion Local 108, Petitioner, and Jeffboat Division, American Commercial Marine Service Company and T.T.&O. Enterprises,Inc. and General Drivers, Warehousemen & Helpers Local Union 89, affiliated with the International Brotherhood ofTeamsters, AFL-CIO, Petitioner. Cases 14-RC-11572, and 9-UC-406.
17 Lewis Segal and Daniel Sullivan, “The Growth of Temporary Services Work,” Federal Reserve Bank of Chicago Working PaperSeries (WP-96-26), December 1996.
The National Labor RelationsBoard Ruling
In two separate rulings, one in 1973(Greenhoot) and one in 1990 (Lee Hospital),the National Labor Relations Board (NLRB)ruled that temporary workers attempting tojoin a union would have to get the consent ofall their employers, i.e., the temporary helpagency (the supplier company) as well as theemployer using their services (the usercompany).
The NLRB found that there was a jointemployer relationship in the situation where atemporary help agency provided workers tothe user company.
In deciding the cases of M.B. Sturgis, Inc.and Textile Processors, Service Trades, HealthCare, Professional and Technical EmployeesInternational Union Local 108, Petitioner, andJeffboat Division, American Commercial MarineService Company and T.T.&O. Enterprises, Inc.and General Drivers, Warehousemen & HelpersLocal Union 89, affiliated with the InternationalBrotherhood of Teamsters, AFL-CIO, Petitioner,the NLRB found that the case of Lee Hospitalhad been incorrectly decided.
They found that in a unit that includes workperformed by the user’s direct employeesalongside with workers from a suppliercompany, all of the work is being performedfor the user employer.
Therefore, they conclude that there is nojoint employer relationship, and that “a unit ofemployees performing work for one useremployer is an ‘employer unit’.” This paves theway for temporary workers to join thebargaining unit at the user company at whichthey are placed.

California’s Growing Temporary Workforce
Center on PolicyInitiatives
16
With all the benefits, especially the financial ones that result from hiring tem-
porary workers, it is no surprise that their numbers have increased. Temporary
employment is often justified by the staffing industry on the grounds that it
provides the flexibility prized by workers. However, 59% of temps in the BLS
Contingent Workers Supplement in February 1997 said they would prefer to be
in the “traditional” work arrangement.
Temporary Workers in the United States
The Bureau of Labor Statistics (BLS) obtained information on the extent of
non-standard work through a Supplement to its Current Population Surveys
(CPS) in February of 1995, 1997 and 1999. The BLS defined four classes of
alternative workers, namely, Independent Contractors, On-call Workers,
Temporary Help Agency Workers, and Contract Company Workers. The demo-
graphics of temporary workers in the United States are given below in Tables
3.1-3.4. The tables are taken from a paper published by BLS researchers, analyz-
ing the 1997 supplement.18 (See Table 3.1 on the next page.)
Their analysis showed that there were 1.3 million temporary help agency work-
ers in the United States in 1997, about 1 percent of the total workforce (Table
3.1). More than half (53%) of temporary help agency workers were between
16 and 34 years old, compared to about 40% of workers with traditional work
arrangements. More than 30% of all temporary workers were between 25 and
34 years old, equally divided between men and women, compared to 25.4% of
traditional workers. Fifty-five percent of temporary workers were women, while
among traditional workers, just over 47% were women.
Blacks are over-represented among temporary workers, while
Whites formed a lower proportion of temporary workers than
the traditional workforce (Table 3.1). While 10.9% of the tradi-
tional workforce was Black, 21.3% of temporary workers was
Black. The over-representation among temporary workers for
Hispanics was lower than that for Blacks - 12.3% of temps and
9.6% of traditional workers were of Hispanic origin. (See Table
3.2 on the page 18.)
Of male temporary workers between 25 and 64 years of age,
23.5% had a college degree, compared to only 20.6% of female temporary
workers (Table 3.2). While these proportions are lower than in the regular
52% worked temp jobsbecause they were
the only jobs that theycould find or out of the
hope that the jobs wouldlead to permanent
employment.
18 “Workers in Alternative Employment Arrangements: A Second Look,” Sharon R. Cohany, Monthly Labor Review, November,1998.
The “Kelly girl” is no longer a marriedwoman working part-time for “pin money.”Men comprise almost 45% of the tempo-rary workforce.
The temporary workforce has a higherproportion of women, minorities, andyounger workers than the traditional work-force does. Most temporary workers workfull-time, and less than one-third are likely tobe employed in clerical or administrativesupport occupations.

Center on Policy
Initiatives
17
Working on the Margins
workforce, the proportion with some college was significantly higher among
temporary workers. In this group, 37.2% of women and 35.1% of men had
some college education. This indicates that in this high-tech world, a college
degree is required in order to reduce the incidence of temporary work and that
having a college degree does not necessarily protect one from having to work in
a temporary job. (See Table 3.3 on the page 19.)
Forty-one percent of male temporary workers were employed as Operators,
Fabricators and Laborers (Table 3.3), more than twice the proportion in the
traditional workforce. Among women, 50.3% of temporary workers were
employed in Administrative Support and Clerical Occupations, twice the pro-
portion in the traditional workforce. As the occupations suggest, male tempo-
rary workers worked mainly in Manufacturing industries (38.2%), while
Employed persons in the United States with alternative and traditional work arrangements, by selected characteristics, February 1997 [Percent distribution]
Table 3.1
114,199100.0
5.09.825.427.720.49.22.5
52.72.55.1
13.714.610.54.91.4
47.32.44.711.713.19.94.31.1
100.084.810.99.6
Source: Sharon R. Cohany, "Workers in Alternative Arrangements: A Second Look", Monthly Labor Review, Nov. 1998.
Characteristic
Total, 16 years and older (thousands)Percent
16 to 19 years20 to 24 years
25-34 years35-44 years45-54 years
55 to 64 years65 years and older
Men, 16 years and olderPercent
16 to 19 years20 to 24 years
25-34 years35-44 years45-54 years
55 to 64 years65 years and older
Women, 16 years and olderPercent
16 to 19 years20 to 24 years
25-34 years35-44 years45-54 years
55 to 64 years65 years and older
PercentWhiteBlack
Hispanic Origin
Race and Hispanic Origin
Age and Sex
Temporary help agency workers
1,300100.0
6.016.530.321.516.26.72.8
44.72.89.615.26.96.22.21.8
55.33.26.915.214.5104.51.1
100.075.121.312.3
Workers with traditional arrangements

California’s Growing Temporary Workforce
Center on PolicyInitiatives
18
women were predominantly employed in Services (50.9%). (See Table 3.4 on
the page 20.)
The Contingent Workers Supplement also provided evidence that temporary
workers had long tenures in their work arrangement and had also worked on
one assignment for a long period of time. While median tenure in the tempo-
rary work arrangement was 6 months in 1997, almost 25% had worked as
temps for more than a year. Thirty-five percent had been on the current assign-
ment for less than 3 months, but almost 25% had been on the assignment for
more than a year. The median tenure in an assignment was 5 months.
Access to health and pension benefits was also found to be low for temporary
workers. Only 7% had health insurance through their employer and only 3.7%
had pension coverage through their employer.
In summary, the data showed that the “traditional” picture of a temporary work-
er being a woman with a family, working part-time no longer holds true. While
women comprised more than half the temporary workforce, a significant propor-
tion were men. Blacks were significantly over-represented among temporary
workers, as were younger workers. A surprisingly high proportion of temporary
workers had a college degree. The report also found that almost half the female
temporary workers were raising children, a smaller proportion than among tradi-
Table 3.2
97.0100.011.130.736.321.9
397100.013.927.535.123.5
573100.0
9.233.037.220.6
94,424100.09.732.828.029.5
49,873100.011.331.926.430.4
44,551100.07.933.829.828.5
CharacteristicTemporary helpagency workers
Workers with traditionalarrangements
Total, 25 to 64 years old (thousands)Percent
Less than a high school diplomaHigh school graduate, no college
Less than a bachelor's degreeCollege graduate
Men, 25 to 64 years old (thousands)Percent
Less than a high school diplomaHigh school graduate, no college
Less than a bachelor's degreeCollege graduate
Women, 25 to 64 years old (thousands)Percent
Less than a high school diplomaHigh school graduate, no college
Less than a bachelor’s degreeCollege graduate
Educational attainment and sex
Employed persons in the United States with alternative and traditional work arrangements, by educational attainment and sex, February 1997 [Percent distribution]
Source: Sharon R. Cohany, “Workers in Alternative Arrangements: A Second Look", Monthly Labor Review, Nov. 1998.

Center on Policy
Initiatives
19
Working on the Margins
tional workers. Eighty percent of temporary workers and 82% of traditional
workers worked full-time.
Table 3.3
Occupation and SexTemporary helpagency workers
Total, 16 years and older (thousands) 1,300 114,199Percent 100.0 100.0
Executive, administrative, and managerial 6.9 14.1Professional specialty 6.6 15.3
Technicians and related support 5.8 3.4Sales occupations 1.7 11.7
Administrative support, including clerical 34.1 15.3Service occupations 9.1 13.5
Precision production, craft, and repair 5.1 10.3Operators, fabricators, and laborers 29.1 14.3
Farming, forestry, and fishing 1.6 2.2
Men, 16 years and older (thousands) 581 60,180Percent 100.0 100.0
Executive, administrative, and managerial 4.6 14.4Professional specialty 9.5 13.4
Technicians and related support 8.1 3.2Sales occupations 1.5 10.8
Administrative support, including clerical 13.9 6.3Service occupations 7.9 10.5
Precision production, craft, and repair 10.3 17.8Operators, fabricators, and laborers 41.1 20.4
Farming, forestry, and fishing 2.9 3.3
Women, 16 years and older (thousands) 719 54,019Percent 100.0 100.0
Executive, administrative, and managerial 8.8 13.8Professional specialty 4.3 17.5
Technicians and related support 3.9 3.6Sales occupations 1.7 12.7
Administrative support, including clerical 50.3 25.3Service occupations 9.9 16.8
Precision production, craft, and repair 1 1.8Operators, fabricators, and laborers 19.5 7.6
Farming, forestry, and fishing 0.6 0.9
Employed persons in the United States with alternative and traditional work arrangements, by occupation and sex, February 1997 [Percent distribution]
Workers with Traditional arrangements
Source: Sharon R. Cohany, “Workers in Alternative Arrangements: A Second Look”, Monthly Labor Review, Nov. 1998.
A surprisingly highproportion of
temporary workershad a college degree.

California’s Growing Temporary Workforce
Center on PolicyInitiatives
20
Table 3.4
Industry and SexTemporary helpagency workers
Total, 16 years and older (thousands) 1,300 114,199Percent 100.0 100.0
— 14.10.7 15.32.5 3.431.8 11.76.1 15.38.4 13.58.5 10.342 14.3
2.2
Men, 16 years and older (thousands) 581 60,180Percent 100.0 100.0
14.413.4
3.5 3.238.2 10.89.2 6.311 10.5
6.8 17.831.3 20.4
3.3
Women, 16 years and older (thousands) 719 54,019Percent 100.0 100.0
1.11.3 0.21.6 1.1
26.6 11.53.5 4.36.3 21.29.8 8.2
50.9 47.84.5
Employed persons in the United States with alternative and traditional work arrangements, by industry and sex, February 1997 [Percent distribution]
Workers with Traditional arrangements
Source: Sharon R. Cohany, “Workers in Alternative Arrangements: A Second Look”, Monthly Labor Review, Nov. 1998.
AgricultureMining
ConstructionManufacturing
Transportation and public utilitiesWholesale and retail trade
Finance, insurance, and real estateServices
Public Administration
AgricultureMining
ConstructionManufacturing
Transportation and public utilitiesWholesale and retail trade
Finance, insurance, and real estateServices
Public Administration
AgricultureMining
ConstructionManufacturing
Transportation and public utilitiesWholesale and retail trade
Finance, insurance, and real estateServices
Public Administration
—
——
—
—
—

Center on Policy
Initiatives
21
Working on the Margins
Temporary Workers in CaliforniaIVTemporary Workers in California - A Snapshot
The Contingent Workers Supplement to the Current Population Surveys does
not provide a sufficiently large sample size for California. In order to examine
temporary workers in this state, we combined and analyzed three years of data
(1997-1999) from the Census Bureau’s Current Population Survey (CPS)
Earnings File (See Appendix A for Data Methodology).
In the Current Population Surveys, the industry in which the respondent is
employed is identified by a 3-digit code. The Industry Code that includes
Temporary Help Agencies is 731, Personnel Supply Services. In the following
analysis, we refer to workers classified under Industry Code 731 as “temporary
workers,” and compare them to full-time workers who are not in that industry,
i.e. the “traditional workforce.”19
The gender distribution of temporary workers in California was similar to that
in the United States, with 57.7% of temporary workers being female. In the tra-
ditional full-time workforce, 41.4% were female, leaving a significant over-rep-
resentation of females in the temporary workforce. Among men, the propor-
Source: Economic Policy Institute analysis of CPS-ORG data
Figure 4.1Gender Distribution of Temporary and Regular Full-Time Workers in California
—
10.00
20.00
30.00
40.00
50.00
60.00
70.00
Female MaleGender
Per
cent
Temporary Workers Regular Full-Time Workers
19 Since there is no direct method of separating the workers working at the temporary help agency from those placed by theagency, we include in these numbers workers hired to work at the temp agency. However, we do not believe that these num-bers are large enough to significantly alter the findings.

California’s Growing Temporary Workforce
Center on PolicyInitiatives
22
tion in the traditional full-time workforce (58.6%) was significantly higher
than in the temporary workforce (42.3%).
The over-representation of women among temps may be explained by the fact
that they are more likely to have child-care and other considerations that pre-
vent full-time employment. For women who are unable to take on full-time
work this work arrangement provides the flexibility that they desire. The fact
that men make up a significant proportion of temps may have a couple of
plausible explanations. One, they are taking on jobs that were traditionally
done by women and that were temporary in nature. An example of such an
arrangement is that of administrative or clerical work, which was traditionally
done by female temps, but which is now also done by men. Second, temporary
work is becoming common in occupations dominated by men, such as con-
struction and production occupations.
As in the United States, Blacks in California were over-represented among tem-
porary workers. While 6.6% of regular, full-time workers were Black, 12.4% of
temporary workers in California were Black. Whites and Other Races were
under-represented among the temporary workforce. Hispanics comprised just
under 30% of both the temporary and the traditional full-time workforce.
The over-representation of Blacks among temps may indicate that they are
more likely to work in occupations that are staffed by temporary workers. The
Source: Economic Policy Institute analysis of CPS-ORG data
Figure 4.2Racial Distribution of Temporary and Regular Full-Time Workers in California
—
10.00
20.00
30.00
40.00
50.00
60.00
Black Hispanic White OtherRace
Per
cent
Temporary Workers Regular Full-Time Workers
As in the United States,Blacks in California
were over-representedamong temporary
workers.

Center on Policy
Initiatives
23
Working on the Margins
high proportion of Blacks among temps may also reflect the fewer opportuni-
ties that they have for finding permanent, full-time employment.
A higher proportion of temporary workers are in the early years of their work-
ing lives compared to traditional full-time workers. One out of five temps is
between 18 and 24 years old, while only about one in ten workers in the tradi-
tional workforce are in this age category. The largest proportion of temporary
workers (31%) is between 25 and 34 years old. More than 50% of temporary
workers are between 18 and 34 years old, compared to 40% of traditional workers.
Temporary workers between 18 and 24 years of age are possibly using the
opportunity while in school or college to earn a little spending money. For
younger workers for whom temporary work is a summer-time work opportuni-
ty, there are probably few drawbacks to this arrangement. On the other hand,
for younger workers between 25 and 34 years old, working as temps early in
their careers is a disadvantage if it makes it increasingly difficult for them to move
into regular, full-time positions, or delays their entry into a clear career path.
There is no significant difference in the proportions of temporary workers
(41%) and traditional workers (40%) with a high school education or less.
(See Figure 4.4 on the next page.) A higher proportion of temps has either
Some College or an Associate Degree (38%) than traditional workers (30%).
The traditional workforce betters the temporary workforce only in the propor-
Source: Economic Policy Institute analysis of CPS-ORG data
Figure 4.3Age Distribution of Temporary and Regular Full-Time Workers in California
—
5.00
10.00
15.00
20.00
25.00
30.00
35.00
18-24 25-34 35-44 45-54 55-64Age categories
Per
cent
Temporary Workers Regular Full-Time Workers
The largestproportion of
temporary workers(31%) is between 25
and 34 years old.
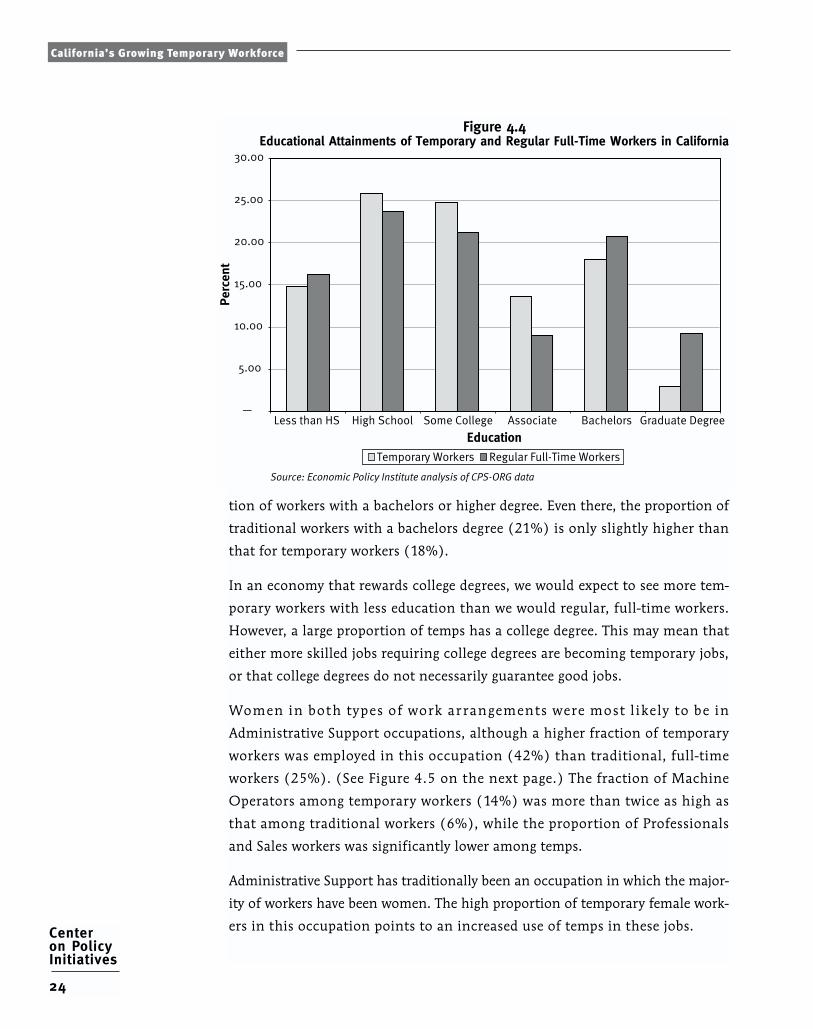
California’s Growing Temporary Workforce
Center on PolicyInitiatives
24
tion of workers with a bachelors or higher degree. Even there, the proportion of
traditional workers with a bachelors degree (21%) is only slightly higher than
that for temporary workers (18%).
In an economy that rewards college degrees, we would expect to see more tem-
porary workers with less education than we would regular, full-time workers.
However, a large proportion of temps has a college degree. This may mean that
either more skilled jobs requiring college degrees are becoming temporary jobs,
or that college degrees do not necessarily guarantee good jobs.
Women in both types of work ar rangements were most l ikely to be in
Administrative Support occupations, although a higher fraction of temporary
workers was employed in this occupation (42%) than traditional, full-time
workers (25%). (See Figure 4.5 on the next page.) The fraction of Machine
Operators among temporary workers (14%) was more than twice as high as
that among traditional workers (6%), while the proportion of Professionals
and Sales workers was significantly lower among temps.
Administrative Support has traditionally been an occupation in which the major-
ity of workers have been women. The high proportion of temporary female work-
ers in this occupation points to an increased use of temps in these jobs.
Source: Economic Policy Institute analysis of CPS-ORG data
Figure 4.4Educational Attainments of Temporary and Regular Full-Time Workers in California
—
5.00
10.00
15.00
20.00
25.00
30.00
Less than HS High School Some College Associate Bachelors Graduate Degree
Education
Per
cent
Temporary Workers Regular Full-Time Workers

Center on Policy
Initiatives
25
Working on the Margins
Administrative Support occupations employed the highest fraction (24%) of
male temporary workers, more than three times the proportion in the tradi-
tional workforce. Almost 23% of male temporary workers were employed as
Source: Economic Policy Institute analysis of CPS-ORG data
Figure 4.5Occupations of Female Temporary and Regular Full-time Workers in California
0.00
5.00
10.00
15.00
20.00
25.00
30.00
35.00
40.00
45.00
Admin
istra
tion
Profe
ssional
Tech
/Support
Sales
Admin
istra
tive Support
Private
House
hold
Prote
ctive
Service
s
Service
Prod/C
raft/
Repair
Machin
e Opera
tors
Transp
ortatio
n
Labore
rs
Farm
/Fish
eries/
Trees
Occupation
Perc
ent
Temporary Workers Regular Full-Time Workers
Source: Economic Policy Institute analysis of CPS-ORG data
Figure 4.6Occupations of Male Temporary and Regular Full-Time Workers in California
0.00
5.00
10.00
15.00
20.00
25.00
30.00
Admin
istra
tion
Profe
ssional
Tech
/Support
Sales
Admin
istra
tive Support
Private
House
hold
Prote
ctive
Service
s
Service
Prod/C
raft/
Repair
Machin
e Opera
tors
Transp
ortatio
n
Labore
rs
Farm
/Fish
eries/
Trees
Perc
ent
Temporary Workers Regular Full-Time Workers
Occupations

California’s Growing Temporary Workforce
Center on PolicyInitiatives
26
As with the UnitedStates, we found that thetemporary workforce inCalifornia is more likely to come from vulnerablepopulations. It is morelikely to be non-White,female, younger, and withlower educational attain-ment than the traditional,full-time workforce.
Laborers, four times the rate in the traditional workforce. As among female
temps, the fraction of temporary workers who were employed as Professionals
was much lower (2%) than among the traditional workers (14%).
Here again having almost one-fourth of male temporary workers in the
Administrative Support Occupations could have two explanations. One, it is a
reflection of the growing trend towards staffing this occupation with temps
and two, it reflects the growing number of men who choose this occupation.
Laborer occupations are more likely to consist of unskilled work that does not
require training. This may be a reason for the large proportion of temporary
workers in this occupation.
Within the temporary workforce, we found that women were more likely
than men to be employed in Professional, Administrative Support and
Operator occupations, while men were more likely than women to be
employed as Laborers.
Only 37% of temporary workers were married, compared to 56% of traditional
workers. This is perhaps explained by the fact that a higher proportion of
temps was below 35-years-old than those in the traditional workforce.
The demographics of temporary workers in California are similar to that in the
United States. Women make up the majority of temps, while men are a signifi-
cant minority.
Source: Economic Policy Institute analysis of CPS-ORG data
Figure 4.7Marital Status of Temporary and Regular Full-Time Workers in California
—
10.00
20.00
30.00
40.00
50.00
60.00
70.00
Married, Spouse Present Not MarriedMarital Status
Per
cent
Temporary Workers Regular Full-Time Workers

Center on Policy
Initiatives
27
Working on the Margins
Wages of Temporary Workers in California
Our analysis showed that the median hourly wage for female temporary work-
ers in California was $10 and for male temps $10.22. Female workers in the
regular, full-time workforce in California earned a median hourly wage of
$12.50, while their male counterparts earned $14.31. However, the level of
median wages alone is not indicative of discrimination against temporary
workers. Instead, one should examine the determinants of wages in order to
conclude whether discrimination occurred. Educational attainment and the
industry and occupation of the worker are important factors in wage determi-
nation. Work experience is also a determinant, with a worker’s age standing in
as a proxy for experience. Other factors in this society that can influence wage
are race, union membership, marital status, and whether the worker lives in
the center of the city. Using all these “explanatory variables,” we assessed
whether temporary workers did receive lower wages than their equally situated
counterparts in the traditional, full-time workforce.
We found that male temporary workers’ hourly earnings were 13.5% below
that of male traditional, full-time workers of similar age, race, urban status
and education, and that female temporary workers earned 5.4% less per hour
than female workers with similar demographic characteristics who had tradi-
tional full-time jobs. When we compared people with similar demographics
who worked in the same industry and occupation, we found that the wage dif-
ference persisted. Male temps earned 8.78% below their regular, full-time
counterparts, while female temps earned 6.66% less than their counterparts.20
While these differences may not seem large to some, there is also significant
evidence that for the nation as a whole these workers have low access to med-
Table 4.1Wage Deficits for Temporary Workers in California
Men WomenWage Deficit Wage Deficit
Personal characteristics -13.53%* -5.37%
Personal and Job characteristics -8.78%* -6.66%*
Personal characteristics and Part-Time Status -12.38%* -5.80%
Personal and Job characteristics and Part-Time Status -7.60% -5.55%
An * indicates significance at the 5% level
Source: Economic Policy Institute analysis of Census Bureau data.
Characteristics and Status
20 These findings reverse the national data that show that once job characteristics are added, the pay penalties disappear.
Male temporaryworkers’ hourly
earnings were 13.5%below that of male
traditional, full-timeworkers. Female
temporary workersearned 5.4% less per
hour than femaleworkers with similar
demographiccharacteristics.
California’s Growing Temporary Workforce
Center on PolicyInitiatives
28
ical and pension benefits and other perks such as paid vacations. When the
monetary value of the missing benefits are included the earnings differential
can be quite substantial.
We also included in our wage analysis the part-time status of workers. When
part-time status is added, we found a loss of statistical significance in pay penal-
ties. This is most likely a reflection of the pay discrimination faced by part-time
workers, whether they are temporary workers or have traditional jobs.

Center on Policy
Initiatives
29
Working on the Margins
Regional Analysis of TemporaryEmployment in California
Temporary employment in California in the 1990s
In order to perform a regional analysis of the extent of temporary work in
California we used data from the California Employment Development
Department. The data are reported by Standard Industrial Classification (SIC)
code for the industry. The temporary help industry is classified under SIC
7363. In the following analysis when we refer to “temporary workers,” we are
referring to workers employed in SIC 7363.
The number of temporary jobs has grown tremendously in California in the
1990s (Table 5.1). The number of temporary jobs grew by 113% between 1991
and 1998, from 156,000 jobs to 334,000 jobs. In the same period, the total
number of jobs in all industries grew by just 10.25%, from 12.7 million to 14
million jobs. The growth in temporary jobs was more than 10 times the growth
in total jobs.
Temporary employment in the 15 Largest Counties in California
We analyze the trends in the number of temporary jobs for the 15 most popu-
lous counties in California for the years 1991 through 1998.21 Of California’s
58 counties, these 15 counties account for 83% of the population.
We group these counties by region, so that we form 4 regional groups of coun-
ties. The four regional groups and the counties that constitute them are:
• Bay Area - Alameda, Contra Costa, San Francisco, San Mateo and Santa
Clara Counties
V
The number oftemporary jobs grew
by 113% between 1991and 1998. In the same
period, the totalnumber of jobs
in all industries grewby just 10.25%.
21 See Appendix A for Data Methodology
Table 5.1
1991 156,309 12,701,000 1.231992 194,826 12,505,100 1.561993 177,519 12,407,600 1.431994 207,499 12,539,100 1.651995 235,906 12,795,700 1.841996 265,509 13,151,700 2.021997 296,457 13,542,800 2.191998 334,272 14,002,300 2.39
Year
% Change 1991 – 1998 113.85 10.25
Number of Temporary Jobs And Total Number of Jobs in All Industries in California in the 1990s
Percent of All Jobs That Are Temporary
Total Number of Jobs In all Industries
Total Number of Temporary Jobs

California’s Growing Temporary Workforce
Center on PolicyInitiatives
30
• Southern California - Los Angeles, Orange, San Diego and Ventura
Counties
• Central Valley - Fresno, Kern, Sacramento and San Joaquin Counties
• Inland Empire - Riverside and San Bernardino Counties
Temporary jobs as a percent of total number of jobs in all industries
The following figures show the number of temporary jobs in each county as a
percent of total jobs in that county.22 For comparison, we include in each chart
the same data for California.
What we see is an almost steady increase in the proportion of temporary jobs in
all 15 counties. Between 1991 and 1998 eleven of the counties doubled or more
than doubled the fraction of total jobs that were temporary. Riverside County
more than tripled the share of temporary jobs, the largest proportionate
increase of all the counties in this analysis. San Francisco County experienced
the smallest percentage increase, about 27%, in the share of temporary jobs.
Five counties, Los Angeles, Orange, Ventura, Santa Clara, and Contra Costa,
consistently had a higher proportion of temporary jobs than California as a
whole throughout the 1990s.
Three of the four counties, with the exception of San Diego, have had a higher
percentage of temporary jobs than California as a whole during the 1990s.
(See Figure 5.1 on the next page.) San Diego surpassed the California average
in 1997 after tracking it almost perfectly from 1991 until 1996. By 1998, San
Diego had the second highest percentage of temporary jobs among Southern
California counties. Ventura County has had the largest percentage of tempo-
rary jobs in Southern California since 1993, and it stood at almost 3.5% in
1998, the third highest among all 15 counties in this analysis. In 1998, Los
Angeles County had the lowest average among the four Southern California
counties (2.5%).
Contra Costa and Santa Clara counties have had a higher percentage of tempo-
rary jobs in the 1990s than California as a whole. (See Figure 5.2 on the page
32.) In 1998 Contra Costa and Santa Clara had the highest and the second
highest percentage of temporary jobs of the 15 counties in this analysis,
respectively. Alameda and San Mateo counties have almost consistently been
below the California average, while San Francisco has been below the
22 The data for SIC 7363 are from the establishment survey, in which each establishment reports the number of workers thatare placed by them. If a temp worker was placed by 2 agencies, for example, two temporary jobs are reported although itwas one person who held them both. Therefore, in order to normalize the data, we report the proportion of temps in relationto the total number of jobs.
Between 1991 and 1998eleven of the countiesdoubled or more thandoubled the fraction of
total jobs that weretemporary.

Center on Policy
Initiatives
31
Working on the Margins
California average since 1994. Between 1991 and 1998 San Francisco had the
slowest rate of growth of temporary jobs, which increased by only 31% in this
time period. However, it is significant that in the biggest boom years ever expe-
rienced in the area Santa Clara County, the heart of Silicon Valley, has main-
tained a high percentage of temporary jobs. Temporary jobs accounted for
3.53% of the total number of jobs in the county.
Until 1995 all four counties in this region were below the California average of
temporary jobs. (See Figure 5.3 on the page 32.) In 1996 Sacramento experi-
enced a big jump in the percent of temporary jobs, increasing from 1.6% of
total jobs in 1995 to 3.1% in 1996. In the Central Valley and in all 15 counties
in our analysis Fresno County had the lowest percent of temporary jobs in
1998 at 1.1% of total jobs.
Both Riverside and San Bernardino counties had remained below the
California average of temporary jobs until 1998, when San Bernardino County
surpassed California. (See Figure 5.4 on the page 33.) While the share of tem-
porary jobs in California was 2.39% in 1998, San Bernardino County’s share
was 2.71%. In Riverside County the share of temporary jobs in total jobs in the
county increased from 0.6% in 1991 to 2.13% in 1998. The number of tempo-
Source: Labor Market Information Division, California Employment Development Department
Figure 5.1Temporary Jobs as a Percent of Total Jobs in Major Southern California Counties
0.00
0.50
1.00
1.50
2.00
2.50
3.00
3.50
4.00
1991 1992 1993 1994 1995 1996 1997 1998Year
Ratio
Los Angeles Orange San Diego Ventura California

California’s Growing Temporary Workforce
Center on PolicyInitiatives
32
Figure 5.3Temporary Jobs as a Percent of Total Jobs in Major Central Valley Counties
Source: Labor Market Information Division, California Employment Development Department
Fresno Kern Sacramento San Joaquin California
0.00
0.50
1.00
1.50
2.00
2.50
3.00
3.50
1991 1992 1993 1994 1995 1996 1997 1998Year
Ratio
Source: Labor Market Information Division, California Employment Development Department
Figure 5.2Temporary Jobs as a Percent of Total Jobs in Major Bay Area Counties
4.50
Alameda Contra Costa San FranciscoSan Mateo Santa Clara California
0.00
0.50
1.00
1.50
2.00
2.50
3.00
3.50
4.00
1991 1992 1993 1994 1995 1996 1997 1998Year
Ratio

Center on Policy
Initiatives
33
Working on the Margins
rary jobs increased 4.5 times between 1991 and 1998 in Riverside County.
What is remarkable is that the share of temporary jobs in all counties stayed
fairly steady through the recession years of the early 1990s but increased
tremendously during the booming mid- and late 1990s. This runs counter to
our expectations that the uncertain economic climate during the recession
would have spurred the creation of temporary jobs and that the low unemploy-
ment rates of the late 1990s would have reduced the supply of workers willing
to take on jobs with uncertain duration and few benefits. This is, perhaps, an
indication that the share of temporary jobs is not dependent on the business
cycle but is part of an ongoing structural change in the way we work.
Looking at the regions as a whole we see that Southern California and the Bay
Area had very similar patterns in the share of temporary jobs. (See Figure 5.5
on the next page.) The percentage of temporary jobs has increased almost in
tandem from just under 1.5% in 1991 to over 2.7% in 1998 in both these
regions. The Southern California counties had almost 2.5 times as many jobs
as the Bay Area counties, but they have also had just as many more temporary
jobs as the Bay Area counties. The majority of jobs in these regions are in the
Service sector, which uses proportionally more temporary workers than the
Manufacturing sector. Both regions have also experienced a tremendous eco-
nomic upturn since 1994, which has spurred the growth of jobs, including
temporary jobs.
The other two regions in our study have also had similar growth in temporary
Riverside San Bernardino California
Figure 5.4Temporary Jobs as a Percent of Total Jobs in the Inland Empire
Year
Ratio
Source: Labor Market Information Division, California Employment Development Department
0.00
0.50
1.00
1.50
2.00
2.50
3.00
1991 1992 1993 1994 1995 1996 1997 1998

California’s Growing Temporary Workforce
Center on PolicyInitiatives
34
jobs, increasing from under 1% in 1991 to 2.2% in the Central Valley and
2.4% in the Inland Empire. The Central Valley has a large proportion of
Agricultural jobs. Farm labor is not included in the same SIC code as tempo-
rary help (SIC 7363) and instead is classified under SIC 0761. Since we do not
include this industry in our analysis, we may be undercounting the true num-
ber of temporary jobs in this region. The average share of temporary jobs in
California as a whole falls in the middle of the range of the four regions.
Occupational Projections for Temporary Jobs
The Employment Development Department (EDD) of the State of California
produces occupational projections for seven-year periods for all industries,
classified by their Standard Industrial Classification (SIC) code, including SIC
7363. We use the latest data available for 4-digit industries for the years 1995-
2002 in our analysis. (See Appendix A).
The occupations are classified according to their Occupational Employment
Statistics (OES) codes.23 We have grouped the occupations into seven major
occupational categories. These data are provided in the tables below, but we
will also discuss finer occupational gradations that are not presented in the
report in the interest of brevity.
23 The Occupational Employment Statistics (OES) program is a survey conducted annually by the Bureau of Labor Statisticsthat provides estimates of employment and wages for more than 750 non-farm occupations.
Figure 5.5
Perc
ent
Source: Labor Market Information Division, California Employment Development Department
Southern California
Bay AreaCentral Valley
Inland Empire
California
1991 1992 1993 1994 1995 1996 1997 1998Year
0.00
0.50
1.00
1.50
2.00
2.50
3.00
Temporary Employment as a Percent of Total Employment in All Industries, Regional Average

Center on Policy
Initiatives
35
Working on the Margins
The change in the nature of temporary work is apparent when we examine the
occupational projections. Clerical and Administrative Support occupations
employ the largest number of temporary workers, and those occupations are
expected to be the largest users of temporary work in 2002. However, the sec-
ond largest numerical growth and the fastest rate of growth is expected to be
among Production, Construction, and Material Handling occupations. In all
15 counties combined, temporary jobs in Clerical and Administrative Support
occupations are expected to increase by 39,740 jobs (or 35%), and Production,
Construction and Material Handling jobs are expected to increase by 31,070
jobs (60%) between 1995 and 2002. The third largest numerical growth
(11,300 jobs between 1995 and 2002) and third fastest rate of growth (42.7%)
in temporary jobs is expected to be in Professional, Paraprofessional and
Technical occupations, which include engineers, computer programmers, and
nurses. Managerial and Administrative occupations are expected to grow by
55% but that amounts to an increase of just over 2,700 jobs.
In 2002 the largest number of temporary jobs is still expected to be in Clerical
and Administrative Support occupations, but a significant share will be taken
up by Production, Construction and Material Handling occupations. In 2002
50% of temporary jobs are expected to be in Clerical and Administrative
Support occupations, declining from 53% in 1995. Production, Construction
and Material Handling occupations are expected to comprise 27% of tempo-
rary jobs in the 15 counties, increasing from 24% in 1995; Professional occu-
pations are forecast to hold steady at 12% of temporary jobs. The shift in the
share of temporary jobs going to Production occupations is of concern since a
large number of those jobs have been well-paying union jobs that provided
training and benefits and which are now increasingly filled by temporary work-
ers who will receive lower access to these perks.
Projections for Major Southern California Counties
In the Southern California counties that we analyze it is foreseen that tem-
porary employment will grow by just over one-third to almost 180,000 jobs
in 2002. (See Table 5.2 on the next page.) In this region among all tempo-
rary jobs Production, Construction and Material Handling Occupations are
expected to be the fastest growing, increasing by almost 50% in the seven-
year period between 1995 and 2002. The largest number of jobs is expected
to be in Clerical and Administrative Support Occupations, with over 95,000
jobs in 2002.
The largest numberof jobs is expected to
be in Clerical andAdministrative SupportOccupations, with over95,000 jobs in 2002.

California’s Growing Temporary Workforce
Center on PolicyInitiatives
36
LOS ANGELES
TEMPORARY JOBSManagerial and Administrative 2230 740 49.66Professional and Technical 11660 3390 40.99Sales 3440 1060 44.54Clerical and Administrative Support 66380 16500 33.08Service 4880 1130 30.13Agriculture 80 20 33.33Production, Construction and Material Handling 22530 8040 55.49TOTAL TEMPORARY JOBS 111200 30880 38.45TOTAL ALL JOBS
14908270238049880375060
1449080320
3746500 4231800 485300 12.95TEMPORARY JOBS AS PERCENT OF TOTAL 2.14 2.63
ORANGE
TEMPORARY JOBSManagerial and AdministrativeProfessional and TechnicalSalesClerical and Administrative SupportServiceAgricultureProduction, Construction and Material HandlingTOTAL TEMPORARY JOBSTOTAL ALL JOBSTEMPORARY JOBS AS PERCENT OF TOTAL
890 250 39.064460 950 27.071200 290 31.8715240 2220 17.052030 310 18.0240 10 33.33
10060 2860 39.7233920 6890 25.49
1322600 170900 14.84
6403510910
13020172030
720027030
11517002.35 2.56
SAN DIEGO
TEMPORARY JOBSManagerial and AdministrativeProfessional and TechnicalSalesClerical and Administrative SupportServiceAgricultureProduction, Construction and Material HandlingTOTAL TEMPORARY JOBSTOTAL ALL JOBSTEMPORARY JOBS AS PERCENT OF TOTAL
530 790 260 49.062770 3770 1000 36.10650 910 260 40.007170 9000 1830 25.521370 1720 350 25.5530 30 0 0.00
5090 7640 2550 50.1017610 23860 6250 35.49978600 1155800 177200 18.11
1.80 2.06
VENTURA
TEMPORARY JOBSManagerial and AdministrativeProfessional and TechnicalSalesClerical and Administrative SupportServiceAgricultureProduction, Construction and Material HandlingTOTAL TEMPORARY JOBSTOTAL ALL JOBSTEMPORARY JOBS AS PERCENT OF TOTAL
160 230 70 43.75940 1250 310 32.98200 280 80 40.004160 4790 630 15.14360 420 60 16.6710 20 10 100.00
2340 3260 920 39.328170 10250 2080 25.46
237300 276600 39300 16.563.44 3.71
TOTAL SOUTHERN CALIFORNIA
TEMPORARY JOBSManagerial and AdministrativeProfessional and TechnicalSalesClerical and Administrative SupportServiceAgricultureProduction, Construction and Material HandlingTOTAL TEMPORARY JOBSTOTAL ALL JOBSTEMPORARY JOBS AS PERCENT OF TOTAL
2820 4140 1320 46.8115490 21140 5650 36.484140 5830 1690 40.8274210 95370 21160 28.517200 9050 1850 25.69130 170 40 30.77
29120 43490 14370 49.35133110 179230 46080 34.626114100 6986800 872700 14.27
2.18 2.57
Table 5.2
EMPLOYMENT PROJECTIONS FOR TEMPORARY JOBS AND ALL JOBS FOR MAJOR SOUTHERN CALIFORNIA COUNTIES
COUNTY/OCCUPATIONS 1995 2002 Change % Change
Source: Labor Market Information Division, California Employment Development Department

Center on Policy
Initiatives
37
Working on the Margins
The faster growing “blue-collar” occupations within the Production,
Construction and Material Handling Occupations are expected to be Machine
Setters and Operators. Numerically, the largest group of workers in the
Production, Construction and Material Handling Occupations in 1995 was
that of Helpers, Laborers and Material Movers, which includes construction
helpers and freight movers.
Los Angeles County is expected to experience the fastest rate of growth in tem-
porar y jobs among al l Southern California counties. Production,
Construction, and Material Handling occupations are expected to grow the
fastest by 55.49% in between 1995 and 2002. But Manager ial and
Administrative occupations are expected to experience close to a 50% rate of
growth. These occupations require work experience and a bachelor’s degree or
higher level of education, but are still expected to have an increasing number
of temporary workers.
In Orange County, Clerical and Administrative Support occupations are
expected to have a slow rate of growth (17.05%) and the largest growth is
expected in Production, Construction and Material Handling occupations.
In San Diego County there is an expected 35% growth between 1995 and 2002
in all temporary jobs. The highest growth rate (50%) is expected to be in the
Production, Construction and Material Handling occupations, which will
grow to 7,650 jobs in 2002. A greater than 50% growth is expected in occupa-
tions that require a Bachelor’s degree, such as Electronic and Electrical
Engineers, Computer Engineers, Computer Programmers, Systems Analysts,
and Managers and Administrators.
Ventura County is expected to experience the slowest rate of growth in tempo-
rary jobs. While Managerial and Administrative occupations are predicted to
grow the fastest, the largest numerical growth is foreseen in Production,
Construction and Material Handling occupations.
Projections for the Bay Area
In the Bay Area counties that we analyze in this repor t Cler ical and
Administrative Support occupations had the highest employment among all
temporary jobs in 1995, and it is expected to remain the largest occupational
group in 2002. (See Table 5.3 on the next page.) This occupation is expected
to grow by more than 50%, but the highest rate of growth is expected to be in
Production, Construction and Material Handling Occupations, which is
expected to grow by almost 82%, to 25,870 jobs in 2002. Each occupation

California’s Growing Temporary Workforce
Center on PolicyInitiatives
38
group is expected to grow by more than 50% between 1995 and 2002.
In the Clerical and Administrative Support Occupations the largest occupation in
all counties is that of Secretarial and General Office Occupations (not shown in
the tables in this paper). The number of temporary workers in Manager and
ALAMEDA
TEMPORARY JOBSManagerial and AdministrativeProfessional and TechnicalSalesClerical and Administrative SupportServiceAgricultureProduction, Construction and Material HandlingTOTAL TEMPORARY JOBSTOTAL ALL JOBSTEMPORARY JOBS AS PERCENT OF TOTAL
230 300 70 30.431430 1660 230 16.08400 480 80 20.004520 4820 300 6.64730 800 70 9.5910 20 10 100.00
2530 3290 760 30.049850 11370 1520 15.43
605800 668500 62700 10.351.63 1.70
CONTRA COSTA
TEMPORARY JOBSManagerial and AdministrativeProfessional and TechnicalSalesClerical and Administrative SupportServiceAgricultureProduction, Construction and Material HandlingTOTAL TEMPORARY JOBSTOTAL ALL JOBSTEMPORARY JOBS AS PERCENT OF TOTAL
210 400 190 90.481050 1750 700 66.67310 560 250 80.653270 5350 2080 63.61600 1040 440 73.3310 20 10 100.00
1980 3870 1890 95.457430 12990 5560 74.83
291700 354100 62400 21.392.55 3.67
SANTA CLARA
TEMPORARY JOBSManagerial and AdministrativeProfessional and TechnicalSalesClerical and Administrative SupportServiceAgricultureProduction, Construction and Material HandlingTOTAL TEMPORARY JOBSTOTAL ALL JOBSTEMPORARY JOBS AS PERCENT OF TOTAL
480 860 380 79.172880 4810 1930 67.01810 1390 580 71.60
15740 24020 8280 52.601160 1770 610 52.5920 40 20 100.00
6670 12180 5510 82.6127760 45070 17310 62.35831900 1025300 193400 23.253.34 4.40
SAN FRANCISCO
TEMPORARY JOBSManagerial and AdministrativeProfessional and TechnicalSalesClerical and Administrative SupportServiceAgricultureProduction, Construction and Material HandlingTOTAL TEMPORARY JOBSTOTAL ALL JOBSTEMPORARY JOBS AS PERCENT OF TOTAL
200 480 280 140.00870 2090 1220 140.23240 590 350 145.833420 7120 3700 108.19550 1230 680 123.6410 20 10 100.00
2000 4860 2860 143.007290 16390 9100 124.82
513300 564400 51100 9.961.42 2.90
Table 5.3
EMPLOYMENT PROJECTIONS FOR TEMPORARY JOBS AND ALL JOBS FOR MAJOR BAY AREA COUNTIES
COUNTY/OCCUPATIONS 1995 2002 Change % Change
Table 5.3 continued on the next page

Center on Policy
Initiatives
39
Working on the Margins
Supervisor Occupations is expected to grow by more than 60% in all of the major
occupational groups, except in the Agricultural Occupations group. Among the
other occupations that are expected to grow substantially are the computer-relat-
ed occupations that include programmers and systems analysts. This group is
expected to grow by 128% between 1995 and 2002. What we are seeing is the
expected rise in professional and technical occupations, which are higher paying
than the clerical occupations that are predominant in temporary jobs.
The largest growth in temporary jobs within the Production, Construction and
Material Handling Occupations will be seen in occupations of First-Line
Super visors and Managers, while the occupation of Machine Setters,
Operators and Tenders is expected to almost double in number. Most of these
occupations have traditionally been union jobs, where pay has been high with
health and retirement benefits. The rise of temporary jobs in this area, with its
uncertainties and lower pay, is beginning a race to the bottom in these occu-
pations as well.
Alameda County is expected to have the slowest rate of growth in temporary
jobs among the 15 counties in our analysis. It is not expected to experience sig-
nificantly greater than 30% growth in any occupation.
SAN MATEO
TEMPORARY JOBSManagerial and AdministrativeProfessional and TechnicalSalesClerical and Administrative SupportServiceAgricultureProduction, Construction and Material HandlingTOTAL TEMPORARY JOBSTOTAL ALL JOBSTEMPORARY JOBS AS PERCENT OF TOTAL
160 240 80 50.00600 870 270 45.00170 290 120 70.591800 2430 630 35.00450 720 270 60.0010 10 0 0.00
1040 1670 630 60.584230 6230 2000 47.28
303100 351700 48600 16.031.40 1.77
TOTAL SILICON VALLEY
TEMPORARY JOBSManagerial and AdministrativeProfessional and TechnicalSalesClerical and Administrative SupportServiceAgricultureProduction, Construction and Material HandlingTOTAL TEMPORARY JOBSTOTAL ALL JOBSTEMPORARY JOBS AS PERCENT OF TOTAL
1280 2280 1000 78.136830 11180 4350 63.691930 3310 1380 71.50
28750 43740 14990 52.143490 5560 2070 59.3160 110 50 83.33
14220 25870 11650 81.9356560 92050 35490 62.75
2545800 2964000 418200 16.432.22 3.11
Table 5.3 continued
EMPLOYMENT PROJECTIONS FOR TEMPORARY JOBS AND ALL JOBS FOR MAJOR BAY AREA COUNTIES
COUNTY/OCCUPATIONS 1995 2002 Change % Change
Source: Labor Market Information Division, California Employment Development Department

California’s Growing Temporary Workforce
Center on PolicyInitiatives
40
FRESNO
TEMPORARY JOBSManagerial and AdministrativeProfessional and TechnicalSalesClerical and Administrative SupportServiceAgricultureProduction, Construction and Material HandlingTOTAL TEMPORARY JOBSTOTAL ALL JOBSTEMPORARY JOBS AS PERCENT OF TOTAL
Table 5.4
EMPLOYMENT PROJECTIONS FOR TEMPORARY JOBS AND ALL JOBS FOR MAJOR CENTRAL VALLEY COUNTIES
COUNTY/OCCUPATIONS 1995 2002 Change % Change
Source: Labor Market Information Division, California Employment Development Department
KERN
TEMPORARY JOBSManagerial and AdministrativeProfessional and TechnicalSalesClerical and Administrative SupportServiceAgricultureProduction, Construction and Material HandlingTOTAL TEMPORARY JOBSTOTAL ALL JOBSTEMPORARY JOBS AS PERCENT OF TOTAL
SACRAMENTO
TEMPORARY JOBSManagerial and AdministrativeProfessional and TechnicalSalesClerical and Administrative SupportServiceAgricultureProduction, Construction and Material HandlingTOTAL TEMPORARY JOBSTOTAL ALL JOBSTEMPORARY JOBS AS PERCENT OF TOTAL
SAN JOAQUIN
TEMPORARY JOBSManagerial and AdministrativeProfessional and TechnicalSalesClerical and Administrative SupportServiceAgricultureProduction, Construction and Material HandlingTOTAL TEMPORARY JOBSTOTAL ALL JOBSTEMPORARY JOBS AS PERCENT OF TOTAL
TOTAL CENTRAL VALLEY
TEMPORARY JOBSManagerial and AdministrativeProfessional and TechnicalSalesClerical and Administrative SupportServiceAgricultureProduction, Construction and Material HandlingTOTAL TEMPORARY JOBSTOTAL ALL JOBSTEMPORARY JOBS AS PERCENT OF TOTAL
70 100 30 42.86360 420 60 16.6760 80 20 33.33820 1030 210 25.61240 300 60 25.00
—740 1050 310 41.892290 2980 690 30.13
160300 190200 29900 18.651.43 1.57
450 600 150 33.332420 3010 590 24.38560 710 150 26.796300 7570 1270 20.161190 1410 220 18.4910 10 0 —
5470 7750 2280 41.6816400 21060 4660 28.41
1055700 1225550 169850 16.091.55 1.72
80 110 30 37.50390 490 100 25.6480 110 30 37.50
980 1220 240 24.49170 190 20 11.76
—1050 1460 410 39.052750 3580 830 30.18
243500 273150 29650 12.181.13 1.31
90 120 30 33.33450 610 160 35.56120 140 20 16.671150 1490 340 29.57220 280 60 27.27
—640 1010 370 57.812670 3650 980 36.70
172800 201100 28300 16.381.55 1.82
210 270 60 28.571220 1490 270 22.13300 380 80 26.673350 3830 480 14.33560 640 80 14.2910 10 0 —
3040 4230 1190 39.148690 10850 2160 24.86
479100 561100 82000 17.121.81 1.93
0 0 0
0 0 0
0 0 0

Center on Policy
Initiatives
41
Working on the Margins
Contra Costa County is predicted to have an additional 1,890 temporary jobs in
Production, Construction and Material Handling occupations, while Managerial
and Administrative occupations are expected to grow by 90% or 190 additional
temp jobs.
Santa Clara County, the heart of Silicon Valley, is forecast to have a high rate of
growth in Production, Construction and Material Handling occupations which
are expected to increase by 5,510 jobs. A large number of temporary jobs are
also forecast in Professional and Technical occupations. Of the 1,930 additional
temporary jobs forecast in these occupations, 730 are in Engineering and
Related occupations, which includes Computer Engineers and Electrical and
Electronic Technicians.
San Francisco County is forecast to have the fastest rate of growth in tempo-
rary jobs among the 15 counties in our analysis. With a growth of 9,100 jobs,
the number of temporary jobs is expected to more than double between 1995
and 2002. Every occupational category is expected to double or more than dou-
ble in number. While Clerical and Administrative Support occupations are
expected to have the largest numerical growth (3,700 new temp jobs),
Production, Construction and Material Handling occupations are expected to
grow significantly, adding 2,860 new temporary jobs.
San Mateo County is predicted to have a more modest growth rate of 47.28%,
with Sales occupations expected to have the fastest growth. Production,
Construction and Material Handling occupations, along with Clerical and
Administrative Support occupations, are predicted to have the largest numeri-
cal growth.
Projections for Major Central Valley Counties
Among the four regions in our study the slowest overall growth in temporary
employment is expected in these four Central Valley counties, with a growth
rate of 28% between 1995 and 2002. (See Table 5.4 on the previous page.)
The fastest g rowth among temporar y jobs is expected in Production,
Construction and Material Handling Occupations, which is also numerically
expected to be the largest occupational groups in 2002.
All the occupations within the Production, Construction and Material
Handling Occupations group are expected to grow by over 25%, with the
Managers and Supervisors occupations expected to double and Machine
Setters and Operators expected to grow by more than 75%.
San Francisco Countyis forecast to havethe fastest rate of
growth in temporaryjobs among the 15
counties in ouranalysis.
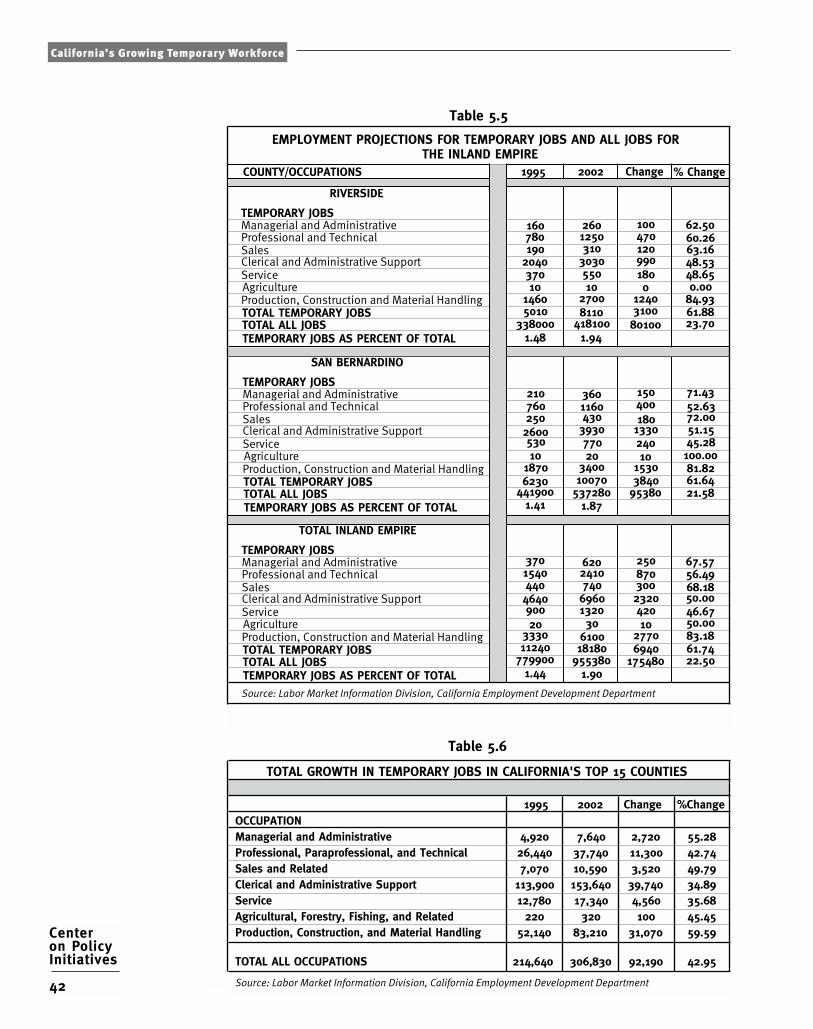
California’s Growing Temporary Workforce
Center on PolicyInitiatives
42
160 260 100 62.50780 1250 470 60.26190 310 120 63.16
2040 3030 990 48.53370 550 180 48.6510 10 0 0.00
1460 2700 1240 84.935010 8110 3100 61.88
338000 418100 80100 23.701.48 1.94
210 360 150 71.43760 1160 400 52.63250 430 180 72.002600 3930 1330 51.15530 770 240 45.2810 20 10 100.00
1870 3400 1530 81.826230 10070 3840 61.64
441900 537280 95380 21.581.41 1.87
370 620 250 67.571540 2410 870 56.49440 740 300 68.184640 6960 2320 50.00900 1320 420 46.6720 30 10 50.00
3330 6100 2770 83.1811240 18180 6940 61.74
779900 955380 175480 22.501.44 1.90
RIVERSIDE
TEMPORARY JOBSManagerial and AdministrativeProfessional and TechnicalSalesClerical and Administrative SupportServiceAgricultureProduction, Construction and Material HandlingTOTAL TEMPORARY JOBSTOTAL ALL JOBSTEMPORARY JOBS AS PERCENT OF TOTAL
SAN BERNARDINO
TEMPORARY JOBSManagerial and AdministrativeProfessional and TechnicalSalesClerical and Administrative SupportServiceAgricultureProduction, Construction and Material HandlingTOTAL TEMPORARY JOBSTOTAL ALL JOBSTEMPORARY JOBS AS PERCENT OF TOTAL
TOTAL INLAND EMPIRE
TEMPORARY JOBSManagerial and AdministrativeProfessional and TechnicalSalesClerical and Administrative SupportServiceAgricultureProduction, Construction and Material HandlingTOTAL TEMPORARY JOBSTOTAL ALL JOBSTEMPORARY JOBS AS PERCENT OF TOTAL
Table 5.5
EMPLOYMENT PROJECTIONS FOR TEMPORARY JOBS AND ALL JOBS FOR THE INLAND EMPIRE
COUNTY/OCCUPATIONS 1995 2002 Change % Change
Source: Labor Market Information Division, California Employment Development Department
Table 5.6
TOTAL GROWTH IN TEMPORARY JOBS IN CALIFORNIA'S TOP 15 COUNTIES
1995 2002 Change %ChangeOCCUPATIONManagerial and Administrative 4,920 7,640 2,720 55.28Professional, Paraprofessional, and Technical 26,440 37,740 11,300 42.74Sales and Related 7,070 10,590 3,520 49.79Clerical and Administrative Support 113,900 153,640 39,740 34.89Service 12,780 17,340 4,560 35.68Agricultural, Forestry, Fishing, and Related 220 320 100 45.45Production, Construction, and Material Handling 52,140 83,210 31,070 59.59
TOTAL ALL OCCUPATIONS 214,640 306,830 92,190 42.95
Source: Labor Market Information Division, California Employment Development Department

Center on Policy
Initiatives
43
Working on the Margins
Fresno County is predicted to have an additional 830 temporary jobs in 2002,
with the largest growth predicted in Production, Construction and Material
Handling occupations.
Kern County is also expected to have the greatest numerical growth in
Production, Construction and Material Handling occupations, with Clerical
and Administrative Support occupations a close second.
Sacramento County, which experienced a surge in temporary jobs in 1998, is
expected to have just under a 25% growth in temporary jobs between 1995 and
2002. By far the largest growth is forecast for Production, Construction and
Material Handling occupations.
San Joaquin County is expected to have an additional 690 temporary jobs, with
45% of these in Production, Construction and Material Handling occupations.
Projections for the Inland Empire
In this region Production, Construction and Material Handling occupations
again are expected to grow the fastest among all temporary jobs by over 80%
between 1995 and 2002. (See Table 5.5 on the previous page.) With the excep-
tion of Service Occupations all other occupational groups are expected to grow
by more than 50%.
Numerically, the Helpers and Laborers are the largest “blue-collar” group,
expected to grow by 82% to about 3500 in 2002. All occupations in the
Production, Construction and Material Handling Occupations are expected to
grow by over 70%. This region is expected to see an increase in the Engineering
and Computer-related professional occupations as well.
Of the 3,100 new temporary jobs expected in Riverside County in 2002, 1,240
will be in Production, Construction and Material Handling occupations.
In San Bernardino County, Production, Construction and Material Handling
occupations are forecast to have the largest growth, with Cler ical and
Administrative occupations a close second.
Projected Total Growth in all Occupations in all 15 Counties
Overall the 15 largest counties in California are expected to experience a
42.95% growth in temporary jobs. (See Table 5.6 on the previous page.) The
largest percentage growth, almost 60%, is expected to be in Production,
Construction and Material Handling Occupations. Surprisingly, the second
fastest growth of 55% is expected in the relatively high-skilled Managerial and
15 largest countiesin California are
expected to experiencea 42.95% growth in
temporary jobs.
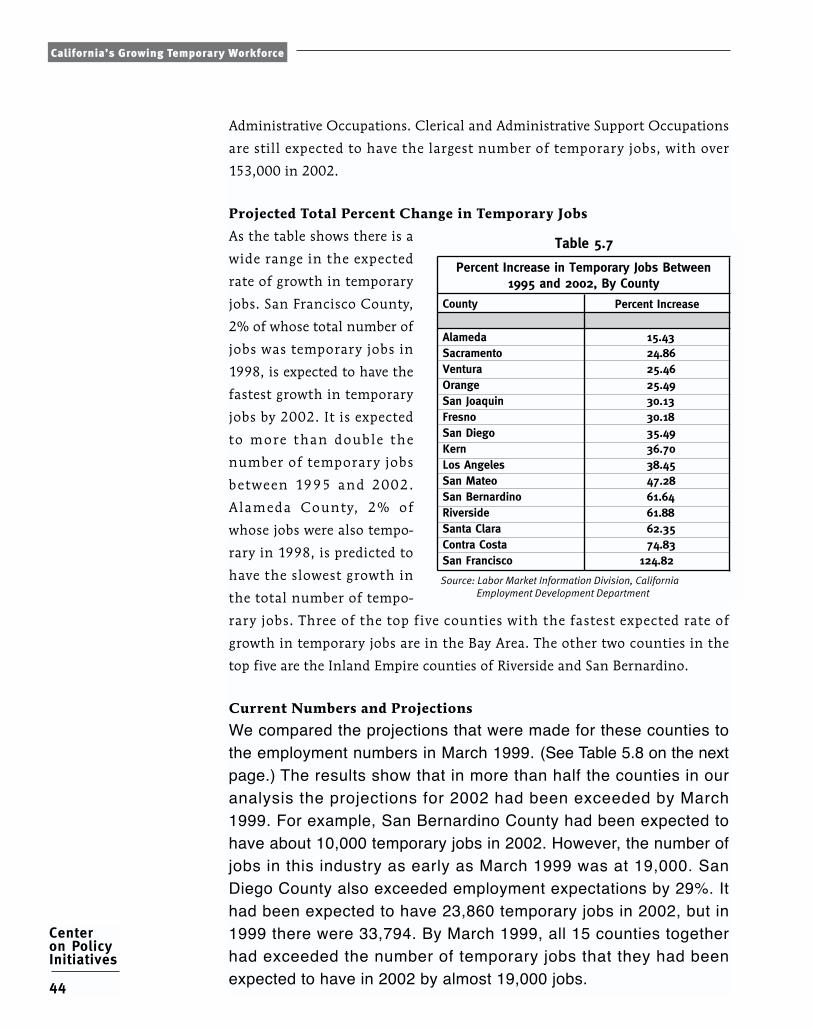
California’s Growing Temporary Workforce
Center on PolicyInitiatives
44
Administrative Occupations. Clerical and Administrative Support Occupations
are still expected to have the largest number of temporary jobs, with over
153,000 in 2002.
Projected Total Percent Change in Temporary Jobs
As the table shows there is a
wide range in the expected
rate of growth in temporary
jobs. San Francisco County,
2% of whose total number of
jobs was temporary jobs in
1998, is expected to have the
fastest growth in temporary
jobs by 2002. It is expected
to more than double the
number of temporary jobs
between 1995 and 2002.
Alameda County, 2% of
whose jobs were also tempo-
rary in 1998, is predicted to
have the slowest growth in
the total number of tempo-
rary jobs. Three of the top five counties with the fastest expected rate of
growth in temporary jobs are in the Bay Area. The other two counties in the
top five are the Inland Empire counties of Riverside and San Bernardino.
Current Numbers and Projections
We compared the projections that were made for these counties tothe employment numbers in March 1999. (See Table 5.8 on the nextpage.) The results show that in more than half the counties in ouranalysis the projections for 2002 had been exceeded by March1999. For example, San Bernardino County had been expected tohave about 10,000 temporary jobs in 2002. However, the number ofjobs in this industry as early as March 1999 was at 19,000. SanDiego County also exceeded employment expectations by 29%. Ithad been expected to have 23,860 temporary jobs in 2002, but in1999 there were 33,794. By March 1999, all 15 counties togetherhad exceeded the number of temporary jobs that they had beenexpected to have in 2002 by almost 19,000 jobs.
Table 5.7
Percent Increase
15.4324.8625.4625.4930.1330.1835.4936.7038.4547.2861.6461.8862.3574.83
County
AlamedaSacramentoVenturaOrangeSan JoaquinFresnoSan Diego KernLos AngelesSan MateoSan BernardinoRiversideSanta ClaraContra CostaSan Francisco 124.82
Source: Labor Market Information Division, California Employment Development Department
Percent Increase in Temporary Jobs Between 1995 and 2002, By County
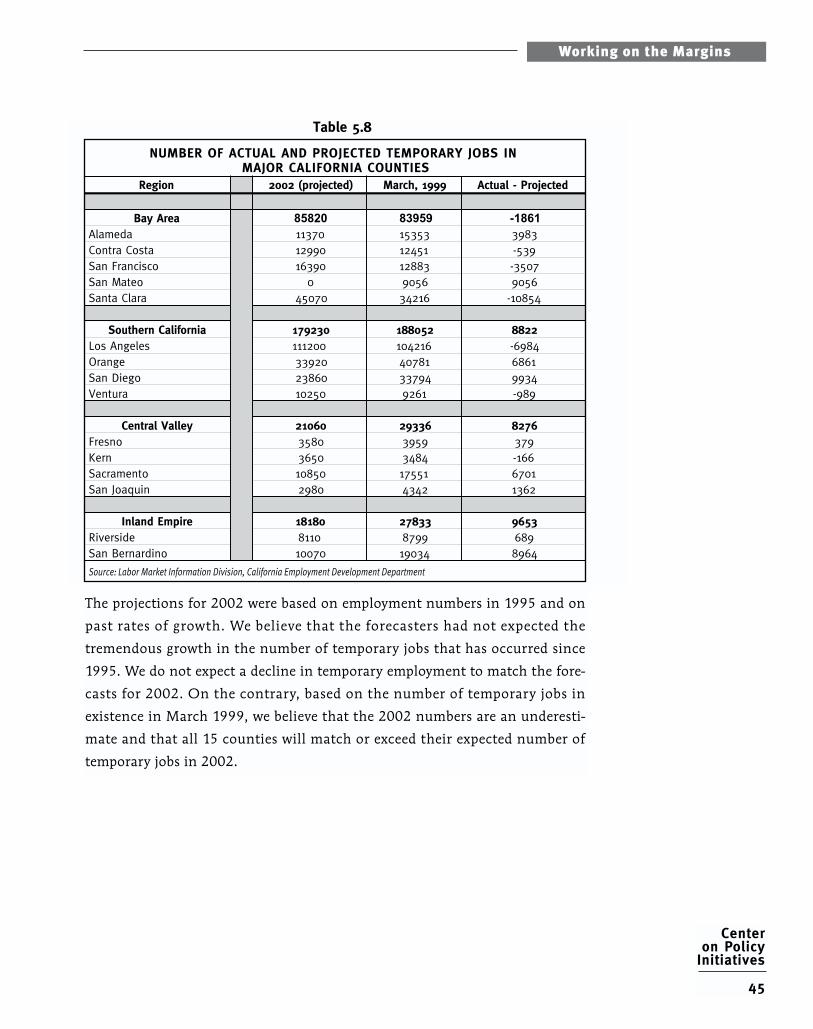
Center on Policy
Initiatives
45
Working on the Margins
The projections for 2002 were based on employment numbers in 1995 and on
past rates of growth. We believe that the forecasters had not expected the
tremendous growth in the number of temporary jobs that has occurred since
1995. We do not expect a decline in temporary employment to match the fore-
casts for 2002. On the contrary, based on the number of temporary jobs in
existence in March 1999, we believe that the 2002 numbers are an underesti-
mate and that all 15 counties will match or exceed their expected number of
temporary jobs in 2002.
Table 5.8
Region 2002 (projected) March, 1999 Actual - Projected
Bay Area 85820 83959 -1861Alameda 11370 15353 3983Contra Costa 12990 12451 -539San Francisco 16390 12883 -3507San Mateo 0 9056 9056Santa Clara 45070 34216 -10854
Southern California 179230 188052 8822Los Angeles 111200 104216 -6984Orange 33920 40781 6861San Diego 23860 33794 9934Ventura 10250 9261 -989
Central Valley 21060 29336 8276Fresno 3580 3959 379Kern 3650 3484 -166Sacramento 10850 17551 6701San Joaquin 2980 4342 1362
Inland Empire 18180 27833 9653Riverside 8110 8799 689San Bernardino 10070 19034 8964
Source: Labor Market Information Division, California Employment Development Department
NUMBER OF ACTUAL AND PROJECTED TEMPORARY JOBS IN MAJOR CALIFORNIA COUNTIES

California’s Growing Temporary Workforce
Center on PolicyInitiatives
46

Center on Policy
Initiatives
47
Working on the Margins
The data presented above show that temporary employment is on the rise in all
regions of California. It also shows that temporary workers earn less than their
permanent counterparts and receive far fewer benefits. Temporary employ-
ment is expected to grow and cover occupations such as Manager ial ,
Professional and Construction occupations.
The stereotype of a temporary worker — a married woman with children work-
ing to fill time and make a little “pin money” — is no longer true. While the
largest number of temporary workers are in Clerical and Administrative
Support occupations, there are a substantial number in Production and
Construction occupations, where the fastest growth is expected to occur. Even
the high-skilled Managerial and Administrative occupations are expected to
experience a high rate of growth.
In the United States, while 30% of temporary workers preferred this work
arrangement, the vast majority wants permanent jobs with secure futures. As
companies increasingly come to rely on a flexible, and therefore expendable,
workforce to weather the vagaries of the business cycle and international
trade, it becomes clear that workers also need protection to weather the uncer-
tainties that accompany the growth of non-standard work.
Employment laws at the federal and state level across the United States are cur-
rently based upon, and regulate, standard work arrangements - permanent jobs
between a clearly defined employer and employee.
The vast majority of existing employment and benefits laws are structured to
allow temp agencies, leasing firms and other intermediaries to shield their
clients (the employers) from employment-related taxes, costs and rules such as
unemployment insurance, occupational health and safety requirements and
health care benefits. In the process they create greater instability and uncer-
tainty for workers.
Shifting relationships between employees and employers and the ability of
workers in non-standard work to be treated differently with respect to benefits
and wages promotes misclassification and reclassification of workers to the
least costly option for employers and the most insecure for workers.
The dramatic growth of non-standard work — from temp agencies to independ-
DiscussionVI
The stereotype of a temporary worker —a married woman with
children working to fill time and make a
little “pin money” — is no longer true.
California’s Growing Temporary Workforce
Center on PolicyInitiatives
48
ent contracting and subcontracting — requires a broad rethinking of employ-
ment law at all levels of government and employment practices in American
business and government. Our laws and benefits must change as the structure
of work changes for American workers and businesses.
Solutions and Recommendations
A new movement is beginning to address this fundamental restructuring of
work and employment. Legislative, organizing, research and institution-build-
ing initiatives are developing new ways to create economic and career security
for workers in an increasingly insecure workplace.
These solutions are not aiming to eliminate the use of temporary and contin-
gent work, but rather to prevent the mistreatment of non-standard workers
and to restitch the fabric of employment and benefit law for the new American
workplace. These initiatives are addressing all aspects of the growth of non-
standard work — including the misclassification of permanent employees as
independent contractors, arresting the growth of perma-temps and ending dis-
crimination of non-standard workers.
As illustration, we describe a few avenues that are being explored around the
country to address the growth of temporary and other non-standard work. A
more complete list of policy initiatives is available from the National
Employment Law Project (www.nelp.org.)
1. Review impact of existing laws on non-standard workers and recommendchanges in the law.
A number of states (Rhode Island, North Carolina, New Hampshire and
Maine) have passed or are considering passage (Washington) of laws requiring
studies of the impact of the shift to non-standard work on workers, families
and regional economies.
These studies evaluate wages, benefits and other workplace protections avail-
able to contingent workers relative to the wages, benefits and protections for
regular, full-time workers.
These studies identify potential reforms of state and federal employment and
benefit laws to provide greater security for workers.
2. Extend all workplace rights to non-standard workers.
Different categories of contingent workers (i.e. temporary and leased work-
ers, part-time, independent contractors) are treated differently under state

Center on Policy
Initiatives
49
Working on the Margins
and federal employment laws such as the Fair Labor Standards Act (FLSA),
Family Medical Leave Act (FMLA), and unemployment and workers compen-
sation laws.
For example, under the Employee Retirement Income Security Act (ERISA) of
1974, temporary workers can be denied company benefits since they are not
included in its definition of “employees.” Tightening these rules will ensure
that a company does not “payroll” its employees so as to get out of its obliga-
tion to provide benefits to them.
Several states have made it hard for temps to qualify for Unemployment
Insurance (UI) by placing restrictions on their eligibility. In fact, starting work
as a temp seems to keep them in a permanent loop of temping and unable to
break into permanent employment. Loosening eligibility for UI can make per-
manent employment easier to obtain by giving workers the flexibility to quit
working as temps while they search for full-time jobs.
3. Ensure equal treatment of temporary and contingent workers.
As our research has shown, temps earn less and receive fewer health and
pension benefits than regular workers with similar personal and job charac-
teristics. Equal treatment policies require that temporary and contingent
workers be paid the same wages, offered the same benefits and have the
same workplace protections as traditional, full-time workers doing the same
job at that worksite.
For example, the Massachusetts Workplace Equity Act prohibits discrimination
in wages between full-time and part-time workers regardless of whether or not
either the jobs or workers are permanent or contingent.
4. Right to Know for Temp Workers.
Temp agencies charge wage markups and client fees for the workers they place
with employers. They also charge ‘conversion fees’ to client companies and
temporary workers if the worker ‘converts’ to a permanent employee. These
conversion fees can create disincentives for employers to promote temporary
workers to permanent status.
Right-to-Know policies would require temp agencies to disclose wage rates,
client rates and conversion fees to temporary workers so they can choose tem-
porary agencies that provide the greatest opportunities for wages, benefits and
career advancement.
Equal treatmentpolicies require that
temporary andcontingent workers bepaid the same wages,
offered the samebenefits and have the
same workplaceprotections as
traditional, full-timeworkers doing thesame job at that
worksite.
California’s Growing Temporary Workforce
Center on PolicyInitiatives
50
For example, Rhode Island passed the Temporary Employee Protection Act
which requires temporary agencies to provide written notice of job descrip-
tions, pay rates and work schedules to their temporary workers.
5. Use public dollars to create secure jobs with benefits.
Taxpayer dollars, through direct hiring of public employees, contracting for
services or economic development incentives create large numbers of jobs at
the local, state and national level. The jobs created with taxpayer dollars
should be full-time, permanent jobs with full benefits.
State and local governments are increasingly attaching job quality standards to
the use of public dollars. Public agencies should establish policies to prevent
displacement of permanent positions with temporary workers, require equal
wage and benefit rates between temporary and permanent employees and limit
the use of ‘perma-temps.’
For example, the Massachusetts Workplace Equity Act includes standards to
guide public agencies in their practices towards temporary and other types of
non-standard workers. The Bill puts a cap on the percentage of non-standard
jobs and on the percentage of payroll that can be used to hire workers for
non-standard jobs by any contractor who receives more than $25,000 per
year in funding or contracts from the Commonwealth of Massachusetts.
6. Establish Codes of Conduct for temporary agencies.
Having temporary help agencies abide by a set of rules in conducting their
business will ensure that common abuses do not occur. The National
Alliance for Fair Employment (NAFFE), an alliance of organizations that
focus attention on contingent work, lists a code of conduct for temp agencies
(www.fairjobs.org).
The Bergen Employment Action Project (Bergen County, New Jersey Labor
Council) has created 24 principles of fair practice by temporary help agen-
cies. It also provides potential temporary workers with its Consumer Guide
to Best Practices Temp Agencies. The guide educates workers on law and their
rights and also provides a code of ethics for temps. In addition, it lists the
temp agencies that meet the Best Practice standards and provide the most
support and stability to their workers. The wide distribution of this guide has
put the pressure on temporary agencies to meet the Best Practices standards.
Public agencies shouldestablish policies to
prevent displacementof permanent positions
with temporaryworkers.

Center on Policy
Initiatives
51
Working on the Margins
7. Create non-profit and worker-centered agencies.
Union hiring halls in seasonal or “project-based” industries such as construc-
tion or hotels have developed mechanisms to provide worker security, training
and decent wages and benefits in inherently insecure jobs.
They have created employment intermediaries that can help meet needs of
both workers and employers. While they offer stable employer-paid benefits
and multi-employer job opportunities to workers, they also provide trained,
experienced workers to employers with seasonal or temporary needs.
In addition, a new generation of non-profit temporary agencies is setting new
standards for paying living wages, providing portable benefits and occupation-
al training to expand opportunities for workers.
For example, Working Partnerships Staffing Service is a non-profit temporary
help agency run by Working Partnerships USA in San Jose, California.
Focusing on clerical workers, this agency provides placements at a minimum
of $10 per hour and also makes health insurance available to the worker. The
agency partners with a local community college to provide training to the
workers who are in need of the necessary skills. The agency also has a Code of
Conduct that it abides by and asks employers to sign for the hiring of tempo-
rary workers. These best practices followed by the temporary agency will help it
attract and retain a high caliber of workers.
California Policy Recommendations
We make four recommendations for California policy makers specifically
aimed at the rapid growth of temporary work in the state.
1. Study the impact of and review all employment, benefit and workplace law
California should charge the appropriate state agencies with the task of study-
ing the changing structure of work in California and reviewing all California
employment, workplace and benefit laws and regulations to determine those
that should be updated to address economic security and career development
issues for contingent workers.
2. Establish standards for public dollars to create permanent jobs
Recently the Employment Training Panel (ETP), a state agency responsible for
disbursing ETP funds for employer-specific job training programs, was asked to
lift existing agency limits on granting temporary agencies state job training
funds. ETP, at a September 2000 meeting in San Diego, rejected the proposal by

California’s Growing Temporary Workforce
Center on PolicyInitiatives
52
temporary agencies to lift the limit, opting instead for investing public training
dollars on supporting employers that are providing permanent jobs.
We urge the State of California and public bodies across the state to establish
standards for all public spending in the use of temporary and contingent work-
ers. These standards would apply to public agencies and contractors doing
business with (or receiving grants from) local or state agencies and include:
• Limits on the number and tenure of temporary workers
• Wage and benefit parity for all temporary and contingent workers
• Minimum wage and benefit standards for temporary and contingent
workers
• Protections against the displacement of permanent jobs with temporary
jobs
• Codes of conduct for temporary help agencies
3. Establish equal pay and benefits for non-standard workers
California should require equal pay and benefits for temporary and contingent
workers doing the same work as permanent employees.
4. Disclosure and accountability
California should require labor market intermediaries such as temporary and
leasing agencies to disclose payment rates, client rates, conversion fees, train-
ing programs and tenure statistics for agency employees.
These policies represent some efforts to deal with temporary work. In addition,
we support the development of similar policies that will address worker insecu-
rity in other forms of contingent labor such as independent contractors, sub-
contracted work and employee leasing.
This report has demonstrated that the structure of work is changing rapidly
and that it limits opportunity for many working people. An equally rapid and
vigorous response will ensure that vibrant economic growth will be accompa-
nied by greater security and prosperity for California’s working families.

Center on Policy
Initiatives
53
Working on the Margins
Data Methodology
Temporary Workers in California
The Contingent Workers Supplement to the Current Population Surveys
does not provide a sufficiently large sample size for California. In order to
develop a snap-shot of temporary workers in this state, we combined the
CPS Outgoing Rotation Group (CPS-ORG) files for the years 1997, 1998
and 1999. The CPS Contingent Workers Supplement asked respondents to
identify the type of work arrangement in which they belonged. However,
this is not possible to do with the CPS sample. Instead, respondents identify
the industry in which they are employed, identified by an Industry Code.
The CPS classifies the Temporay Help Supply industry under the broader
industry classification, Personnel Supply Services, which includes other
Employment Agencies and Execut ive P lacement Ser v ices as we l l as
Temporary Help Agencies and Leasing Companies. The Industry Code 731
corresponds to the Standard Industrial Classification (SIC) code 736, which
is used by state agencies as well as other federal agencies, such as the Bureau
of Commerce, to classify industries. Temporary Help Supply agencies are
classified under SIC 7363, along with employee leasing services, labor pools,
fashion show model supply services, and office help supply services, among
others.1 The Census Bureau’s statistics show that about 89% of those
employed in Personnel Supply Services (SIC 736) were employed in the
Temporary Help Supply Industry (SIC 7363). Therefore, data from CPS’s
industry 731 will primarily cover Temporary Help Agency workers. There is
no reliable method to separate those employed by temporary help supply
agencies from those employed in other types of personnel supply agencies
under the same SIC code. Therefore, we use the entire sample in SIC 7363
for our analysis. We believe that using SIC 7363 to represent temporary
workers is legitimate, since all the employment arrangements in SIC 7363
are temporary in nature.
Temporary Employment in the 15 Largest Counties in California
Data for each county was obtained from the Labor Market Information
Division (LMID) of the California Employment Development Department
(EDD) for t he years 1991-1998. The data are c lass i f ied by Standard
Appendix AVII
1 Temporary Help Supply Services was classified under SIC 7362. It was merged into SIC 7363 in 1990.

California’s Growing Temporary Workforce
Center on PolicyInitiatives
54
Industrial Classification (SIC) codes. The Temporary Help Supply industry is
classified under SIC 7363.
In the employment data provided online by the Labor Market Information
Division, f ive counties were missing data on Total Employment in All
Industries between 1991 and 1993. We filled in the missing numbers using a
technique suggested by a consultant at the Labor Market Information
Division. The Total Employment in All Industries was missing in 5 counties
because they did not report Total Farm Employment data. However, this data
was available for the PMSAs of which these counties were a part. For exam-
ple, Total Employment was missing for Alameda and Contra Costa Counties
for 1991 and 1992 because there was no data on Total Farm Employment.
However, the Oakland PMSA, which comprises these two counties, reported
Total Farm Employment for the missing years. We extrapolated the Total
Farm Employment for Alameda and Contra Costa counties by assuming that
each county’s share of the Oakland PMSA’s Farm Employment was the same
in 1991 and 1992 as i t was in 1993. Once we extrapolated t he Far m
Employment for each county with the missing data, we added it to the Total
Non-Farm Employment to arrive at the Total Employment in All Industries.
We rounded the numbers to the nearest 100 for consistency with LMID’s data.
Occupational Projections for Temporary Jobs
The Employment Development Department (EDD) of the State of California
produces occupational projections for seven-year periods for all industries,
classified by their Standard Industrial Classification (SIC) code. The projec-
tions have been made by 4-digit SIC code for these industries. For example,
the EDD uses occupational employment data that they have benchmarked
for the year 1994 and apply forecasting models to project staffing patterns
seven years hence, i.e., for the year 2001. However, the Bureau of Labor
Statistics (BLS), which coordinates these efforts between all the states, has
recently decided to produce estimates only for 3-digit industries. The current
projections that are available for 1997-2004 only identify 3-digit industries,
i.e., the data were available only for SIC 736, Personnel Supply Services.
Although SIC 7363 is the dominant industry within SIC 736, we believed
that it was more important to precisely identify the industry than to have
greater currency of data. Therefore, we used the latest data available for 4-
digit industries, for the years 1995-2002, in our analysis.

Center on Policy
Initiatives
55
Working on the Margins
Current numbers and Projections
One word of caution on the comparability of the current employment data
and the projections: current employment data are rounded to the nearest
100, while the occupational projections are rounded to the nearest 10. The
comparability of these sets of rounded numbers should matter only on the
margins and any errors that come from rounding should not matter at the
county level.

California’s Growing Temporary Workforce
Center on PolicyInitiatives
56

Center on Policy
Initiatives
57
Working on the Margins
Types of Employment Agencies
• Temporary help supply companies
Temporary help agencies are businesses that recruit, screen and dispatch
workers, receiving privately controlled revenue in return. They “recruit”
workers who can perform a variety of tasks and then sell their services for
a fee.
These firms can be viewed as specialists in recruiting, screening and train-
ing workers in occupations in which firm-specific skills are relatively
unimportant. Temporary help companies are employers; they are not
employment agencies.
The agency is reponsible for payroll and associated taxes, laws, and regula-
tions. The client is responsible for workplace supervision.
• Payrolling service or employee leasing
The payrolling concept involves an employer recruiting, screening and
training a worker or workforce and then simply turning these workers over
to the temporary firm’s payroll. This allows the employer to select the
worker it wants at the outset while still being relieved of benefit costs and
additional administrative burdens. Temporary firms typically offer dis-
counted fees to employers under these arrangements because the agencies
do not have to recruit workers themselves or incur related personnel
expenses.
• Contract company
A contract company takes on the function of an entire department that a
company does not have. Examples include janitorial and building mainte-
nance, data processing , security, landscaping and human resources. A
contract company worker works for the contract company but the work-
site is the customer’s office. A contract company worker may only work
for one company at any given time. Contract companies whose workers
are assigned to more than one customer include advertising agencies and
lawyer offices.
Appendix BVIII

California’s Growing Temporary Workforce
Center on PolicyInitiatives
58
This arrangement is similar to “Managed Services” or “outsourcing,” where a
staffing service is provided by an agency that supplies workers for the ongo-
ing management of a client’s facility or functions (such as a mail room or
call center). The agency retains responsibility for the supervision of employ-
ees as well as accountability for the results of the facility or function that
has been outsourced. The agency is the sole employer of these workers.
• Vendor-on-Premise Program
A VOPP is a custom-designed program where an employer contracts with a
staffing firm to assume operational responsibilities for the entire hiring
process of all or part of its workforce. The employer provides office space
at their facility, and the staffing firm assumes all costs and functions
relating to the recruitment, screening, hiring, orientation, termination,
safety training, drug screening, administration of job related injuries,
unemployment claims, weekly payroll processing/paycheck distribution,
dispute resolution, monitoring attendance, processing holiday/sick pay,
W2/tax withholding administration, etc. Typically, the staffing firm will
assign a full-time manager who is experienced in administering this pro-
gram along with any needed support staff. Often the staffing firm will
have multiple recruiting off ices in the local area to supplement the
recruiting effort of the on-site manager.
Many larger companies have long-term relationships with several “special-
ty” staffing firms for specific needs that most staffing firms do not recruit
for — legal professionals, scientists, chemists, etc. An experienced VOP
staffing firm can create a “Master Vendor” agreement for the client. This
allows the staffing firm to “manage” all the other smaller staffing firms
that the client may want to continue working with. The VOP staffing firm
is now responsible for managing all the sub-vendors for the client.
A VOPP may be justified for a company that is in need of a flexible work-
force or experiences high turnover rates, especially in specific department,
such as customer service, data entry, help desk, call center, order process-
ing/incoming sales, collections, production, manufacturing, etc.
• Placement Services
Placement services are staffing services provided by agencies that match job
seekers with employers for regular, full-time employment opportunities.

Center on Policy
Initiatives
59
Working on the Margins
• Temporary-to-Permanent Services
“Temp-to-Perm” services are staffing services through which an agency
recruits workers seeking regular employment at a business client’s work-
site and hires these workers as temporary workers for a trial period of
employment. If the business client decides to hire the worker permanent-
ly, the worker is moved from the agency’s payroll to that of the client.
• Long-term Staffing
Long-term staffing is the assignment of agency workers to business clients
for long-term and indefinite periods of time.

California’s Growing Temporary Workforce
Center on PolicyInitiatives
60

Center on Policy
Initiatives
61
Working on the Margins
Organizations and Resources
We list organizations that provide advocacy and support for non-standard
workers regionally as well as nationally. For a more complete list contact NAFFE.
National Alliance For Fair Employment (NAFFE) is a network of organizations
around the country that is working towards building an awareness of the prob-
lems faced by non-standard workers and to advocate for better pay and benefits
for them. c/o Campaign on Contingent Work, 33 Harrison Avenue, 4th Floor,
Boston, MA 02111. www.fairjobs.org.
National Employment Law Project (NELP) is a non-profit organization that
advocates on behalf of low-wage workers and the unemployed through litiga-
tion, policy advocacy, public education and support for organizing. 55 John
Street, 7th Floor, New York, NY 10038. 212-285 3025. www.nelp.org.
Working Partnerships USA is a non-profit organization dedicated to rebuilding
the link between regional economic development and community well-being
and developing state and national workforce development and employment
policy that truly benefit working families. 2102 Almaden Road, San Jose, CA
95125. 408-269-0168. www.atwork.org.
Center for a Changing Workforce educates, analyzes public policy and advo-
cates on behalf of “permatemps” and contingent workers. 309 27th Ave. E.,
Seattle, WA 98112. 206-622-0897. www.cfcw.org.
Bergen Employment Action Project is a resource for job hunters that publishes
the “Consumer Guide to ‘Best Practices’ Temp Agencies,” a list of temporary
help agencies that follow best practices for several New Jersey counties.
214 State Street, Hackensack, NJ 07601. (201) 489-7476.
9to5, National Association of Working Women is a national, grassroots
membership organization that strengthens women’s ability to work for eco-
nomic justice. 231 W. Wisconsin Ave., #900 Milwaukee, WI 53203-2308.
414-274-0925. www.9to5.org.
Washington Alliance of Technology Workers (WashTech) is an organization
of high-tech workers and allies joining together to provide an effective voice in
the legislative and corporate arenas and to advocate for improved benefits and
workplace rights. 2900 Eastlake Ave. East, Suite 200, Seattle, WA 98102.
206-726-8580. www.washtech.org
Appendix CIX

California’s Growing Temporary Workforce
Center on PolicyInitiatives
62

Center on Policy
Initiatives
63
Working on the Margins
Autor, David H.; Levy, Frank; Murnane, Richard J.; Skills Training in the
Temporary Help Sector: Employer Motivations and Worker Impacts, A Report to the
Department of Labor Employer and Training Administration, Septermber 1999.
Benner, Chris; Shock Absorbers in the Flexible Economy: The Rise of Contingent
Employment in Silicon Valley, Working Partnerships USA, 1997.
Cohany, Sharon R.; Workers in Alternative Employment Arrangements: A Second
Look, Monthly Labor Review, Vol 121:11, November 1998.
Henson, Kevin; Just a Temp, Philadelphia, PA, Temple University Press, 1996.
Hudson, Ken; No Shortage of ‘Nonstandard’ Jobs, Economic Policy Institute
Briefing Paper, Washington, D.C., December 1999.
Kalleberg, Arne L.; Rasell, Edie; et.al.; Nonstandard Work, Substandard Jobs:
Flexible Work Arrangements in the U.S., Economic Policy Institute, Wash., D.C.
and Women’s Research and Education Institute, 1997.
Katz, Lawrence F. and Kruegar, Alan B.; The High Pressure U.S. Labor Market of
the 1990s, Brookings Papers on Economic Activity, 1999:1, pp. 1-87.
Parker, Robert; Flesh Peddlers and Warm Bodies: The Temporary Help Industry and
Its Workers, Arnold and Caroline Rose Monograph Series, Rutgers University
Press, New Jersey, 1994.
Polivka, Anne E.; Are Temporary Help Workers Substitutes for Direct Hire Temps?
Searching for an Alternative Explanation of Growth in the Temporary Help Industry,
paper presented at the Society of Labor Economists Conference, May 3-4, 1996.
Polivka, Anne E.; Contingent and Alternative Work Arrangements, Defined,
Monthly Labor Review, October, 1996.
Segal, Lewis and Sullivan, Daniel; The Growth of Temporary Services Work, Federal
Reserve Bank of Chicago Working Paper Series (WP-96-26), December 1996.
Segal, Lewis M. and Sullivan, Daniel G.; Wage Differentials for Temporary
Services Work: Evidence from Administrative Data, Federal Reserve Bank of
Chicago Working Paper Series, No. WP-98-23, December 1998.
BibliographyX

California’s Growing Temporary Workforce
Center on PolicyInitiatives
64
Theodor, Nik and Mehta, Chirag; Contingent Work and the Staffing Industry,
Center for Urban Economic Development, University of Illinois at Chicago,
October 1999.
Yates, Michael D.; Longer Hours, Fewer Jobs: Employment and Unemployment in
the United States, Monthly Review Press, New York, 1994, pp. 45.
Contingent Workers Fight For Fairness, The National Alliance For Fair
Employment, Boston, MA, May, 2000.
Who Built America: Working People and the Nation's Economy, Politics, Culture
and Society, Volume 2, American Social History Project, Pantheon Books, New
York, 1992.

indepenmarg
Center on Policy Initiatives
The Center on Policy Initiatives (CPI) was established in 1997 to promote higher standards ofliving for poor and moderate-income families through research, policy development, publiceducation, and effective advocacy. CPI focuses on research and policy development that addressstructural factors and issues crucial for linking community and regional economic development.
CPI believes that a fair economy is one in which economic opportunities are universally accessible. Specifically, a healthy community is one that offers good jobs, democratic workplaces,affordable health care, quality childcare, affordable housing, and secure retirement benefits.
“Working on the Margins: California’s Growing Temporary Workforce” is the first in a series of CPI reports that seek to address the changing structure of work in California andits effects on workers. The reports aim to highlight key issues surrounding the state’s growing non-secure workforce and offer policy recommendations that achieve greater economic and career security for workers and their families.
Center on Policy Initiatives
3727 Camino del Rio South, Suite 100 San Diego, CA 92108
619.584.5744 fax 619.584.5748 [email protected] www.onlinecpi.org