work in progress grade 7 - leusd techleusdtech.com/commoncore/math modules/7th grade module...
TRANSCRIPT

Lake Elsinore Unified School District
Instructional Module To Enhance the Teaching of Prentice Hall Mathematics –
CA Edition
WORK IN PROGRESS
Grade 7
Module 4 Fractions, Decimals and Percents
Revised September 2014

7th Grade Mathematics Sequence
2014-‐2015
LEUSD Scope and Sequence (approximate days)
Instructional Modules (approximate days)
Unit 1 Foundational Concepts & Order of Operations
(10 days)
Unit 1 Foundational Concepts & Order of Operations
(13 days: Aug 18 – Sep 4) Unit 2
Operations with Integers/Absolute Value (20 days)
Unit 2 Operations with Integers/Absolute Value
(17 days: Sep 5 – Sep 30) Unit 3
Operations with Fractions (30 days)
Unit 3 Operations with Fractions (25 days: Oct 1 – Nov 4)
Unit 4 Fractions, Decimals and Percents
(15 days)
Unit 4 Fractions, Decimals and Percents
(13 days: Nov 5 – Nov 21) Unit 5
Geometry Construction (15 days)
Unit 5 Proportions and Percents (15 days: Dec 1 – Dec 19)
Unit 6 Ratios and Proportions
(15 days)
Unit 6 Ratios and Proportions (18 days: Jan 13 – Feb 6)
Unit 7 Proportions and Percents
(15 days)
Unit 7 Expressions and Equations (25 days: Feb 9 – Mar 20)
Unit 8 Expressions and Equations
(25 days)
Unit 8 Geometry
(30 days: Mar 23 – May 8) Unit 9
Geometry (15 days)
Unit 9 Statistics and Probability (15 days: May 11 – May 29)
Unit 10 Statistics and Probability
(15 days)

7th Grade Module 4 at a Glance
Some lessons may take more than one day.
Lesson Number Lesson Focus
1 Understand relationships between fractions and decimals
2 Convert a fraction to a decimal
3 Understand relationships between fractions, decimals and percents
4 Students understand the difference between rational and irrational numbers
5 Use equivalent forms of rational numbers for estimation
6 Compare and order rational numbers
7 Compare and order rational numbers on a number line

Connecting Mathematical Practices and Content Grade 7
The standards in this cluster represent opportunities to apply percentages and proportional reasoning. In order to make inferences about a population, one needs to apply such reasoning to the sample and the entire population. Probability models draw on proportional reasoning and should be connected to the major work in those standards. The Standards for Mathematical Practice (MP) are developed throughout each grade and, together with the content standards, prescribe that students experience mathematics as a coherent, useful, and logical subject that makes use of their ability to make sense of mathematics. The MP standards represent a picture of what it looks like for students to understand and do mathematics in the classroom and should be integrated into every mathematics lesson for all students. Although the description of the MP standards remains the same at all grades, the way these standards look as students engage with and master new and more advanced mathematical ideas does change. Below are some examples of how the MP standards may be integrated into tasks appropriate for Grade 7 students. Standards for Mathematical Practice
Explanation and Examples from Mathematics Framework
MP.1 Make sense of problems and persevere in solving them.
In grade seven, students solve problems involving ratios and rates and discuss how they solved them. Students solve real-world problems through the application of algebraic and geometric concepts. Students seek the meaning of a problem and look for efficient ways to represent and solve it. They may check their thinking by asking themselves, “Does this make sense?” or “Can I solve the problem in a different way?” When students compare arithmetic and algebraic solutions to the same problem (7.EE.4a), they are identifying correspondences between different approaches.
MP.2 Reason abstractly and quantitatively.
Students represent a wide variety of real-world contexts through the use of real numbers and variables in mathematical expressions, equations, and inequalities. Students contextualize to understand the meaning of the number or variable as related to the problem and decontextualize to manipulate symbolic representations by applying properties of operations.
MP.3 Construct viable arguments and critique the reasoning of others.
Students construct arguments using verbal or written explanations accompanied by expressions, equations, inequalities, models, and graphs, and tables. They further refine their mathematical communication skills through mathematical discussions in which they critically evaluate their own thinking and the thinking of other students. For example, as students notice when given geometric conditions determine a unique triangle, more than one triangle or no triangle (7.G.2), they have an opportunity to construct viable arguments and critique the reasoning of others. Students should be encouraged to answer questions, such as “How did you get that?”, “Why is that true?” and “Does that always work?”
MP.4 Model with mathematics.
Seventh-grade students model real-world situations symbolically, graphically, in tables, and contextually. Students form expressions, equations, or inequalities from real-world contexts and connect symbolic and graphical representations. Students use experiments or simulations to generate data sets and create probability models. Proportional relationships present opportunities for modeling. For example, the number of people who live in an apartment building might be taken as proportional to the number of stories in the building for modeling purposes. Students should be encouraged to answer questions, such as “What are some ways to represent the quantities?” or “How might it help to create a table, chart, graph…?”
Connecting Mathematical Practices and Content - Grade 7

Connecting Mathematical Practices and Content Grade 7
MP.5 Use appropriate tools strategically.
Students consider available tools (including estimation and technology) when solving a mathematical problem and decide when certain tools might be helpful. For instance, students in grade seven may decide to represent similar data sets using dot plots with the same scale to visually compare the center and variability of the data. Students might use physical objects, spreadsheets, or applets to generate probability data and use graphing calculators or spreadsheets to manage and represent data in different forms. Teachers might ask, “What approach are you considering trying first?” or “Why was it helpful to use…?”
MP.6 Attend to precision.
Students continue to refine their mathematical communication skills by using clear and precise language in their discussions with others and in their own reasoning. Students define variables, specify units of measure, and label axes accurately. Students use appropriate terminology when referring to rates, ratios, probability models, geometric figures, data displays, and components of expressions, equations, or inequalities. Teachers might ask “What mathematical language, definitions, properties…can you use to explain…?
MP.7 Look for and make use of structure.
Students routinely seek patterns or structures to model and solve problems. For instance, students recognize patterns that exist in ratio tables making connections between the constant of proportionality in a table with the slope of a graph. Students apply properties to generate equivalent expressions and solve equations. Students compose and decompose two- and three-dimensional figures to solve real-world problems involving scale drawings, surface area, and volume. Students examine tree diagrams or systematic lists to determine the sample space for compound events and verify that they have listed all possibilities. Solving an equation such as 8=4�𝑥𝑥𝑥𝑥−12� is easier if students can see and make use of structure, temporarily viewing �𝑥𝑥𝑥𝑥 −12� as a single entity.
MP.8 Look for and express regularity in repeated reasoning.
In grade seven, students use repeated reasoning to understand algorithms and make generalizations about patterns. After multiple opportunities to solve and model problems, they may notice that 𝑎𝑎𝑏𝑏=𝑐𝑐𝑑𝑑 if and only if 𝑎𝑎𝑑𝑑=𝑏𝑏𝑐𝑐 and construct other examples and models that confirm their generalization. Students should be encouraged to answer questions, such as “How would we prove that…?” or “How is this situation like and different from other situations using this operations?”
Connecting Mathematical Practices and Content - Grade 7

Instructional Strategies Used in K-7 Instructional Modules
Taken from the CA Mathematics Framework and 5 Practices for Orchestrating
Productive Mathematics Discussions by Peg Smith and Kay Stein
POSE THE PROBLEM
Simply pose the problem, without suggesting or allowing other students to suggest any particular mathematical strategy to solve the problem.
INDEPENDENT Students work independently and quietly, often for the purpose of letting students think about their own reasoning and informal assessment.
THINK-PAIR-SHARE Students get time to think quietly, then share their thoughts with a partner and listen to their partners’ thinking.
TABLE TALK THINK-PAIR-SHARE with more than 2 students.
WHOLE GROUP Focus is on pulling the whole class together.
CONSENSUS Students share their individual ideas and come to an agreement within the group to share with the whole class.
MONITOR
Teacher pays close attention to students’ mathematical thinking and solution strategies as they work on a task, for the purpose of using their observations to decide what and whom to focus on during the class discussion that follows.
SELECT The teacher, through monitoring, selects student work samples or strategies to display or have students present.
SEQUENCE
The teacher purposefully chooses the order in which student strategies are displayed and/or discussed, often beginning with the more concrete strategies moving to more abstract.
CONNECT
The teacher helps students draw connections between their solutions/strategies and others’ solutions/strategies for the purpose of connecting their thinking to the mathematics we want them to learn
DISPLAY The teacher shows student work to the rest of the class for the purpose of allowing students to analyze the students’ strategies.
CAROUSEL-MUSEUM WALK
Each group posts sample work on the wall while students rotate around the room to analyze other students’ work. A leader from each group may, but does not need to stand near his/her own group’s work.
Grade 7 Module 4, Lesson 1
Lesson Focus Understand relationships between fractions and decimals. PLC Notes
Lesson Purpose
Students understand equivalent forms of rational numbers.
Content Standards
Prepares for: NS.2d Convert a rational number to a decimal using long division; know that the decimal form of a rational number terminates in 0s or eventually repeats.
Practice Standards
☒ Make sense of problems and persevere in solving them. ☐ Reason abstractly and quantitatively. ☐ Construct viable arguments and critique the reasoning of others. ☐ Model with mathematics.
☒ Use appropriate tools strategically. ☒ Attend to precision. ☒ Look for and make use of structure. ☐ Look for and express regularity in repeated reasoning.
Introduce
Materials
Base 10 Blocks 100 block =
flat tenths = rod cube = unit
Pass out the Base 10 Blocks and INDEPENDENTLY give students time to explore them. POSE THE PROBLEM What is the relationship between the blocks? DISPLAY the base 10 blocks. PAIR SHARE – Are there any patterns that you notice? Explain these patterns using the blocks.
• What possible values could be assigned to the flat? (100 or 1) If no students say 1, the teacher should ask :“Could this be a 1? Why or why not?”
• What value would you give the rod? Why? (tenths) • What value would you give the small cube? Why? (1 unit or one) • If the flat is a 1, what would that make the units? (hundredths) • What would that make the rods? (tenths)
Investigate
Materials
Graphic Organizer/Chart
Base 10 Blocks
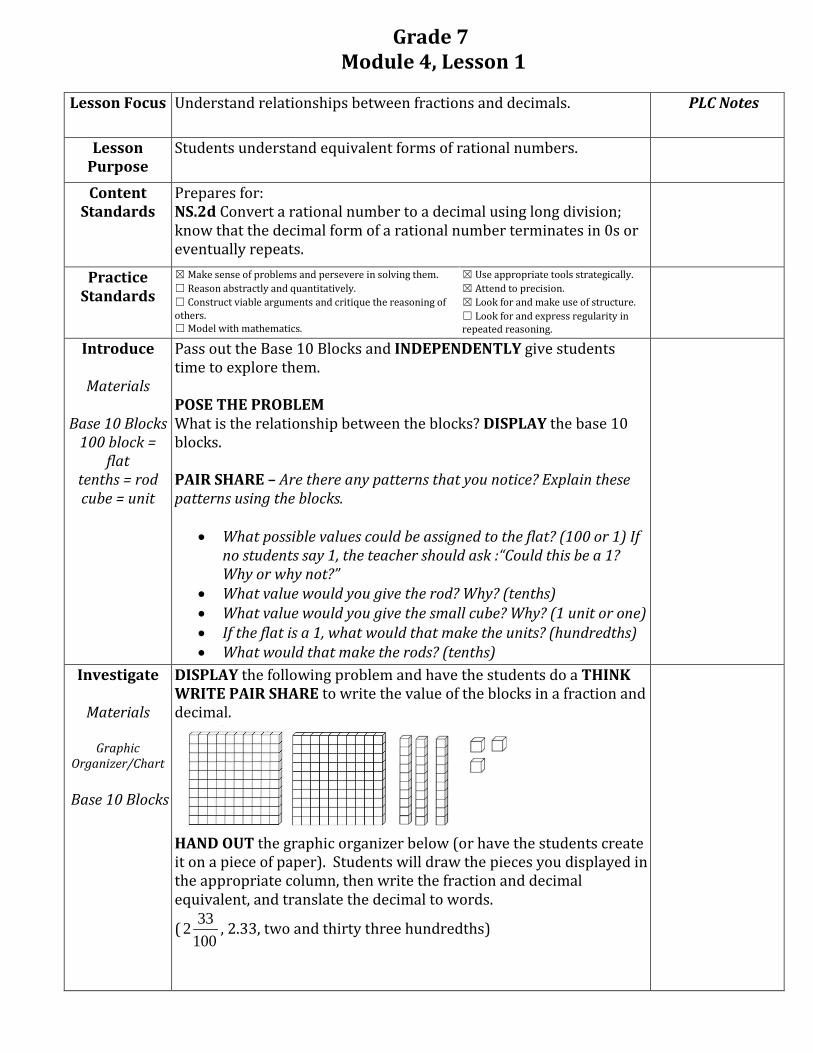
DISPLAY the following problem and have the students do a THINK WRITE PAIR SHARE to write the value of the blocks in a fraction and decimal. HAND OUT the graphic organizer below (or have the students create it on a piece of paper). Students will draw the pieces you displayed in the appropriate column, then write the fraction and decimal equivalent, and translate the decimal to words.
(100332 , 2.33, two and thirty three hundredths)

Ones Tenths Hundredths Fraction Decimal Words
Students will come to a CONSENSUS in their groups about which value to assign to the model displayed and then share out ideas with the whole class. *If the students don’t come to a consensus, display student misconceptions and allow students to do a TABLE TALK about whether they disagree/agree with each.
Then have the students write 1071 in the fraction column, and have
them create and draw the model, decimal and word phrase. * If the students don’t come to a consensus, display student misconceptions and allow students to do a TABLE TALK about whether they disagree/agree with each. Then have students write “nine tenths” in the word column, and have them create and draw the model, fraction and decimal. * If the students don’t come to a consensus, display student misconceptions and allow students to do a TABLE TALK about whether they disagree/agree with each.
Then have the students write 43 in the fraction column, and have
them create and draw the model, decimal and word phrase. * If the students don’t come to a consensus (common misconception
34.043= ), display student work and allow students to do a TABLE
TALK about whether they disagree/agree with each. Ask the following questions to help develop understanding.
• Can you write ¾’s using tenths? How do you know? • Can you use a flat to represent ¾? (No because a flat is 100 or 1
and ¾ is less than 1) • So how can you build ¾ using the rods and the units?
When
students sketch these, they do not
have to divide them accordingly.
A large square can represent a flat, a long
rectangle for the rod, and small square for the one.

Optional Practice
Other examples that students can add to their graphic organizer if
time permits may include: 100
31 , 0.37, seven tenths, 54 etc.
Summarize
Completed Graphic
Organizer
INDEPENDENT Students will journal their answers to “What patterns do you see as you look across the rows in your graphic organizer? Choose one row and compare the fraction to the decimal, which has the greater value? Explain how you know. (You want them to understand that the fraction is equivalent to the decimal. They may struggle with ¾’s but this will be developed later). WHOLE GROUP Students share out ideas and come to a CONENSUS as a whole class. CONNECT There are equivalent forms of numbers. Fractions can be written as terminating decimals and vice versa.
Homework 1) Compare 0.6 and 0.06. Use base 10 blocks to justify your reasoning.

Grade 7 Module 4, Lesson 2
Lesson Focus Convert a fraction to a decimal. PLC Notes
Lesson Purpose
Students discover an efficient strategy for dividing by the denominator to create a decimal.
Content Standards
NS.2d Convert a rational number to a decimal using long division; know that the decimal form of a rational number terminates in 0s or eventually repeats.
Practice Standards
☒ Make sense of problems and persevere in solving them. ☒ Reason abstractly and quantitatively. ☒ Construct viable arguments and critique the reasoning of others. ☐ Model with mathematics.
☒ Use appropriate tools strategically. ☒ Attend to precision. ☒ Look for and make use of structure. ☒ Look for and express regularity in repeated reasoning.
Introduce
Materials
Base 10 blocks
POSE THE PROBLEM You and 4 of your friends go to the store to buy candy on a minimum day. You have $4 to buy candy. To be fair, you want to make sure that each person has the same amount of money. How much will each person get to spend? TABLE TALK What are the key components in the problem? (There are 5 total people that need to split $4 equally) *Teacher Note – have the base 10 blocks out on the tables available for students to use if they choose.
Investigate
Materials
Base 10 blocks
TABLE TALK Students work in groups to represent their thinking *See teacher notes at the end of lesson for expected student outcomes.
MONITOR student work. For struggling groups ask the following questions.
• What fraction can you use to represent the problem? • How is the denominator significant? (it tells students to make
groups of 5, so they know what number to divide by?) • Can $4 be broken into 5 groups? • Is your answer less than $1? How do you know? What would
that look like? SEQUENCE Pull student work to display and discuss.
CONNECT Use the following questions to help tie student work together.
• How does place value relate to creating the fraction and decimal?
• Is there a more efficient way of converting a fraction to a decimal without using the base 10 blocks? (dividing the numerator by the denominator) . For students who multiply the denominator by a factor to get 100
==
××
= 80.010080
205204
54..ei , challenge them with a fraction
like 31 .

Optional Practice
34T
Summarize
34T
CONNECT What patterns did you see in the work that was displayed? (students used groups of 5)
Is there another way to write 54 using mathematical operations?
(4 ÷ 5) Does rewriting the fraction using division work for all fractions? How do you know? THINK PAIR SHAIR Students will independently choose two fractions to divide. They will share their results with a partner. What is a general rule that can be used for using division to rewrite a fraction as a decimal? (numerator divided by denominator)
Homework Prentice Hall Text pg. 234-235 for practice problems
Another option: Below are two ways to represent 41 . Explain how
they are similar and different.
Expected Student Outcomes:
1) Students break up $1 Or students will break up $4 $1
$0.2 $0.2 $0.2 $0.2 $0.2 4 out of 5 is $0.8.
$4
$0.8 $0.8 $0.8 $0.8 $0.8
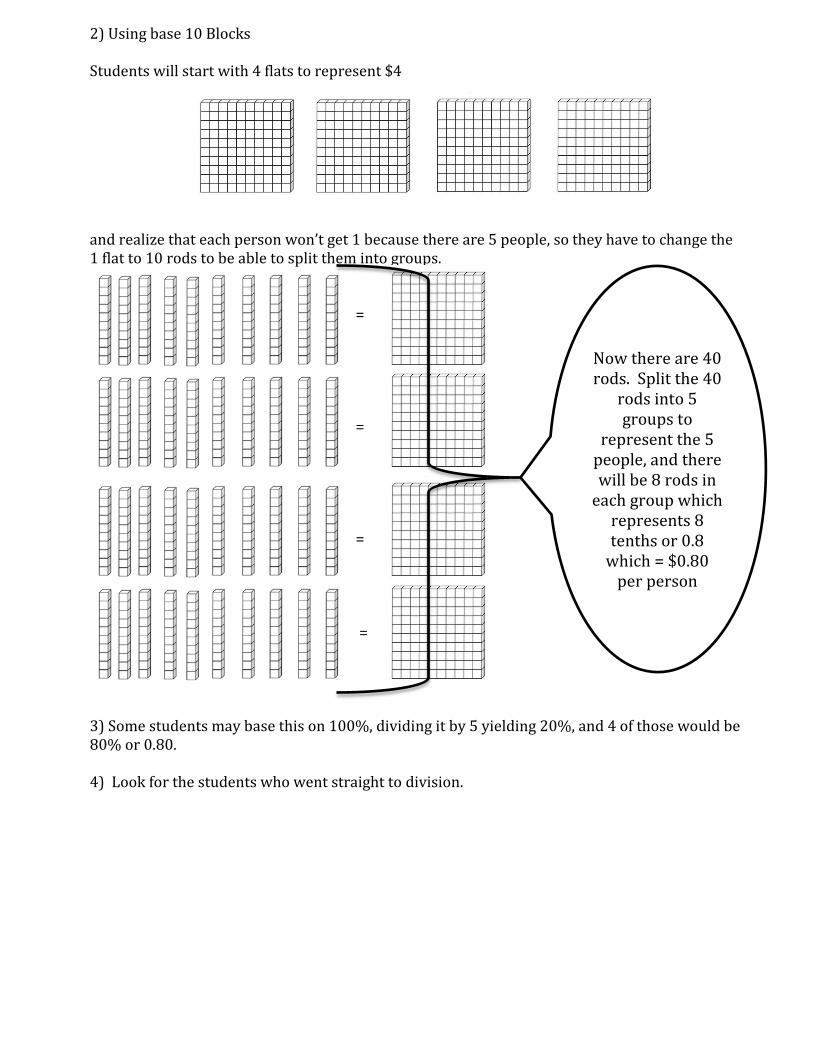
2) Using base 10 Blocks Students will start with 4 flats to represent $4 and realize that each person won’t get 1 because there are 5 people, so they have to change the 1 flat to 10 rods to be able to split them into groups.
= = =
= 3) Some students may base this on 100%, dividing it by 5 yielding 20%, and 4 of those would be 80% or 0.80. 4) Look for the students who went straight to division.
Now there are 40 rods. Split the 40
rods into 5 groups to
represent the 5 people, and there will be 8 rods in
each group which represents 8 tenths or 0.8
which = $0.80 per person

Grade 7 Module 4, Lesson 3
Lesson Focus Understand relationships between fractions, decimals and percents. PLC Notes
Lesson Purpose
“The term percent is simply another name for hundredths.” (Van de Wall, p.162, 2014)
Content Standards
NS.2d Convert a rational number to a decimal using long division; know that the decimal form of a rational number terminates in 0s or eventually repeats.
Practice Standards
☒ Make sense of problems and persevere in solving them. ☒ Reason abstractly and quantitatively. ☒ Construct viable arguments and critique the reasoning of others. ☐ Model with mathematics.
☒ Use appropriate tools strategically. ☒ Attend to precision. ☐ Look for and make use of structure. ☐ Look for and express regularity in repeated reasoning.
Introduce
Materials
Base 10 blocks 10 x 10 grid
POSE THE PROBLEM: “TJ thinks if 3.87 is 387% and 0.57 is 57%, then 0.4 is 4%.” Do you agree or disagree with his reasoning? Justify your answer using model. * Teacher note – make materials available to students
Investigate
Materials
Base 10 blocks 10 x 10 grid
TABLE TALK Students work in groups to construct a viable argument agreeing or disagreeing with the problem. MONITOR student work. Look for students who are just moving the decimal to the right twice. If this is their only strategy ask the following… • Why is that happening? (Multiplying by 100) How do you know? • How can you represent the situation with a model? • Can the same model be used to represent both a decimal and a
percent? (yes). Explain your reasoning. • How is 100 significant? (relating the place value in the decimal to
hundredths, the whole is 100%) • Is 100 similar to 1? (yes they are both one whole) SEQUENCE Select student work through monitoring to display, beginning with more concrete strategies moving to more abstract. WHOLE GROUP Have students critique the reasoning of others in the class while critically evaluating their own thinking. CONNECT Make sure the whole group understands the significance behind 100 by posing the same questions from the MONITOR to the entire class. If no students use long division to justify their answer POSE THE PROBLEM How can you use long division to justify your answer?
Look for students who use
long division to
justify their work. This should be
the last piece in the sequence of
student work.

Optional Practice
Summarize
34T
DISPLAY the image to the right and ask What are some different ways to represent the model? CONSENSUS Allow students to think about their response before discussing their thinking with the group. CONNECT Teacher will write down student responses. Encourage academic vocabulary and explanation of the form of the number (i.e. 57 hundredths could be either a decimal or a fraction so student will need to specify) What do you mean? How would I write that? What does that look like?
• How can you prove this using long division? **Lesson extension POSE THE PROBLEM If a student says that 0.068 is the same as 68%, what was their thinking? INDEPENDENT Have students journal their response.
Homework Possible homework extension: “Using base 10 models, which block would be the best to use to represent a percent? Explain your reasoning.” Teacher may select practice problems from Prentice Hall pg. 303-305
34T

Grade 7 Module 4, Lesson 4
Lesson Focus Students understand the difference between rational and irrational
numbers. PLC Notes
Lesson Purpose
Students define rational and irrational numbers.
Content Standards
NS.2d Convert a rational number to a decimal using long division; know that the decimal form of a rational number terminates in 0s or eventually repeats.
Practice Standards
☒ Make sense of problems and persevere in solving them. ☐ Reason abstractly and quantitatively. ☒ Construct viable arguments and critique the reasoning of others. ☐ Model with mathematics.
☐ Use appropriate tools strategically. ☒ Attend to precision. ☐ Look for and make use of structure. ☒ Look for and express regularity in repeated reasoning.
Introduce
Materials
Black line master of 4
10 x 10 grids
POSE THE PROBLEM Can you divide a 10 x 10 grid into 3 equal parts? INDEPENDENT Each student will use their 10 x 10 grid to make 3 equal parts. After students have time to manipulate the 10 x 10 grid, display the images below…
WHOLE GROUP Teacher asks the following questions.
• Can you divide 100 evenly? What do you notice? (Every time you divided there will always be one left over).
• What does that mean in terms of a decimal? (the decimal repeats).
What happened when you divided your grid into thirds?
100 ÷ 3 leaves one tenth left
over.
What happens if you tried to divide the left over piece into
thirds again?
0.1 ÷ 3 leaves one hundredth left over.

THINK WRITE PAIR SHAIRE • What does that look like when using long division? • How does that compare to the images above?
Investigate
Materials
Blackline Master
DISPLAY the following terms below and have the students TABLE TALK to sort them based on whatever patterns they find. (*Teacher Note – you may want to use the black line master of the terms below and give a set of cards to each group for students to sort)
MONITOR student work and look for students who categorize the terms into three categories (terminating decimals, repeating decimals, and “other”). CONSENSUS Have each group agree on how they categorized the terms. WHOLE GROUP Allow for groups to construct viable arguments to support how they categorized the terms. Students need to be able to defend their reasoning as well as be able to critique the reasoning of other groups. The entire class needs to agree on how the terms are categorized.
Optional Practice
YouTube video “The Weird Number” www.youtube.com/watch?v=SbjtIRp9C6A Van de Walle, J.A. (2014). Teaching Student Centered Mathematics: Developmentally Appropriate Instruction for Grades 6-8. Boston, Pearson.
Summarize
36T
CONNECT By the end of the investigation, the students should have organized the following terms into the following categories….
Terminating Repeating Other
41 , 0.45, 0.5,
81 3737.0 ,
97 , 6.0 ,
31 0.020020002…
0.18375623… π
• Are there other ways to represent the terms in the first two columns? (all can be written as fractions)
• If the first two columns are called Rational Numbers, then what does it mean to be a Rational Number?(terminating decimal, repeating decimal, fractions)
• If the first two columns are Rational Numbers, and the last column represents Irrational Numbers, then what does it mean to be an Irrational Number?(numbers that don’t terminate, can’t be written as a fraction, don’t repeat a pattern)
41 0.45
π 31
3737.0
0.020020002…
0.5
6.0
97
81
0.18375623…

Homework 1) Michael identified the number 1.010010001… as a rational
number. Michael said this number is rational because it has a pattern. Is Michael correct? Explain your reasoning. Identify the numbers as rational or irrational and explain why. 2) 0.31311…… 3) 2,222,222 4) 1
5
5)0.62735… 6)1.001001001… 7) 2
9
8) 7.5

Blackline Master
𝟏𝟒
π
𝟏𝟑
0.3737
𝟏𝟖 0.45
0.5 𝟕𝟗
0.6 0.020020002…
0.18375623…

Grade 7 Module 4, Lesson 5
Lesson Focus Use equivalent forms of rational numbers for estimation. PLC Notes
Lesson Purpose
To write fractions, decimals and percents using multiple representations.
Content Standards
7.NS.2d Convert a rational number to a decimal using long division; know that the decimal form of a rational number terminates in 0s or eventually repeats. 7.NS.3 Solve real-world and mathematical problems involving the four operations with rational numbers.
Practice Standards
☒ Make sense of problems and persevere in solving them. ☒ Reason abstractly and quantitatively. ☒ Construct viable arguments and critique the reasoning of others. ☐ Model with mathematics.
☒ Use appropriate tools strategically. ☒ Attend to precision. ☐ Look for and make use of structure. ☐ Look for and express regularity in repeated reasoning.
Introduce
Materials
34T
DISPLAY the problem.
THINK-PAIR-SHARE 1) Do all three images represent the same value? Justify your answer. 2) Assign a value to each picture. Express your answer(s) as a fraction, decimal and percent.
Investigate
Materials
Picture of American Flag
Make Available
Scissors
Rulers
10 x 10 Grid
POSE THE PROBLEM Estimate what percent of the American Flag is blue? Justify your answer using a model. Express your answers as a fraction, decimal and percent. TABLE TALK Students will work in groups to come up with an answer. Teacher will MONITOR student work. Make scissors and rulers available to students as some may want to cut or measure the picture. *Teacher Note – For struggling students… What have we previously learned that can help you solve this problem? (10 x 10 grid, equivalent forms of numbers) How does the flag compare to a 10 x 10 Grid? SELECT Teacher will select student work/strategies to display and students can critique the reasoning of other groups. Select work that shows students who started with a fraction and students who started with a decimal to show different approaches to the problem.
Optional Practice
Summarize
Materials
Picture of American Flag
Make Available
Scissors
Rulers
10 x 10 Grid
CONNECT/WHOLE GROUP What are some reasonable answers for the percent of the flag that is blue? How do you know? (20% - 25% would be acceptable answers)
What fractions could we use to represent the percent? (41,
51 )
How can you use a 10 x 10 grid to justify your answer? POSE THE PROBLEM and have the students answer in a THINK WRITE PAIR SHARE If you know the percentage of the flag that is blue, how would you figure out the percentage of the flag that is not blue? Express your answer as a fraction, decimal and percent. (Students will need to subtract the blue portion from the whole). TABLE TALK
• What percent of the flag is red? Express your answer as a fraction, decimal and percent. (Acceptable answer ≈ 41%)
• If you already know the percentage of blue and red, how can you find the percentage of white? Express your answer as a fraction, decimal and percent. (Acceptable answer ≈ 40%)
INDEPENDENT If the red is 41.5% and the white is 40.9%, what percent does the blue have to be? (17.6%)
Homework
Prentice Hall pg. 304 #56-57
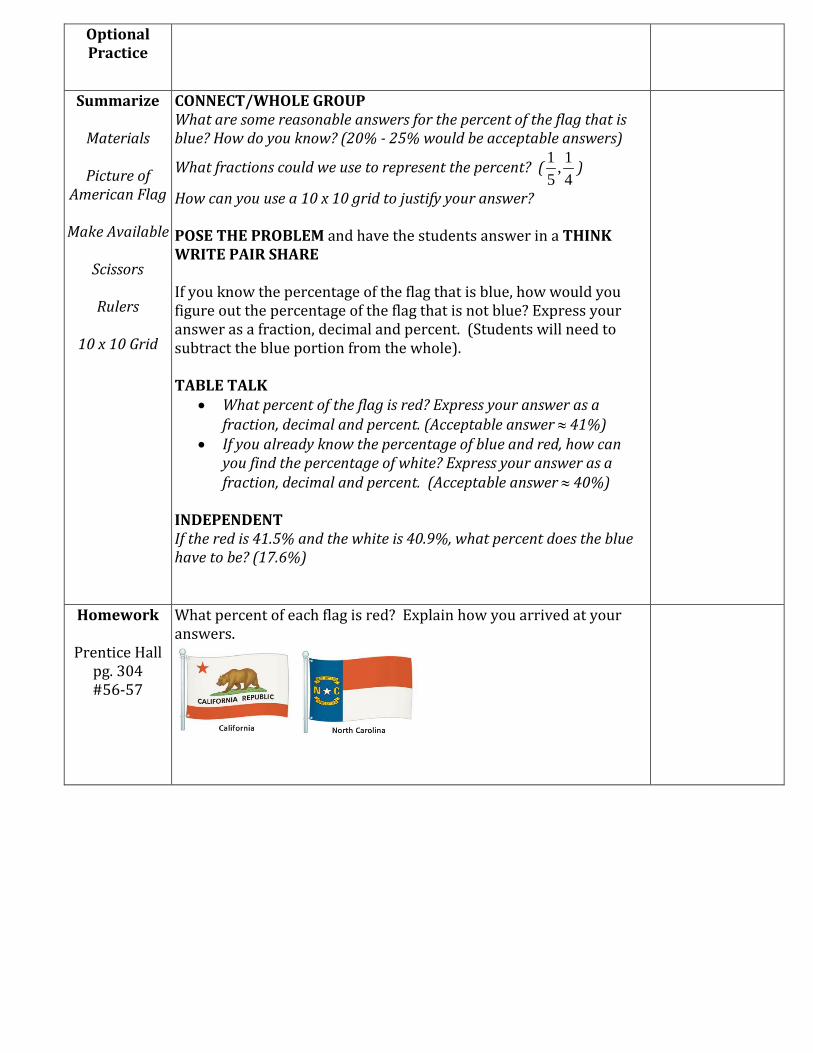
What percent of each flag is red? Explain how you arrived at your answers.


Grade 7 Module 4, Lesson 6
Lesson Focus Compare and order rational numbers. PLC Notes
Lesson Purpose
Use benchmark fractions of one half and one whole to compare and order fractions.
Content Standards
If students need extra practice on working with different forms of rational numbers, this optional lesson can be used. Additionally, this lesson supports student reasoning behind 7.NS.2d and 8.NS.A.2.
Practice Standards
☒ Make sense of problems and persevere in solving them. ☐ Reason abstractly and quantitatively. ☒ Construct viable arguments and critique the reasoning of others. ☐ Model with mathematics.
☒ Use appropriate tools strategically. ☒ Attend to precision. ☒ Look for and make use of structure. ☐ Look for and express regularity in repeated reasoning.
Introduce
Materials
Fraction Bars
Graph Paper
Blank Number Lines
*The intention for the lesson is to expose the students to different ways of ordering fraction beyond standard algorithms. However, it’s critical to continue throughout the year with instructional routines that repeatedly give students an opportunity to use these strategies that are explored in this lesson (San Diego Mathematics Routine Bank) DISPLAY the following sets on notecards, paper or using a PowerPoint. Use the following directions: “Which fraction in each pair is greater? Do not use drawings, models, common denominators, or cross products.”
INDEPENDENT As the teacher flips through each problem, students will write down which fraction they thought was greater. CONSENSUS Teacher will give each group one of the problems from the list above. Each group will construct a viable argument about which fraction is greater and why, and present their findings to the class. During presentations, students will critique the reasoning of other groups. Provide tools for students to choose from to justify their answers but DO NOT instruct them to do so.
(Van
de
Wal
le, 2
014,
pg.
115
)
Investigate
Materials
Fraction Bars
Graph Paper
Blank Number Lines
POSE THE PROBLEM (Adapted from Van de Wall, pg 108, 2014) The friends below are playing the game red light – green light. Who is winning? The rational numbers tell how much of the distance they have already moved. Can you place these friends on a line to show where they are between the start and the finish?
Mary: 35% John: 0.5 Larry: 65 Mike:
85 Jose:
95 Angela: 6.0
*Teacher Note –Some students may not be familiar with the game red light – green light, therefore be sure to explain or role play the game. THINK PAIR SHARE Students will answer the question independently and then share with a partner. As students are working/sharing, teacher should MONITOR looking for student misconceptions which should be DISPLAYED and discussed.
Optional Practice
Summarize
CONNECT/WHOLE GROUP What are some strategies that helped you order the friends? (compare the fractions to one half or one whole to estimate placement. Some might have converted them all to decimals etc.)
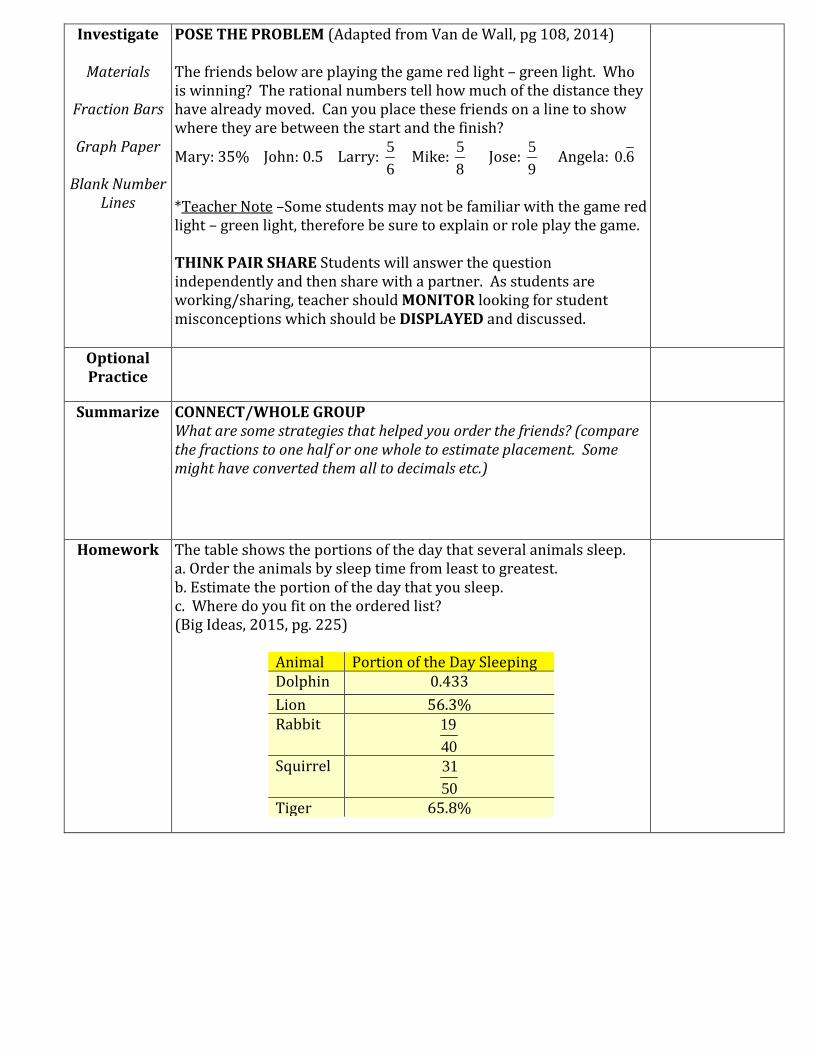
Homework The table shows the portions of the day that several animals sleep. a. Order the animals by sleep time from least to greatest. b. Estimate the portion of the day that you sleep. c. Where do you fit on the ordered list? (Big Ideas, 2015, pg. 225)
Animal Portion of the Day Sleeping Dolphin 0.433 Lion 56.3% Rabbit
4019
Squirrel 5031
Tiger 65.8%

Grade 7 Module 4, Lesson 7
Lesson Focus Compare and order rational numbers on a number line. PLC Notes
Lesson Purpose
Be able to recognize and use benchmark fractions on different types of number lines to assist in comparing and ordering rational numbers.
Content Standards
If students need extra practice on working with different forms of rational numbers, this optional lesson can be used. Additionally, this lesson supports student reasoning behind 7.NS.2d and 8.NS.A.2.
Practice Standards
☒ Make sense of problems and persevere in solving them. ☐ Reason abstractly and quantitatively. ☒ Construct viable arguments and critique the reasoning of others. ☐ Model with mathematics.
☐ Use appropriate tools strategically. ☒ Attend to precision. ☒ Look for and make use of structure. ☒ Look for and express regularity in repeated reasoning.
Introduce
Materials
DISPLAY a number line like the one below on the board.
INDEPENDENT Student will answer the following questions independently.
1) Place 32 and
52 on the number line.
2) Explain how you decided where to place 32 and
52 on the number
line.
3) Which of the two fractions is nearer to 21 ? Explain how you
figured it out. (http://www.insidemathematics.org/common-core-math-tasks/5th-grade/5-2005%20Fractions.pdf) PAIR SHARE Have students get with a partner to share their answers and strategies for solving the problem.
Investigate
Materials
DISPLAY the number line below and POSE THE PROBLEM:
Show 31 , 65% and
83 on the number line below.

TABLE TALK Student will work with their group to figure out how to correctly place the three terms correctly on a number line. They should be prepared to answer the following questions. • How is this number line different from others that you are familiar
with? • What rational number represents half of this number line? (50%) • How did you decide where to place the rational numbers? (Students
should explain if they converted the rational numbers to different forms or used their relationships to one half or one whole etc.)
MONITOR Teacher should monitor groups looking for groups that have the terms in the wrong order and for the use of different strategies. SELECT For students who incorrectly placed the terms on the number line, have them defend their work. For students who used various strategies, have the rest of the groups critique their reasoning.
Optional Practice Write three fractions between
81 and
91 . Explain how you know.
Summarize
CONNECT/WHOLE GROUP What do you need to know about the number line to be able to correctly place rational numbers? (the values shown on the number line) TABLE TALK Have students answer the questions below and be prepared to defend their answers. Groups will then share out and critique the reasoning of others. Where would you place 1% on the number line? (just after the 0) Where would you place 1 on the number line? (1 is the whole, just as 100% is also the whole) *Teacher Note – use the number line in the investigation
Homework You, your sister, your brother and a friend each take the same number of shots at a soccer goal. You make 72% of your shots, your
sister makes 2519 of her shots, your brother makes
107 of his shots,
and your friend makes 0.67 of his shots. Who made the fewest shots? Use the number line below to graph your answer.
0.66 0.68 0.70 0.72 0.74 0.76 0.78