work in progress. do not cite future histories aromar revi exploring pathways for india and china in...
Post on 21-Dec-2015
214 views
TRANSCRIPT

Work in progress. Do not cite
Future Histories
Aromar Revi
Exploring Pathways for India and China in the 21st Century30th April 2007

Work in progress. Do not citeWhy should India or China be interested in the long duree?
• History is often written by the ‘winning’ side or as a ‘hegemonic project’
• Futures are often linear extrapolations of the past• This is largely worthless during periods of non-linear change when
stream-shifting between multiple narratives is typical• The 21st century will be a time of turbulent structural change in
domestic and global environments, when conventional analytical methods break down
• China and India will be central to many non-linear disruptive changes through the 21st century
• Future History is an examination of possible regime envelopes to help articulate key challenges and opportunities of possible traverses
• A shared Open Source framework (e.g. like IFs++) is needed to create a ‘space’ for conversations about dynamic, uncertain but high impact processes from both hegemonic and subaltern perspectives
• This could lead to more meaningful discussions on the traverse(s) required to address key national and global change challenges: e.g. poverty; political, economic and environmental security

Work in progress. Do not cite
Background & Methodology This set of narratives / analysis is based on the International Futures (IFs) aggregate global model of 182 countries in its Jan 2007, Version 5.34. It seeks to:
1. Use ‘standard’ scenarios to compare a few global and national trends for India, China, the US and the world, over the 2000-2100 period
2. Explore whether these outcomes seem plausible given past trends and a broad understanding of current and emerging dynamics
3. Explore the possible strategic and policy implications, constraints and opportunities before governments and other global stakeholders
4. The primary objectives is to ask a few ‘big’ questions and underscore the need for a neutral national and global analytical framework to widen the dialogue between China and India on the construction of new domestic, bilateral and multilateral relationships, in the early-mid 21st century
CAVEATS: IFs forecasts are not predictions. They are scenarios to be used for thinking about possible alternative longer-term futures. The narratives and model results presented are only indicative, ranging from the moderately certain to the outrageously speculative. Some outcomes may be model ‘arefacts’ rather than based on real world dynamics. These are under test and ongoing revision.
THIS SESSION PRESENTS SOME OF THE KEY ISSUES EMERGING FROM PHASE 1 OF THIS WORK

Work in progress. Do not cite
International Futures (IFs) V 5.34
Lead Author: Prof. B. Hughes, Univ. of Denver
See: http://www.ifs.du.edu
Hughes, B and Hillebrand E.E. (2006) Exploring and Shaping International Futures, Paradigm, London

Work in progress. Do not cite
What is International Futures (IFs)?A multi-level hybrid Global (Systems Dynamics and econometric model) based on 182 integrated 6-sector Country sub-models with a cohort-component demographic; General Equilibrium-seeking economic; SAM flow and stock model representations
Economic
Socio-Political
Population
Agriculture Energy
EnvironmentalResources and
Quality
International Politcal
Labor
Demand, Supply,Prices, Investment
Resource Use,Carbon Production
Land Use,Water
GovernmentExpenditures
Conflict/CooperationStability/Instability
FoodDemand
Income Networking
Technology
March 2004
Work in progress. Do not cite
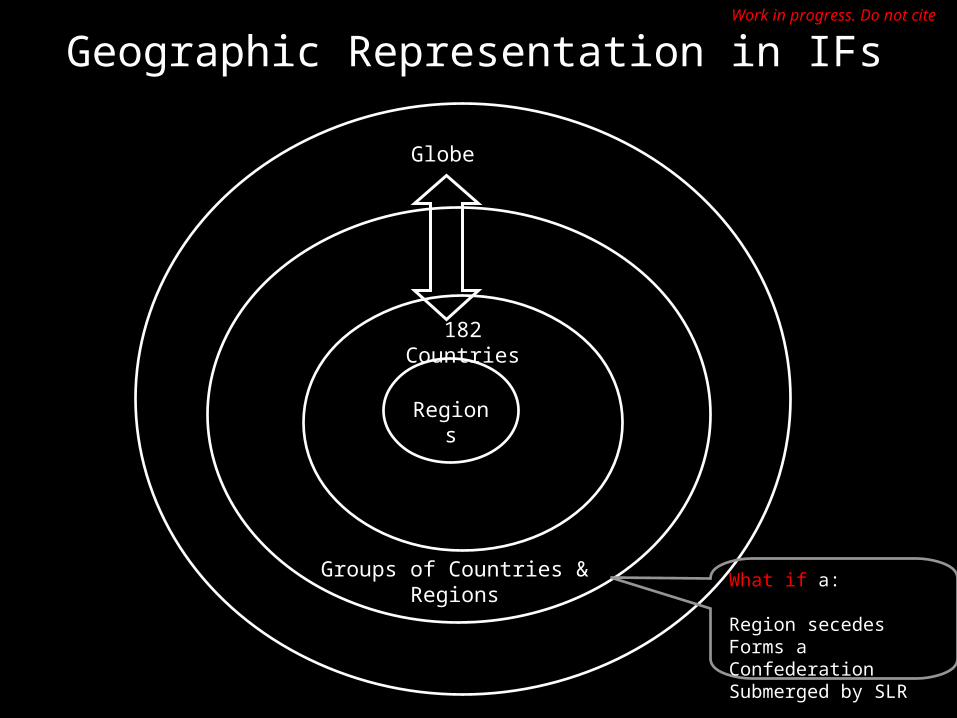
Geographic Representation in IFs
Regions
182 Countries
Groups of Countries & Regions
Globe
What if a: Region secedesForms a ConfederationSubmerged by SLR

Work in progress. Do not cite
Why IFs as a platform?
• Coverage: 182 countries with inbuilt 1960-2000 dataset • Multi-level regional structure: can/will be able to explore
options beyond conventional nation-state boundaries• In active use: US National Intelligence Council; EU; GM,
UNEP; RAND, CIA etc.• Transparent: Open Source structure & Code. • Inclusive: scenario implementation from multiple
sources…• Well documented• Unpretentious: work in progress…warts and all• Responsive: Live project with quick
response/development time• Free

Work in progress. Do not cite
Overview of a few IFs Features

Work in progress. Do not citeIFs Demographic Sub-model: Key Features
• Represents 22 age-sex cohorts up to age 100+
• Calculates changes in fertility and mortality rates in response to income, income distribution and analysis multipliers
• Computes average life expectancy at birth, literacy rate,
and overall measures of human development (HDI) and physical quality of life (PQLI)
• Represents Migration and HIV/AIDS
• Includes formal primary, secondary & tertiary education
• Does not simulate: rural-urban migration and multiple SECs

Work in progress. Do not citeIFs Demographic Sub-model Causal Structure

Work in progress. Do not cite
IFs Economic Sub-model: Key Features• 182 countries in a six sector economic model: Agriculture,
Materials, Energy, Industry, Services and ICT using raw data from GTAP
• General Equilibrium-seeking Model that does not assume exact equilibrium in a given year. Uses inventories as buffer stocks to provide price signals so that the model chases equilibrium over time
• Computes and uses IO matrices that change with development level
• Uses an endogenous production function that represents MFP growth from R&D, education, worker health, economic policy and energy prices
• Linear Expenditure System to represent changing Consumption patterns
• Pooled rather than Bilateral trade approach for International trade
• Embedded Social Accounting Matrix (SAM) envelope ties economic production and consumption to intra-actor financial flows and stocks
• Weaknesses: market clearing, poverty analysis, I-O determinacy, too thin a SAM, PPP formalism etc.

Work in progress. Do not citeIFs Economy Sub-model: Overall Causal Structure

Work in progress. Do not cite
IFs Economy Sub-model: Causal Logic• The economic module represents supply, demand, and trade in 6
economic sectors: agriculture, energy, raw materials, manufactures, services & ICT
• Inventories are the key equilibrating variables in two negative feedback loops. – As inventories rise, capacity utilization falls, decreasing
production, and restraining inventories. – Similarly, as inventories rise, prices fall, increasing final demand
and decreasing inventories.
• Physical investment and capital stocks are key driving variables in one positive feedback loop. – As capital rises, it increases value added and GDP, increasing
final demand and further increasing investment. – Similarly, social investment can increase production and
inventories in another positive feedback loop.• A-matrices (I-O) computed dependent on the level of development
(GDP per capita), allow computation of Gross Value Added and after satisfaction of intersectoral flows, production that is available to meet Final Demand.
• The balance of this Production for Final demand with Actual Final demand determines whether inventories grow or decline – hence, a General Equilibrium seeking structure
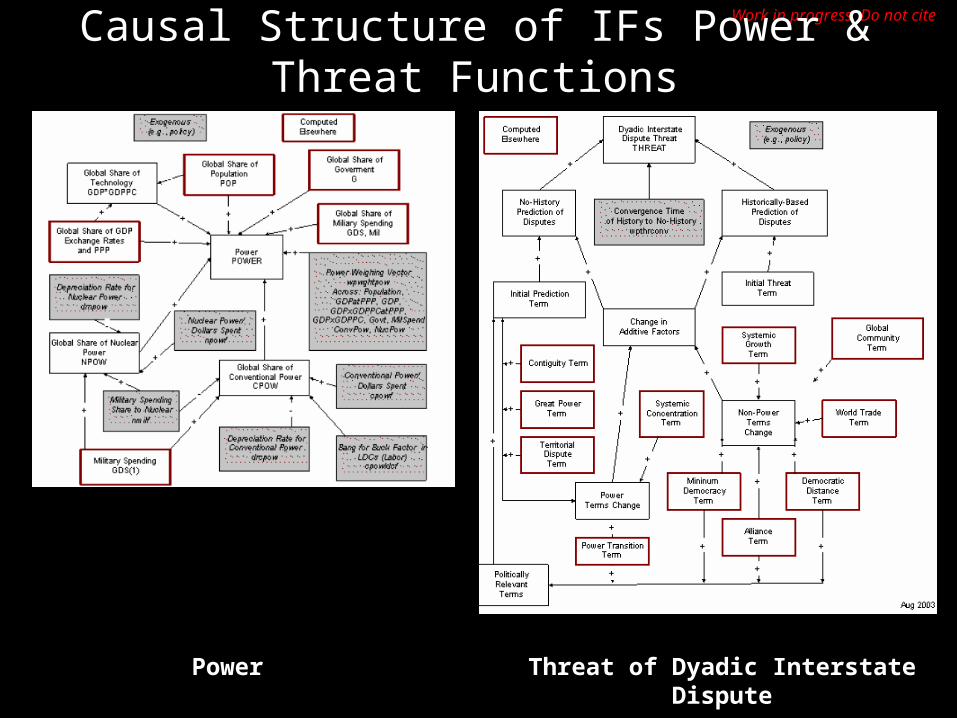
Work in progress. Do not citeCausal Structure of IFs Power & Threat Functions
Power Threat of Dyadic Interstate Dispute

Work in progress. Do not cite
Why only these three Features today?
Attempting to engage with the rudimentary dynamics of
1. A transition to a Tertiary/ Services-sector led economy, hence the population-education nexus
2. Global transitions in economic power3. Global transitions in ‘hard’ power4. Global transitions in ‘soft’ power5. Climate change in the context of rapid economic
growth
within differing global and national policy trajectories, simulated via scenario analysis

Work in progress. Do not cite
Global Scenarios:an Art of Quantitative Narrative
Work in progress. Do not cite
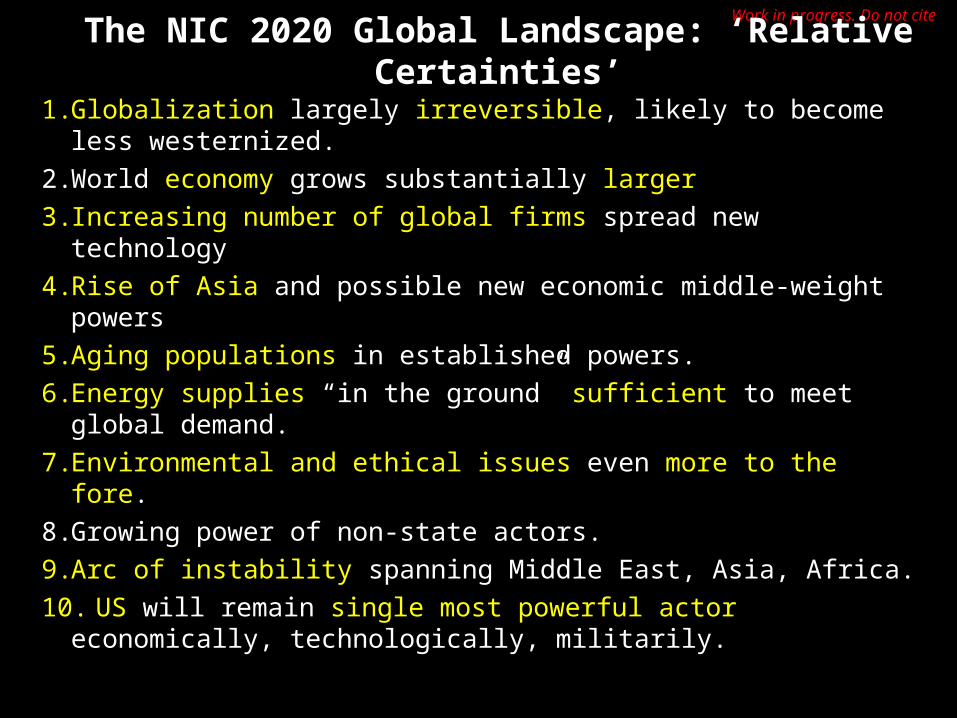
Work in progress. Do not citeThe NIC 2020 Global Landscape: ‘Relative
Certainties’1. Globalization largely irreversible, likely to become less
westernized.2. World economy grows substantially larger3. Increasing number of global firms spread new
technology4. Rise of Asia and possible new economic middle-weight
powers5. Aging populations in established powers.6. Energy supplies “in the ground” sufficient to meet
global demand.7. Environmental and ethical issues even more to the fore.8. Growing power of non-state actors.9. Arc of instability spanning Middle East, Asia, Africa.10. US will remain single most powerful actor
economically, technologically, militarily.
Work in progress. Do not cite
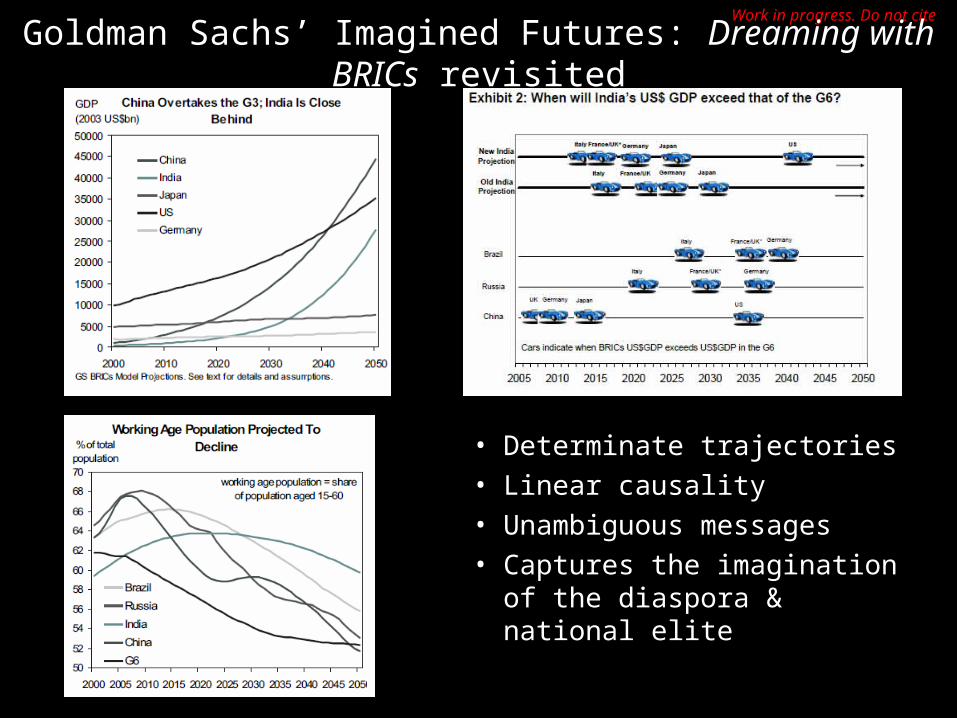
Goldman Sachs’ Imagined Futures: Dreaming with BRICs revisited
• Determinate trajectories• Linear causality• Unambiguous messages• Captures the imagination
of the diaspora & national elite

Work in progress. Do not cite
Millennium Ecosystem Assessment: Economic Growth Scenarios
16X 5X 8X 11X
reactive,
globalized,
sustainable development
reactive,
devolution,
protection
proactive,
global,
eco-efficiency
proactive,
devolution,
bioregionalism

Work in progress. Do not citeIntegrated Global Scenarios - over the last decade
• Global Scenarios Group (1998)– Market World– Fortress World– Transformed World
• IPCC- SRES (2001)– A1– A2– B1– B2
• NIC Mapping the Future (2004)– Davos World– Pax Americana– A New Caliphate– Cycle of Fear
• Mill. Ecosystem Assessment(2005)– Global Orchestration– Order from Strength– Adapting Mosaic– Technogarden
• Shell Scenarios 2025 (2005)– Open Doors– Low Trust Globalisation– Flags
• UNEP GEO3/4 (2002, 2006-)– Markets First– Security First– Policy First– Sustainability First

Work in progress. Do not cite
A ‘Past’ and Four Stylised Futures
Work in progress. Do not cite
0%
5%
10%
15%
20%
25%
30%
35%
1500 1600 1700 1800 1900 2000Time
% S
hare
of G
loba
l Out
put
US China India UK Japan Russia Sources: Maddison, 2000, Goldman Sachs, 2003, Revi, 2005
India
ChinaUS
UKRussia
Japan
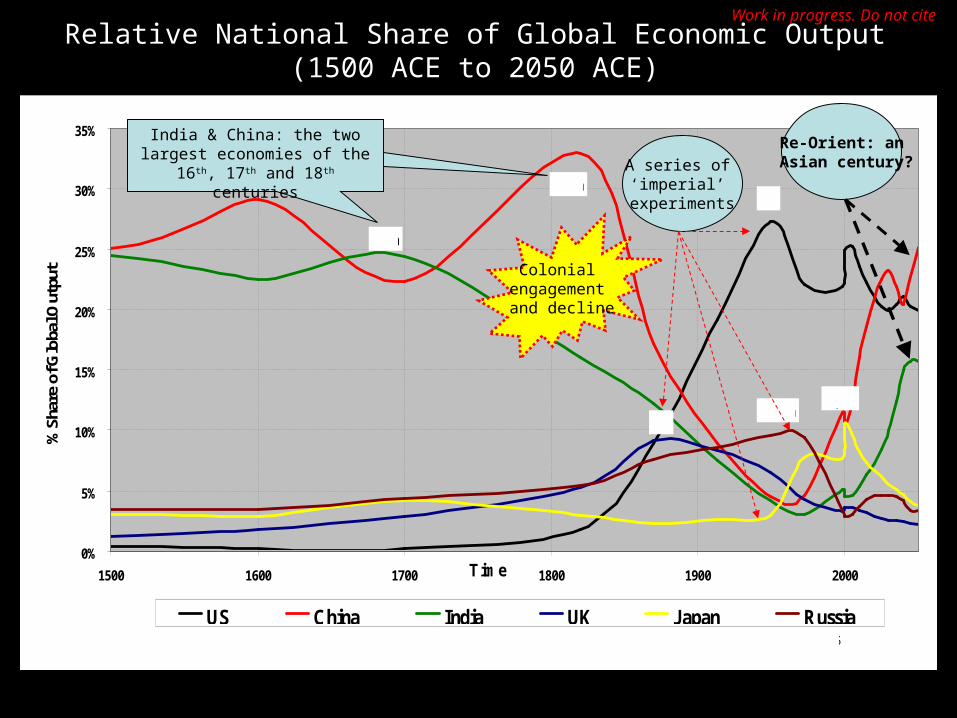
India & China: the two largest economies of the 16th, 17th and
18th centuries
Relative National Share of Global Economic Output (1500 ACE to 2050 ACE)
Colonial engagement and decline
A series of ‘imperial’
experiments
Re-Orient: an Asian century?

Work in progress. Do not citeNational Share of Global population (1500 ACE – 2050
ACE)
-
1
2
3
4
5
6
7
8
9
10
1500 1700 1870 1950 1960 1970 1980 1990 2000 2010 2020 2030 2040 2050
Glo
bal
Popula
tion (bill
ion)
China India United States UK Japan Russia Rest of the World
India
China
US
Rest of the World(incl. Europe)
Sources: Maddison, 2000, UN, 2003, Revi analysis, 2006
The growth of large working populations in China & India
underpins their growth as economic powers as the
West ages and prefers ‘less’ and more productive work
But potent competition from other emerging economies in
Asia, Latin America and Africa

Work in progress. Do not cite
Relative national share of World Urban Population (1700 ACE - 2030 ACE)
0%
5%
10%
15%
20%
25%
30%
35%
40%
45%
1700 1750 1800 1850 1900 1950 2000Time
% o
f to
tal G
lobal
urb
an p
opula
tion
China India USA Russia UK Japan
Source: Chandler, 1987, Bairoch, 1988, UN, 2003, Visaria, 2001, Revi analysis, 2006
India
China
US
UK
RussiaJapan
India, China & Japan had the largest urban populations in the world till the early 19th century
India, China & the US will have largest national urban populations
in the mid-21st century

Work in progress. Do not cite
UNEP GEO3/4 Global Scenarios
• Markets First: trust in globalisation and economic liberalisation. Govt’s unable to cope with social and environmental issues
• Security First: great disparities across countries and environmental pressures lead to conflict; the rich and powerful separate themselves from the poorer world
• Policy First: Govts. take decisive initiatives towards social and environmental goals, but steps are not adequate to address them adequately
• Sustainability First: A new paradigm emerges. New values and institutions support changes in behavior and policies on social and environmental issues

Work in progress. Do not cite
Global Demographic & Educational Trends
in an IFs world (2000-2100)

Work in progress. Do not citeGlobal Population trajectories by Educational status
Three cross-overs in the transition to a global knowledge society:~2050; ~2065 and ~2085
Global: Population by Educational Status (2000-2100)
-
500
1,000
1,500
2,000
2,500
3,000
3,500
4,000
2000 2005 2010 2015 2020 2025 2030 2035 2040 2045 2050 2055 2060 2065 2070 2075 2080 2085 2090 2095 2100Years
Pop
ulat
ion
(mill
ions
)
Incomplete Primary Secondary TertiarySource: IFs 5.34, 2007, TARU analysis, 2007
Incomplete-Primary
Tertiary-Secondary
Tertiary-Primary

Work in progress. Do not citeNational Populations with Only Primary Education (2000-2100)
Chindia will have up to 1 billion people with only a primary education – limiting formal knowledge intensive occupations and underscoring the
importance of traditional knowledge
National Populations with Only Primary Education (2000-2100)
-
100
200
300
400
500
600
700
2000 2005 2010 2015 2020 2025 2030 2035 2040 2045 2050 2055 2060 2065 2070 2075 2080 2085 2090 2095 2100Years
Popu
lation
(mill
ions
)
India China USA EU25 Japan Russia Brazil

Work in progress. Do not citeNational Populations with Only Secondary Education (2000-2100)
China leads with its secondary educated population till late century, followed by steady Indian growth, EU and Brazil expansion and more or less steady US
population
National Populations with Only Secondary Education (2000-2100)
-
50
100
150
200
250
300
350
400
2000 2005 2010 2015 2020 2025 2030 2035 2040 2045 2050 2055 2060 2065 2070 2075 2080 2085 2090 2095 2100Years
Popu
lation
(mill
ions
)
India China USA EU25 Japan Russia Brazil
India-EU India-US
China-India

Work in progress. Do not citeNational Populations with Tertiary Education (2000-2100)
India and China in competition as potential lead knowledge powers followed by US and EU?
National Populations with Tertiary Education (2000-2100)
-
100
200
300
400
500
600
2000 2005 2010 2015 2020 2025 2030 2035 2040 2045 2050 2055 2060 2065 2070 2075 2080 2085 2090 2095 2100Years
Popu
lation
(mill
ions
)
India China USA EU25 Japan Russia Brazil
India-China-EU India-China-US
Work in progress. Do not cite
Speculation on Global & Regional Challenges & Opportunities (2000-
2100)

Work in progress. Do not cite
Global & Regional Challenges & Opportunities I1. Global population peaks at ~ 10 billion in the 2060s, its structure
driven largely by DC growth trends2. Population in the working age peaks pre-2050 implying changes
in retirement age, nature of work, the inter-generational social compact of the 20th century western European welfare state
3. With much of the global working population of Asian origin, with some from Africa and Latin America, pressure on immigration to address the ‘greying’ of the ‘OECD’ workforce may be significant
4. Russia could be severely challenged in maintaining its territorial integrity given its population decline
5. Japan could be eclipsed as a manufacturing power, potentially changing the geo-political character of East Asia
6. Densities in much of Asia rapidly become unsustainable without dramatic changes in ecopotential, technology, management and institutional regimes
7. Demographically dominant and economically significant new BRIC regions may experience new forms of stratification e.g. based on education
8. This along with large rural populations may deepen the divides between the biomass, industrial and knowledge economies as their productivity and per capita output levels diverge, leading to a trifurcated economy

Work in progress. Do not citeGlobal & Regional Challenges & Opportunities II
7. Apart from a large and increasingly aged illiterate population, over a billion people could have only a primary education, requiring a new link between traditional and formal knowledge production and transmission
8. China could have the largest Secondary-level educated population till late century, followed by steady Indian growth, some EU and Brazil expansion and a more or less steady US population
9. These may be the major manufacturing powers of the 21st century, if no dramatic shifts in current modes of industrial production take place
10.India and China could be in close demographic competition as potential lead knowledge powers followed by US and EU. Educational, innovation and institutional quality may be key differentiators.
11.The penetration and importance of the ‘knowledge economy’ to the livelihoods of these populations is a key question. Will these groups become a large urban underclass? What with that imply for social stability, the role of the middle class and the future of capitalism?
12.The standard OECD-following shift towards a capitalist knowledge economy may not come to pass for much of the century

Work in progress. Do not cite
Global & Regional Challenges & Opportunities III
13. This is a world in which economic power is increasingly wielded by low and middle income countries with large populations of relatively poor people; an aging ‘core’ and a new set of global corporations
14. Demographic momentum and economic growth trends in Asia, could shift the balance of economic and soft power towards Asia by 2035
15. This may not be followed by a hard (military) power shift16. The close integration of the Chinese and Indian diasporas
and elites with the US will provide an interesting backdrop to these changes
17. Shifting alliances between China, India, the US and EU and the role of large corporations in this game are big open questions.
18. Traditional global centre-periphery relationships of the industrial era may change under the influence of a range of regional forces leading to an increasingly fractal regionalised landscape of connectivity, throughput and power.
19. Therefore, the language and style of hegemony of the (New Knowledge?) economy of the 21st century could probably be quite different from that of the 20th

Work in progress. Do not cite
China Demographic & Educational Trends
in an IFs world (2000-2100)

Work in progress. Do not citeChina: Population cohorts by Education (2000)
Incomplete education (54%); Primary (33%), Secondary (12%); Tertiary (2%).
China: Population Cohorts by Education Level (2000)
-100 -50 0 50 100Population (millions)
No Education Primary Secondary Tertiary
100 50 50 100MALE FEMALE
Source: IFs 5.34, 2007; TARU analysis,
0-4
5-9
10-1415-19
20-24
25-29
30-34
35-39
40-4445-49
50-5455-59
60-64
65-6970-74
75-79
80-84
84-89
90-9495-99
>100

Work in progress. Do not citeChina: Population cohorts by Education (2005)
Incomplete education (48%); Primary (36%), Secondary (14%);
Tertiary (2%).
China: Population Cohorts by Education Level (2005)
-100 -50 0 50 100Population (millions)
No Education Primary Secondary Tertiary
100 50 50 100MALE FEMALE
Source: IFs 5.34, 2007; TARU analysis,
0-4
5-9
10-1415-19
20-24
25-29
30-34
35-39
40-4445-49
50-54
55-59
60-64
65-69
70-74
75-79
80-84
84-89
90-9495-99
>100

Work in progress. Do not citeChina: Population cohorts by Education (2010)
Incomplete education (43%); Primary (38%), Secondary (15%); Tertiary (3%).
China: Population Cohorts by Education Level (2010)
-100 -50 0 50 100Population (millions)
No Education Primary Secondary Tertiary
100 50 50 100MALE FEMALE
Source: IFs 5.34, 2007; TARU analysis,
0-4
5-9
10-1415-19
20-24
25-29
30-34
35-39
40-4445-49
50-54
55-59
60-64
65-69
70-74
75-79
80-84
84-89
90-9495-99
>100
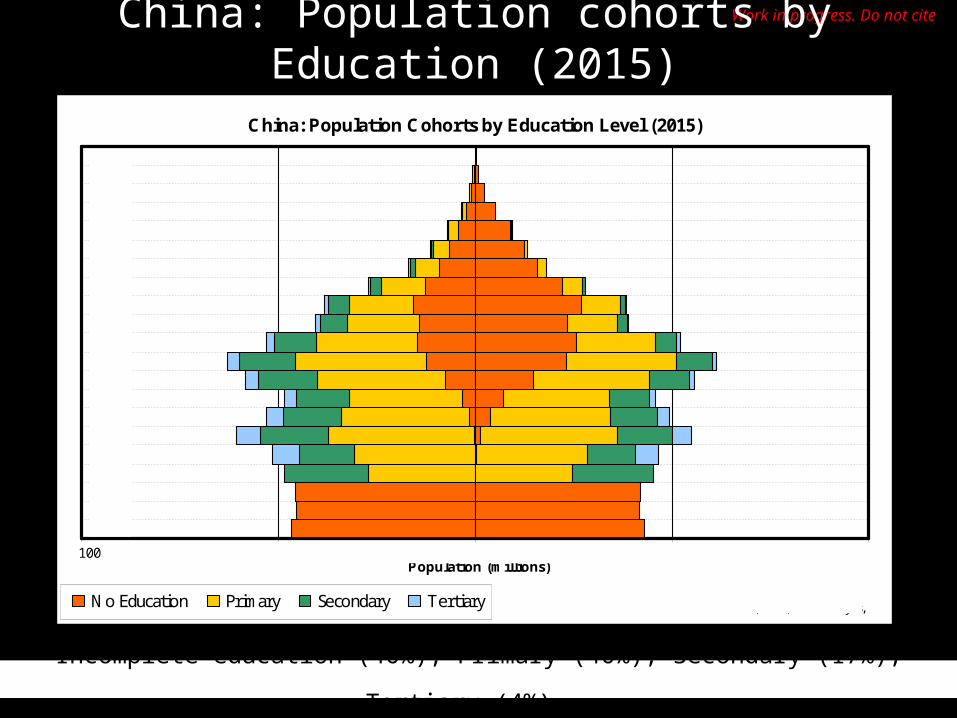
Work in progress. Do not citeChina: Population cohorts by Education (2015)
Incomplete education (40%); Primary (40%), Secondary (17%); Tertiary (4%).
China: Population Cohorts by Education Level (2015)
-100 -50 0 50 100Population (millions)
No Education Primary Secondary Tertiary
100 50 50 100MALE FEMALE
Source: IFs 5.34, 2007; TARU analysis,
0-4
5-9
10-1415-19
20-24
25-29
30-34
35-39
40-4445-49
50-54
55-59
60-64
65-69
70-74
75-79
80-84
84-89
90-9495-99
>100

Work in progress. Do not citeChina: Population cohorts by Education (2020)
Incomplete education (37%); Primary (40%), Secondary (18%); Tertiary (5%).
China: Population Cohorts by Education Level (2020)
-100 -50 0 50 100Population (millions)
No Education Primary Secondary Tertiary
100 50 50 100MALE FEMALE
Source: IFs 5.34, 2007; TARU analysis,
0-4
5-9
10-1415-19
20-24
25-29
30-34
35-39
40-4445-49
50-54
55-59
60-64
65-69
70-74
75-79
80-84
84-89
90-9495-99
>100

Work in progress. Do not citeChina: Population cohorts by Education (2025)
Incomplete education (34%); Primary (41%), Secondary (19%); Tertiary (6%).
China: Population Cohorts by Education Level (2025)
-100 -50 0 50 100Population (millions)
No Education Primary Secondary Tertiary
100 50 50 100MALE FEMALE
Source: IFs 5.34, 2007; TARU analysis,
0-4
5-9
10-1415-19
20-24
25-29
30-34
35-39
40-4445-49
50-54
55-59
60-64
65-69
70-74
75-79
80-84
84-89
90-9495-99
>100
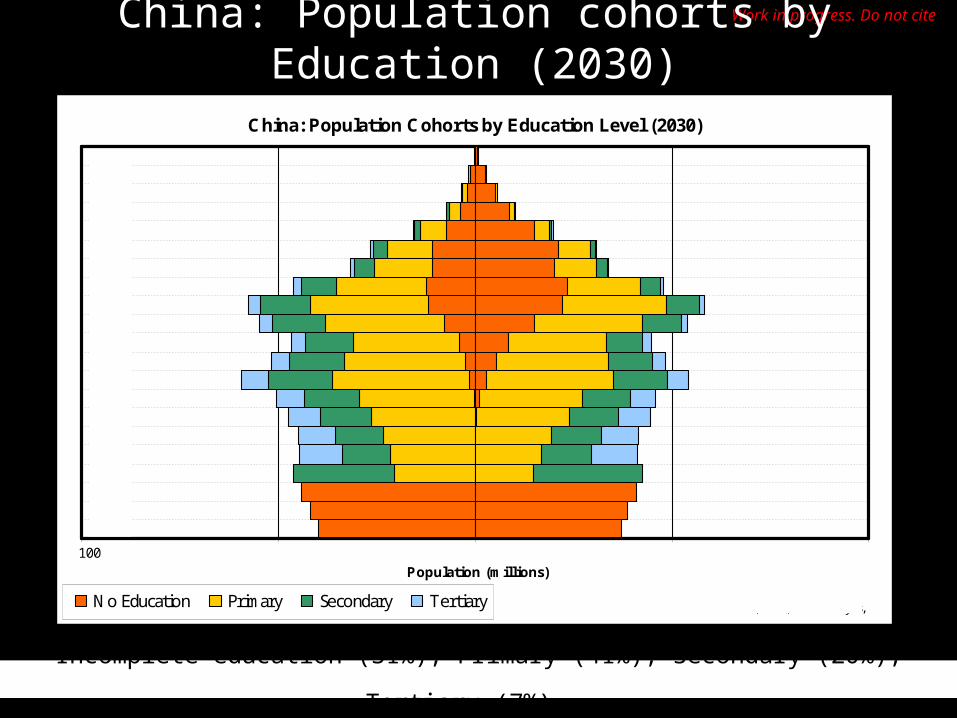
Work in progress. Do not citeChina: Population cohorts by Education (2030)
Incomplete education (31%); Primary (41%), Secondary (20%); Tertiary (7%).
China: Population Cohorts by Education Level (2030)
-100 -50 0 50 100Population (millions)
No Education Primary Secondary Tertiary
100 50 50 100MALE FEMALE
Source: IFs 5.34, 2007; TARU analysis,
0-4
5-9
10-1415-19
20-24
25-29
30-34
35-39
40-4445-49
50-54
55-59
60-64
65-69
70-74
75-79
80-84
84-89
90-9495-99
>100

Work in progress. Do not citeChina: Population cohorts by Education (2035)
Incomplete education (29%); Primary (41%), Secondary (21%); Tertiary (9%).
China: Population Cohorts by Education Level (2035)
-100 -50 0 50 100Population (millions)
No Education Primary Secondary Tertiary
100 50 50 100MALE FEMALE
Source: IFs 5.34, 2007; TARU analysis,
0-4
5-9
10-1415-19
20-24
25-29
30-34
35-39
40-4445-49
50-54
55-59
60-64
65-69
70-74
75-79
80-84
84-89
90-9495-99
>100

Work in progress. Do not citeChina: Population cohorts by Education (2040)
Incomplete education (27%); Primary (41%), Secondary (22%); Tertiary
(11%).
China: Population Cohorts by Education Level (2040)
-100 -50 0 50 100Population (millions)
No Education Primary Secondary Tertiary
100 50 50 100MALE FEMALE
Source: IFs 5.34, 2007; TARU analysis,
0-4
5-9
10-1415-19
20-24
25-29
30-34
35-39
40-4445-49
50-54
55-59
60-64
65-69
70-74
75-79
80-84
84-89
90-9495-99
>100

Work in progress. Do not citeChina: Population cohorts by Education (2045)
Incomplete education (25%); Primary (40%), Secondary (23%); Tertiary
(12%).
China: Population Cohorts by Education Level (2045)
-100 -50 0 50 100Population (millions)
No Education Primary Secondary Tertiary
100 50 50 100MALE FEMALE
Source: IFs 5.34, 2007; TARU analysis,
0-4
5-9
10-1415-19
20-24
25-29
30-34
35-39
40-4445-49
50-54
55-59
60-64
65-69
70-74
75-79
80-84
84-89
90-9495-99
>100

Work in progress. Do not citeChina: Population cohorts by Education (2050)
Incomplete education (23%); Primary (39%), Secondary (24%); Tertiary
(14%).
China: Population Cohorts by Education Level (2050)
-100 -50 0 50 100Population (millions)
No Education Primary Secondary Tertiary
100 50 50 100MALE FEMALE
Source: IFs 5.34, 2007; TARU analysis,
0-4
5-9
10-1415-19
20-24
25-29
30-34
35-39
40-4445-49
50-54
55-59
60-64
65-69
70-74
75-79
80-84
84-89
90-9495-99
>100

Work in progress. Do not citeChina: Population cohorts by Education (2055)
Incomplete education (21%); Primary (38%), Secondary (24%); Tertiary
(16%).
China: Population Cohorts by Education Level (2055)
-100 -50 0 50 100Population (millions)
No Education Primary Secondary Tertiary
10 50 50 10MALE FEMALE
Source: IFs 5.34, 2007; TARU analysis,
0-4
5-9
10-1415-19
20-24
25-29
30-34
35-39
40-4445-49
50-54
55-59
60-64
65-69
70-74
75-79
80-84
84-89
90-9495-99
>100

Work in progress. Do not citeChina: Population cohorts by Education (2060)
Incomplete education (19%); Primary (38%), Secondary (25%); Tertiary
(18%).
China: Population Cohorts by Education Level (2060)
-100 -50 0 50 100Population (millions)
No Education Primary Secondary Tertiary
100 50 50 100MALE FEMALE
Source: IFs 5.34, 2007; TARU analysis,
0-4
5-9
10-1415-19
20-24
25-29
30-34
35-39
40-4445-49
50-54
55-59
60-64
65-69
70-74
75-79
80-84
84-89
90-9495-99
>100

Work in progress. Do not citeChina: Population cohorts by Education (2065)
Incomplete education (18%); Primary (36%), Secondary (25%); Tertiary
(20%).
China: Population Cohorts by Education Level (2065)
-100 -50 0 50 100Population (millions)
No Education Primary Secondary Tertiary
100 50 50 100MALE FEMALE
Source: IFs 5.34, 2007; TARU analysis,
0-4
5-9
10-1415-19
20-24
25-29
30-34
35-39
40-4445-49
50-54
55-59
60-64
65-69
70-74
75-79
80-84
84-89
90-9495-99
>100
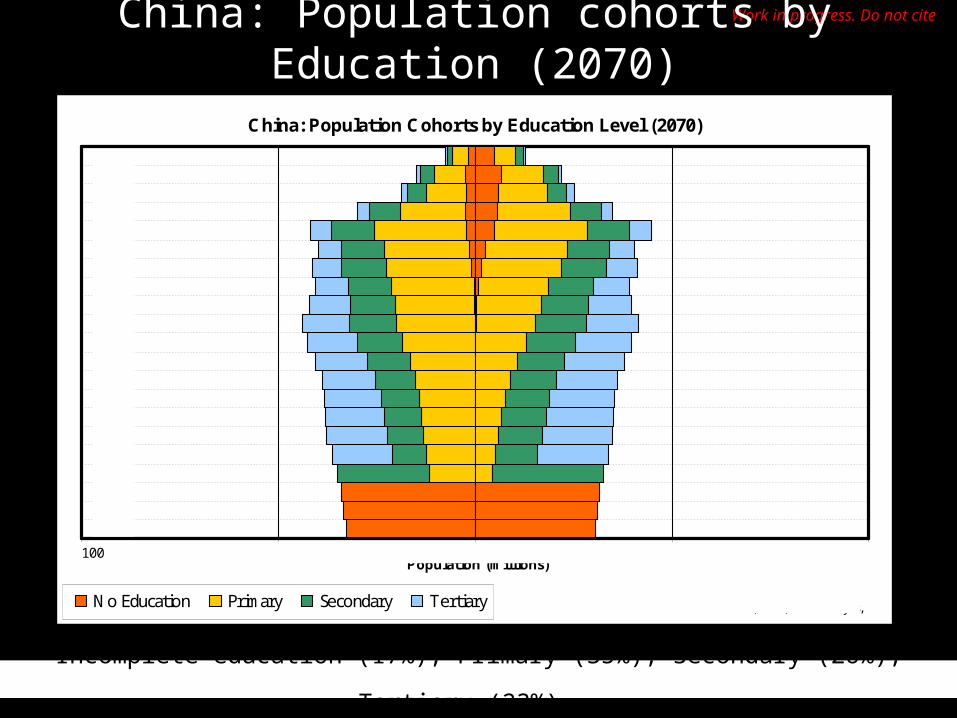
Work in progress. Do not citeChina: Population cohorts by Education (2070)
Incomplete education (17%); Primary (35%), Secondary (26%); Tertiary
(23%).
China: Population Cohorts by Education Level (2070)
-100 -50 0 50 100Population (millions)
No Education Primary Secondary Tertiary
100 50 50 100MALE FEMALE
Source: IFs 5.34, 2007; TARU analysis,
0-4
5-9
10-1415-19
20-24
25-29
30-34
35-39
40-4445-49
50-54
55-59
60-64
65-69
70-74
75-79
80-84
84-89
90-9495-99
>100

Work in progress. Do not citeChina: Population cohorts by Education (2075)
Incomplete education (16%); Primary (33%), Secondary (26%); Tertiary
(25%).
China: Population Cohorts by Education Level (2075)
-100 -50 0 50 100Population (millions)
No Education Primary Secondary Tertiary
100 50 50 100MALE FEMALE
Source: IFs 5.34, 2007; TARU analysis,
0-4
5-9
10-1415-19
20-24
25-29
30-34
35-39
40-4445-49
50-54
55-59
60-64
65-69
70-74
75-79
80-84
84-89
90-9495-99
>100

Work in progress. Do not citeChina: Population cohorts by Education (2080)
Incomplete education (15%); Primary (32%), Secondary (26%); Tertiary
(27%).
China: Population Cohorts by Education Level (2080)
-100 -50 0 50 100Population (millions)
No Education Primary Secondary Tertiary
100 50 50 100MALE FEMALE
Source: IFs 5.34, 2007; TARU analysis,
0-4
5-9
10-1415-19
20-24
25-29
30-34
35-39
40-4445-49
50-54
55-59
60-64
65-69
70-74
75-79
80-84
84-89
90-9495-99
>100

Work in progress. Do not citeChina: Population cohorts by Education (2085)
Incomplete education (15%); Primary (30%), Secondary (26%); Tertiary
(29%).
China: Population Cohorts by Education Level (2085)
-100 -50 0 50 100Population (millions)
No Education Primary Secondary Tertiary
100 50 50 100MALE FEMALE
Source: IFs 5.34, 2007; TARU analysis,
0-4
5-9
10-1415-19
20-24
25-29
30-34
35-39
40-4445-49
50-54
55-59
60-64
65-69
70-74
75-79
80-84
84-89
90-9495-99
>100

Work in progress. Do not citeChina: Population cohorts by Education (2090)
Incomplete education (14%); Primary (28%), Secondary (26%); Tertiary
(32%).
China: Population Cohorts by Education Level (2090)
-100 -50 0 50 100Population (millions)
No Education Primary Secondary Tertiary
100 50 50 100MALE FEMALE
Source: IFs 5.34, 2007; TARU analysis,
0-4
5-9
10-1415-19
20-24
25-29
30-34
35-39
40-4445-49
50-54
55-59
60-64
65-69
70-74
75-79
80-84
84-89
90-9495-99
>100

Work in progress. Do not citeChina: Population cohorts by Education (2095)
Incomplete education (14%); Primary (27%), Secondary (26%); Tertiary
(34%).
China: Population Cohorts by Education Level (2095)
-100 -50 0 50 100Population (millions)
No Education Primary Secondary Tertiary
100 50 50 100MALE FEMALE
Source: IFs 5.34, 2007; TARU analysis,
0-4
5-9
10-1415-19
20-24
25-29
30-34
35-39
40-4445-49
50-54
55-59
60-64
65-69
70-74
75-79
80-84
84-89
90-9495-99
>100

Work in progress. Do not citeChina: Population cohorts by Education (2100)
Incomplete education (14%); Primary (25%), Secondary (25%); Tertiary
(36%).
China: Population Cohorts by Education Level (2100)
-100 -50 0 50 100Population (millions)
No Education Primary Secondary Tertiary
100 50 50 100MALE FEMALE
Source: IFs 5.34, 2007; TARU analysis,
0-4
5-9
10-1415-19
20-24
25-29
30-34
35-39
40-4445-49
50-54
55-59
60-64
65-69
70-74
75-79
80-84
84-89
90-9495-99
>100

Work in progress. Do not citeChina Population trajectories by Educational status
Massive growth in tertiary education, overtakes secondary in ~2075 and
primary in ~2085
China: Population by Educational Status (2000-2100)
-
100
200
300
400
500
600
700
800
2000 2005 2010 2015 2020 2025 2030 2035 2040 2045 2050 2055 2060 2065 2070 2075 2080 2085 2090 2095 2100Years
Pop
ulat
ion
(mill
ions
)
Incomplete Primary Secondary Tertiary Source: IFs 5.34, 2007, TARU analysis, 2007

Work in progress. Do not cite
China Population-Education Trends (2000 – 2100)
1. China’s population is expected to peak c. 2050 at about 1.5 billion2. The population in the working ages peaks c. 2020 and child
population declines3. The greying of China will be a significant challenge by mid-
century, especially in maintaining growth, social security and health care systems.
4. Health care and education will continue to be growth businesses in China, as possibly be edutainment and travel
5. China will continue to have a large population (~ 600 million) of increasing age with only primary education. Productive economic activity and social security for this population will be a critical challenge.
6. China could become an important knowledge power before 2025, enabled by massive growth in tertiary education, S&T and R&D investment
7. Global corporations will be important to leveraging on the potential of a Tertiary sector population of 200 to 400 million.
8. Collaboration with India, the EU and the US could be important to this, as will be a world-class education system

Work in progress. Do not cite
India Demographic & Educational Trends
in an IFs world (2000-2100)

Work in progress. Do not citeIndia: Population cohorts by Education (2000)
Incomplete education (74%); Primary (18%), Secondary (6%); Tertiary (1%).
India: Population Cohorts by Education Level (2000)
-100 -50 0 50 100Population (millions)
No Education Primary Secondary Tertiary
100 50 50 100MALE FEMALE
Source: IFs 5.34, 2007; TARU analysis,
0-4
5-9
10-1415-19
20-24
25-29
30-34
35-39
40-4445-49
50-54
55-59
60-64
65-69
70-74
75-79
80-84
84-89
90-9495-99
>100

Work in progress. Do not citeIndia: Population cohorts by Education (2005)
Incomplete education (69%); Primary (22%), Secondary (7%); Tertiary (2%).
India: Population Cohorts by Education Level (2005)
-100 -50 0 50 100Population (millions)
No Education Primary Secondary Tertiary
100 50 50 100MALE FEMALE
Source: IFs 5.34, 2007; TARU analysis,
0-4
5-9
10-1415-19
20-24
25-29
30-34
35-39
40-4445-49
50-54
55-59
60-64
65-69
70-74
75-79
80-84
84-89
90-9495-99
>100

Work in progress. Do not citeIndia: Population cohorts by Education (2010)
Incomplete education (64%); Primary (25%), Secondary (8%); Tertiary (3%).
India: Population Cohorts by Education Level (2010)
-100 -50 0 50 100Population (millions)
No Education Primary Secondary Tertiary
100 50 50 100MALE FEMALE
Source: IFs 5.34, 2007; TARU analysis,
0-4
5-9
10-1415-19
20-24
25-29
30-34
35-39
40-4445-49
50-54
55-59
60-64
65-69
70-74
75-79
80-84
84-89
90-9495-99
>100

Work in progress. Do not citeIndia: Population cohorts by Education (2015)
Incomplete education (59%); Primary (28%), Secondary (9%); Tertiary (4%).
India: Population Cohorts by Education Level (2015)
-100 -50 0 50 100Population (millions)
No Education Primary Secondary Tertiary
100 50 50 100MALE FEMALE
Source: IFs 5.34, 2007; TARU analysis,
0-4
5-9
10-1415-19
20-24
25-29
30-34
35-39
40-4445-49
50-54
55-59
60-64
65-69
70-74
75-79
80-84
84-89
90-9495-99
>100

Work in progress. Do not citeIndia: Population cohorts by Education (2020)
Incomplete education (55%); Primary (30%), Secondary (10%); Tertiary (5%).
India: Population Cohorts by Education Level (2020)
-100 -50 0 50 100Population (millions)
No Education Primary Secondary Tertiary
100 50 50 100MALE FEMALE
Source: IFs 5.34, 2007; TARU analysis,
0-4
5-9
10-1415-19
20-24
25-29
30-34
35-39
40-4445-49
50-54
55-59
60-64
65-69
70-74
75-79
80-84
84-89
90-9495-99
>100
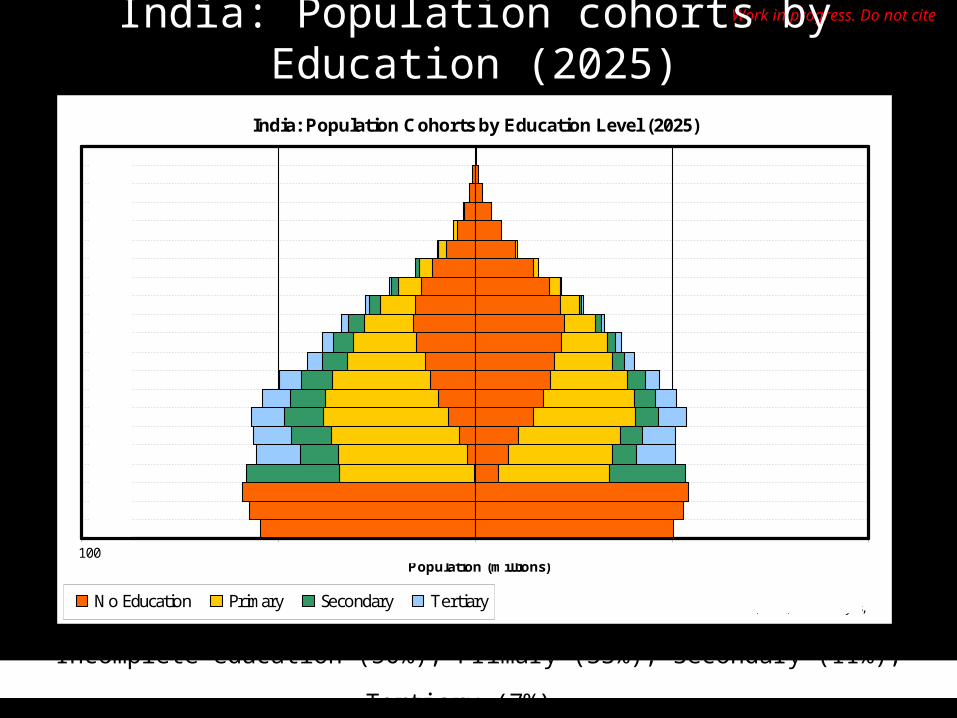
Work in progress. Do not citeIndia: Population cohorts by Education (2025)
Incomplete education (50%); Primary (33%), Secondary (11%); Tertiary (7%).
India: Population Cohorts by Education Level (2025)
-100 -50 0 50 100Population (millions)
No Education Primary Secondary Tertiary
100 50 50 100MALE FEMALE
Source: IFs 5.34, 2007; TARU analysis,
0-4
5-9
10-1415-19
20-24
25-29
30-34
35-39
40-4445-49
50-54
55-59
60-64
65-69
70-74
75-79
80-84
84-89
90-9495-99
>100
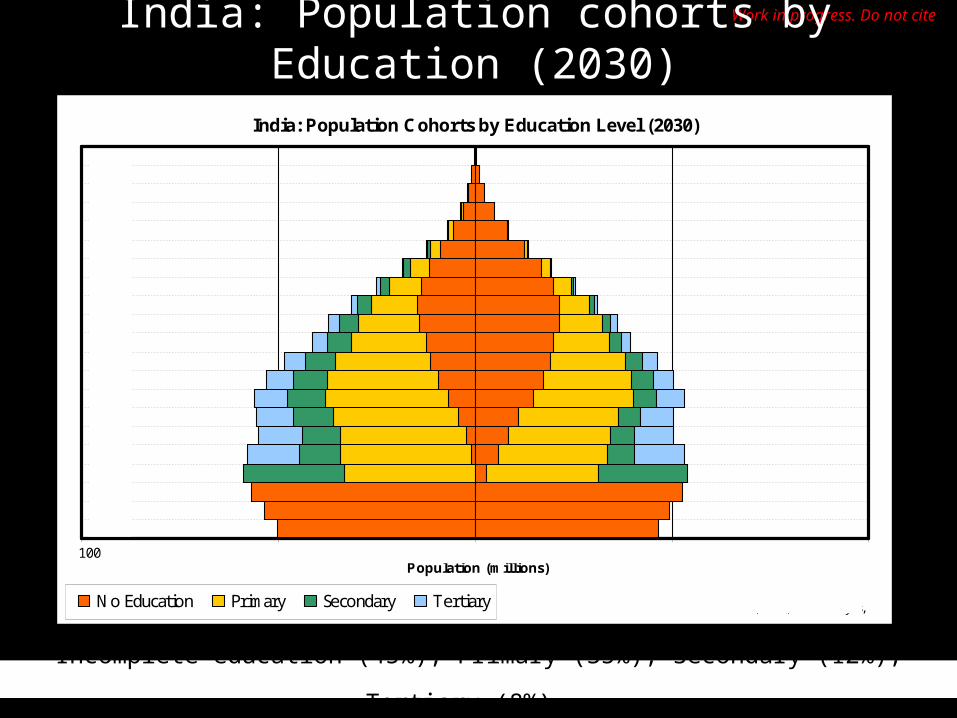
Work in progress. Do not citeIndia: Population cohorts by Education (2030)
Incomplete education (45%); Primary (35%), Secondary (12%); Tertiary (8%).
India: Population Cohorts by Education Level (2030)
-100 -50 0 50 100Population (millions)
No Education Primary Secondary Tertiary
100 50 50 100MALE FEMALE
Source: IFs 5.34, 2007; TARU analysis,
0-4
5-9
10-1415-19
20-24
25-29
30-34
35-39
40-4445-49
50-54
55-59
60-64
65-69
70-74
75-79
80-84
84-89
90-9495-99
>100

Work in progress. Do not citeIndia: Population cohorts by Education (2035)
Incomplete education (41%); Primary (37%), Secondary (13%); Tertiary
(10%).
India: Population Cohorts by Education Level (2035)
-100 -50 0 50 100Population (millions)
No Education Primary Secondary Tertiary
100 50 50 100MALE FEMALE
Source: IFs 5.34, 2007; TARU analysis,
0-4
5-9
10-1415-19
20-24
25-29
30-34
35-39
40-4445-49
50-54
55-59
60-64
65-69
70-74
75-79
80-84
84-89
90-9495-99
>100

Work in progress. Do not citeIndia: Population cohorts by Education (2040)
Incomplete education (37%); Primary (38%), Secondary (13%); Tertiary
(12%).
India: Population Cohorts by Education Level (2040)
-100 -50 0 50 100Population (millions)
No Education Primary Secondary Tertiary
100 50 50 100MALE FEMALE
Source: IFs 5.34, 2007; TARU analysis,
0-4
5-9
10-1415-19
20-24
25-29
30-34
35-39
40-4445-49
50-54
55-59
60-64
65-69
70-74
75-79
80-84
84-89
90-9495-99
>100

Work in progress. Do not citeIndia: Population cohorts by Education (2045)
Incomplete education (34%); Primary (38%), Secondary (14%); Tertiary
(13%).
India: Population Cohorts by Education Level (2045)
-100 -50 0 50 100Population (millions)
No Education Primary Secondary Tertiary
100 50 50 100MALE FEMALE
Source: IFs 5.34, 2007; TARU analysis,
0-4
5-9
10-1415-19
20-24
25-29
30-34
35-39
40-4445-49
50-54
55-59
60-64
65-69
70-74
75-79
80-84
84-89
90-9495-99
>100

Work in progress. Do not citeIndia: Population cohorts by Education (2050)
Incomplete education (31%); Primary (38%), Secondary (15%); Tertiary
(15%).
India: Population Cohorts by Education Level (2050)
-100 -50 0 50 100Population (millions)
No Education Primary Secondary Tertiary
100 50 50 100MALE FEMALE
Source: IFs 5.34, 2007; TARU analysis,
0-4
5-9
10-1415-19
20-24
25-29
30-34
35-39
40-4445-49
50-54
55-59
60-64
65-69
70-74
75-79
80-84
84-89
90-9495-99
>100

Work in progress. Do not citeIndia: Population cohorts by Education (2055)
Incomplete education (29%); Primary (38%), Secondary (16%); Tertiary
(17%).
India: Population Cohorts by Education Level (2055)
-100 -50 0 50 100Population (millions)
No Education Primary Secondary Tertiary
100 50 50 100MALE FEMALE
Source: IFs 5.34, 2007; TARU analysis,
0-4
5-9
10-1415-19
20-24
25-29
30-34
35-39
40-4445-49
50-54
55-59
60-64
65-69
70-74
75-79
80-84
84-89
90-9495-99
>100
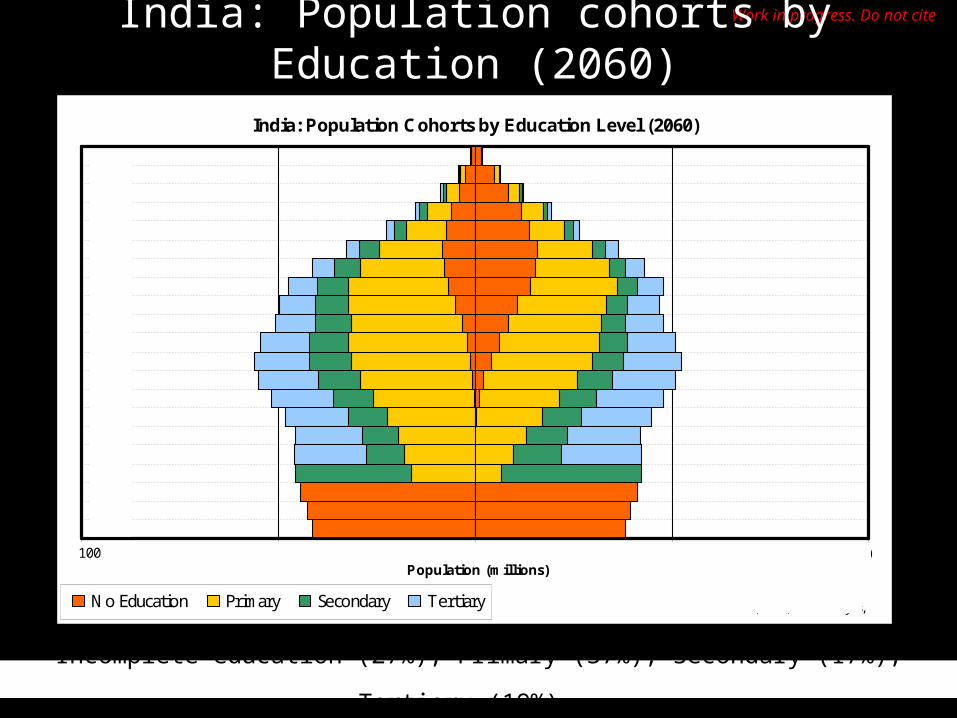
Work in progress. Do not citeIndia: Population cohorts by Education (2060)
Incomplete education (27%); Primary (37%), Secondary (17%); Tertiary
(19%).
India: Population Cohorts by Education Level (2060)
-100 -50 0 50 100Population (millions)
No Education Primary Secondary Tertiary
100 50 50 100MALE FEMALE
Source: IFs 5.34, 2007; TARU analysis,
0-4
5-9
10-1415-19
20-24
25-29
30-34
35-39
40-4445-49
50-54
55-59
60-64
65-69
70-74
75-79
80-84
84-89
90-9495-99
>100

Work in progress. Do not citeIndia: Population cohorts by Education (2065)
Incomplete education (24%); Primary (36%), Secondary (18%); Tertiary
(21%).
India: Population Cohorts by Education Level (2065)
-100 -50 0 50 100Population (millions)
No Education Primary Secondary Tertiary
100 50 50 100MALE FEMALE
Source: IFs 5.34, 2007; TARU analysis,
0-4
5-9
10-1415-19
20-24
25-29
30-34
35-39
40-4445-49
50-54
55-59
60-64
65-69
70-74
75-79
80-84
84-89
90-9495-99
>100

Work in progress. Do not citeIndia: Population cohorts by Education (2070)
Incomplete education (23%); Primary (35%), Secondary (19%); Tertiary
(23%).
India: Population Cohorts by Education Level (2070)
-100 -50 0 50 100Population (millions)
No Education Primary Secondary Tertiary
100 50 50 100MALE FEMALE
Source: IFs 5.34, 2007; TARU analysis,
0-4
5-9
10-1415-19
20-24
25-29
30-34
35-39
40-4445-49
50-54
55-59
60-64
65-69
70-74
75-79
80-84
84-89
90-9495-99
>100

Work in progress. Do not citeIndia: Population cohorts by Education (2075)
Incomplete education (21%); Primary (34%), Secondary (20%); Tertiary
(25%).
India: Population Cohorts by Education Level (2075)
-100 -50 0 50 100Population (millions)
No Education Primary Secondary Tertiary
100 50 50 100MALE FEMALE
Source: IFs 5.34, 2007; TARU analysis,
0-4
5-9
10-1415-19
20-24
25-29
30-34
35-39
40-4445-49
50-54
55-59
60-64
65-69
70-74
75-79
80-84
84-89
90-9495-99
>100

Work in progress. Do not citeIndia: Population cohorts by Education (2080)
Incomplete education (20%); Primary (32%), Secondary (21%); Tertiary
(27%).
India: Population Cohorts by Education Level (2080)
-100 -50 0 50 100Population (millions)
No Education Primary Secondary Tertiary
100 50 50 100MALE FEMALE
Source: IFs 5.34, 2007; TARU analysis,
0-4
5-9
10-1415-19
20-24
25-29
30-34
35-39
40-4445-49
50-54
55-59
60-64
65-69
70-74
75-79
80-84
84-89
90-9495-99
>100

Work in progress. Do not citeIndia: Population cohorts by Education (2085)
Incomplete education (18%); Primary (30%), Secondary (22%); Tertiary
(29%).
India: Population Cohorts by Education Level (2085)
-100 -50 0 50 100Population (millions)
No Education Primary Secondary Tertiary
100 50 50 100MALE FEMALE
Source: IFs 5.34, 2007; TARU analysis,
0-4
5-9
10-1415-19
20-24
25-29
30-34
35-39
40-4445-49
50-54
55-59
60-64
65-69
70-74
75-79
80-84
84-89
90-9495-99
>100

Work in progress. Do not citeIndia: Population cohorts by Education (2090)
Incomplete education (17%); Primary (28%), Secondary (23%); Tertiary
(32%).
India: Population Cohorts by Education Level (2090)
-100 -50 0 50 100Population (millions)
No Education Primary Secondary Tertiary
100 50 50 100MALE FEMALE
Source: IFs 5.34, 2007; TARU analysis,
0-4
5-9
10-1415-19
20-24
25-29
30-34
35-39
40-4445-49
50-54
55-59
60-64
65-69
70-74
75-79
80-84
84-89
90-9495-99
>100
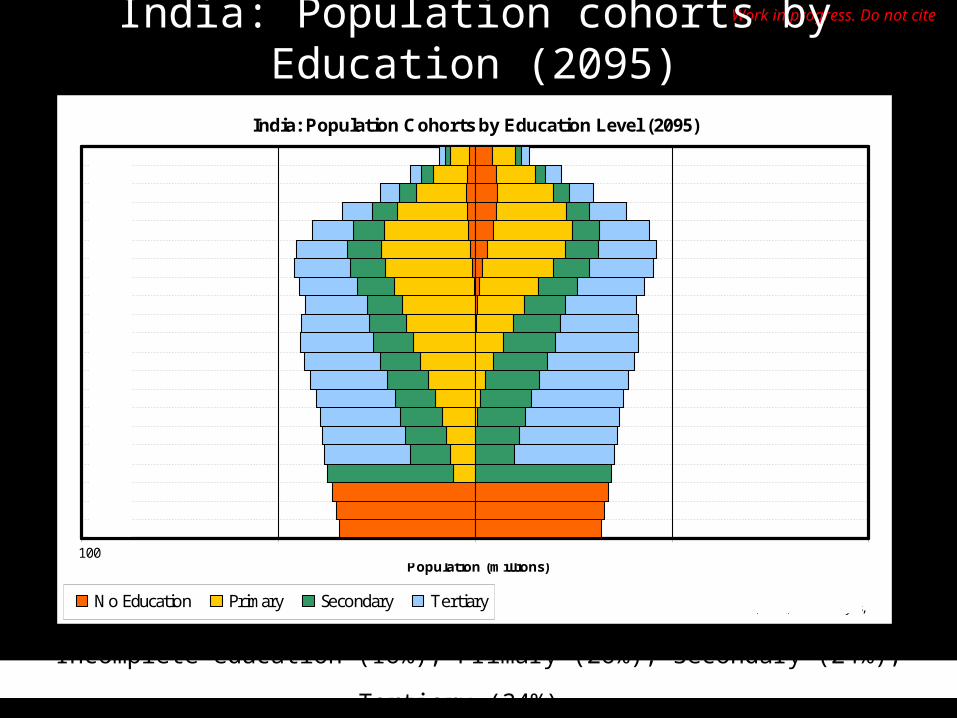
Work in progress. Do not citeIndia: Population cohorts by Education (2095)
Incomplete education (16%); Primary (26%), Secondary (24%); Tertiary
(34%).
India: Population Cohorts by Education Level (2095)
-100 -50 0 50 100Population (millions)
No Education Primary Secondary Tertiary
100 50 50 100MALE FEMALE
Source: IFs 5.34, 2007; TARU analysis,
0-4
5-9
10-1415-19
20-24
25-29
30-34
35-39
40-4445-49
50-54
55-59
60-64
65-69
70-74
75-79
80-84
84-89
90-9495-99
>100
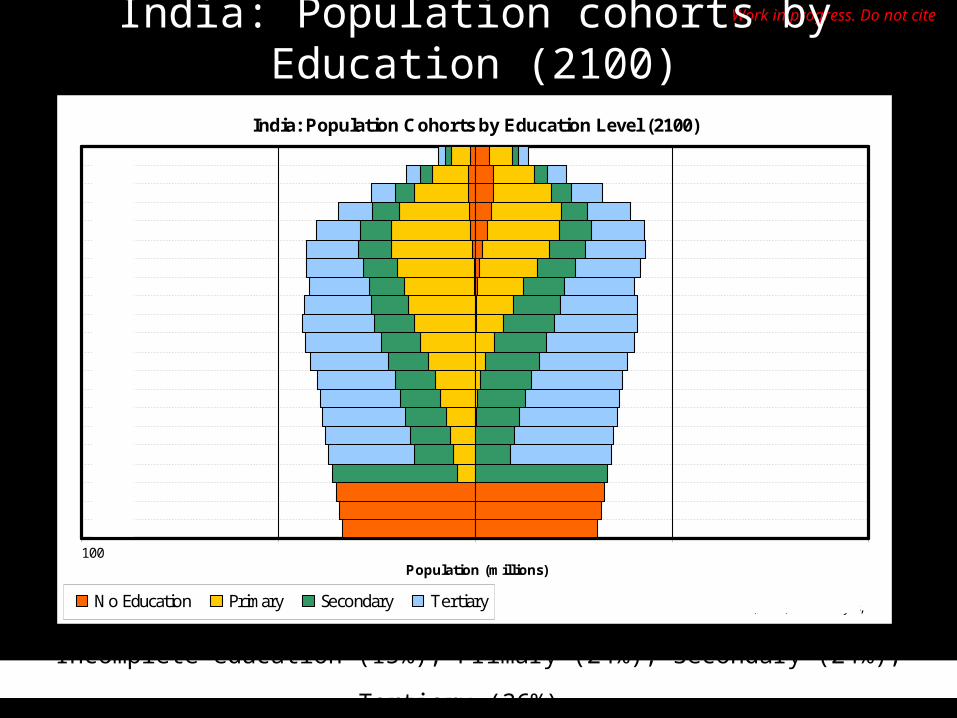
Work in progress. Do not citeIndia: Population cohorts by Education (2100)
Incomplete education (15%); Primary (24%), Secondary (24%); Tertiary
(36%).
India: Population Cohorts by Education Level (2100)
-100 -50 0 50 100Population (millions)
No Education Primary Secondary Tertiary
100 50 50 100MALE FEMALE
Source: IFs 5.34, 2007; TARU analysis,
0-4
5-9
10-1415-19
20-24
25-29
30-34
35-39
40-4445-49
50-54
55-59
60-64
65-69
70-74
75-79
80-84
84-89
90-9495-99
>100

Work in progress. Do not citeIndia: Population trajectories by Educational status
Three educational transitions: c. 2040, c. 2050 and 2085
India: Population by Educational Status (2000-2100)
-
100
200
300
400
500
600
700
800
900
2000 2005 2010 2015 2020 2025 2030 2035 2040 2045 2050 2055 2060 2065 2070 2075 2080 2085 2090 2095 2100Years
Popu
lation
(mill
ions
)
Incomplete Primary Secondary Tertiary

Work in progress. Do not cite
India Population-Education Trends (2000 – 2100) I
1. India’s population peaks at between 1.6 billion+ between 2055 and 2070
2. The ‘demographic dividend’ is reaped by mid-century, with the largest potential national working population of over 800 million
3. But India could by then also have over 500 million people over the age of 65. Posing a serious challenge to future welfare and health care policy. Social and family structure could be a major question
4. At 2100, ~ 25% of the population could have a primary, 25% a secondary school and over a third a tertiary education.
5. This may lead to the further ‘trifurcation’ of the economy with increasing wage differentials based on educational status
6. India becomes a significant knowledge power, early in the century, crossing the US college educated population of 100 million in 2025.
7. Health and education will be growth businesses in India over the century, both to address domestic and global markets

Work in progress. Do not cite
India Population-Education Trends (2000 – 2100) II
India will be faced with multiple challenges:•Accelerating school and tertiary education•Enabling the development of livelihoods that use a mix of
traditional knowledge and primary education in increasing uncertainty and competitive primary and household manufacturing markets
•Enabling the growth of labour intensive manufacturing employment located in rural and small urban centres– implying the rapid expansion of competitive energy, transportation and communication infrastructure
•Enabling the penetration of the knowledge economy into the Secondary and Primary sectors and outside megacities and metropolitan centres
•Building cities for over 500 million people•Developing and scaling world-class quality knowledge institutions
by 2015•Addressing the challenge of a ‘lost generation’ of less educated
aged citizens
Work in progress. Do not cite
Exploring Global Economic Power
in an IFs World (2000-2100)

Work in progress. Do not cite
IFs: Base Case Economic Growth Trends for Major Economic Powers (2000-2100)
India, China & Japan had the largest urban populations in the world till the early 19th century
The US and EU continue as major powers till the 2030s, after which China will typically lead for up to 50 years, while India comes up from
behind
IFs Base Case: National/Regional GDP at PPP (at 1995 constant USD)
-
20,000
40,000
60,000
80,000
100,000
120,000
2000 2010 2020 2030 2040 2050 2060 2070 2080 2090 2100Years
GD
P (Bill
ion
$)
India China USA EU25 Japan Russia Brazil
China-EU China-US India-EU India-US India-China

Work in progress. Do not citeIFs Base Case scenario: Six Transitions in Economic
Power
India, China & Japan had the largest urban populations in the world till the early 19th century
Six transitions in economic power: EU-US-China-India
IFs Base Case: National Share of Global Economic Output
(% to total at PPP at 1995 constant $ prices)
0%
5%
10%
15%
20%
25%
2000 2010 2020 2030 2040 2050 2060 2070 2080 2090 2100Years
Sha
re o
f Glo
bal O
utpu
t (%
)
India China USA EU25 Russia Japan Brazil
India-Japan China-EU China-US India-EU India-US India-China
Hughes, IFs 5.34, 2007, Revi analysis, 2007

Work in progress. Do not citeIFs Markets First scenario: Six Transitions in Economic
Power
India, China & Japan had the largest urban populations in the world till the early 19th century
Markets First favours India, with earlier (5 to 10 year) Transitions

Work in progress. Do not citeIFs Security First scenario : Two Transitions in Economic
Power
India, China & Japan had the largest urban populations in the world till the early 19th century
Security First creates a divided world with continuing US hegemony. Chinese economic power declines by 2060

Work in progress. Do not citeIFs Sustainability scenario : Six Transitions in Economic
Power
India, China & Japan had the largest urban populations in the world till the early 19th century
Sustainability favours China, forcing an earlier US-China transition. The China-India transition is delayed to end-century
Work in progress. Do not cite
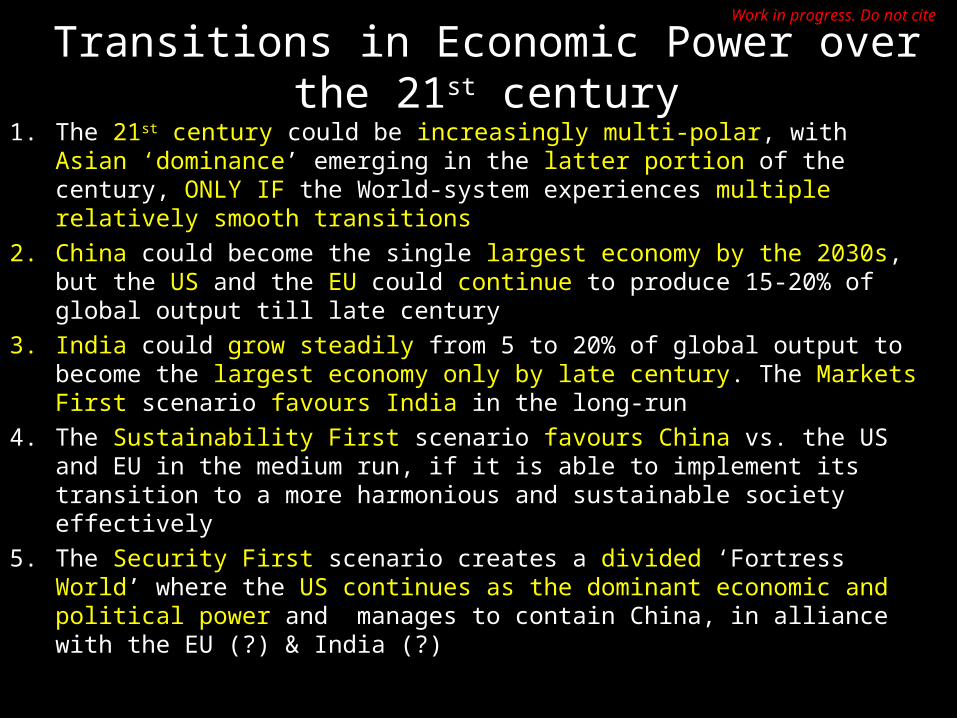
Transitions in Economic Power over the 21st century
1. The 21st century could be increasingly multi-polar, with Asian ‘dominance’ emerging in the latter portion of the century, ONLY IF the World-system experiences multiple relatively smooth transitions
2. China could become the single largest economy by the 2030s, but the US and the EU could continue to produce 15-20% of global output till late century
3. India could grow steadily from 5 to 20% of global output to become the largest economy only by late century. The Markets First scenario favours India in the long-run
4. The Sustainability First scenario favours China vs. the US and EU in the medium run, if it is able to implement its transition to a more harmonious and sustainable society effectively
5. The Security First scenario creates a divided ‘Fortress World’ where the US continues as the dominant economic and political power and manages to contain China, in alliance with the EU (?) & India (?)

Work in progress. Do not cite
Exploring Global ‘Hard’ Powerin an IFs World (2000-2100)

Work in progress. Do not cite
IFs: Base Case Transitions in Hard Power (2000-2100)
India, China & Japan had the largest urban populations in the world till the early 19th century
Hard power transitions typically take place well after Economic power transitions take place, e.g. the 2060s between US & China. The 2070s
onwards are a potential period of struggle.
IFs Base case:Transitions in National 'Hard' Power (2000-2100)
0
5
10
15
20
25
30
2000 2010 2020 2030 2040 2050 2060 2070 2080 2090 2100Years
Rel
ativ
e Pow
er In
dex
USA EU 25 Russia China India Brazil JapanHughes IFs 5.34, 2007, Revi analysis, 2007
China-EU China-USIndia-EU Potential Time
of Troubles?
Work in progress. Do not cite
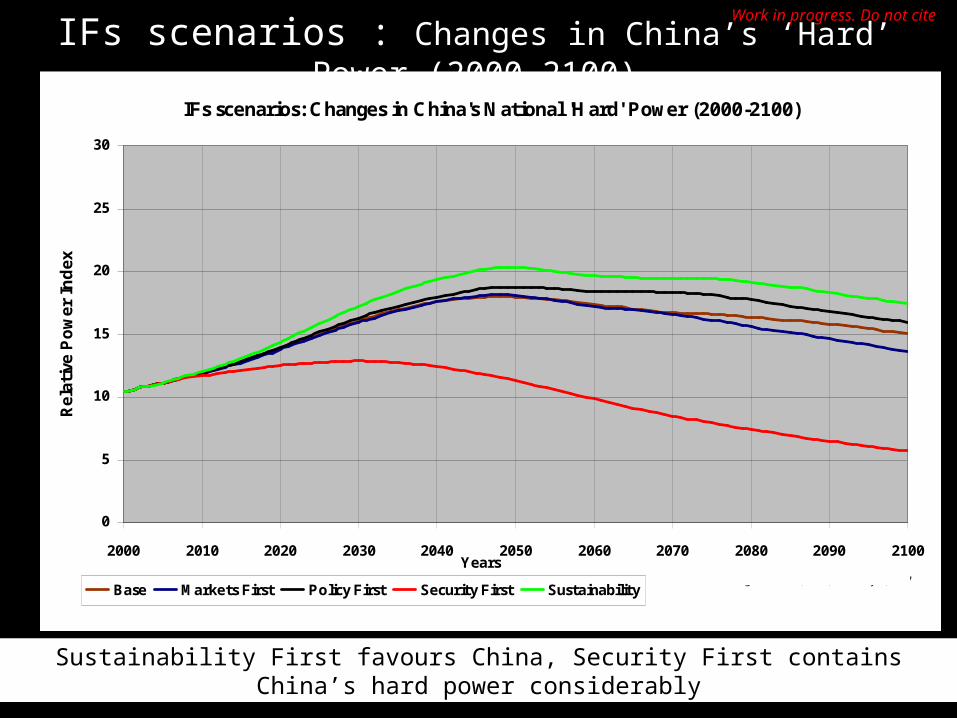
IFs scenarios : Changes in China’s ‘Hard’ Power (2000-2100)
India, China & Japan had the largest urban populations in the world till the early 19th century
Sustainability First favours China, Security First contains China’s hard power considerably
IFs scenarios: Changes in China's National 'Hard' Power (2000-2100)
0
5
10
15
20
25
30
2000 2010 2020 2030 2040 2050 2060 2070 2080 2090 2100Years
Rel
ativ
e Pow
er Index
Base Markets First Policy First Security First SustainabilityHughes IFs 5.34, 2007, Revi analysis, 2007

Work in progress. Do not cite
IFs scenarios : Changes in India’s ‘Hard’ Power (2000-2100)
India, China & Japan had the largest urban populations in the world till the early 19th century
All scenarios including Markets First favour growth of Indian hard power. Security First constrains a potential India hard power
buildup
IFs scenarios: Changes in India's National 'Hard' Power (2000-2100)
0
5
10
15
20
25
30
2000 2010 2020 2030 2040 2050 2060 2070 2080 2090 2100Years
Rel
ativ
e Pow
er In
dex
Base Markets First Policy First Security First SustainabilityHughes IFs 5.34, 2007, Revi analysis, 2007

Work in progress. Do not cite
IFs scenarios : Changes in USA’s ‘Hard’ Power (2000-2100)
India, China & Japan had the largest urban populations in the world till the early 19th century
USA’s hard power declines steadily over the century. The Security First scenario helps stem the tide for a while, while Sustainability First
leads to the fastest decline.
IFs scenarios: Changes in USA's National 'Hard' Power (2000-2100)
0
5
10
15
20
25
30
2000 2010 2020 2030 2040 2050 2060 2070 2080 2090 2100Years
Rel
ativ
e Pow
er In
dex
Base Markets First Policy First Security First Sustainability
Hughes IFs 3.54, 2007, Revi analysis, 2007

Work in progress. Do not cite
IFs Security First scenario : Transitions in ‘Hard’ Power
India, China & Japan had the largest urban populations in the world till the early 19th century
Security First creates a divided world with continuing US hegemony. Chinese economic power declines by 2060
IFs Security First scenario:Transitions in 'Hard' Power (2000-2100)
0
5
10
15
20
25
30
2000 2010 2020 2030 2040 2050 2060 2070 2080 2090 2100Years
Rel
ativ
e Pow
er In
dex
USA Russia China India Japan BrazilHughes IFs 5.34, 2007, Revi analysis, 2007
Potential Time of
Regional Struggle?

Work in progress. Do not cite
IFs Base case : Nuclear warheads with major Powers
India, China & Japan had the largest urban populations in the world till the early 19th century
Sharp decline in US & Russian arsenals, matched by Chinese arsenal by the 2030s. India seeks to maintain minimum strategic deterrence
over the rest of the century
IFs Base case: Nuclear Warheads with major Powers (2000-2100)
-
1,000
2,000
3,000
4,000
5,000
6,000
2000 2010 2020 2030 2040 2050 2060 2070 2080 2090 2100Years
Num
ber
of N
ucl
ear
war
hea
ds
USA EU 25 Russia China India
Period of Potential
conflict?
Hughes, IFs 5.34, 2007; Revi analysis, 2007

Work in progress. Do not cite
Changes in Soft Power in a Networked IFs World (2000-
2100)

Work in progress. Do not cite
IFs Base case: Changes in National Soft Power Potential
India, China & Japan had the largest urban populations in the world till the early 19th century
IFs Base Case: Electronically Networked Global Population (2000-2100) and National shares (% to total)
0%
5%
10%
15%
20%
25%
30%
35%
2000 2010 2020 2030 2040 2050 2060 2070 2080 2090 2100
Years
Pro
po
rtio
n N
etw
ork
ed
po
pu
lati
on
(%
)
0
1,000
2,000
3,000
4,000
5,000
6,000
7,000
To
tal N
etw
ork
ed P
op
ula
tio
n (
mill
ion
s)
India China USA Brazil EU25 Japan Russia World
China and India’s share of the global e-networked population grows rapidly till the 2020s

Work in progress. Do not cite
Transitions in ‘Hard’ Power over the 21st century
1. The 21st century could be a period of slow transition of ‘hard’ power as the US lead is slowly whittled down by China
2. China becomes an increasingly important ‘hard’ power but only after its emergence as an economic and potential soft power
3. China’s expansion may be successfully contained by the US in the Security First scenario at the expense of global economic growth, equity and environmental concerns
4. The Sustainability First scenario is most beneficial to China, even in terms of ‘hard’ power
5. Indian ‘hard’ power grows in all scenarios, in response to regional concerns and maintaining a minimum parity with China. Markets First favours India
6. Soft power, as measured by potential e-networked populations shifts towards China and India by the 2020s, potentially changing the dynamics of economic development
7. New alliances can be expected in the world-system as lagged phase changes in economic, hard and soft power shares of China and India ripple through
Work in progress. Do not cite
Climate Change: an ‘inconvenient’ but
real Threat
Work in progress. Do not cite
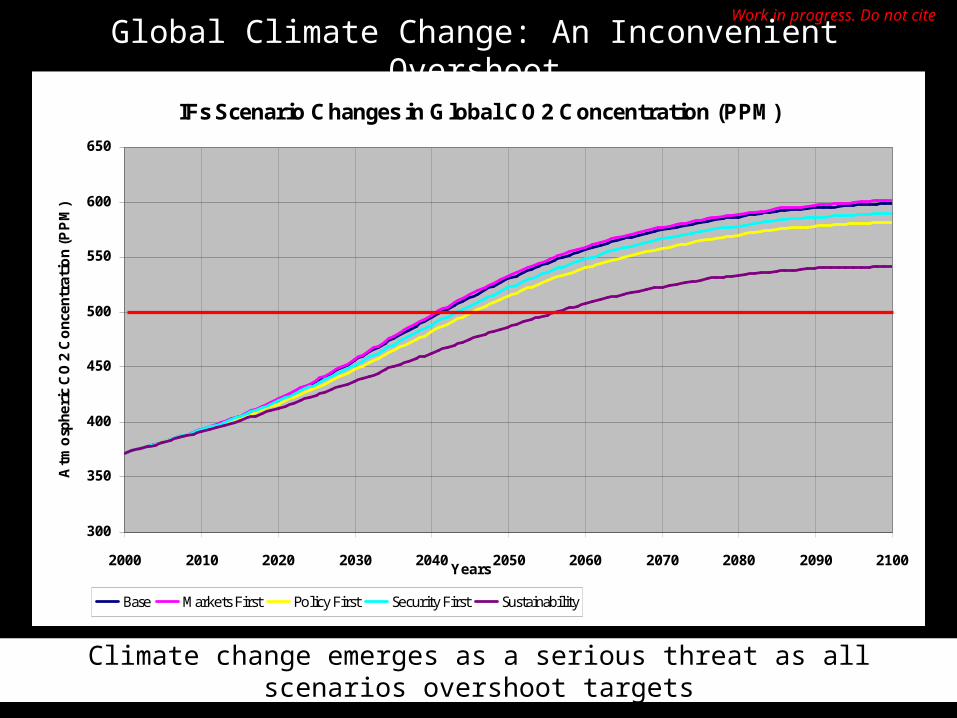
Global Climate Change: An Inconvenient Overshoot
India, China & Japan had the largest urban populations in the world till the early 19th century
IFs Scenario Changes in Global CO2 Concentration (PPM)
300
350
400
450
500
550
600
650
2000 2010 2020 2030 2040 2050 2060 2070 2080 2090 2100Years
Atm
osp
heric
CO
2 C
onc
entr
atio
n (P
PM
)
Base Markets First Policy First Security First Sustainability
Climate change emerges as a serious threat as all scenarios overshoot targets

Work in progress. Do not cite
The Problem of the Traverse:
The Challenge of Transforming India’s Old Economy

Work in progress. Do not citeIndia: Long-range Growth Characteristics (1950-2000) (at 1993-94 constant prices)
0%
1%
2%
3%
4%
5%
6%
1950-1960 1960-1970 1970-1980 1980-1990 1990-2000
Ann
ual G
row
th R
ates
(%
)
GDP growth GDP per capita growth GDP per worker growth Population growth Workforce growth
Source: TARU analysis, 2006 based on Sivasubramonian, 2000, 2004, NAS, 2006
Increasing GDP & productivity growth
Workforce-population
growth differential
Maintaining high GDP growth rates (at constant prices), increasing employment growth and raising labour productivity are key challenges

Work in progress. Do not cite
India: Factor Contributions to Growth
Share of annual growth (1950-2000) at 1993-94 prices
'Land'
'Labour'
'Capital' 'Technology &
Institutions'
Other Factors
0%
10%
20%
30%
40%
50%
60%
70%
80%
90%
100%
1950-1960 1960-1970 1970-1980 1980-1990 1990-2000
% s
hare
of A
nnua
l Gro
wth
Land Labour Capital Technology & Institutions Others
Source: TARU analysis, 2006 based on Sivasubramonian, 2000, 2004, NAS, 2006
Savings & Investment and Technology & Institutions are the primary growth drivers of the Indian economy

Work in progress. Do not citeImportance of Investment, Technology & Institutions to Urban
Growth Factor Contribution to Secondary & Tertiary sector growth (1950-2000)
(at 1993-94 constant prices)
'Labour'
'Capital'
Technology & Institutions
0%
10%
20%
30%
40%
50%
60%
70%
80%
90%
100%
1950-1960 1960-1970 1970-1980 1980-1990 1990-2000
% s
hare
of S
econ
dary
& T
ertia
ry S
ecto
r G
row
th
Land Labour Capital Technology & Institutions
Source: TARU analysis, 2006 based on Sivasubramonian, 2000, 2004, NAS, 2006
Labour contribution to Secondary & Tertiary growth declined to < 20% in 2000, with ‘Capital’ ~ 55 % and Technology & Institutions at ~ 25%
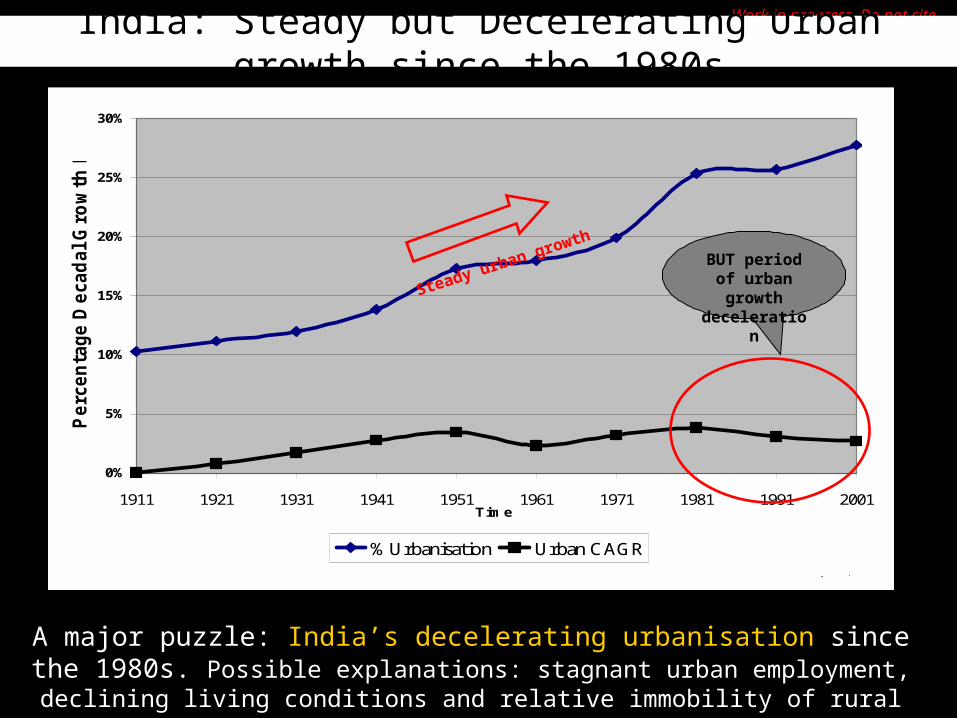
Work in progress. Do not citeIndia: Steady but Decelerating Urban growth since the 1980s
0%
5%
10%
15%
20%
25%
30%
1911 1921 1931 1941 1951 1961 1971 1981 1991 2001Time
Perc
enta
ge D
eca
dal G
row
th R
ate
% Urbanisation Urban CAGRSource: Census of India, 2001
BUT period of urban growth deceleration
Steady urban growth
A major puzzle: India’s decelerating urbanisation since the 1980s. Possible explanations: stagnant urban employment, declining living
conditions and relative immobility of rural India
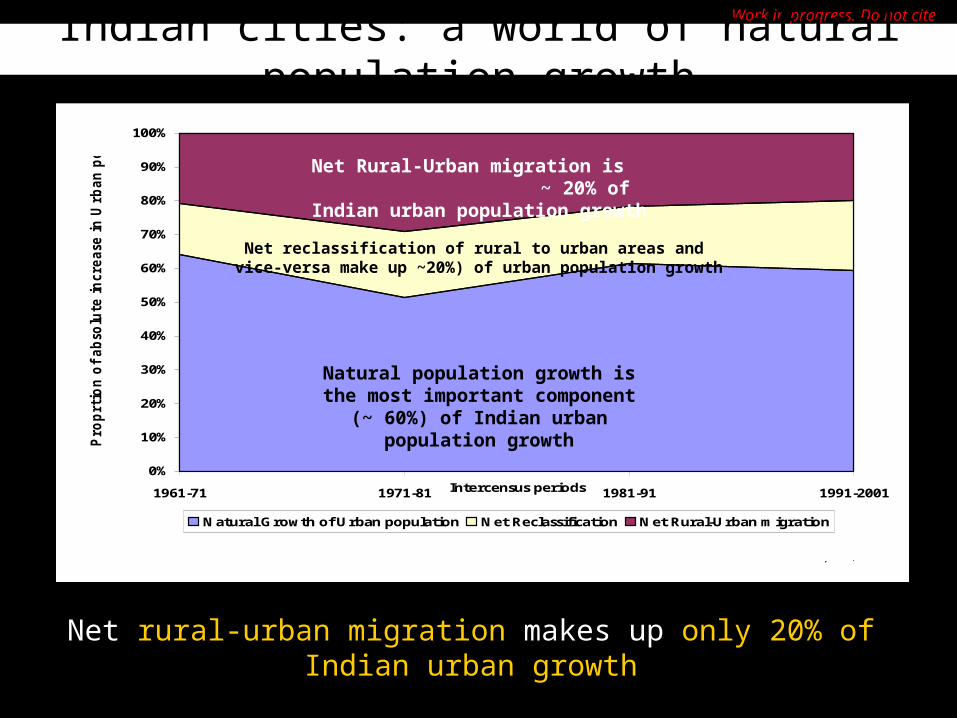
Work in progress. Do not citeIndian cities: a world of natural population growth
0%
10%
20%
30%
40%
50%
60%
70%
80%
90%
100%
1961-71 1971-81 1981-91 1991-2001Intercensus periods
Pro
prt
ion o
f abso
lute
incre
ase
in U
rban p
opula
tion
Natural Growth of Urban population Net Reclassification Net Rural-Urban migration
Source: Census of India, 2001
Net Rural-Urban migration is ~ 20% of Indian urban population
growth
Natural population growth is the most important component (~ 60%) of Indian urban population growth
Net reclassification of rural to urban areas and vice-versa make up ~20%) of urban population growth
Net rural-urban migration makes up only 20% of Indian urban growth

Work in progress. Do not cite
Catalysing India’s Urban Economy
42,389
58,023
74,817
74,747
77,111
85,725
87,714
87,308
24,387
180,803
- 100,000 200,000 300,000 400,000
Forestry & Logging
Fishing
Elect. Gas & Water Supply
Mining & Quarrying
Agriculture
Unregistered Manufacturing
Construction
Transport,Storage & Communication
Real Estate
Registered Manufacturing
Public Administration & Defence
Banking & Insurance
Other Services
Trade, Hotels & Restaurant
NDP 2000 (Rs. crore)Urban Rural
Source: TARU analysis, 2006, NAS, 2006
Stagnant or declining employment growth
Moderate employment growth
Moderate employment growth
Low employment growth
Trade & part of Other Services (e.g. IT/ITES) are key growth drivers that also create steady jobs. Core urban economic sectors (manufacturing, finance,
Govt.) have stagnant or declining employment growth
Work in progress. Do not cite
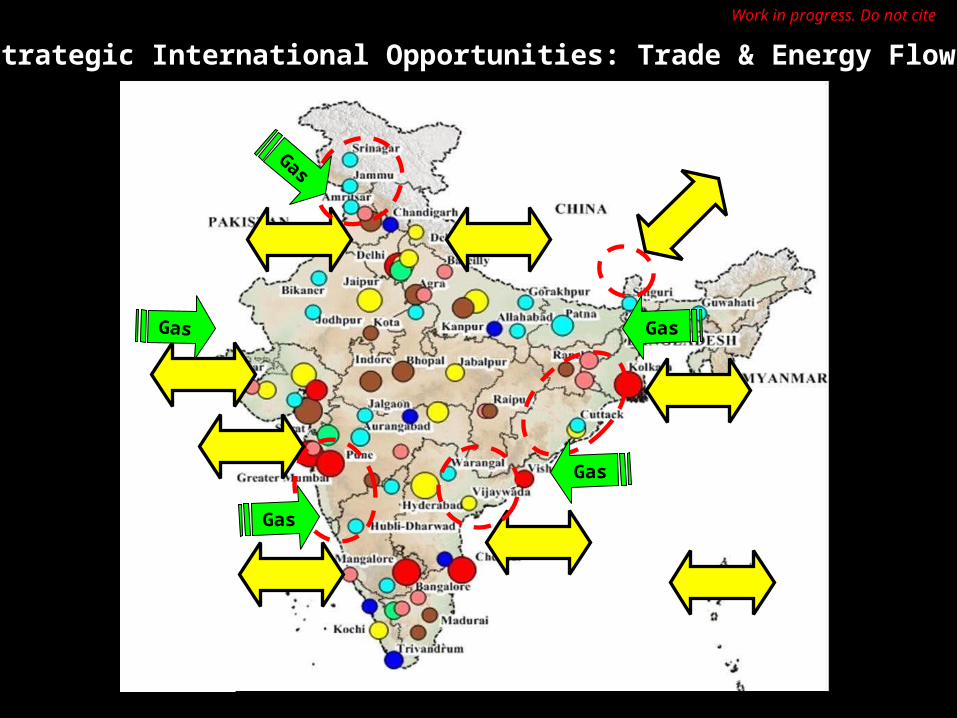
Strategic International Opportunities: Trade & Energy Flows
Trad
eTrade
Trade
Trade
Trade
Trade
Trade
Trade
Trade
Gas
Gas
Gas
Gas
Gas

Work in progress. Do not cite
Strategic Long-term Climate Risks: Coastal Flooding, Drought & Glacial melt
Coastal Flooding
Coastal F
loodin
g
Coastal Flooding
Drought
Glacial melt

Work in progress. Do not citeQuestions this approach could (in time) help
answer for India1. Is a Sustainable Development Transition that addresses poverty,
livelihoods and eco-development possible? What are the key drivers and constraints? How quickly can this happen? What will it cost?
2. How can this be linked to the potential for social transformation?3. Which are the most viable macro-economic and social
development envelopes within which these transitions can be enabled? With or without discontinuous change?
4. What is the mix of roles of institutional groups to enable these transitions?
5. Which are the leading and lagging economic (ecological) sectors? Which are the most challenged stocks and constrained flows?
6. What are the key ecosystem services that are at risk? What are the key leverage points for risk mitigation?
7. Which external societies and institutional groups will benefit/lose most from discontinuous change? How can we fill these niches/ ally with new partners to leverage these new opportunities?
8. How can one establish a credible ‘neutral’ arena to test these alternative Visions of the future?

Work in progress. Do not citeQuestions this approach could (in time) help
answer for China
Work in Progress
Act II in Shanghai & Beijing in June 2007

Work in progress. Do not cite
Intermediate Conclusions

Work in progress. Do not citeThe World could change in dramatic ways by the 2030s
• This could be accentuated by heterogeneous regional behaviour and emergent discontinuities in the world-system
• Many countries in the current OECD could move from the centre to the semi-periphery of the world-system as new regional groupings (e.g. EU), potential hegemonic powers (e.g. China) and new transnationals emerge
• Much of the new polycentric world-system will be populated by relatively poor nations unlike the 20th century when Great Powers had small and affluent populations, large capital and technology concentrations
• Demography, education and institutions could play a much stronger role in economic and soft power than earlier anticipated
• The world-system could be more interconnected: a positive opportunity for the rapid spread of innovation but also the risk of entrainment of sub-regional ‘collapses’, hence a challenge to the international system
• The geographical concentration of strategic resources (e.g. oil and gas), sub-regional resource scarcity and poverty could accentuate future geo-political challenges beyond the absorptive capacity of trade and redistributive mechanisms
• Climate change and potential regional conflict could emerge as real threats
Work in progress. Do not cite
Future Histories
Aromar Revi
Exploring Pathways for India and China in the 21st Century