word pro - 040004 tarpam rehabilitationplan greenmill ... with... · rehabilitation plan june ......
TRANSCRIPT

Green Mill RunLocal Watershed PlanTar-Pamlico CU 03020103 Phase 2
Rehabilitation Plan
June 2005
BLWI Project: 040004NCDOA File: 010569601
Civil Engineering Ecosystem Engineering Environmental EngineeringEnvironmental Consulting Geomatics Consulting
Land Planning Landscape Design
LandWaterInfrastructure, PABLUE

TABLE OF CONTENTS
35REFERENCES11. . . . . . . . . . . . . . . . . . . . . . . . . . . . . . . . . . . . . . . . . . . . . . . . . . . . . . . . . .
31CONCLUSION10. . . . . . . . . . . . . . . . . . . . . . . . . . . . . . . . . . . . . . . . . . . . . . . . . . . . . . . . . .
28FINDINGS AND PROPOSED IMPROVEMENT PROJECTS9. . . . . . . . . . . . . . . . . . . . .
20WATERSHED SYSTEM RESPONSE SIMULATION (MUSIC)8. . . . . . . . . . . . . . . . . . .
19HABITAT ANALYSIS7. . . . . . . . . . . . . . . . . . . . . . . . . . . . . . . . . . . . . . . . . . . . . . . . . . . .
12COASTAL PLAIN STREAM ASSESSMENT6. . . . . . . . . . . . . . . . . . . . . . . . . . . . . . . . . .
12NON-POINT SOURCE OUTFALL INVESTIGATION5. . . . . . . . . . . . . . . . . . . . . . . . . .
7LAND USE TRENDING4. . . . . . . . . . . . . . . . . . . . . . . . . . . . . . . . . . . . . . . . . . . . . . . . . . .
6PREVIOUS AND CONCURRENT STUDIES3. . . . . . . . . . . . . . . . . . . . . . . . . . . . . . . . . . .
5STAKEHOLDER PARTICIPATION2. . . . . . . . . . . . . . . . . . . . . . . . . . . . . . . . . . . . . . . . . .
1INTRODUCTION1. . . . . . . . . . . . . . . . . . . . . . . . . . . . . . . . . . . . . . . . . . . . . . . . . . . . . . . . .
MAPS
33Existing Watershed Conditions and Proposed Improvement Projects9-1 . . . . . . . . . . . . . . .27
Watershed Estimated Pollution Removal – Proposed Projects with 3 or Less PropertyOwners
8-3. . . . . . . . . . . . . . . . . . . . . . . . . . . . . . . . . . . . . . . . . . . . . . . . . . . . . . . . . . . . . . .
26Watershed Estimated Pollution Removal – Proposed Projects On Public Property8-2 . . . .25Watershed Estimated Pollution Removal – All Proposed Projects8-1 . . . . . . . . . . . . . . . . .14Development Trends4-2 . . . . . . . . . . . . . . . . . . . . . . . . . . . . . . . . . . . . . . . . . . . . . . . . . . . .13Land Use / Land Cover4-1 . . . . . . . . . . . . . . . . . . . . . . . . . . . . . . . . . . . . . . . . . . . . . . . . . .2Green Mill Run Watershed1-1 . . . . . . . . . . . . . . . . . . . . . . . . . . . . . . . . . . . . . . . . . . . . . . . .
APPENDICES
US Army Corps of Engineers Green Mill Run Section 205 StudyAppendix D.ECU Coastal Plain Stream Assessment Protocols and FormsAppendix C.DWQ Water Quality Sampling Summary ReportAppendix B.Stakeholder NewslettersAppendix A.
Green Mill Run - Rehabilitation PlanTar-Pamlico Local Watershed Planning June 2005

1. INTRODUCTION
This report is for the Phase 2 and Phase 3 components of the Local Watershed Plan (LWP) for Cataloging Unit03020103 of the Tar Pamlico River Basin. This Cataloging Unit (CU) was chosen by the North CarolinaEcosystem Enhancement Program (NCEEP) as an area to focus watershed planning efforts. Phase 1 of thisLWP included watershed characterization and targeting of areas for further study. The planning area iscomprised of four watersheds located within portions of Edgecombe, Martin, and Pitt Counties in NorthCarolina. The Phase 1 report showed that all study areas had been significantly impacted by development andagricultural practices, resulting in a loss of wetlands and buffers, increased runoff and a general degradation inwater quality. The Phase 1 report is available at http://www.nceep.net/services/lwps/Tar-Pamlico/tarpam.htm.
The current and expected future land use in the four watersheds under this study (Hendricks Creek, CrispCreek, Green Mill Run, Cow Swamp) will not allow for complete restoration of the once natural systems.Improvement of specific watershed functions, however, is possible. The goal of this plan is to provide aframework for watershed functional rehabilitation and to provide primary supporting information forimplementation of the rehabilitation system while taking into consideration development and agriculture. Toachieve this, efforts were focused on three investigative methods: 1) land use / land cover (LULC) trendinganalysis; 2) watershed system modeling; and 3) riparian reach field investigation. The findings and results fromthese tasks were tabulated and compared with the concerns of the stakeholder groups. The end result being thelocation of potential restoration, enhancement, preservation and BMP (best management practices) sites that arebest suited to meet the goals of the study.
The potential recommended actions were formed based on the stakeholder meetings and the findings from thisstudy. The investigative methods were used to find indicators of key stressors in the watershed. If thesestressors can be removed or alleviated the goals and objectives (Table 1-1) can be achieved. The Green Mill Run watershed was divided into seven catchments (Map 1-1). Green Mill Run itself wasdivided into three sections with Catchment 1 starting at the confluence with the Tar River; Catchment 2 flowingfrom Dickinson Road to the railroad tracks near 14th Street; and Catchment 3 containing the headwaters. TheReedy Branch and Fornes Branch catchments both flow into Green Mill Run on the eastern side of thewatershed. Two unnamed tributaries flow into Green Mill Run on the western side of the watershed and arecalled the Lake Ellsworth and Country Club catchments in this study. As their names imply, the Lake Ellsworthcatchment contains the lake while the Country Club catchment contains the Greenville Country Club.
Green Mill Run - Rehabilitation PlanTar-Pamlico Local Watershed Planning June 2005
1

��������
�������������
��������
�� �
��������
���
���
��
����� ������� �
����
����
���
����� ��
� �
� ���
������ ��
������
��
� �
�
�����
��
� � �����
�
���
���
��
���
�
���
���
����
���
��
�
����
��
����
����
�
���
�����
��
����
�������
��
�� � �
�� �
������
�
��
��
� ����
�
��
� ����� ��
��
�
�
�
�
�� ���������
�
�
�
�������
�
�
�
�����
�
�
�
� �
�
�
�
�
�
��
�
��
��
�
�
�
�
�
�
�
�
�
�
�
�
�
�
�
�
�
�
�
�
�
�
�
�
�
�
�
�����������
��
����
�� �� ���
����
��
�����
����
���
���������
��������
������ ��� ��� � �� ����������
�����
���
����
������
�������
������� ����
����������
����������
���� �� ��
�����������
������� ���
�������
�
������
������������
���������
�
������������
��������
� � ��������
�
���� �����
��������������
��������������
�
���� � ���� ���� ����
������ �!�" ��#$�!�" ���%&��'�
�!� ��$��$�#'��������� � ��'�����($��!%��#!' �
�((�!)#������*�+�$$�!%��#!' �
��,����($#'-�!%��#!' .�����'��#$$��*'�/��� ��0�&���1�2��&���1����!�#�$���1���$#'-�!'��$3"
�
�!*'��4�$*5
�!�'� ���'%&
���"4����'%&
�6���$$ 7!��&
����8�����
����2 �
�
�
�
��(�292�����'��#$$��*'������ &�"
�����������������������������������������������������������������������

Table 1-1 Tar-Pamlico Local Watershed Plan: Goals, Objectives, Assessment Elements, Potential Actions and Stakeholder Concerns2-14-05
Goal: Improve the functions of the watershed while considering development and agriculture
-education-greenspace-stormwater retention-stormwater treatment
-wetland restorationDCM NCREWS analysiswetland acreage drained, clearedor cutover
wetland lossPrevent or alleviate functionallosses due to disruption or lossof riparian wetlands
Protect/Improve Aquatic andTerrestrial Habitat andBaseflow, Prevent Flooding
-groundwater recharge-greenways-stormwater retention-stormwater treatment-retain runoff to decreasedownstream flooding
-BMPs-wetland restoration-stream restoration-preservation
-Coastal Plain StreamAssessment-land use investigation-outfall investigation
-incised channels-lack of channel - riparian zoneconnection-high % of impervious surface
-flooding-reduced baseflow
Prevent or alleviate functionallosses due to disruption ormodification of floodplainhydrology
Protect/Improve Baseflow andPrevent Flooding
-diversity of terrestrial species-habitat for bird species -open space-public recreation-wildlife corridors
-preservation-buffers
-Coastal Plain StreamAssessment-land use investigation
-lack of diverse composition andstructure in riparian zonevegetation-lack of forest connectivity-dominance of invasive species
-poor wildlife habitat-loss of habitat
Prevent or alleviate functionallosses due to degradation ofterrestrial wildlife habitat[
Protect/Improve TerrestrialHabitat
-clean water/improve/protectwater quality-nutrient removal
-BMPs -buffers
-Coastal Plain StreamAssessment-outfall investigation
-excess sediment-excess nutrients-presence of pesticides/herbicides
poor water quality (low DO,toxicity, turbidity)
Prevent or alleviate functionallosses due to poor instreamwater quality conditions
Protect/Improve Aquatic Habitat(chemical)
-aquatic species diversity-sediment control-stream stability
-buffers -stream restoration
-Coastal Plain StreamAssessment
-lack of large woody debrishabitat-unstable banks-lack of stream shading-lack of riffle/pool sequence
poor instream habitatPrevent or alleviate functionallosses due to stream erosion/instability and the associatedsediment loading
Protect/Improve Aquatic Habitat(physical)
-improve water quality-nutrient removal -sediment control-improve bank stability-natural filter system
-buffers-preservation-stream restoration-BMPS
-Coastal Plain StreamAssessment-% impervious cover -outfall investigation-MUSIC water quality model
-lack of riparian zone cover-high percentage of impervioussurfaces-unstable banks
contaminated runoff Prevent or alleviate functionallosses to the TarPam River andother surface waters from poorwater quality
Protect/Improve Water Quality
May address the followingstakeholder concerns
Potential RecommendedActions
Investigative MethodsIndicators of StressorsKey stressorsObjectivesWatershed Function Goals
Green Mill Run - Rehabilitation PlanTar-Pamlico Local Watershed Planning June 2005

this page intentionally left blank
Green Mill Run - Rehabilitation PlanTar-Pamlico Local Watershed Planning June 2005
4

2. STAKEHOLDER PARTICIPATION
The local public was involved in order to get feedback on the assessment process and findings. They will beintegral to the successful implementation of the watershed plan. NCEEP contracted with Watershed Educationfor Communities and Local Officials (WECO) to facilitate stakeholder meetings. Prior to the session ofstakeholder meetings, WECO conducted an issue assessment for the four watersheds. Issues brought upincluded drainage districts and their legal jurisdiction over many streams, flooding, open space, potential of raremussels, nuisance of beavers, growth and economic development, land use planning, and agricultural efforts.All issues may not apply to the Green Mill Run watershed as the assessment included the three additionalwatersheds in the area where plans are being prepared, as mentioned in the introduction.
WECO formed an advisory committee made up of resource professionals and local government staff. Thecommittee included stakeholders for this watershed and the three other watersheds mentioned above. Thecommittee was made up of representatives from the City of Greenville, East Carolina University, EdgecombeCounty Soil and Water Conservation District (SWCD), Edgecombe County Planning, Edgecombe CooperativeExtension, Clean Water Management Trust Fund, NC Wildlife Resources Commission, Pitt County SWCD, PittCounty, Martin County SWCD, Southeastern Drainage District, Town of Tarboro, Upper Coastal Plain Councilof Government, and the Pamlico-Tar River Foundation.
Tasks established for the committee include the following:Assist with landowner contacts and education Assist in selection of priority subwatersheds, stream segments and specific watershed improvement projectsitesHelp identify optimal sites for traditional (stream, wetlands and buffers) restoration projects, non-traditionalrestoration strategies and preservationHelp identify additional funding sourcesFit projects into the development of an overall watershed restoration/protection strategyIntroduce and promote recommended watershed solutions to local governments and the community
During meetings, stakeholders were given an overview of the Coastal Plain Stream Assessment Protocol and areview of the initial findings from the first phase of the LWP. Participants in the meetings were asked toidentify areas of concern or interest within the watersheds. This information aided in selecting project sites andin describing overall watershed conditions as described in the Findings and Proposed Improvement Projectssection of this report. Stakeholders also provided a list of concerns that should be addressed by this watershedplan. These concerns were taken into consideration when forming the goals and objectives of the watershedplan. This list can be found in Table 1-1. Tar-Pamlico Local Watershed Plan: Goals, Objectives, AssessmentElements, Potential Actions and Stakeholder Concerns. When field work and office analysis were complete, thefindings were presented to the stakeholders along with an explanation of the proposed projects. Stakeholdersgave comments on the projects and helped identify additional ones. After each stakeholder meeting, WECOproduced a newsletter. A copy of each newsletter can be found in Appendix A.
Green Mill Run - Rehabilitation PlanTar-Pamlico Local Watershed Planning June 2005
5

3. PREVIOUS AND CONCURRENT STUDIES
NCDWQ Water Quality SamplingDWQ performed water quality sampling of Green Mill Run at East 5th Street eight times between December2003 and October 2004. Additional samples were taken on four occasions at Memorial Drive, ArlingtonBoulevard, and 14th Street. Results can be found in Appendix B.
Green Mill Run Section 205 StudyIn January 2003, the City of Greenville requested assistance from the US Army Corps of Engineers (Corps)regarding flooding problems in the Green Mill Run watershed. The City was primarily concerned with frequentstreet flooding and the potential impacts from impending future development of the upstream portions of thewatershed. After investigation of the area, the Corps determined that a flood reduction study as well as anevaluation of stormwater issues would be undertaken under Section 205 and Section 22 programs. According tothe Corps, aquatic restoration (Section 206) did not appear feasible based on the presence of mature bottomlandhardwood forests along the main channel of Green Mill Run and the encroachment of existing developmentonto the floodplain.
A Section 205 flood damage reduction study of Green Mill Run was also performed in 1971. That studyrecommended channel widening and bridge replacement to alleviate flooding problems. Channel widening is nolonger a viable option due to wetland impacts as well as conflicts with the Tar River Basin buffer rules.
The Corps evaluated and modeled several structural and nonstructural alternatives to alleviate floodingproblems along Green Mill Run including flood proofing, road/bridge modification, and detention structures.Flood proofing was recommended on a case by case basis, as raising the threatened buildings did not seem to beviable because many of them were on concrete slabs. Raising the roadway and increasing the openings at 14thand Charles Streets did alleviate the 10-year flooding with the Charles Street modifications costing significantlymuch more than the 14th Street modifications. For more information regarding the economic analysis please seethe Corps Report on Findings in Appendix D. Detention structures were evaluated in the watershed with themost viable location being in the upstream portion of the watershed where space for treatment measures isreadily available.
According to the Corps, “an economically favorable solution to the flooding problems along Green Mill Run,which would also be environmentally acceptable, was not found. Costs exceed benefits for an overallnonstructural plan.” In addition to consideration of the upstream detention structure, the Corps recommendedthat the City enact stricter stormwater regulations and require best management practices for new developmentto reduce the future flooding impacts (Appendix D).
NCDOT Green Mill Run Feasibility Study (TIP R-3407WM)A feasibility study was completed by Buck Engineering in March 2002 for restoring a section of degradedstream channel (Green Mill Run) with the purpose of NCDOT compensatory mitigation. The study focused onGreen Mill Run from its confluence with the Tar River to Charles Street. The approximate 2.8 mile section ofstream was divided into 14 subreaches and visually assessed in the field by Buck Engineering staff. Accordingto the report, most of the study reach could be classified as either a Rosgen “G” or incised “E” stream type.Restoration potential was evaluated for each reach as the possibility of applying one of the four Rosgen prioritylevels of stream restoration. Viable areas for Priority Level I (entire channel relocation) and Level II (channelrestoration and floodplain benching) were not found within the study reach due to increased flooding potential
Green Mill Run - Rehabilitation PlanTar-Pamlico Local Watershed Planning June 2005
6

and existing infrastructure and wetlands. Buck Engineering recommended 3,302 feet of Priority Level III(floodplain benching) restoration and 1,802 feet of Priority Level IV (bank stabilization) restoration in the studyreach. These restoration areas occur in disjointed segments in three main areas of the channel: the area betweenCharles and 14th Streets, the area from Rock Springs Road to just downstream of 10th Street, and the area justupstream of 5th Street.
4. LAND USE TRENDING
Land use / land cover (LULC) has a major influence on watershed function. Areas with static land use havesteady inputs into the watershed system, whereas areas of land use change alter the riparian equilibrium and cancause watershed function degradation. One of the goals of this section of the project is to establish a growthpattern to predict future growth areas so that steps can be taken now to alleviate future growth-related impactsto watershed health. A second goal is to quantify the amount of impervious surface in the watershed. As thepercent impervious increases in a watershed, the level of stream quality decreases (Schueler 2000).
Four sets of high resolution imagery were utilized for the trending analysis. The four sets cover a twenty yeartime span from 1982 to 2003. March 1982 color infrared images were obtained from the USDA/FSA AerialPhotography Field Office. BLWI staff georeferenced and orthorectified the images using Global Mapper. Theblack and white 1993 images and the 1998 color infrared images are USGS digital orthophoto quadranglesobtained from NCCGIA. The 2003 images are true color and were obtained from the City of Greenville.
Land use on each set of images was digitized to produce a LULC map for each of the four years. LULC classeswere based on the publication ‘A Standard Classification System for the Mapping of Land Use and Land Cover’produced by the State of North Carolina Governor's Office of State Planning Center for Geographic Informationand Analysis in January 1994. This publication has separate classes for land use and land cover. For thiswatershed analysis, a modified version of the land cover classes was used to better incorporate land uses. Forexample, according to the previously mentioned standard classification system, the ‘developed’ land cover classdoes not include low density residential areas and isolated farmsteads. For this analysis, all built upon land isconsidered developed whether or not it is isolated; these buildings add to the amount of impervious area in thewatershed. Developed areas were divided into two classes, ‘high-density developed’ and ‘low-densitydeveloped’ because developed areas such as shopping malls contain more impervious surface than developedareas with single-family homes. All of the LULC classes are described in Table 4-1.
Green Mill Run - Rehabilitation PlanTar-Pamlico Local Watershed Planning June 2005
7
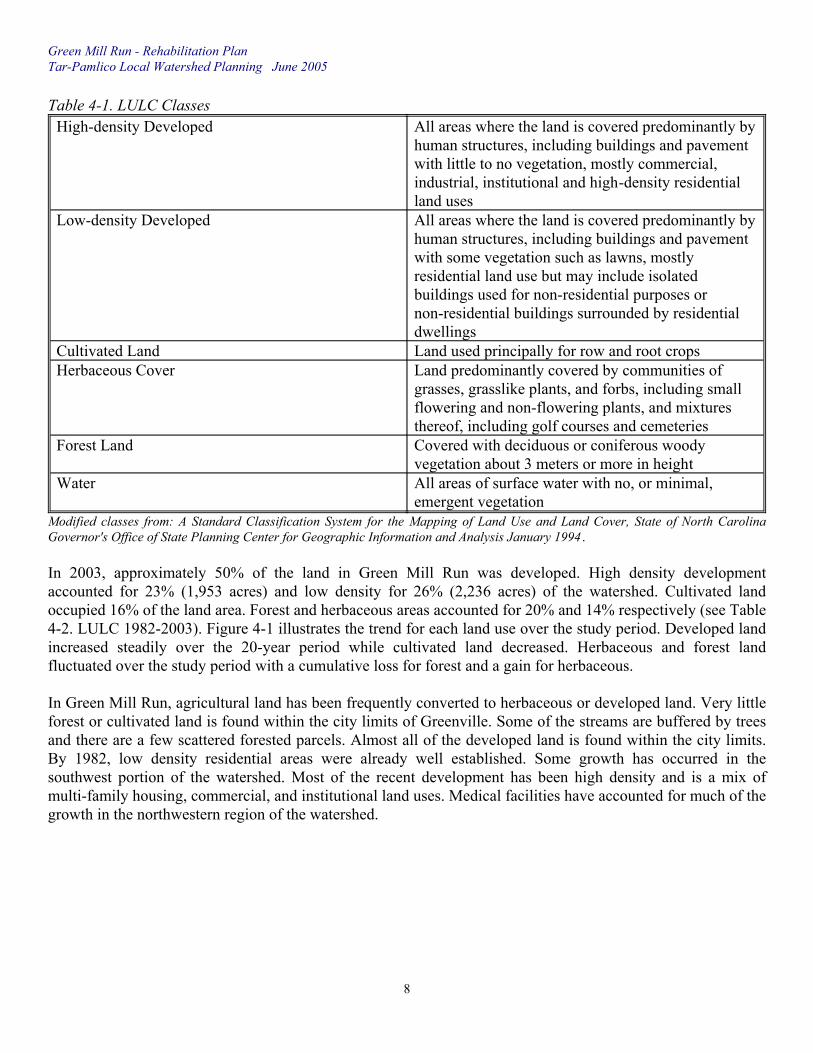
Table 4-1. LULC Classes
All areas of surface water with no, or minimal,emergent vegetation
Water
Covered with deciduous or coniferous woodyvegetation about 3 meters or more in height
Forest Land
Land predominantly covered by communities ofgrasses, grasslike plants, and forbs, including smallflowering and non-flowering plants, and mixturesthereof, including golf courses and cemeteries
Herbaceous CoverLand used principally for row and root cropsCultivated Land
All areas where the land is covered predominantly byhuman structures, including buildings and pavementwith some vegetation such as lawns, mostlyresidential land use but may include isolatedbuildings used for non-residential purposes ornon-residential buildings surrounded by residentialdwellings
Low-density Developed
All areas where the land is covered predominantly byhuman structures, including buildings and pavementwith little to no vegetation, mostly commercial,industrial, institutional and high-density residentialland uses
High-density Developed
Modified classes from: A Standard Classification System for the Mapping of Land Use and Land Cover, State of North CarolinaGovernor's Office of State Planning Center for Geographic Information and Analysis January 1994 .
In 2003, approximately 50% of the land in Green Mill Run was developed. High density developmentaccounted for 23% (1,953 acres) and low density for 26% (2,236 acres) of the watershed. Cultivated landoccupied 16% of the land area. Forest and herbaceous areas accounted for 20% and 14% respectively (see Table4-2. LULC 1982-2003). Figure 4-1 illustrates the trend for each land use over the study period. Developed landincreased steadily over the 20-year period while cultivated land decreased. Herbaceous and forest landfluctuated over the study period with a cumulative loss for forest and a gain for herbaceous.
In Green Mill Run, agricultural land has been frequently converted to herbaceous or developed land. Very littleforest or cultivated land is found within the city limits of Greenville. Some of the streams are buffered by treesand there are a few scattered forested parcels. Almost all of the developed land is found within the city limits.By 1982, low density residential areas were already well established. Some growth has occurred in thesouthwest portion of the watershed. Most of the recent development has been high density and is a mix ofmulti-family housing, commercial, and institutional land uses. Medical facilities have accounted for much of thegrowth in the northwestern region of the watershed.
Green Mill Run - Rehabilitation PlanTar-Pamlico Local Watershed Planning June 2005
8
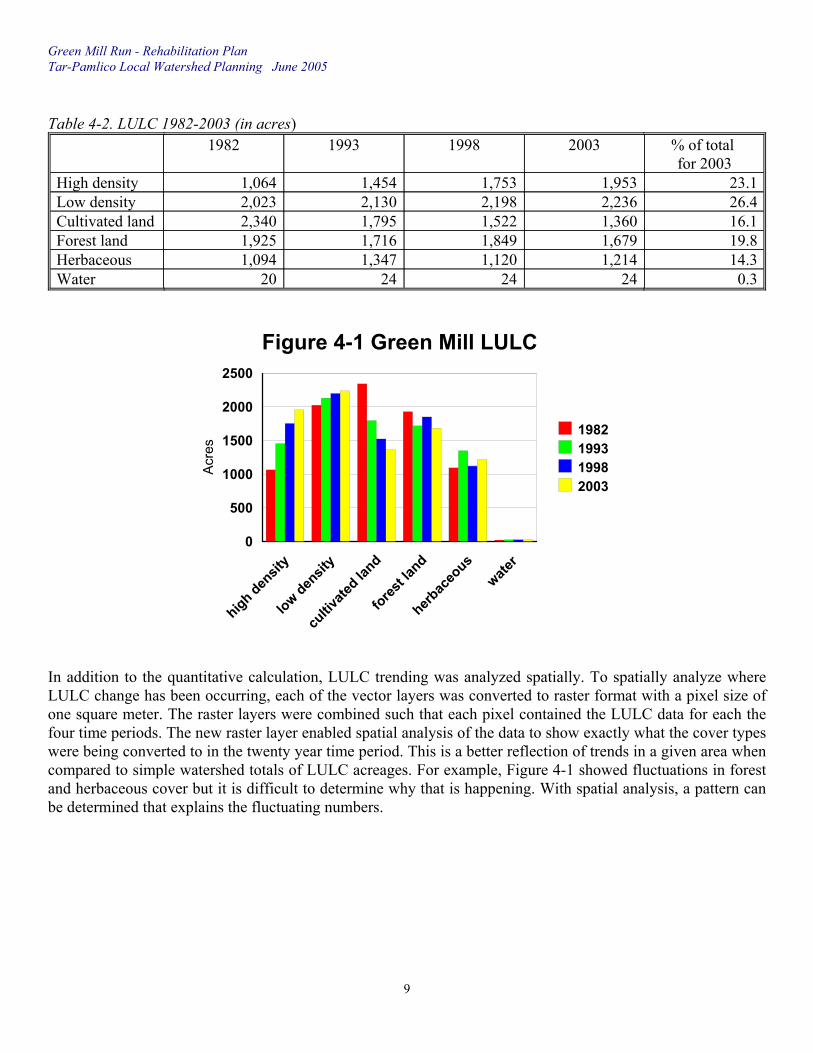
Table 4-2. LULC 1982-2003 (in acres)
0.324242420Water14.31,2141,1201,3471,094Herbaceous19.81,6791,8491,7161,925Forest land16.11,3601,5221,7952,340Cultivated land26.42,2362,1982,1302,023Low density23.11,9531,7531,4541,064High density
% of total for 2003
2003199819931982
high densit
y
low densit
y
cultiv
ated la
nd
forest la
nd
herbac
eous
water
0
500
1000
1500
2000
2500
Acr
es
1982199319982003
Figure 4-1 Green Mill LULC
In addition to the quantitative calculation, LULC trending was analyzed spatially. To spatially analyze whereLULC change has been occurring, each of the vector layers was converted to raster format with a pixel size ofone square meter. The raster layers were combined such that each pixel contained the LULC data for each thefour time periods. The new raster layer enabled spatial analysis of the data to show exactly what the cover typeswere being converted to in the twenty year time period. This is a better reflection of trends in a given area whencompared to simple watershed totals of LULC acreages. For example, Figure 4-1 showed fluctuations in forestand herbaceous cover but it is difficult to determine why that is happening. With spatial analysis, a pattern canbe determined that explains the fluctuating numbers.
Green Mill Run - Rehabilitation PlanTar-Pamlico Local Watershed Planning June 2005
9

Table 4-3. Percent Change of Land Use / Land Cover (per decade and for 20-year period)
17.69-0.1717.82Water9.91-10.9718.82Herbaceous
-14.67-2.23-12.17Forest land-72.09-31.96-30.41Cultivated land
9.54.735.01Low density45.5525.5826.84High density
1982 - 20031993 - 20031982 - 1993Land Use/Land CoverPercent change
Between 1982 and 1993, 15% (1,262 acres) of the land in the watershed changed in land cover. Developmentoccurred on 530 acres. Almost 408 acres of the newly developed land were high density and 122 acres were lowdensity. In addition, land that already had low density development was further developed and was reclassifiedas high density development. During this time period, almost 90% of development occurred on agricultural andherbaceous land. The remaining 10% occurred on cleared forest land. Although some herbaceous land was usedfor development, the amount of herbaceous land actually increased as cultivation was abandoned on landadjacent to large buildings and parking lots. Half of the lost cultivated land was used for development whereasless than 20% of the harvested forest land was used for development.
Change was similar over the next ten years between 1993 and 2003. Almost 16% (1,321 acres) of the areachanged use. Development occurred on 618 acres (499 high density and 119 low density). Approximately 441acres of cultivated land were lost, half to development and half to herbaceous. Forest land in the western regionof the watershed both regenerated and was harvested during this time period.
Forest land percentages have fluctuated over the twenty year period. The majority of deforested land isreplanted, woody vegetation comes back naturally, or herbaceous cover is maintained. For example, between1982 and 1993, 354 acres were deforested. By 2003, approximately 271 (76%) of these acres were stillherbaceous or had returned to forest. Herbaceous land has fluctuated as well. This includes land that has beenrecently deforested and the trees are growing back. It also includes a large amount of agricultural fields that areno longer used for agriculture. This often occurs when high-density development occurs adjacent to farmland.Eventually the herbaceous land is built on or it remains as open land surrounding the buildings.
The Green Mill Run watershed is over 50% developed. Development occurred at a steady rate during the20-year study period and continues to do so. Field visits in 2004 and 2005 show many new areas of growth,especially along the edge of the city limits. In fill development is taking place on small patches of undevelopedland within the city limits. The City of Greenville has produced a land use plan with conservation open spacealong the streams and a few scattered parks. Development is planned for the rest of the watershed. TheSouthwest Bypass (NC11) will be constructed along the western edge of the watershed. This will bring evenmore development to the watershed in the currently undeveloped area. This information and the spatial analysiswere used to develop a map of development trends (Map 4-2).
Green Mill Run - Rehabilitation PlanTar-Pamlico Local Watershed Planning June 2005
10

Impervious Cover and DevelopmentAs described in the Introduction, the Green Mill Run watershed was divided into seven catchments. Thesecatchments are the Green Mill Run Catchments 1, 2 and 3; Reedy Branch catchment; Fornes Branch catchment;Lake Ellsworth catchment and the Country Club catchment.
The developed land and impervious acreage was calculated for each catchment for 2003 and future built out.Detailed impervious surface information was provided by the City of Greenville. For the developed areasoutside of the city limits, the impervious acreage was calculated from the digitized LULC layer. Roads wereconsidered 100% impervious and built areas were considered 50% impervious. Future developed acres arebased full build out according to the Greenville future land use map. Conservation open space, as planned bythe city, was subtracted from the acreage available for development. Impervious acreage was determined usingthe current impervious rate found in the catchment. This rate ranged from 30% to 65%. Catchment GMR-1,Reedy Branch and Fornes Branch are almost completely developed and the current percentage of imperviouscover is high. The impervious percentage will increase slightly in each of these catchments if the few remainingparcels of land are developed. Country Club and Lake Ellsworth catchments are currently only developed toapproximately one third of the potential development, yet the impervious percentage is already close to 20%. Ifdevelopment continues as planned, the percentage of impervious surface could exceed 50%. Catchment GMR-3currently has very little development and is only 7% impervious. Impervious cover could increase to 56%. Incatchment GMR-2, 75% of developable land is already built upon.
As mentioned above, high levels of impervious surfaces result in a low level of stream quality. Schueler (2000)has devised management categories according to the relationship between impervious cover and stream quality.The category describes the level of quality that can be achieved. Impervious cover <10% is categorized as asensitive stream. Impacted streams have 11-25% impervious cover and non-supporting streams have >25%impervious cover. Streams that fall into the sensitive category can be protected by “strict zoning, siteimpervious restrictions, stream buffers and stormwater practices.” Streams in the impacted category should berelieved with stormwater management practices. Finally, non-supporting streams are those where the primaryobjective is to remove pollutants as it is very difficult to achieve predevelopment channel stability andbiodiversity. Some level of stream quality can be accomplished by using stream restoration techniques.According to this categorization system, streams in GMR-3 are sensitive, streams in the Country Club and LakeEllsworth catchments are impacted, and streams in GMR-1, GMR-2, Reedy Branch, and Fornes Branch arenon-supporting based on the current percent impervious (Table 4-4).
Table 4-4. Developed and Impervious Areas by Catchment
5117559189862293Lake Ellsworth51188503001,516517Country Club3532203184569514Fornes Branch3229145132441398Reedy Branch567748941,262172GMR-345321,1608282,4141,749GMR-24136298263618547GMR-1
Future2003Future2003Future2003Catchment
% Imperviousin catchment
Impervious acresDeveloped acres
Green Mill Run - Rehabilitation PlanTar-Pamlico Local Watershed Planning June 2005
11

5. NON-POINT SOURCE OUTFALL INVESTIGATION
Stormwater outfalls in urban watersheds can be significant sources of pollution and can also contribute toflooding. Pollutants and debris are picked up as water flows across the landscape, commonly emptying directlyinto surface waters by way of an outfall. The outfall investigation was undertaken to aid in targeting anddeveloping projects to ameliorate water quality degradation as well as provide base information for watershedsystem modeling.
The outfall investigation was primarily undertaken using GIS and is not meant to be a substitute for a formaloutfall survey as required by the National Pollutant Discharge Elimination Systems (NPDES) Phase II Program.The City of Greenville is subject to the requirements of this program.
In this study, outfalls were considered to be pipe outlets, ditches, or other outlets of concentrated stormwaterflow. Using the 2003 high-resolution color imagery in conjunction with LIDAR-derived topography, outfalllocations were mapped using GIS. Approximate outfall locations are shown on Map 1-1 Green Mill RunWatershed. The outfall investigation underestimates the number of outfalls from subdivision/road curb andgutter systems because these outfalls were difficult to observe using aerial imagery and topography.
During the stream assessment field work, various outfalls were observed and cataloged. A number of the outfalllocations that appeared to be potential BMP project sites were groundtruthed. Due to project limitations, it wasnot feasible to visit every length of stream to visually observe every outfall As a result there are likely moreopportunities in the watershed for stormwater retrofits and BMPs.
6. COASTAL PLAIN STREAM ASSESSMENT
In prior research, East Carolina University (ECU) researchers developed a rapid assessment procedure forassessing functions of intermittent to second order (headwater) riparian reaches in agricultural landscapes in thecoastal plain. Due to the inadequacies of other stream assessment methods for use in the coastal plain, the NorthCarolina Ecosystem Enhancement Program (NCEEP) contracted ECU to further develop their methodology foruse in this and other local watershed planning efforts. As part of this project, the Coastal Plain StreamAssessment was expanded such that it could be applied to higher (third and fourth) order streams as well asurban stream reaches. ECU staff also conducted comprehensive training of this new assessment methodologyfor NCEEP staff, other state and federal agency staff, as well as the consultants involved in the local watershedplanning process (including BLWI staff).
The base layer used for this assessment was the USGS hyrdography GIS data layer. USGS ‘blueline’ streams ineastern North Carolina tend to include many agricultural ditches that were likely never natural streams, butinstead wet flats. Based on topography from the USGS topographic quadrangles as well as soil surveyinformation, ECU researchers removed a number of headwater agricultural ditches from the assessment. Theyalso added a few small first order streams to the data layer using the topography and soils information. Ingeneral, first and second order streams were considered low order streams while third and fourth order streamswere considered high order streams. There are no fifth order streams in the watershed. The resulting streamlayer contains 68% (22.7mi) low order streams and 32% high order streams. This assessment method was notmeant to evaluate areas ponded by beaver or other impoundments.
Green Mill Run - Rehabilitation PlanTar-Pamlico Local Watershed Planning June 2005
12

�������
������
��������
�����������
����������
����������
�� �����������
����������
�����������������
�� ������������
!��������
�����������
�"������
!�������
!�#$����
�� ������������
��%� #�����
���� �������
���������
�� �������
��� ��������������
���$��
�����#����
�������������������#
"������
����������
��
���������
�������
�"� ��� ��� ����
&��!���'()
�������$�����
�������������
��������� ���
������� �
� ��������
���
����%
���
���
����#����
����
���#�
�������������
!�$����� ��������������������������"��!������������������"��
����&���*���������
'+,, , '+,, ���
�
�%��-
�%��'�%��.
������������
����������
��������
���������$
������������������� ����� ������� �� ��� ��������� ��� ��������� ��������
%"�)/-�����&���*���������

�������
������
������ ��
�����������
����������
����������
�� �����������
����������
�����������������
�� ������������
!��������
�����������
�"������
!�������
!�#$����
�� ������������
��%� #� �� ��
�����������
���������
�� �������
��� �������������
����$��
�����#����
�������������������#
"������
����������
��
���������
�������
�"� ��� ��� ����
&��!���'()
�������$�����
�������������
��������� ���
������� �
� ��������
���
����%
���
���������$
��������
����������
������������
�%��*�%��'
�%��+
�
',-- - ',-- ���
+../�0�'--*�!������������������"#���+../�0�'--*�������������������"#���
������"���!������������"������+./'������"���������������"������+./'1������������������"����"��
1��������!������������������"#���1��������������������������"#���
+./'�0�+..*�!������������������"#���+./'�0�+..*�������������������"#���
+..*�0�+../�!������������������"#���+..*�0�+../�������������������"#���
����#����
���#�
����
������
������������������� ����� ������� �� ��� ��������� ��� ��������� ��������
%"�)0'�������"#���������
���������#���
�%��0�+�%��0�'�%��0�*���������� �������������������$������������
2�3#"������
*(*'4'.*'+/+4

To create statistically valid results ECU developed a stratified-random sampling scheme based on abundance(stream order and drainage area). This approximated 2.5 samples sites/mi2 (1 site/km2). In Green Mill Run 34reaches were assessed, with each reach constituting 300 feet of stream length and 90 feet of riparian area oneither side. To ensure that a complete sample set could be achieved, a list of alternate sites was also provided byECU in the event that one or more of the original sample sites was rejected. Rejection occurred whenever anyof the random reaches overlaid each other, the sample site was not a stream, the sample site landed on a streamthat was piped underground, or the landowners were not willing to permit access. No sites were rejected due toaccess issues. The approximate location of the points that were assessed are shown on Map 1-1 Green Mill RunWatershed
The Coastal Plain Stream Assessment is a reference-based assessment of riparian functions. The condition ofeach reach is evaluated relative to unaltered reaches of the same type. Four types of reaches were used in thisassessment: urban low order, rural low order, urban high order and rural high order. Sampling forms andassessment protocols can be found in Appendix C. The purpose of the assessment is to provide data to evaluatethe ecosystem (stream channel and riparian zone) in order to diagnose problems and identify potential solutions.Riparian ecosystem functioning depends upon the condition of the stream itself, which incorporates onsite andupstream influences, and upon the condition of its adjacent riparian zone (Rheinhardt 2005). The condition ofthe riparian zone and the stream channel were evaluated using a number of indicators (Table 6-1). There are 8-9condition indicators of riparian condition evaluated for each reach, depending on if it is high or low order andurban or rural.
The riparian zone cover (RZC), near stream cover (NSC), and composition and structure of vegetation in theriparian zone (SRC 7) indicator scores were all determined by the type and age of riparian zone vegetation. Theinstream woody structure indicator (SRC 1) evaluated the presence of large (>4 inch diameter) downed woodwithin the channel and along the banks. Sediment regime (SRC 2) was determined by observing turbidity levelsas well as the amount of silt and sand deposits along the floodplain and within the channel. Channel-riparianzone connection (SRC 3) measures the level of channel incision and overbank flooding. The on/off site factorsaffecting stream and riparian zone indicators (SRC 4 and 5) were determined by evaluating the presence ofpollution sources and the ability for those contaminants to access the surface water. Bank stability (SRC 6) wasassessed by evaluating the prevalence of bank erosion and is only determined for high order and urban streams.Each of these indicators was used to determine the condition of the watershed, causes and sources ofdegradation, and the range of restoration opportunities in the watershed. Bank stability (SRC 6) was assessed byevaluating the prevalence of bank erosion and is only determined for urban streams and rural high orderstreams. SRC 2, SRC 3, and SRC 7 are not evaluated if the channel is impounded. Each of these indicators wasused to determine the condition of the watershed, causes and sources of degradation, and the range ofrestoration opportunities in the watershed.
Green Mill Run - Rehabilitation PlanTar-Pamlico Local Watershed Planning June 2005
15

Table 6-1. Function Score Determinations
Function Score(mean of marked indicators)
XComposition and structureof vegetation in riparianzone (SRC 7)
XXBank stability (SRC 6)
XXXOn/off site factors affectingriparian zone (SRC 5)
XXXOn/off site factors affectingstream (SRC 4)
XXXXXXChannel-riparian zoneconnection (SRC 3)
XSediment regime (SRC 2)
XXXInstream woody structure(SRC 1)
XXNear stream cover (NSC)XXXRiparian zone cover (RZC)
RiparianZone
StreamChannel
RiparianZone
StreamChannel
RiparianZone
StreamChannel
HabitatBiogeochemistryHydrology
Indicators
ResultsSpecific indicators are combined and averaged according to Table 6-1 to determine the level of function forhydrology, biogeochemistry and habitat for the stream channel and the riparian zone. The watersheds wereevaluated relative to the condition of the channel and riparian zone, by averaging the hydrology,biogeochemistry, and habitat of each component and then graphing these scores for all 34 of the reaches. Thereaches are clustered along a line with a slope of 1 because alterations to the channel affect the riparian zoneand visa versa (Figure 6-1) (Rheinhardt 2005).
A Composite Function Score is calculated by averaging the six function scores (bottom row of Table 6-1). Thecondition of the stream is based on the Composite Function Score. The possible conditions are, from best toworst, relatively unaltered (100-85) followed by somewhat altered (84-55), altered (54-25), and finally severelyaltered (24-0). The relatively unaltered condition is not found in any of the streams, 23.5% are somewhataltered, 70.6% are altered, and 5.9% are severely altered. If 5.9% of the assessed reaches are severely altered itcan be inferred that 5.9% of all of the streams in the watershed are severely altered based on the CompositeFunction Scores (Rheinhardt 2005). The Mean Composite Function Score is the average of the CompositeScore for each of the 34 reaches. This score reflects the condition of a given watershed in relation to itspotential (100) and can also be used to make general comparisons among watersheds, but at the level ofindividual functions (Rheinhardt 2005). Green Mill Run has a Mean Composite Score of 52 with a range of30-83.
Green Mill Run - Rehabilitation PlanTar-Pamlico Local Watershed Planning June 2005
16

Figure 6-1 Green Mill Run Reaches
-
10
20
30
40
50
60
70
80
90
100
- 10 20 30 40 50 60 70 80 90 100
Channel Condition
Rip
aria
n C
ondi
tion
Urban low order
Rural low order
Urban high order
0%
23%
71%
6%
In addition to watershed level analysis, the data was analyzed by stream order. The following table outlines theconditions for the six functions based on stream order (Table 6-2). The conditions are the same as outlined inthe previous paragraph. The majority of Green Mill Run in the eastern half of the watershed still has access toits floodplain and therefore falls in the somewhat altered category (urban high order). The low order streams inthe urban areas are incised and constricted by existing development contributing to their altered condition. Therural low order stream samples are all within Green Mill Run Catchment 3 in the western portion of thewatershed. The stream channel functions are somewhat altered while the riparian zone functions are altered,most likely resulting from their channelized nature.
Table 6-2. Green Mill Run Function Index
Altered51Altered43Altered42Habitat - Riparian ZoneSom Alt61Som Alt57Som Alt62Habitat - StreamSom Alt61Altered50Altered44Biogeochemistry - Rip. ZoneSom Alt56Altered53Som Alt59Biogeochemistry - StreamSom Alt61Altered50Altered44Hydrology - Riparian ZoneSom Alt60Altered50Som Alt68Hydrology - Stream
Urban High OrderUrban Low OrderRural Low OrderFunction
Function Index ranges from 0 - 100; Rural Low Order n=5; Urban Low Order n=18; Urban High Order n=9; Som Alt = SomewhatAltered
Green Mill Run - Rehabilitation PlanTar-Pamlico Local Watershed Planning June 2005
17

Function indicies were also tabulated by each catchment (Table 6-3). The following table gives an indication ofwhat conditions are like in each area of the watershed. These catchments are discussed in further detail in theFindings and Proposed Improvement Projects section. Table 6-3. Green Mill Run Function Index by Catchment
56394467366445Habitat - Riparian Zone72585458577255Habitat - Stream53475471397750Biogeochemistry - Rip. Zone63535151566453Biogeochemistry - Stream53475471397750Hydrology - Riparian Zone73524762537650Hydrology - Stream
ULULULULRL/ULUHUHSample Type
LakeElls.
CCFornesReedyGMR-3GMR-2GMR-1CatchmentFunction
Function Index ranges from 0 - 100; CC = Country Club catchment; Lake Ells. = Lake Ellsworth catchment; UH = Urban HighOrder; UL = Urban Low Order; RL = Rural Low Order
Urbanization in the watershed and poor stormwater management have led to highly unstable banks as evidencedby the low scores in the bank stability indicator. ECU researchers observed improperly constructed andineffective stormwater detention ponds in the watershed. The rural low order scores for RZC and NSC werevery low as riparian vegetation has been removed and converted to cropland. In contrast, the RZC and NSC aremuch higher for urban low order streams (Table 6-3). Most of these streams pass between single family homeswere the trees are preserved (Rheinhardt 2005). Although the streams are buffered, problems exist downstreamas described by Rheinhardt, et al., below:
There are serious problems associated with tributaries feeding into Green Mill Run in the more-downstream, urbanreaches near the Tar River. These tributaries enter the main stem at a very steep gradient. This is due to thetopography of the south side of the major rivers in eastern North Carolina, which are relatively high in elevationrelative to the main river channels. Because south-side tributaries have naturally steep gradients, they are muchmore susceptible to incision, particularly after the streams erode through the shell-rich, Yorktown formation. Oncethe Yorktown formation has been breached, the tributaries incise quickly. High, sustained discharges that causeincision can be reduced by detaining stormwater and channel grade can be re-established with check dams, wherepossible, especially where former floodplains remain. Hydrologic modeling would be needed to design a check damsystem that would not flood infrastructure.
In addition, the headwaters of these reaches have been piped and covered by impervious surfaces. Thiscontributes to the flashy nature of storm events due to lack of infiltration.
Green Mill Run - Rehabilitation PlanTar-Pamlico Local Watershed Planning June 2005
18

Table 6-4. Mean indicator scores, by stream order, for Green Mill Run watershed.
452538544333667971Mean
452143475928647769Urban HighOrder
442534523433638980Urban LowOrder
NA3541764548824644Rural LowOrder
Bankstability(SRC-7)
Habitatquality ofriparianzone(SRC-6)
Factorsaffectingriparianzone(SRC-5)
Factorsaffectingstream(SRC-4)
Channel-riparianzoneconnection(SRC-3)
Sedimentregime(SRC-2)
Instreamwoodystructure(SRC-1)
Near-streamcover (NSC)
Riparianzone cover(RZC)
Rural Low Order n=5; Urban Low Order n=18; Urban High Order n=11
7. HABITAT ANALYSIS
The majority of the land area in Green Mill Run has been developed or is used for agriculture. The naturalcommunities and habitats in these areas have been destroyed or are degraded. The forests provide a less alteredhabitat, although only 20% of the watershed is forest and these areas are subject to harvesting. Approximately1,293 acres of forest were untouched during the 20 year LULC study period. Most of these forested acres arewetlands identified by NCCREWS. These forest wetlands are found in the western side of the watershed and asa small strip along Green Mill Run. There is very little habitat outside of the wetland areas.
The wetland habitat was analyzed using NCCREWS (North Carolina Coastal Region Evaluation of WetlandSignificance). The evaluation is based on functions including water quality, hydrology, and habitat. The habitatfunctions are divided into terrestrial and aquatic. The wetlands in Green Mill Run are divided between flats(560 acres) and riverine wetlands (244 acres). Overall habitat in the riverine wetlands is rated high for 151 acresand medium for 93 acres. None of the area was rated low. The high ratings are attributed to terrestrial habitatalthough the majority of the wetlands rated medium for aquatic habitat. Overall habitat in the flats is rated highfor 525 acres, medium for 3 acres and low for 32 acres. The high rating is attributed to the terrestrial habitat asall of the area rated low for aquatic habitat. Yet when the NCCREWS data was compared to the current LULClayer, it was found that only 31 acres of the flats are not in pine plantation or drained areas. Although drainedwetlands and pine plantations may provide shelter and some food for fauna they are not considered high qualityhabitat. It is our opinion that the NCCREWS data layer had an error and pine plantations and drained areas weregiven a higher rating than appropriate according to the parameter description in the NCCREWS literature(DCM 1999).
The Natural Heritage Program has not identified any areas of significance in the Green Mill Run watershed.There is no documented the presence of endangered, threatened or rare species or species of concern.
Green Mill Run - Rehabilitation PlanTar-Pamlico Local Watershed Planning June 2005
19
8. WATERSHED SYSTEM RESPONSE SIMULATION (MUSIC)
In the first phase of the Tar-Pamlico watershed assessment, BLWI completed a pollutant loading analysis forcatchments within the targeted subwatersheds. This analysis was based on average annual constituent export byland use. In other words, a given area of a particular land use / land cover was determined to generate a specificamount of pollutant per year. This analysis was valuable to assess the distribution and relative magnitudes ofpollutant loading in the subwatersheds.
In this phase of the Tar-Pamlico watershed assessment, one of the goals is to assess the relative pollutantremoval performance of proposed structural stormwater Best Management Practices (BMPs) and restorationprojects. Various estimates of BMP pollutant removal efficiencies are available. One manner in which theperformance analysis could be undertaken is to apply average pollutant removal rates to each proposed BMP.This analysis does not, however, take into account hydrologic and hydraulic parameters, nor spatial andtemporal variations of such. Hydrologic parameters include precipitation, evapotranspiration, infiltration,runoff, and others. Hydraulic parameters include velocity, flow, depth, width, area, and others.
Pollutant loading is directly affected, and largely controlled, by hydrologic and hydraulic processes. Likewise,pollutant removal by structural stormwater BMPs is directly affected, and largely controlled, by hydrologic andhydraulic processes.
To address these important parameters, a simulation method was required. A Monte Carlo (or similar)simulation method could have been undertaken that accounted for the range of possible efficiencies for eachproposed BMP and restoration project. Given the project scope, the effort required to undertake this type ofanalysis was determined to be equal to or greater than that required to undertake a planning-level hydrologic,hydraulic, and water quality simulation model analysis. As such the software application MUSIC (Model forUrban Stormwater Improvement Conceptualization) was employed for such an analysis.
MUSIC is a tool that helps us understand stormwater runoff and associated pollutants in a given watershed andwas developed by the Cooperative Research Centre for Catchment Hydrology (CRCCH) in Victoria, Australia.The underlying mathematical representation of physical processes within the MUSIC system allows theapplication to be applied in a wide range of climatic conditions. The primary limitations determined arefreezing precipitation events and occult precipitation inputs. Neither of these are significant in the project area.The model has been used in various locations within Australia, New Zealand, and other areas. The MUSICsystem is directly applicable to the project area.
MUSIC provides the ability to simulate both the quantity and quality of stormwater runoff from catchments(watersheds). These watersheds can range from a single house block up to about 40 square miles. The modelingsystem simulates how this stormwater runoff passes through and interacts with a wide range of natural andconstructed management measures. The system simulates this by performing calculations using the modelequations and taking into account how the system changes over periods of time. By doing this, the modelingsystem can provide information on the downstream quantity and quality of the runoff.
The formal name of the MUSIC software application implies that it is limited to urban watershed analysis:Model for Urban Stormwater Improvement Conceptualization. The model is actually intended for analysis offorested, agricultural, and urban watersheds, with each of these being represented as the fundamental watershedtypes in the model. Analysis of urban systems is generally more complex than analysis of agricultural and
Green Mill Run - Rehabilitation PlanTar-Pamlico Local Watershed Planning June 2005
20

forested systems at equivalent detail. The term “Urban” in the formal name indicates that it is suitable toundertake the more complicated urban watershed analysis in addition to - not exclusive of - agricultural andforested systems.
BackgroundMany organizations, including government and nonprofit entities, have initiated watershed analysis,assessment, and planning efforts. These efforts are being undertaken in rural, suburban, urban, and mixedcharacter watersheds. Often these initiatives have focused on point source pollution, such as sewage dischargeand industrial effluent. Building on the success of these efforts, organizations are now turning their attention tonon-point source (NPS) pollution, such as agricultural and urban stormwater runoff. Associated with theseefforts may be goals such as economic, aesthetic, recreation, and flooding improvements. It is difficult toprevent stormwater from polluting creeks as runoff can be contaminated almost anywhere rain falls.Consequently, successful initiatives to manage stormwater will adopt a watershed approach. The diffusesources of stormwater pollution also demand a multidisciplinary approach. Successful initiatives may need tointegrate a range of analysis, design, and planning disciplines.
Unfortunately, progress has often been hampered because organizations have insufficient knowledge orexpertise in relevant disciplines or are unable to fully integrate the various disciplines. To provide support forentities undertaking watershed analysis, assessment, and planning efforts, the Cooperative Research Centre forCatchment Hydrology (CRCCH) is addressing these deficiencies through its Urban Stormwater QualityResearch Program. The program's research has culminated in MUSIC. As an aid to decision-making, MUSICpredicts the performance of stormwater quality management systems. It is intended to help organizations planand design (at a conceptual level) appropriate stormwater management systems for their watersheds.
A pilot version of MUSIC was released in March 2001 for testing in Australia by Melbourne Water, BrisbaneCity Council, and associated consultants. Following the eight-month testing period, MUSIC Version 1 wasreleased to the public at large. MUSIC Version 2 now extends the capabilities of the original program throughadditional calculation and presentation features, greater ability to export data for external analysis, andsubstantially smaller saved files.
The model's algorithms are based on the known performance characteristics of common stormwater qualityimprovement measures. These data, derived from research undertaken by CRCCH and other organizations,represent the most reliable information currently available in the field. Nonetheless, knowledge gaps remain.MUSIC will develop as the CRCCH, and the stormwater field generally, conducts further research into: thewatershed factors influencing the generation of stormwater pollutants and the characteristics of these pollutants;various physical, chemical, and biological processes influencing the performance of stormwater qualityimprovement facilities; and how aquatic ecosystems respond to stormwater-based pollutants.
ApproachMUSIC is an aid to decision-making. It enables evaluation of conceptual stormwater management systemdesigns to determine which are appropriate for specific watersheds. By simulating the performance ofstormwater quality improvement measures, MUSIC provides information as to whether proposed systems canmeet specified water quality objectives.
MUSIC runs on an event (single storm) or continuous (many storms) basis, allowing rigorous analysis of themerit of proposed strategies over the short-term and long-term. The adoption of a continuous simulation
Green Mill Run - Rehabilitation PlanTar-Pamlico Local Watershed Planning June 2005
21

approach is recommended in water quality modeling. This stems from the fact that impacts of poor stormwaterquality on aquatic ecosystem health are associated with cumulative pollutant loads and frequency of aquaticecosystem “exposure” to poor water quality. Pollutant loads delivered to receiving waters from many of thesmall storm events can make up in excess of 90% of the annual loads discharged from the watershed.
To effectively utilize the capabilities of the MUSIC system or another hydrologic simulation model employedfor water quality analysis, long term meteorological data must be employed. As calibration and verification ofthe model was beyond the scope of the watershed assessment, such meteorological data did not need to be fromwithin the project area but rather representative of the area. Additionally, the longer the span of the data record,the more valuable such data is for analysis as it provides a better representation of temporal parametervariability. The best meteorological data record available for such application was obtained from the NationalWeather Service weather station in Elizabeth City. This data record was employed for the analysis. Acontinuous 10-year, 1-hour time step simulation was used for this study. Data include rainfall and potentialevapotranspiration for the past ten years on a one hour time step. In addition to climate data, the subwatershedsize, the percent of impervious surface, the land cover/land use and the soil properties were utilized. Nitrogen,phosphorous, and total suspended solids loads were entered for baseflow and stormflow conditions.
MUSIC then simulates the performance of a group of stormwater management measures, configured in series(one after another) or in parallel (side by side) to form a “treatment train.” The stormwater managementmeasures available in MUSIC are listed in Table 8-1. MUSIC Treatment Options. The evaluation of theeffectiveness of the stormwater management system is based on a risk-based approach associated withexamination of (i) the long-term frequency in which the receiving aquatic ecosystem is subjected to exposure ofpollutant concentrations above a pre-specified threshold level and/or (ii) the long-term mean annual pollutantload delivered to the receiving waters.
The general model response to various parameters (including precipitation, soil permeability, channel traveltime, soil depth, and others) was observed during model development. As would be expected, precipitation andinfiltration parameters produced the most significant effects on model response. A formal sensitivity analysis isbeyond the scope of this assessment. Such is suggested prior to any subsequent model calibration andverification.
MUSIC is a powerful tool. It is not, however, a detailed design tool: as complex as some of the mathematicalmodels are within the model, MUSIC does not employ the degree of mathematical equations necessary fordetailed design of structural stormwater quantity and/or quality facilities. MUSIC is a conceptual design tool: aplanning level tool. As such, MUSIC was employed as one of several tools in the watershed analysis. Factorsother than stormwater quality also influence such efforts. MUSIC does not currently incorporate all aspects ofstormwater management that decision-makers must consider.
MUSIC was used in this project to help assess how individual components and groups of components in thewatershed will function. This analysis can then be used to aid engineers, planners, and others when makingdecisions as which project to implement.
Four project scenarios were analyzed in the model. The first was a depiction of existing conditions within thewatershed. Existing riparian buffers and wetlands were all added to the model to show the current pollutantremoval capabilities without any further improvements. The second scenario included all proposed projectswhile the third scenario only showed those projects with three or less property owners. The fourth and final
Green Mill Run - Rehabilitation PlanTar-Pamlico Local Watershed Planning June 2005
22

scenario included only those projects that occurred on public land. The purpose of the third and fourth scenariosis to determine whether a significant improvement to water quality in the watershed is realized when only theeasier projects are undertaken.
Table 8-1. MUSIC Treatment Options
Generic Treatment Nodes are used to enable the user to define “transfer functions” for flowsand water quality for stormwater quality treatment measures which are not explicitly modeledin MUSIC. Generic nodes can also be used to model such situations as flow diversion, flowdilution, contamination by sewer overflow, etc.
Generic TreatmentNodes
Gross Pollutant Traps are devices for effective removal of solids conveyed by stormwaterwhich are typically larger than 5 mm. Often, they are used as the first treatment element in astormwater treatment train. There are many proprietary gross pollutant traps currently suitablefor use in urban catchments and information on their performance is becoming available.
Gross Pollutant Traps
Sedimentation Basins are open water bodies aimed predominantly at the removal of coarse andmedium particles. Typically they operate at high hydraulic loading rates, and have fairly shortdetention times. The treatment of stormwater in detention basins is achieved almost entirely bythe temporary detention of stormwater to facilitate settling of suspended solids. No otherbiological or biochemical processes are simulated within the Sedimentation Basin node.
Sedimentation Basins
Ponds are stormwater treatment measures such as open water bodies (without significantshallow vegetated areas in the predominant flow paths) and ornamental ponds. The treatmentof stormwater is predominantly associated with the temporary detention of stormwater tofacilitate settling of suspended solids. Other treatment processes promoted in pond systemsinclude phytoplankton assimilation of soluble nutrients and ultraviolet disinfection. Theseprocesses are currently not explicitly included in the modeling algorithm. The model also hasthe capability to model the reuse of treated stormwater stored in ponds.
Ponds
Bioretention Systems promote the removal of particulate and soluble contaminants by passingstormwater water through a filter medium. The type of filter medium determines theeffectiveness of the pollutant removal, with material of lower hydraulic conductivity providingthe most efficient pollutant removal (owing to longer detention time). Typical filter materialranges from gravel (~ 10 mm) to fine sand (~0.1 mm).
Bioretention Systems
Wetlands are an effective stormwater treatment measure for the removal of fine suspendedsolids and associated contaminants, as well as soluble contaminants. These systems utilise acombination of physical, chemical and biological processes in removing stormwaterpollutants. They are commonly used as "end-of-pipe" stormwater treatment systems, butrecent research has shown that they are scalable for application as near-source controlmeasures. The model also has the capability to model the reuse of treated stormwater stored inwetland systems.
Wetlands
Vegetated Swales are open channel systems which utilise vegetation to aid the removal ofsediment and suspended solids. These systems are subjected to fairly high hydraulic loadingand the removal efficiency is dependent on the density and height of the vegetation in thechannel.
Vegetated Swales
Buffer Strips are commonly used as a source control measure, particularly for management ofroad runoff. They are effective in the removal of coarse to medium-size sediments and can beused as an effective pre-treatment measure for bioretention systems.
Buffer StripsDescriptionTreatment
Table from the MUSIC v. 2.0 Help file
Green Mill Run - Rehabilitation PlanTar-Pamlico Local Watershed Planning June 2005
23

ResultsFrom the MUSIC simulation results, two primary output components were utilized to analyze the treatmentremoval benefit of each project: 1) the relative mass reduction of pollutants by the project; and 2) the relativepollutant removal efficiency of the project. This can be thought of as follows: A removal rate of 90% is great,but is not that significant if there was very little loading to begin with relative to other areas in the watershed. Aremoval rate of 5% may seem bad, but if that project removes 5 times the pollutant mass as another project inthe watershed then it may be worthwhile to implement. This was quantitatively assessed in relative terms bynormalizing the mass reduction and percent removal of each project to the maximum mass reduction andpercent removal of any project within a watershed. Each of the pollutants were equally weighted as was themass reduction and percent removal for each pollutant. From this, a score was generated for each projectrelative to all other projects within a watershed.
The model assumes implementation of all projects, therefore the results show which projects are the mostbeneficial in the treatment train. The most important links (projects) in the treatment train are discussed insection 9. No one type of project consistently outperformed others. The realized removal rates are highlydependent upon the design, construction, and long term condition of the proposed measures. Sediment fromunstable streambanks is a source of water quality degradation and stabilizing these banks can improve waterquality. The model does not evaluate stream stability, therefore some projects may appear to do little to improvewater quality but may be important to overall watershed health.
In addition to comparing specific projects in the treatment train, model results were analyzed to determine theimprovement over existing conditions for the different model scenarios (Maps 8-1, 8-2, and 8-3 and Table 8-2).Each set of removal numbers is cumulative. For example, the numbers at GM2 represent not only the pollutantremoval in that catchment but also the pollutant removal from all other waters entering from the LakeEllsworth, GM3, and Country Club catchments. Downstream pollutant removal efficiencies may be lower thanupstream efficiencies due to cumulative pollutant inputs.
The estimated pollutant removal rates are significantly reduced in the “3 or less property owners” and “onlypublic property” simulation scenarios. Thus, projects must be implemented on multiple private properties withmultiple landowners for significant pollutant removal rates to be realized. This is generally the case in mostareas of the watershed.
Table 8-2. Watershed Estimated Pollution Removal Improvement
353Projects on public property232512Projects with ≤3 property owners265116All projects
%TP%TN%TSS
Green Mill Run - Rehabilitation PlanTar-Pamlico Local Watershed Planning June 2005
24

Map 8-1 Watershed Estimated Pollution Removal Improvement – All Proposed Projects
Total Suspended Solids 16%Total Phosphorus 51%Total Nitrogen 26%
Watershed Outlet
Subwatershed 58 (GM2)Total Suspended Solids 24%Total Phosphorus 57%Total Nitrogen 34%
Subwatershed 11 (Lake Ellsworth)Total Suspended Solids 7%Total Phosphorus 4%Total Nitrogen 3%
Subwatershed 75 (Country Club)Total Suspended Solids 99%Total Phosphorus 99%Total Nitrogen 98%
Subwatershed 52Total Suspended Solids 60%Total Phosphorus 75%Total Nitrogen 57%
Subwatershed 42 (GM3)Total Suspended Solids 89%Total Phosphorus 99%Total Nitrogen 72%
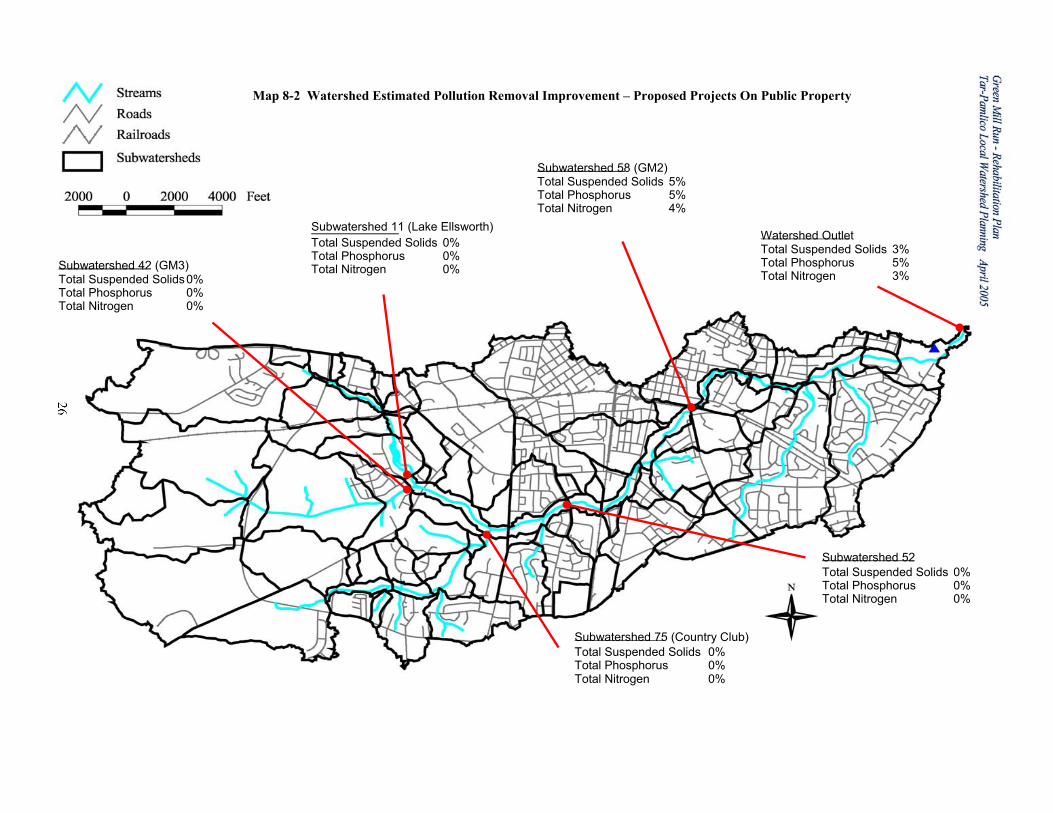
Map 8-2 Watershed Estimated Pollution Removal Improvement – Proposed Projects On Public Property
Total Suspended Solids 3%Total Phosphorus 5%Total Nitrogen 3%
Watershed Outlet
Subwatershed 58 (GM2)Total Suspended Solids 5%Total Phosphorus 5%Total Nitrogen 4%
Subwatershed 11 (Lake Ellsworth)Total Suspended Solids 0%Total Phosphorus 0%Total Nitrogen 0%
Subwatershed 75 (Country Club)Total Suspended Solids 0%Total Phosphorus 0%Total Nitrogen 0%
Subwatershed 52Total Suspended Solids 0%Total Phosphorus 0%Total Nitrogen 0%
Subwatershed 42 (GM3)Total Suspended Solids 0%Total Phosphorus 0%Total Nitrogen 0%
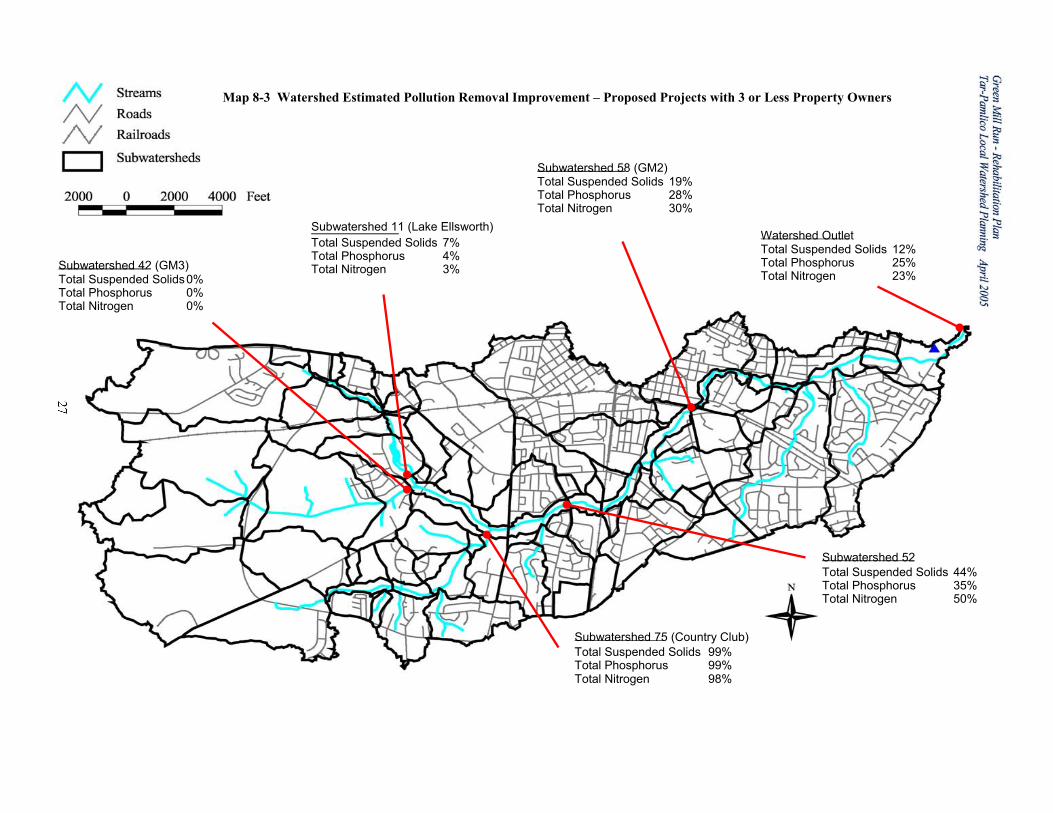
Map 8-3 Watershed Estimated Pollution Removal Improvement – Proposed Projects with 3 or Less Property Owners
Total Suspended Solids 12%Total Phosphorus 25%Total Nitrogen 23%
Watershed Outlet
Subwatershed 58 (GM2)Total Suspended Solids 19%Total Phosphorus 28%Total Nitrogen 30%
Subwatershed 11 (Lake Ellsworth)Total Suspended Solids 7%Total Phosphorus 4%Total Nitrogen 3%
Subwatershed 75 (Country Club)Total Suspended Solids 99%Total Phosphorus 99%Total Nitrogen 98%
Subwatershed 52Total Suspended Solids 44%Total Phosphorus 35%Total Nitrogen 50%
Subwatershed 42 (GM3)Total Suspended Solids 0%Total Phosphorus 0%Total Nitrogen 0%

9. FINDINGS AND PROPOSED IMPROVEMENT PROJECTS
The previous sections explained the investigative methods used in this study and the results found. The resultswere analyzed to determine the projects that would help rehabilitate each catchment. The projects aresummarized in Table 9-1. Map 9-1 Existing Watershed Conditions and Proposed Improvement Projectsillustrates the locations of the projects. The NC Ecosystem Enhancement Program provides an excellentresource for landowners and other groups interested in undertaking restoration and water quality improvementprojects. The publication, A Guide for North Carolina Landowners; Financial Incentives and TechnicalAssistance Programs Which Apply to Wetlands, Streams and Streamside (Riparian Areas), was developed in1999 and can be found at: http://www.nceep.net/business/landowner/landowng.pdf.
Green Mill Run Catchment 1Green Mill Run Catchment 1 contains the lower portion of Green Mill Run from its confluence with the TarRiver up to the railroad tracks near 14th Street. Portions of Green Mill Run have a wide floodplain while otherportions are constricted by existing development. Flooding is a concern within this catchment. The catchment isalmost at full buildout with only a small increase expected in the already high percentage of impervious area.Large amounts of stormwater runoff from the surrounding developed areas contribute to degraded channelconditions. In this catchment, Green Mill Run was determined to be altered by the stream assessment. Eventhough the area along Green Mill Run is designated as ‘Conservation Open Space’ by the Greenville FutureLand Use Plan, it is recommended that that zone be expanded to adjacent forested areas and vacant lots toinclude more of the riparian zone and floodplain. Locations for much needed BMPs are not readily availabledue to the level of existing development. East Carolina University is the largest landowner in this catchment;consultation is needed with the appropriate authorities to determine the most feasible locations for BMPimplementation within the University. Options may include bioretention areas within existing parking areas,rain collection systems, and existing BMP retrofitting. The City of Greenville is planning to install abioretention area near the tennis courts in Elm Street Park. Green Mill Run in Green Springs Park off of 5thStreet is one of the only places large enough to attempt restoration. There is bank stabilization potential, as wellas the possibility to return the channel to a more natural dimension. Wetlands are also proposed for the riparianzone within the park. This project is one of two projects located on public property in the watershed.
Reedy Branch CatchmentReedy Branch is an eroding, incised stream that flows through older, well-established residential areas. Futuregrowth is not expected, as the catchment is almost at full buildout. Even though Reedy Branch scored in thesomewhat altered category of the stream assessment, it needs bank stabilization. This would provide instreamhabitat and improve water quality. There is limited opportunity for stream restoration due to limited space andnumerous landowners. The only open space within the catchment is located in Jaycee Park. Reedy Branchneeds buffer enhancement within the park. A few vacant lots are located along Greenville Boulevard, but wouldlikely be cost-prohibitive to use as stormwater treatment due to land cost.
Fornes Branch CatchmentThe Fornes Branch catchment is also almost at full buildout with little future development expected. Theheadwaters are located in the highly impervious Colonial Mall area. Due to degraded channel condition, FornesBranch had the lowest average stream assessment score (altered) in the entire Green Mill Run watershed. Thereis limited opportunity for stream restoration due to limited space and numerous landowners. A breachedstormwater treatment area is adjacent to and draining the mall parking area. This area could be reworked toprovide more stormwater treatment. Raingardens could also be constructed nearby in the two large grassy
Green Mill Run - Rehabilitation PlanTar-Pamlico Local Watershed Planning June 2005
28

triangles within the mall parking area. A few small existing dry detention areas are located along GreenvilleBoulevard at various commercial establishments.
Green Mill Run Catchment 2Green Mill Run Catchment 2 contains the middle portion of Green Mill Run from the railroad tracks near 14thStreet to just upstream of Dickinson Avenue. The downstream end of Green Mill Run in this catchment haswide floodplains and existing wetlands. Flooding is a concern near 14th and Charles Streets. In the upstreamportion of this catchment Green Mill Run still has a wide riparian zone but is incised. According to the streamassessment, this catchment is only somewhat altered and actually scored the highest of any other catchment inthe entire watershed. This rating only applies to the main stream as there were no sampling points located onany of the tributaries in the catchment. The remainder of the watershed is partially developed in residential andhigh density commercial with the potential for future development. Even though the area along Green Mill Runis designated as ‘Conservation Open Space’ by the Greenville Future Land Use Plan, it is recommended thatthat zone be expanded to adjacent forested areas and vacant lots to include more of the riparian zone andfloodplain. BMPs are recommended on the drainage near Rose High School as well as near the ECU SportsComplex. There are many existing BMPs to treat the large commercial areas in the southern portion of thecatchment. The areas should be maintained and retrofitted where needed to maximize their stormwatertreatment potential.
Country Club CatchmentThe Country Club catchment contains an unnamed tributary that flows through the Greenville Country Clubbefore emptying into Green Mill Run. This catchment is relatively undeveloped when compared to the rest ofthe watershed. However, it is quickly developing and could easily go from 18% to 51% impervious over thenext few decades. The streams within the catchment fell into the altered category due to the lack of riparianbuffer and degraded channel conditions. The current agricultural channels need buffers before developmentcommences. Buffer improvement, in conjunction with future BMPs, would ensure that water quality andhydrology are not overly degraded in the future. A large stream restoration project is proposed for the streamswithin the Greenville Country Club. The model shows this as one of the most efficient links (projects) in thetreatment train. Buffer projects 11 and 12 are also beneficial to pollutant removal according to the modelresults.
Green Mill Run Catchment 3The Green Mill Run Catchment 3 contains the Green Mill Run headwaters upstream from Dickinson Road. Thiscatchment is a quickly urbanizing agricultural watershed. Many of the farms are currently being converted tolow and medium density residential development. The catchment is currently only 7% impervious but mayeventually be 56% impervious in the next few decades as development increases. The headwaters in the westernhalf of the catchment are zoned for industrial uses. Green Mill Run is already deep and receives large amountsof stormwater flow. The riparian zones within the catchment fell into the ‘Altered’ category while the streamchannels fell into the ‘Somewhat Altered’ category. It is important to install buffers or other stormwatertreatment options before the area becomes developed and opportunities diminish. The model results indicatebuffer projects 15 and 16 have high pollutant removal efficiencies.
Lake Ellsworth CatchmentThe Lake Ellsworth catchment contains an unnamed tributary that flows into Lake Ellsworth at thenorthwestern portion of the watershed. The catchment is relatively undeveloped compared to the rest of thewatershed, however, it is quickly urbanizing to high density residential and medical areas. The impervious area
Green Mill Run - Rehabilitation PlanTar-Pamlico Local Watershed Planning June 2005
29

could go from the current 18% up to 51% in the following few decades. The catchment scored high on thestream assessment (somewhat altered) and should be protected from development impacts by buffers and otherBMPs to minimize stormwater inputs. There is a breached farm pond near the radio towers in the northernportion of the catchment; this pond could be reworked to be able to hold and treat water from the upstream highdensity residential areas.
Table 9-1. Proposed Improvement Projects
168 acreswetland enhancementBetween Stantonsburg Road and US 26417
345,000 sqftriparian buffersAllen Road and Teakwood Drive (UT toGreen Mill Run)
16
350,000 sqftriparian buffersHardee Property - Allen Road (UT toGreen Mill Run)
15BMPs - stormwater wetlandsBeasley Broadcasting Radio Towers14
180,000 sqftriparian buffersBypass Properties/Thigpen - US 264 (UTto Green Mill Run)
13
465,000 sqftriparian buffersAllen Road and Dickenson Avenue (UT toGreen Mill Run)
12
339,600 sqftriparian buffersManning/Moye Properties (UT to GreenMill Run)
11
125,000 sqftriparian buffersWilliams Road and Dickenson Avenue(UT to Green Mill Run)
10
110,000 sqftriparian buffersBrasswoods Apartments (UT to Green MillRun)
9180,000 sqftriparian buffersBurrows Property (UT to Green Mill Run)8
restoration: 3,716 linear feetdaylighting: 585 linear feet
stream restoration/daylightingGreenville Country Club (UT to GreenMill Run)
7BMP - stormwater wetlandsJH Rose High School6BMP - stormwater wetlandArthur Property - Evans Street5
BMP - stormwater wetland andbioretention cells
Colonial Mall Parking Lot4BMP - stormwater wetlandFicklen Drive3BMP - bioretentionElm Street Park2
2,460 linear feetBank stability, stream restorationand stormwater wetlands
Green Springs Park (Green Mill Run)1Size*TypeLocationNo.
*Riparian buffers sizes are given in square feet, a buffer width of 50 feet on each side of the stream was assumed for all projects
Green Mill Run - Rehabilitation PlanTar-Pamlico Local Watershed Planning June 2005
30
10. CONCLUSION
The Green Mill Run watershed has two drastically different sections. The eastern half of the watershed hasalready been developed and contains little opportunity for treatment. The western half of the watershed is aquickly urbanizing watershed with networks of unbuffered ditches and channels. It is important to installbuffers or other stormwater treatment options before the area becomes developed and opportunities diminish.Various types of urban BMPs, including bioretention, constructed wetland, and vegetated swales, should beimplemented as future development comes in. It is recommended that new development within the watershedfollow strict stormwater guidelines to reduce future impacts to water quality and flooding.
Green Mill Run - Rehabilitation PlanTar-Pamlico Local Watershed Planning June 2005
31

this page intentionally left blank
Green Mill Run - Rehabilitation PlanTar-Pamlico Local Watershed Planning June 2005
32

�����
���
� �������� �
�
���� �����
��������� ����
��������������
�������� ����
����������
�� � ���� � ����
������
��
��������
�� ������!�
" #������
�$�% ���!�����"�!�
$����
�#��
�
&��
� ��&�����
������ ����
��� �����������"
������
"� �
����
���
� ��� #
���
��
$�� �������"�!�
��#�����
��� ���
�� � ���
�
&'����
����
��������
��� �������"�!�
���%
���!��
���"�!�
&'� ���"�!�
���� �����'���
������'���
��$ ��'����
(�)!� ����
� �� !����$��
&���
���
�� ����
��
��
��
�� ��
����
��
�
�
�
�
�
��
�
�
�*++ + �*++ ����
(
%���,
%����%���-
��������� �'
������" �� '
� ��" �� '
&��� �&���
. �������� ����"�//�
�0������.�������� �����������
. ����"�.
. ��������������)������� �
.�������&�� !�����)������� �
�0���������� ����$������ �� ��#
���
���� ��&�� '#���
. ������ ��#���� ����1��'�� �#���
�����������������������������������������������
�0������$��� '���&����������. ����4#� !�#����. 5� �

this page intentionally left blank
Green Mill Run - Rehabilitation PlanTar-Pamlico Local Watershed Planning June 2005
34
11. REFERENCES
BLUE: Land, Water, Infrastructure, PA. “Watershed Characterization, Phase I, Tar-Pamlico River BasinCataloging Unit 03020103,” prepared for NC Ecosystem Enhancement Program, NC Department ofEnvironment and Natural Resources. January 2004.
Buck Engineering, PC. “Green Mill Run Feasibility Study,” TIP Project No. R-3407WM, prepared for NC Department of Transportation, March 2002.
Division of Coastal Management. “NC-CREWS: North Carolina Coastal Region Evaluation of Wetland Significance,” NC Department of Environment and Natural Resources. May 1999.
Greenville Planning Department, Zoning and Land Use Plan data, 2004.
MUSIC Development Team. “MUSIC (Model for Urban Stormwater Improvement Conceptualisation) UserManual,” Version 2.0, CRC for Catchment Hydrology, December 2003. http://www.toolkit.net.au/music
North Carolina Wetlands Restoration Program. “A Guide for North Carolina Landowners: Financial Incentivesand Technical Assistance Programs Which Apply to Wetlands, Streams and Streamside (Riparian)Areas,” NC Department of Environment and Natural Resources, Division of Water Quality, September1999. http://www.nceep.net/business/landowner/landowng.pdf
Pitt County Planning Department. “Pitt County Comprehensive Land Use Plan 2002,” adopted April 15, 2002.
Pitt County Planning Department. “Pitt County Zoning Ordinance,” effective November 3, 2003.
Rheinhardt, R., M. Brinson, R. Christian, K. Miller, G. Meyer, et al. “Development of Ecological Assessmentsfor Planning Coastal Plain Stream Restoration in Coastal North Carolina,” Draft, East CarolinaUniversity, prepared for NC Ecosystem Enhancement Program, NC Department of Environment andNatural Resources. March 2005.
Schueler, TR and HK Holland. “The Practice of Watershed Protection: Techniques for protecting our nation’sstreams, lakes, rivers and estuaries. The Center for Watershed Protection, Ellicott City Maryland. 2000.
State of North Carolina Governor's Office of State Planning Center for Geographic Information and Analysis.“A Standard Classification System for the Mapping of Land Use and Land Cover,” January 1994.
US Army Corps of Engineers. “Greens Mill Run Section 205 Study, Report on Findings,” November 2, 2004
Green Mill Run - Rehabilitation PlanTar-Pamlico Local Watershed Planning June 2005
35