woody feedstocks 2019 state of technology report
TRANSCRIPT

The INL is a U.S. Department of Energy National Laboratoryoperated by Battelle Energy Alliance
INL/EXT-20-57181-Revision-0
Woody Feedstocks 2019State of TechnologyReport
Damon S Hartley, David N Thompson,Hao Cai
March 2020

INL/EXT-20-57181-Revision-0
Woody Feedstocks 2019 State of Technology Report
Damon S Hartley, David N Thompson, Hao Cai
March 2020
Idaho National LaboratoryIdaho Falls, Idaho 83415
http://www.inl.gov
Prepared for theU.S. Department of Energy
Office of Energy Efficiency and Renewable EnergyUnder DOE Idaho Operations Office
Contract DE-AC07-05ID14517

1
Milestone Completion Report
WOODY FEEDSTOCKS 2019 STATE OF TECHNOLOGY REPORT
Damon Hartley, David N. Thompson, and Hao Cai
SEPTEMBER 30, 2019

2
Milestone Completion Report
BWD#: 1.1.1.2.DL.1Type: MilestoneWBS #: 1.1.1.2
Completion Date: September 30, 2019Scheduled Completion: September 30, 2019Platform Area: Feedstock Supply and Logistics
Milestone Title: Woody Feedstock 2019 State of Technology Report
Authors: Damon Hartley, David N. Thompson, and Hao Cai (Argonne) and
Project Name: ProjectLeader:
Feedstock Supply Chain AnalysisDavid N. Thompson
Participating Researchers Neal Yancey, Jaya Tumuluru, Jeffrey Lacey, David Thompson, andVicki Thompson
Key Words: analysis, state of technology, feedstock, woody
EXECUTIVE SUMMARY
The U.S. Department of Energy promotes production of advanced liquid transportationfuels from lignocellulosic biomass by funding fundamental and applied research thatadvances the state of technology (SOT). As part of its involvement with this overall mission,Idaho National Laboratory completes annual SOT reports for nth-plant biomass feedstocklogistics. The purpose of the SOTs is to provide the status of feedstock supply systemtechnology development for biomass to biofuels, based on actual data and experimentalresults relative to technical targets and cost goals from specific design cases.
The 2019 Woody Feedstock SOT presents the State of Technology for feedstock supply to three individual thermochemical conversion pathways that utilize woody feedstocks: Indirect Liquefaction (IDL), Catalytic Fast Pyrolysis (CFP), and Algal-blend Hydrothermal liquefaction (AHTL). The 2019 reactor throat delivered feedstock costs were found to be $63.54/dry ton, $70.15/dry ton and $70.31/dry ton, respectively (2016$).

3
Milestone Completion Report
Table of Contents
EXECUTIVE SUMMARY......................................................................................................... 2
Table of Contents........................................................................................................................3
1. BACKGROUND................................................................................................................. 5
Progression of Feedstock Supply System Designs................................................................... 5
2. DELIVERED FEEDSTOCK COST MODELS.................................................................... 7
2.1 Feedstock Supply Systems for Indirect Liquefaction (IDL)................................................8
2.1.1 2019 SOT for Feedstock Supply to IDL.......................................................................8
2.1.1.1 Description of Logistic System Designs................................................................ 8
2.1.1.2 Cost Summary and Energy Usage....................................................................... 10
2.1.1.3 Sensitivity Analysis of Costs...............................................................................12
2.2 Feedstock Supply Systems for Catalytic Fast Pyrolysis (CFP)..........................................14
2.2.1 2019 SOT for Feedstock Supply to CFP.................................................................... 15
2.2.1.1 Description of Logistic System Designs.............................................................. 15
2.2.1.2 Cost Summary and Energy Usage....................................................................... 16
2.2.1.3 Sensitivity Analysis of Costs...............................................................................18
2.3 Feedstock Supply Systems for Algal-blend Hydrothermal Liquefaction (AHTL)............. 20
2.3.1 2018 SOT for Logging Residue Supply to AHTL...................................................... 20
2.3.1.1 Description of Logistic System Designs.............................................................. 20
2.3.1.2 Cost Summary and Energy Usage....................................................................... 22
2.3.1.3 Sensitivity Analysis of Costs...............................................................................22
3. INDUSTRIAL RELEVANCE OF THE FEEDSTOCKS....................................................25
4. QUALIFICATION OF THE FEEDSTOCKS FOR RENEWABLE IDENTIFICATION NUMBERS............................................................................................................................... 25
5. SUSTAINABILITY CONSIDERATIONS.........................................................................27
6. SUMMARY.......................................................................................................................28
7. REFERENCES.................................................................................................................. 29
APPENDIX A – 2018 Woody State of Technology Feedstocks Logistics Design and Assumptions for Forest Residue Supply to IDL.........................................................................37
A.1 Harvest and Collection.............................................................................................39
A.2 Storage.................................................................................................................... 40

4
Milestone Completion Report
A.3 Landing Preprocessing.............................................................................................41
A.4 Transportation and Handling....................................................................................42
A.5 Handling, Refinery Operations.................................................................................43
APPENDIX B – 2018 Woody State of Technology Feedstock Logistics Design and Assumptions for Clean Pine Supply to CFP....................................................................................................44
B.1 Harvest and Collection............................................................................................ 46
B.2 Storage.................................................................................................................... 47
B.3 Transportation and Handling................................................................................... 48
B.4 Landing Preprocessing............................................................................................ 49
B.5 Refinery Operations.................................................................................................49
APPENDIX C – 2018 Woody State of Technology Feedstock Logistics Design and Assumptions for Forest Residue Supply to AHTL.......................................................................................... 51
C.1 Harvest and Collection.............................................................................................52
C.2 Storage.................................................................................................................... 52
C.3 Landing Preprocessing.............................................................................................53
C.4 Transportation and Handling....................................................................................54
C.5 Processing Operations..............................................................................................55

5
Milestone Completion Report
BACKGROUND1.
The U.S. Department of Energy (DOE) promotes production of advanced liquidtransportation fuels from lignocellulosic biomass by funding fundamental and appliedresearch that advances the state of technology (SOT) to transform renewable biomass intocommercially viable biofuels. To gauge progress toward DOE objectives, the BioenergyTechnologies Office (BETO) sets cost and technology targets and an annual SOT reportprovides the status of technology relative to these goals with actual data and experimentalresults.
The BETO Feedstock Supply and Logistics Program developed performance targets thatare directed at mobilizing large amounts of biomass. One target is to validate feedstocksupply and logistics systems that can deliver feedstock at or below $85.51/dry ton (2016$),including both grower payment and logistics cost through in-feed of the conversion reactor(USDOE 2017).
Feedstocks are essential to achieving BETO goals because the cost, quality, and quantityof feedstock available and accessible at any given time limits the maximum volume ofbiofuels that can be produced. The 2016 U.S. Billion Ton report (USDOE 2016) providesseveral biomass supply scenarios that show potential biomass resources that could bedeveloped under different sets of assumptions regarding yield improvements over time. Someof these scenarios lead to a sustainable national supply of more than 1 billion tons of biomassper year by the year 2030.
In accordance with the 2017 Multi-Year Program Plan (USDOE 2017), terrestrialfeedstock supply and logistics focuses on (1) reducing the delivered cost of sustainablyproduced biomass, (2) preserving and improving the physical and chemical qualityparameters of harvested biomass to meet the individual needs of biorefineries and otherbiomass users, and (3) expanding the quantity of feedstock materials accessible to thebioenergy industry. This is done by identifying, developing, demonstrating, and verifyingefficient and economical integrated systems for harvest and collection, storage, handling,transport, and preprocessing raw biomass from a variety of crops to reliably deliver therequired supplies of high-quality, affordable feedstocks to biorefineries as the industryexpands. The elements of cost, quality, and quantity are key considerations when developingadvanced feedstock supply concepts and systems (USDOE 2015).
Progression of Feedstock Supply System Designs
Feedstock supply systems are highly complex organizations of operations required to move and transform biomass from a raw form at the point of production into a formatted, on-spec feedstock at the throat of the reactor. Feedstock logistics can be broken down into unitoperations, including harvest and collection; storage; transportation; preprocessing; and queuing and handling. Designing economic and environmentally sustainable feedstock supplysystems, while providing necessary resource quantities at the appropriate quality, is critical to growth of the bioenergy industry.

6
Milestone Completion Report
Research on feedstock supply systems aims to reduce delivered cost, improve or preservefeedstock quality, and expands access to biomass resources. Through 2012, BETO-fundedresearch on feedstock supply systems focused on improving conventional feedstock supplysystems. Conventional feedstock supply system designs rely on existing technology and systems to supply feedstock to biorefineries (Figure 1). Conventional designs tend to be vertically integrated, with a specific conversion process or biorefinery; they also place allburden of adapting to feedstock variability on the biorefinery. Within the constraints of localsupply, equipment availability, and permitting requirements, biorefineries strive to optimizeefficiencies and capacities. However, this approach makes the system vulnerable to feedstockvariability.
Figure 1. Conventional feedstock supply system designs rely on existing technologies and biomass to supply biorefineries, but they require biorefineries to adapt to the variability of
feedstock.
Conventional designs are currently the backbone of the emerging biofuels industry.However, conventional feedstock supply systems have limitations that restrict widespreadimplementation on a national scale (Hess et al. 2009, Searcy and Hess 2010). The originalthought was that the conventional supply system designs could be successful in geographical areas that have a concentrated supply of easily accessible and low-costbiomass resources (such as corn stover in the Midwestern United States and pine in thesoutheastern United States). Moving outside these select regions, the feedstock supplysystem must be adapted to accommodate a changing cost, quality, and conversion facility’ssize constraints.
Conventional systems can only address feedstock quality indirectly through passivecontrols such as resource selection or best management practices. An example of this is thehigh-capacity grapple used in the DOE-funded Auburn High Tonnage Biomass LogisticsDemonstration Project (Sokhansanj et al. 2014), which prevented woody material frombeing dragged along the ground during skidding, preventing ash entrainment. Whenpositioned in a highly productive single resource area, biorefineries can be selective in contracting only those feedstocks that meet their specifications. However, biomass quality(e.g., ash and moisture content) is highly variable both spatially and temporally (Kenney etal. 2013) and, in any given year, passive controls might not provide enough quality controlfor feedstock to meet the desired in-feed characteristics. Therefore, biorefineries that relyon conventional designs are constrained to local resources and are limited in the expansionof the collection radius, which limits plant size (Graham et al. 2013).

7
Milestone Completion Report
Several analyses have shown that as the biofuels industry expands past the highlyproductive regions, conventional supply systems will fail to meet supply requirements(Argo et al. 2013, Bonner et al. 2014, Hess et al. 2009, Lamers et al. 2015, Muth et al.2014). To meet the demands of future industry, the feedstock supply system will berequired to expand beyond conventional systems in certain areas, to what has been termed“advanced” feedstock supply systems (AFSS) (Hess et al. 2009, Searcy and Hess 2010,Jacobson et al. 2014). Advanced systems incorporate innovative methods of material handling, preprocessing and supply chain configurations.
The 2019 Woody SOT presents current supply chain designs for three conversion pathways that utilize woody biomass as a feedstock: Indirect Liquefaction (IDL), Catalytic Fast Pyrolysis (CFP) and Algal-blend High Temperature Liquefaction (AHTL). IDL is a gasification technology and has the least complicated feedstock supply system, primarily because the feedstock quality requirements for gasification technologies are less stringent than those of pyrolysis technologies, however, the conversion operations are more expensive. For gasification, the particle size can be larger and the quantity of ash can be higher, both aspects that reduce the amount of preprocessing needed. In 2019, the design was changedfrom a conventional system that delivered unpreprocessed forest residue chips directly to the biorefinery to a system that delivers a 50% clean pine - 50% forest residue blend. By blending the feedstocks, the total ash content is reduced resulting in higher conversion yields.
CFP requires a finely-ground, low ash, high quality feedstock. The 2019 SOT utilizes a 50% clean pine - 50% forest residue blend as the model feedstock, to remain in alignmentwith the feedstocks that are being tested by conversion for the 2022 verification. The choice to utilize a blend of feedstocks relaxes the constraint that the facility be located in an area with large inventories of available Renewable Identification Number (RIN)-qualified pine and lessens the transport distances. For the CFP case, the location of the biorefinery is in the Piedmont Region on the South Carolina/Georgia border.
AHTL, similar to the IDL case, utilizes logging residue but requires a much lower total quantity of material, and has the added requirement that the final feedstock material must be ground to a smaller size. Additionally, the location of the resource has been specified as the Gulf coast region, to meet the requirements for algal growth.
DELIVERED FEEDSTOCK COST MODELS2.The Biomass Logistics Model (BLM) (Cafferty et al. 2013a) was used to model feedstock
supply system cost and energy consumption for the 2019 Woody SOT. The BLM incorporatesinformation from a collection of databases that provide (1) engineering performance data forhundreds of equipment systems, (2) spatially explicit labor cost datasets, and (3) local tax andregulation data. The BLM’s analytic engine is built in the system dynamics software packagePowersim™. The BLM is designed to work with thermochemical and biochemical-basedbiofuel conversion platforms and to accommodate a range of lignocellulosic biomass types(e.g., residues, short-rotation woody and herbaceous energy crops, woody residues, and algae).

8
Milestone Completion Report
BLM simulates the flow of biomass through the entire supply chain, while tracking changes in feedstock characteristics (i.e., moisture content, dry matter, ash content, and dry bulk density)and calculating cost and energy consumption (Cafferty et al. 2013a). These estimates are theninput into the greenhouse gas, regulated emissions, and energy use in transportation model toperform a cursory farm gate-to-plant gate lifecycle assessment on greenhouse gas (GHG)emissions.
2.1 Feedstock Supply Systems for Indirect Liquefaction (IDL)
The 2019 IDL conversion pathway assumes annual nth-plant delivery of 725,000 dry tons of woody feedstock, with total ash ≤ 3 wt%, moisture content ≤ 10% (wet basis), and particle size of 2” chips (Table 1). The IDL conversion pathway has a 2022 delivered feedstock cost target of $63.76/dry ton (2016$), including dockage. For the 2019 IDL Conversion SOT, the Conversion Platform sought to improve the overall biofuel yield, testing a 50% clean pine – 50% forest residue blend. The 2019 Feedstock SOT therefore has been developed to provide the system design and economics for this blend, which supplies the blended feedstock at a total of 1.75 wt% ash.
Table 1. Delivered feedstock composition assumptions for indirect liquefaction.
ComponentComposition (dry wt. %)
Carbon 49.81
Hydrogen 5.91
Nitrogen 0.17
Sulfur 0.09
Oxygen 41.02
Ash ≤ 3.00
Heating Value (Btu/lb) 8,449 HHV
7,856 LHV
Moisture (Bulk Wt. %) 10.0
Particle Size (inches) 2-in. chips
2.1.1 2019 SOT for Feedstock Supply to IDL
2.1.1.1DescriptionofLogisticSystemDesigns
The 2019 SOT for feedstock supply to IDL is reported in 2016 dollars (2016$) and includesboth grower payment and logistics costs to reflect a total delivered feedstock supply cost. The logistics system for the 2019 SOT for IDL delivers 725,000 dry tons of a 50% clean pine – 50% logging residue blend, utilizing the systems described in the 2018 Woody SOT report (Hartley et

9
Milestone Completion Report
al., 2018) for clean pine and logging residue, respectively. For the clean pine, the system harvests plantation grown pine and natural forest thinning material using a mechanized harvest system. Trees are moved to the landing where they are topped and debranched. Logs are sent to the processing facility where they are size reduced before feeding into the conversion process. Tops and branches are available for use as logging residue, with their harvest and collection costs attributed to the harvest of the clean pine logs. Additionally, logging residue is available from the landing at sites where pine logs are harvested for other products. Residues are chipped at the landing and transported by truck to the biorefinery.
The IDL system places fewer restrictions on the feedstock specifications in terms of particle size and ash content, which removes the necessity of much of the preprocessing required for other conversion methods. Hence, the 2018 Woody SOT for IDL utilized only logging residues. For 2019, it was desired to improve the conversion yield, and thus clean pine was blended with the logging residues to reduce ash content. The 2019 Woody SOT for IDL design modeled a minimum delivered feedstock cost of $63.24/dry ton. The cost of the delivered biomass for IDL decreased by $0.52/dry ton from the 2018 Woody SOT for IDL due to the incorporation of clean pine shrinking the required draw radius. Logistics costsinclude harvest, collection, storage, transportation, and preprocessing costs from the point ofharvest to the conversion reactor throat in-feed. Grower payment represents the stumpage cost or the payment necessary for the right to harvest the material.
Grower Payment
Grower payment represents the stumpage price paid to the landowner to secure permission to harvest the material. The grower payment was calculated using the size class stumpage values reported in the 2016 Billion Ton Report (BT16; USDOE, 2016). BT16 provides values of $32.40/dry ton, $16.20/dry ton and $8.10/dry ton, for both planted and natural softwood stands, of size classes 1, 2 and 3, respectively, in the Southern Region. The calculation of forest residue grower payment utilizes the residue ratios from the USDA Forest Service Forest Inventory and Analysis Database (USDA Forest Service, 2017), to determine the proportion of the value of the whole tree stumpage that remains after the harvest as residue. Based on the assumed harvest region, the size class distribution of delivered material and residue ratio, the weighted average grower payment of forest residue is $3.75/dry ton. The aggregate grower payment for the blended material $9.74/dry ton.
Field-side Operations
2019 field-side operations for logging residue are the same as those presented in the 2018SOT for IDL (Hartley et al., 2018). As before, it is assumed that the forest residue is brought to the landing as part of the primary harvest operation and as such does not incur harvest or collection cost. Instead, the supply chain starts with size reduction of material that has been driedto 30% moisture content in the field. Size reduction is performed with a mobile chipper, and the operational characteristics of the equipment are based on descriptions resulting from the High Tonnage project completed by Auburn University (Sokhansanj et al., 2014). The chips are blown directly into a truck for transport, eliminating the need for additional loading equipment. For clean pine the field-side operations are the same as those presented in the 2018 SOT for CFP

10
Milestone Completion Report
(Hartley et al., 2018). Felling is completed using a feller-buncher, and a grapple skidder is utilized. Operational characteristics of both pieces of equipment are based on descriptions resulting from the High Tonnage project completed by Auburn University (Sokhansanj et al., 2014). The logs are delimbed using a gate delimber at the landing prior to stacking. The delimbed logs are then stacked into a pile for storage until transportation.
Biorefinery Operations
The forest residue chips are delivered to the refinery by truck, where they are offloaded using a truck tipper with a hopper. The clean pine logs are unloaded from the trucks using a high-liftloader, and placed into storage piles. To initiate preprocessing, logs are delivered by loader to a rotary head debarker, and the debarked logs are conveyed to a 25 ton/hr disk chipper to produce an approximate 2-in nominal chip. The chips from both materials are conveyed to storage piles, where they are held until drying using a rotary drier. The chips from each pile are reclaimed and blended into a 50/50 stream as they are fed to the dryer. After the blended chips are dried to 10% moisture content, they are held in covered storage until feeding to the conversion process.
Processing Location Construction Cost
Construction and infrastructure costs were estimated as follows. Hu et al. (2017) utilized installation factors ranging from 1.43-1.7 to estimate the capital layout for construction and infrastructure for individual preprocessing equipment similar to the equipment in this design. For our calculations, we used the higher value of 1.7 for all preprocessing equipment to provide the more conservative estimate. Hence, the total capital layout for construction and infrastructure was estimated using an installation factor of 1.7 together with the installed capital cost of all preprocessing, handling and storage equipment; the estimate includes site preparation, construction, engineering and contingency (Hu et al. 2017). Land cost was calculated assuming 160 acres per depot at a cost of $500/acre and was added to the capital cost to determine the loan amount. The total cost was amortized over 30 years, assuming a 20% down payment and an 8% interest rate and divided by the number of delivered tons to give the per ton cost of depot construction and infrastructure, which totaled $2.73/dry ton.
2.1.1.2CostSummaryandEnergyUsage
Results of the supply chain analysis are summarized in Table 2, which provides the detailed cost breakdown and greenhouse gas emissions. The greenhouse gas emissions analysis was completed by Argonne National Laboratory (ANL), using energy consumption and transportation distance data from the BLM. ANL employed the Greenhouse Gases, Regulated Emissions, and Energy use in Transportation model (GREET®) (Argonne National Laboratory, 2017) to conduct detailed life-cycle analysis of farm gate-to-biorefinery gate GHG emissions of the woody biomass scenarios presented in this report. Table 3 shows the modeled cost estimates for the woody feedstock supply system providing feedstocks to IDL for the 2018 SOT, 2019 SOT and the 2022 Projection.

11
Milestone Completion Report
Table 2. Summary of modeled cost estimates for the woody feedstock supply systems providing IDL.
Cost ($/dry ton) (2016$)
Clean Pine
Logging
Residue Total
GHG Emissions
(kg CO2e/dry ton)
Grower Payment $15.73 $3.75 $9.74
Harvest & Collection $9.88 $0.00 $4.94 6.882
Field-side Preprocessing $4.73 $12.09 $8.41 13.611
Transportation $7.67 $16.77 $12.22 27.240
Preprocessing $28.14 $15.59 $21.87 58.699
Storage $0.67 $0.67 $0.67 0.919
Handling $2.65 $2.65 $2.65 2.128
Preprocessing Construction $2.73 $2.73 $2.73
Grand Total $72.20 $54.25 $63.23 109.479a The total is a weighted average of the blend components, with 50% clean pine and 50% logging residue.
Table 3. Summary of modeled cost estimates for the woody feedstock supply system providing IDL for the 2018 SOT, 2019 SOT and 2022 Projection.
Cost Summary ($/Dry Ton) (2016$)
IDL
2018 SOT
IDL
2019 SOT
IDL
2022 Projection
Grower Payment $3.75 $9.74 $3.75
Harvest & Collection $0.00 $4.94 $0.00
Field-side Preprocessing $11.08 $8.41 $11.08
Transportation $20.22 $12.22 $20.22
Preprocessing $19.38 $21.87 $19.38
Storage $0.67 $0.67 $0.67
Handling $2.70 $2.65 $2.70
Preprocessing Construction $2.73 $2.73 $2.73
Quality Dockage $3.22 $0.00a $3.22
Grand Total $63.76 $63.23 $63.76a The conversion process model has been updated with conversion data for this blend which accounts for yield changes,hence, dockage is not added for ash content exceeding the specification.

12
Milestone Completion Report
2.1.1.3SensitivityAnalysisofCosts
Sensitivity analysis was performed to determine the impact that alternate values for key operational parameters would have on the delivered cost presented as the 2019 SOT Design for IDL. The feedstock utilized in the final design required only minimal processing in order to be suitable for use in conversion. This resulted in a set of relatively few model parameters that were considered to potentially have impact on the final delivered price. Model parameters were chosen that could be variable or could cause variability in the preprocessing operations and ultimately cost. The final set of sensitivity parameters consisted of the final ash content of the material, the throughput of the chipper at the roadside, the energy consumption of the chipper at the roadside, the dryer throughput at the biorefinery, and the energy consumption of the dryer at the biorefinery. Each of the equipment parameters were varied based on variation seen in the processes, based on literature, from the values that were used in the final model run (Cao et al., 2007; Spinelli et al., 2012; Thompson et al. 2013). The values used are presented in Table 4.
Table 4. Sensitivity parameters for the 2019 SOT feedstock supply to the IDL pathway.
Min Mean Max
Dryer Capacity 1.48 odt/hr 1.5 odt/hr 1.53 odt/hr
Dryer Energy 33.75kWh/t 37.5 kWh/t 41.25 kWh/t
Field-side Chipper Capacity 76.37 odt/hr 79.80 odt/hr 83.00 odt/hr
Field-side Chipper Energy 13.2 kWh/t 18.5 kWh/t 26.5 kWh/t
Cent. Chipper Capacity 16.25 odt/hr 25.00 odt/hr 33.75 odt/hr
Cent. Chipper Energy 16.02 kWh/t 19.30 kWh/t 22.58 kWh/t
Figure 2 shows the results of the sensitivity analysis. The delivered cost is most sensitive to energy consumption of the field-side chipper used for the residue, followed by the dryer energy consumption. The impact of energy consumption on the chipper is because of the relative uncertainty that can be seen when processing material. The impact of throughput has to do with distributing the cost of the piece of equipment over the amount of material that is processed.When the throughput is decreased the cost increases, while when throughput increases the cost decreases.

13
Milestone Completion Report
Figure 2. Tornado chart showing sensitivity of cost to operational parameters usedto model the 2019 SOT Case for IDL
14
Milestone Completion Report
2.2 Feedstock Supply Systems for Catalytic Fast Pyrolysis (CFP)
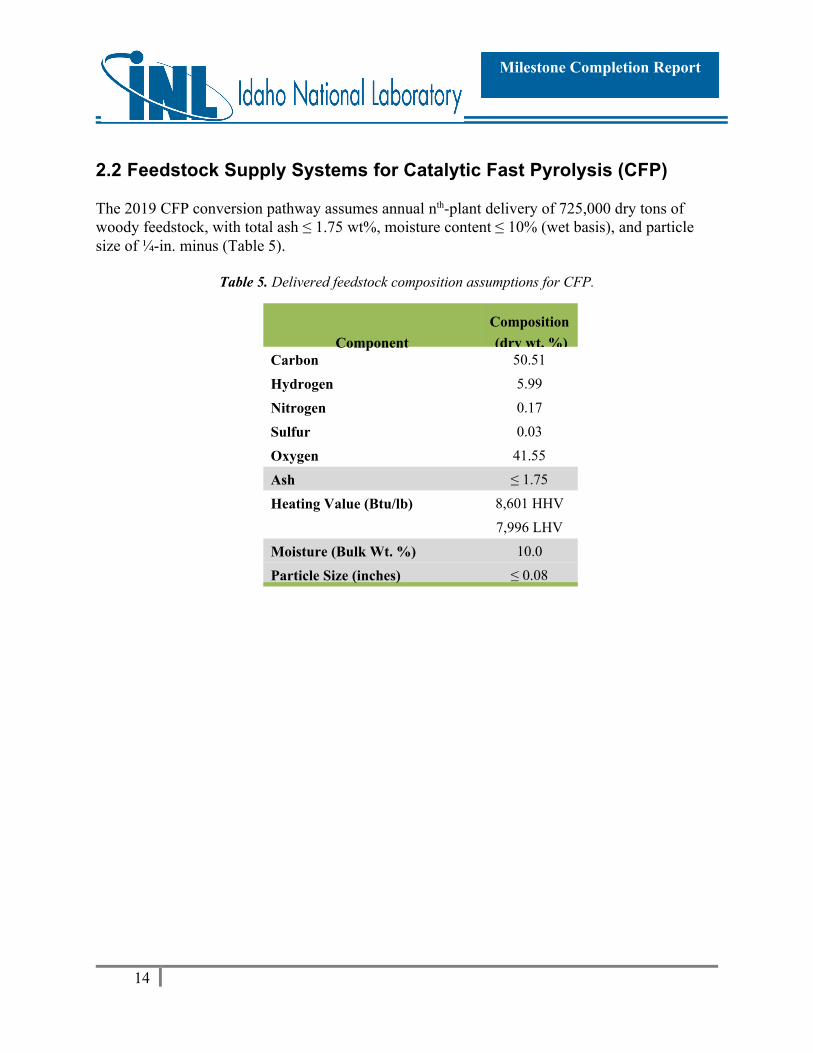
The 2019 CFP conversion pathway assumes annual nth-plant delivery of 725,000 dry tons of woody feedstock, with total ash ≤ 1.75 wt%, moisture content ≤ 10% (wet basis), and particle size of ¼-in. minus (Table 5).
Table 5. Delivered feedstock composition assumptions for CFP.
Component
Composition
(dry wt. %)Carbon 50.51
Hydrogen 5.99
Nitrogen 0.17
Sulfur 0.03
Oxygen 41.55
Ash ≤ 1.75
Heating Value (Btu/lb) 8,601 HHV
7,996 LHV
Moisture (Bulk Wt. %) 10.0
Particle Size (inches) ≤ 0.08

15
Milestone Completion Report
2.2.1 2019 SOT for Feedstock Supply to CFP
2.2.1.1DescriptionofLogisticSystemDesigns
The logistics system for the 2019 feedstocks SOT for CFP delivers 725,000 dry tons of a 50% clean pine – 50% logging residue blend, using both the clean pine and residue systems that been previously described in the 2018 Woody Feedstock SOT’s (Hartley et al., 2018). For the clean pine, the system harvests plantation grown pine and natural forest thinning material using a mechanized harvest system. Trees are moved to the landing where they are topped and debranched. Logs are sent to the processing facility where they are size reduced before feeding into the conversion process. Tops and branches are available for use as logging residue, with their harvest and collection costs attributed to the harvest of the clean pine logs. Additionally, logging residue is available from the landing at sites where pine logs are harvested for other products. Residues are chipped at the landing and transported by truck to the biorefinery.
Grower Payment
Grower payment represents the stumpage price paid to the landowner to secure permission to harvest the material. The grower payment was calculated using the size class stumpage values reported in the 2016 Billion Ton Report (BT16; USDOE, 2016). BT16 provides values of $32.40/dry ton, $16.20/dry ton and $8.10/dry ton, for both planted and natural softwood stands, of size classes 1, 2 and 3, respectively, in the Southern Region. The calculation of forest residue grower payment utilizes the residue ratios from the USDA Forest Service Forest Inventory and Analysis Database (USDA Forest Service, 2017), to determine the proportion of the value of the whole tree stumpage that remains after the harvest as residue. Based on the assumed harvest region, the size class distribution of delivered material and residue ratio, the weighted average grower payment of forest residue is $3.75/dry ton. The aggregate grower payment for the blended material $9.74/dry ton.
Field-side Operations
2019 field-side operations for logging residue are the same as those presented in the 2018 SOT for IDL (Hartley et al., 2018). As before, it is assumed that the forest residue is brought to the landing as part of the primary harvest operation and as such does not incur harvest or collection cost. Instead, the supply chain starts with size reduction of material that has been driedto 30% moisture content in the field. Size reduction is performed with a mobile chipper, and the operational characteristics of the equipment are based on descriptions resulting from the High Tonnage project completed by Auburn University (Sokhansanj et al., 2014). The chips are blown directly into a truck for transport, eliminating the need for additional loading equipment. For clean pine the field-side operations are the same as those presented in the 2018 SOT for CFP (Hartley et al., 2018). Felling is completed using a feller-buncher, and a grapple skidder is utilized. Operational characteristics of both pieces of equipment are based on descriptions resulting from the High Tonnage project completed by Auburn University (Sokhansanj et al., 2014). The logs are delimbed using a gate delimber at the landing prior to stacking. The delimbed logs are then stacked into a pile for storage until transportation.

16
Milestone Completion Report
Preprocessing Operations
The forest residue chips are delivered to the refinery by truck, where they are offloaded using a truck tipper with a hopper. The clean pine logs are unloaded from the trucks using a high-liftloader, and placed into storage piles. To initiate preprocessing, logs are delivered by loader to a rotary head debarker, and the debarked logs are conveyed to a 25 ton/hr disk chipper to produce an approximate 2-in nominal chip. The chips from both materials are held in storage piles until they are conveyed to secondary size reduction by a rotary shear and then dried using a rotary drier. The chips from each pile are reclaimed and blended into a 50/50 stream as they are fed to the rotary shear. After the blended are rotary sheared and dried to 10% moisture content, they are held in covered storage until feeding to the conversion process.
Processing Location Construction Cost
Construction and infrastructure costs were estimated as follows. Hu et al. (2017) utilized installation factors ranging from 1.43-1.7 to estimate the capital layout for construction and infrastructure for individual preprocessing equipment similar to the equipment in this design. For our calculations, we used the higher value of 1.7 for all preprocessing equipment to provide the more conservative estimate. Hence, the total capital layout for construction and infrastructure was estimated using an installation factor of 1.7 together with the installed capital cost of all preprocessing, handling and storage equipment; the estimate includes site preparation, construction, engineering and contingency (Hu et al. 2017). Land cost was calculated assuming 160 acres per depot at a cost of $500/acre and was added to the capital cost to determine the loan amount. The total cost was amortized over 30 years, assuming a 20% down payment and an 8% interest rate and divided by the number of delivered tons to give the per ton cost of depot construction and infrastructure, which totaled $2.96/dry ton.
2.2.1.2CostSummaryandEnergyUsage
Results of the supply chain analysis are summarized in Table 6, which provides the detailed cost breakdown and greenhouse gas emissions. The greenhouse gas emissions analysis was completed by Argonne National Laboratory (ANL), using energy consumption and transportation distance data from the BLM. ANL employed the Greenhouse Gases, Regulated Emissions, and Energy use in Transportation model (GREET®) (Argonne National Laboratory, 2017) to conduct detailed life-cycle analysis of farm gate-to-biorefinery gate GHG emissions of the woody biomass scenarios presented in this report. Table 7 shows the modeled cost estimates for the woody feedstock supply system providing feedstocks to CFP for the 2018 SOT, 2019 SOT and the 2022 Projection.

17
Milestone Completion Report
Table 6. Summary of modeled cost estimates for the woody feedstock supply systems providing CFP.
Cost ($/dry ton) (2016$)
Clean Pine
Logging
Residue Total
GHG Emissions
(kg CO2e/dry ton)
Grower Payment $15.73 $3.75 $9.74
Harvest & Collection $9.88 $0.00 $4.94 6.882Field-side Preprocessing $4.73 $12.09 $8.41 13.611Transportation $7.67 $16.77 $12.22 27.240Preprocessing $30.55 $26.55 $28.55 75.088Storage $0.68 $0.68 $0.68 0.919Handling $2.65 $2.65 $2.65 2.128
Preprocessing Construction $2.96 $2.96 $2.96
Grand Total $74.85 $65.45 $70.15 125.868a The total is a weighted average of the blend components, with 50% clean pine and 50% logging residue.

18
Milestone Completion Report
Table 7. Summary of modeled cost estimates for the woody feedstock supply system providing CFP for the 2018 SOT, 2019 SOT and 2022 Projection.
Cost Summary ($/Dry Ton) (2016$)
CFP
2018 SOT
CFP
2019 SOT
CFP
2022 Projection
Grower Payment $9.48 $9.74 $7.64
Harvest & Collection $9.87 $4.94 $2.47
Field-side Preprocessing $2.82 $8.41 $9.81
Transportation $31.56 $12.22 $13.32
Preprocessing $27.14 $28.55 $31.12
Storage $0.86 $0.68 $0.58
Handling $2.62 $2.65 $2.09
Preprocessing Construction $3.47 $2.96 $3.28
Quality Dockage $0.00 $0.00a $0.00
Grand Total $87.82 $70.15 $70.31a The conversion process model has been updated with conversion data for this blend which accounts for yield changes,hence, dockage is not added for ash content exceeding the specification.
2.2.1.3SensitivityAnalysisofCosts
Sensitivity analysis was performed to determine the impact that alternate values for key operational parameters would have on the delivered cost presented as the 2019 SOT Design for CFP. The feedstock utilized in the final design required very little processing in order to be suitable for use in conversion. This resulted in a set of relatively few model parameters that were considered to potentially have impact on the final delivered price. Model parameters were chosen that could be variable or could cause variability in the preprocessing operations and ultimately cost. The final set of sensitivity parameters consisted of the final ash content of the material, the throughput of the chipper at the roadside, the energy consumption of the chipper at the roadside, the dryer throughput at the biorefinery, and the energy consumption of the dryer at the biorefinery. Each of the equipment parameters were varied based on variation seen in the processes, based on literature, from the values that were used in the final model run (Cao et al., 2007; Spinelli et al., 2012; Thompson et al. 2013). The values used are presented in Table 8.

19
Milestone Completion Report
Table 8. Sensitivity parameters for the 2019 SOT feedstock supply to the CFP pathway.
Min Mean Max
Dryer Capacity 1.48 odt/hr 1.5 odt/hr 1.53 odt/hr
Dryer Energy 325.5 kWh/t 350 kWh/t 374.5 kWh/t
Field-side Chipper Capacity 76.37 odt/hr 79.80 odt/hr 83.00 odt/hr
Field-side Chipper Energy 13.2 kWh/t 18.5 kWh/t 26.5 kWh/t
Cent. Chipper Capacity 16.25 odt/hr 25.00 odt/hr 33.75 odt/hr
Cent. Chipper Energy 16.02 kWh/t 19.30 kWh/t 22.58 kWh/t
Rotary Shear Capacity 7.05 odt/hr 7.5 odt/hr 7.95 odt/hr
Rotary Shear Energy 31.85 kWh/t 33.85 kWh/t 35.79 kWh/t
Figure 3 presents the results of the sensitivity analysis. The delivered cost is most sensitive to energy consumption of the field-side chipper used for the residue, followed by the dryer energy consumption. The impact of energy consumption on the chipper is because of the relative uncertainty that can be seen when processing material. The impact of throughput has to do with distributing the cost of the piece of equipment over the amount of material that is processed. When the throughput is decreased the cost increases, while when throughput increases the cost decreases.
Figure 3. Tornado chart showing sensitivity of cost to operational parametersused to model the 2019 SOT Case for IDL

20
Milestone Completion Report
2.3 Feedstock Supply Systems for Algal-blend Hydrothermal Liquefaction (AHTL)
The 2019 AHTL conversion pathway assumes annual nth-plant delivery of 28,120 dry tons of logging residues for inclusion in a 90% algae-10% woody feedstock blend, with total ash ≤ 3 wt%, moisture content ≤ 10% (wet basis), and particle size of less than ¼-in. minus (Table 9). The AHTL pathway has a delivered feedstock cost target of $70.35/dry ton (2016$) in 2022, including dockage.
Table 9. Delivered feedstock composition assumptions for AHTL.
Component Composition (dry wt. %)Carbon 49.81
Hydrogen 5.91
Nitrogen 0.17
Sulfur 0.09
Oxygen 41.02
Ash ≤ 3.00
Heating Value (Btu/lb) 8,449 HHV
7,856 LHV
Moisture (Bulk Wt. %) 10.0
Particle Size (inches) < 0.08
2.3.1 2018 SOT for Logging Residue Supply to AHTL
2.3.1.1DescriptionofLogisticSystemDesigns
The 2019 woody feedstock SOT for AHTL is reported in 2016 dollars (2016$) andincludes both grower payment and logistics costs to reflect a total delivered feedstock supplycost. The 2019 SOT feedstock supply system design includes a modeled delivered feedstockcost of $70.35/dry ton for the woody feedstocks required by AHTL. Logistics costs includeharvest, collection, storage, transportation, and preprocessing costs from the point of harvestto the conversion reactor throat. Grower payment represents the stumpage payment andincludes the cost of production, compensation for soil nutrient removal, and grower profit. The AHTL process has a less stringent ash quality requirement than pyrolysis (equivalent to that of IDL), which allows the utilization of considerably cheaper forest residues.

21
Milestone Completion Report
The logistics system for the 2019 woody feedstock SOT for AHTL delivers 28,120 dry tons of forest residue and is the same as that described for AHTL in the 2018 SOT report (Hartley et al., 2018).
Grower Payment
Grower payment represents the stumpage price paid to the landowner to secure permission to harvest the material. The grower payment was calculated using the size class stumpage values reported in the 2016 Billion Ton Report (BT16; USDOE, 2016). BT16 provides values of $32.40/dry ton, $16.20/dry ton and $8.10/dry ton, for both planted and natural softwood stands, of size classes 1, 2 and 3, respectively, in the Southern Region. The calculation of forest residue grower payment utilizes the residue ratios from the USDA Forest Service Forest Inventory and Analysis Database (USDA Forest Service, 2017), to determine the proportion of the value of the whole tree stumpage that remains after the harvest as residue. Based on the assumed harvest region, the size class distribution of delivered material and residue ratio, the weighted average grower payment of Forest residue is $3.75/dry ton.
Field-side Operations
2019 field-side operations in this design are the same as those presented in the 2018 SOT for AHTL (Hartley et al., 2018). As before, it is assumed that the forest residue is brought to the landing as part of the primary harvest operation and as such does not incur harvest or collection cost. Instead, the supply chain starts with size reduction of material that has been dried to 30% moisture content in the field. Size reduction is performed with a mobile chipper, and the operational characteristics of the equipment are based on descriptions resulting from the High Tonnage project completed by Auburn University (Sokhansanj et al., 2014). The chips are blown directly into a truck for transport, eliminating the need for additional loading equipment.
Biorefinery Operations
The forest residue chips are delivered to the refinery by truck, where they are offloaded using a truck tipper with a hopper. From the hopper the chips are conveyed to storage piles where they are held until drying using a rotary drier, and size reduction using a hammer mill. The ground residues are then held in covered storage until feeding to the conversion process.
Processing Location Construction Cost
Construction and infrastructure costs were estimated as follows. Hu et al. (2017) utilized installation factors ranging from 1.43-1.7 to estimate the capital layout for construction and infrastructure for individual preprocessing equipment similar to the equipment in this design. For our calculations, we used the higher value of 1.7 for all preprocessing equipment to provide the more conservative estimate. Hence, the total capital layout for construction and infrastructure was estimated using an installation factor of 1.7 together with the installed capital cost of all preprocessing, handling and storage equipment; the estimate includes site preparation, construction, engineering and contingency (Hu et al. 2017). Land cost was calculated assuming 160 acres per depot at a cost of $500/acre and was added to the capital cost to determine the loan amount. The total cost was amortized over 30 years, assuming a 20% down payment and an 8%

22
Milestone Completion Report
interest rate and divided by the number of delivered tons to give the per ton cost of depot construction and infrastructure, which totaled $4.95/dry ton.
2.3.1.2CostSummaryandEnergyUsage
Results of the supply chain analysis are summarized in Table 10, which provides the detailed cost breakdown and greenhouse gas emissions. The greenhouse gas emissions analysis was completed by Argonne National Laboratory (ANL), using energy consumption and transportation distance data from the BLM. ANL employed the Greenhouse Gases, Regulated Emissions, and Energy use in Transportation model (GREET®) (Argonne National Laboratory, 2017) to conduct detailed life-cycle analysis of farm gate-to-biorefinery gate GHG emissions of the woody biomass scenarios presented in this report. which provides the detailed cost components. Table 11 shows the modeled cost estimates for the woody feedstock supply system providing logging residues to AHTL for the 2018 SOT, 2019 SOT and the 2022 Projection.
Table 10. Summary of modeled cost estimates of the 2019 SOT woody feedstock supply system for logging residues supplied to AHTL.
AHTL 2019 Cost Summary and Green House Gas Emissions
Cost (2016$)
($/dry ton)
GHG
(kg CO2e/dry ton)
Grower Payment $3.75
Harvest & Collection $0.00 0.000Field-side Preprocessing $11.53 24.876Transportation $5.89 2.360Preprocessing $39.82 53.200Storage $0.67 0.858Handling $3.70 1.969Preprocessing Construction $4.95
Grand Total $70.31 83.263
2.3.1.3SensitivityAnalysisofCosts
Sensitivity analysis was performed to determine the impact that alternate values for key operational parameters would have on the delivered cost presented as the 2019 SOT Design for supply of logging residues to AHTL. The feedstock utilized in the final design required littleprocessing in order to be suitable for use in conversion. This resulted in a set of relatively few model parameters that were considered to potentially have impact on the final delivered price. Model parameters were chosen that could be variable or could cause variability in the

23
Milestone Completion Report
Table 11. Summary of modeled cost estimates for the woody feedstock supply system providing AHTL for the 2018 SOT, 2019 SOT and 2022 Projection.
AHTL
2018 SOT
AHTL
2019 SOT
AHTL
2022 Projection
Grower Payment $3.75 $3.75 $3.75
Harvest & Collection $0.00 $0.00 $0.00
Field-side Preprocessing $11.53 $11.53 $11.53
Transportation $5.89 $5.89 $5.89
Preprocessing $39.82 $39.82 $39.82
Storage $0.67 $0.67 $0.67
Handling $3.70 $3.70 $3.70
Preprocessing Construction $4.95 $4.95 $4.95
Quality Dockage $0.00 $0.00 $0.00
Grand Total $70.31 $70.31 $70.31
preprocessing operations and ultimately cost. The final set of sensitivity parameters consisted of the final ash content of the material, the throughput of the chipper at the roadside, the energy consumption of the chipper at the roadside, the dryer throughput at the biorefinery, and the energy consumption of the dryer at the biorefinery. Each of the equipment parameters were varied based on variation seen in the processes, based on literature, from the values that were used in the final model run (Cao et al., 2007; Spinelli et al., 2012; Thompson et al. 2013). The values used are presented in Table 12.
Figure 4 presents the results of the sensitivity analysis. The delivered cost is most sensitive to chipper energy consumption, followed by the throughput of the chipper equipment. The impact of energy consumption on the chipper is because of the relative uncertainty that can be seen when processing material. The impact of throughput has to do with the distributing the cost of the piece of equipment over the amount of material that is processed. When the throughput is decreased the cost increases, while when throughput increases the cost decreases.

24
Milestone Completion Report
Table 12. Sensitivity parameters for the 2018 SOT for feedstock supply to AHTL.
Min Mean Max
Dryer Capacity 1.48 odt/hr 1.5 odt/hr 1.53 odt/hr
Dryer Energy 325.5 kWh/t 350 kWh/t 374.5 kWh/t
Chpper Capacity 76.37 odt/hr 79.80 odt/hr 83.00 odt/hr
Chipper Energy 13.2 kWh/t 18.5 kWh/t 26.5 kWh/t
Grinder Capacity 0.4 odt/hr 0.8 odt/hr 1.6 odt/hr
Grinder Energy 56.29 kWh/t 62.54 kWh/t 68.79 kWh/t
Grinder Price $85K $113K $170K
Figure 4. Tornado chart showing sensitivity of cost to operationalparameters used to model the 2019 SOT Case for AHTL.

25
Milestone Completion Report
INDUSTRIAL RELEVANCE OF THE FEEDSTOCKS3.Availability of Blended resources
Currently, it is estimated that there are 21,218,792 dry tons of pine feedstocks available nationally, with 11,804,620 dry tons of planted pine and 9,414,172 dry tons of pine forest residues. Additionally, it is estimated that there are 9,414,172 dry tons of pine forest residues.The use of plantation grown pine and forest residue is qualified by EPA to be eligible for RINs (USEPA, 2010). Analysis completed in 2019 shows that through blending clean pine with logging residue that it is possible to access 16.28 million dry tons of woody feedstocks at an average price of $70.31 or less. However, if a 50/50 blend is required the quantity that would be available 11.4 million dry tons (Hartley et al, 2019).
QUALIFICATION OF THE FEEDSTOCKS FOR 4.RENEWABLE IDENTIFICATION NUMBERS
The Environmental Protection Agency revised the National Renewable Fuel Standard Program in 2010 to implement the requirements of the Energy Security and Independence Act of 2007 (EISA). The revision of the program became known as RFS2 and mandated the use of 36 billion gallons of renewable fuel by 2022. As part of the revised rules, definitions of qualified biofuel feedstocks were outlined; the revised rules stipulated that “renewable fuels” had to be made from materials that qualify as renewable biomass. To be considered renewable biomass the materials must conform to the specified types and land types from where they are harvested as directed by EISA. From the final rule published in Vol 75, No. 58 of the Federal Register on page 14681.
“The definition includes:
Planted crops and crop residue from agricultural land cleared prior to December 19, 2007 and actively managed or fallow on that date.
Planted trees and tree residue from tree plantations cleared prior to December 19, 2007 and actively managed on that date.
Animal waste material and byproducts.
Slash and pre-commercial thinnings from non-federal forestlands that are neither oldgrowth nor listed as critically imperiled or rare by a State Natural Heritage program.
Biomass cleared from the vicinity of buildings and other areas at risk of wildfire.
Algae.
Separated yard waste and food waste.”
Thermochemical conversion focuses primarily on woody materials. Specifically, the qualification must be examined for the two potential feedstock sources that were considered:

26
Milestone Completion Report
clean pine and forest residue. Clean pine, pine wood containing less than 2% bark, could potentially be sourced from both plantation and forest sources. Clean pine will generally be produced from stem sections of whole trees. The qualification of plantation material is directly addressed in Section II.B.4.a.ii on page 14694. EISA defines “…planted trees and tree residue from actively managed tree plantations on non-federal land cleared at any time prior to December 19, 2007, including land belonging to an Indian tribe or an Indian individual, that is held in trust by the United States or subject to a restriction against alienation imposed by the United States.”; as renewable biomass. While a plantation has been defined as, “a stand of no less than 1 acre composed primarily of trees established by hand- or machine-planting of seed or sapling, or by coppice growth from the stump or root of a tree that was hand- or machine-planted.” From these definitions, practically all non-federal sources of cultivated trees would qualify as a renewable biomass and thus qualify for RINS.
The ability to source clean pine material from natural forest is more limited, but still possible based on Section II.B.4.a.iii on page 14695 and Section II.B.4.iv on page 14696. These two sections describe the conditions necessary to qualify from traditional forestry operations and/or as operations that are protecting from wildfire. In order to source clean pine from natural forest, that are not under the risk of wildfire, the following conditions must be met: 1) Be the result of pre-commercial thinning or residue from a commercial harvest; 2) be, “ from non-federal forestlands, including forestlands belonging to an Indian tribe or an Indian individual, that are held in trust by the United States or subject to a restriction against alienation imposed by the United States”; 3) the material must not come, “from forests or forestlands that are ecological communities with a global or State ranking of critically imperiled, imperiled, or rare pursuant to a State Natural Heritage Program, old growth forest, or late successional forest.”. For the purposes of EISA, pre-commercial thinning is defined as, “those trees and other vegetative material removed from a stand of trees in order to reduce stocking to concentrate growth on more desirable trees”. In order for the material to qualify as renewable biomass from “Areas at Risk from Wildfire”, the forest land would need to be designated as part of the Wildland-Urban Interface as depicted and mapped by the electronic Wildland-Urban Interface map located at http://silvis.forest.wisc.edu/Library/WUILibrary.asp.
Forest residue qualifies as a renewable material and eligible for RINS, under both Section II.B.4.ii and Section II.B.4.iii, as both sections utilize the definition of “slash” as the presented in the Dictionary of Forestry. The definition states that slash is “the residue, e.g. treetops, and branches left on the ground after logging or accumulating as a result of a storm, fire, girdling or delimbing.” For the plantation case the definition was expanded to the following for the final rule:” slash and any woody residue generated during the processing of planted trees from actively managed tree plantations for use in lumber, paper, furniture or other applications, providing that such woody residue is not mixed with similar residue from trees that do not originate in actively managed tree plantations.”
Ultimately, the qualification of biomass as renewable is subject to verification that the feedstocks meet the requirements specified by EISA. Currently, there are three mechanisms that provide this verification. First, the individual fuel production facilities can perform their own recordkeeping and reporting. Second, renewable fuel producers can form a consortium that funds

27
Milestone Completion Report
third-party audit of quality assurance, based on an EPA approved plan. The final method only is only available to producers sourcing their biomass entirely from within the United States. This method uses an aggregate compliance approach using USDA publicly available data about agricultural land to form the basis of determination on feedstock renewability. In the case of non-agricultural products, producers must obtain sufficient documentation from their suppliers to prove compliance with EISA definitions.
SUSTAINABILITY CONSIDERATIONS5.Discussion of the sustainability of woody biomass was first presented in the 2015 woody
SOT (Hartley et al. 2015). Potential risks to sustainability have not significantly changedsince that time. The attractiveness of woody biomass as an energy source is still predicatedon the material being both renewable and sustainable. Development of energy markets thatutilize woody biomass will provide an incentive for forest landowners and forest managers toremove greater proportions of material from their forest through removal of forest residuesand low value material, which generally have been left on site (Vance et al. 2014). Numerouspotential benefits are associated with removal of biomass, including but not limited toremoval of residual fuels, reducing the cost of site preparation and regeneration, andimproving overall operability in the stand (Agee and Skinner 2005, Gan and Smith 2007, USDOE 2011, Skog and Barbour 2006). However, potential concerns are associated with anincreased intensity of harvesting forest biomass, especially the impact on site productivitydue to nutrient removal (Vance et al. 2014).
The basis for concern over nutrient removal is that the majority of the material removed as part of a biomass harvest contains most of the nutrient-rich material in the tree. By removingthe tops and branches from the forest, nutrients that would have returned to the soil areremoved, potentially leading to a decline in soil and overall stand productivity. While this is areasonable train of thought, there is not a consensus among the forest science communityabout whether high-intensity harvest (i.e., removing the tops and branches) has a significantimpact on long-term soil productivity. Ponder et al. (2012) reported that during the U.S.Department of Agriculture Forest Service’s Long-Term Soil Productivity Study, which took place over 10 years at 45 sites across the United States, harvests that removed the nutrient-richmaterial had little effect on site productivity. One of the main reasons for a lack of significantand noticeable effect in soil productivity is due to operational constraints. For a typicalbiomass harvest, it is not practical to remove all available biomass due to both technologicaland economic constraints. Several studies on a variety of sites have found that operations areonly able to economically collect between 20 and 75% of biomass in a stand (Nurmi 2007, Ralevic et al. 2010, Klockow et al. 2013). Current technology and demand for biomass make itunlikely that removal will reach levels that will cause an impact on soil productivity.However, as technology advances and higher demands increase prices, it is possible thatremovals could reach levels that have a detrimental impact on forest soils.
Aside from nutrient removal, harvesting can cause soil compaction and/or displacement.During harvest, machines traversing the site compact the soil, changing the soil’s physical
28
Milestone Completion Report
structure by increasing soil strength and bulk density and reducing pore space (Fisher and Binkley 2000, Grigal 2000, Janowiak and Webster 2010). Soil compaction will occuranytime a machine passes over an area of ground; however, the severity may be increasedduring biomass harvest due to an increase in the machine passes required to collect theadditional material (Burger 2002). However, if biomass harvest is performed in a similarmanner to conventional timber harvest, it is unlikely that soil compaction will be significantlydifferent, because the majority of the compaction happens during the first few machine passes(Janowiak and Webster 2010, Johnson et al. 2007).
While all negative site impacts associated with removal of biomass can be seen todiminish sustainability of the practice, it is possible to prevent or mitigate negative siteimpacts through implementation of proper strategies. Vance et al. (2014) propose thatadhering to current best management practices, focusing functional values of interest, andmonitoring nutrients will limit decreases in soil productivity as a result of biomass harvest. Best management practices remain the same, independent of the intensity of the harvest ormaterial being harvested and have been shown to be effective in protecting sustainability(Shepard 2006). Additionally, focusing functional values (such as growth rates or streamhealth) will place emphasis on the values of concern rather than a holistic ideal.
SUMMARY6.The Terrestrial Feedstock Supply and Logistics Program within BETO focuses on (1)
reducing the delivered cost of sustainably produced biomass, (2) preserving and improving the physical and chemical quality parameters of harvested biomass to meet the individual needs of biorefineries and other biomass users, and (3) expanding the quantity of feedstock materials accessible to the bioenergy industry. To support BETO and their bioenergy production goals, INL completes annual SOT reports for herbaceous and woody biomass feedstock logistics, which provides the status of technology development of feedstock logistics for biomass to biofuels given actual data and experimental results, relative to technical target and cost goals from design cases.
The 2019 Woody Feedstock SOT has been separated into three separate pathways that utilize woody feedstocks: indirect liquefaction, catalytic fast pyrolysis, and algal hydrothermal liquefaction. The 2019 delivered cost for the feedstocks were found to be $68.54/dry ton, $70.15/dry ton and $70.31/dry ton, respectively (2016$).
For the AHTL pathway, the feedstock supply system utilizes what has been termed a conventional feedstock supply system. Conventional feedstock supply systems form the backbone of the emerging biofuels industry but have limitations in their ability to adjust the quality of the material that they supply. To meet the demands of the CFP and IDL pathways, it will be required that the feedstock supply systems shift from a conventional system to what has been termed “advanced” supply systems. Advanced systems incorporate innovative methods of material handling, processing and supply chain configuration. In advanced designs, variability of the feedstock can be reduced to produce feedstocks of a uniform

29
Milestone Completion Report
format, moving toward biomass commoditization. The 2019 woody CFP and IDL cases both incorporate advanced concepts to increase access to biomass resources and dilution negative quality impacts.
REFERENCES7.Abt, K. L., R. C. Abt, C. S. Galik and K. E. Skog. 2014. Effect of policies on pellet production
and forests in the U.S. South: a technical document supporting the Forest Service updateof the 2010 RPA Assessment. USFS. Asheville, NC, USA, US Department of AgricultureForest Service, Southern Research Station. Gen. Tech. Rep. SRS-202: 33. Retrieved fromhttp://www.srs.fs.usda.gov/pubs/gtr/gtr_srs202.pdf, [September 2, 2015].
Ackerman, P., B. Talbot, and B. Dahlin, 2014, “Biomass Harvesting and Logistics,” In: T. Seifert(ed.), Bioenergy from Wood, Springer, Netherlands.
Agee, J. K. and C. N. Skinner, 2005, “Basic principles of forest fuel reduction treatments,”Forest Ecology and Management 211(1): 83-96.
Argo, A. M., E. C. D. Tan, D. Inman, M. H. Langholtz, L. M. Eaton, J. J. Jacobson, C. T.Wright, D. J. Muth, M. M. Wu, Y.-W. Chiu, and R. L. Graham, 2013, “Investigation ofbiochemical biorefinery sizing and environmental sustainability impacts for conventionalbale system and advanced uniform biomass logistics designs,” Biofuels Bioprod. Bior. 7:282–302
Argonne National Laboratory.2018 Summary of Expansions, Updates, and Results in GREET® 2016 Suite of Models. Technical Report, ANL/ESD-16/21, https://greet.es.anl.gov.
Bals, B., C. Wedding, V. Balan, E. Sendich, and B. Dale, 2011, “Evaluating the impact ofammonia fiber expansion (AFEX) pretreatment conditions on the cost of ethanolproduction,” Bioresource Technology 102(2): 1277-1283.
B.D. Bals, C. Gunawan, J. Moore, F. Teymouri, B.E. Dale, 2013, Enzymatic hydrolysis of pelletized AFEX™-treated corn stover at high solid loadings, Biotechnol. Bioeng111(2):264-271
Boavida, D., P. Abelha, I. Gulyurtlu, B. Valentim, and M. J. L. D. Sousa, 2012, “A study on coal blending for reducing NOx and N2O levels during fluidized bed combustion,”Clean Air 5: 175-191.
Bonner, I., D. Muth, J. Koch, and D. Karlen, 2014, “Modeled impacts of cover crops and vegetative barriers on corn stover availability and soil quality,” Bio Energy Res. 7: 576-589.
Boardman, R. et al., 2013, Logistics, Costs, and GHG Impacts of Utility-Scale Cofiringwith 20% Biomass, Technical Report INL/EXT-12-25252, PNNL-22320.
Burger, J. A., 2002, “Soil and long-term site productivity values,” In J. Richardson, R.Bjo¨rheden, P. Hakkila, A. T. Lowe, and C. T. Smith (eds.) Bioenergy from sustainable

30
Milestone Completion Report
forestry: Guiding principles and practice, Klewer Academic Publishers, Dordrecht.
Cafferty, K.G., Muth, D.J., Jacobson, J.J., Bryden, K.M, 2013a, Model Based Biomass System Design of Feedstock Supply Systems for Bioenergy Production. In: ASME 2013 International Design Engineering Technical Conferences and Computers and Information in Engineering Conference, August 4–7, Portland, OR, USA. ASME. pp. V02BT02A023.
Cafferty, K, J. Jacobson, and K. Kenney, 2013b, “Woody/Pyrolysis Feedstock 2013 State ofTechnology Report,” Milestone Completion Report, Idaho National Laboratory.
Cafferty, K. G and D. S. Hartley, 2015, Woody Feedstock 2014 State of Technology Report,INL\LTD-15- 34165.
Cao, C.W. , D. Y. Yang & Q. Liu, 2007, Research on Modeling and Simulation of Mixed Flow Grain Dryer, Drying Technology, 25:4, 681-687, DOI: 10.1080/07373930701290951
Carolan, J., S. Joshi, and B. E. Dale, 2007, “Technical and Financial Feasibility Analysis ofDistributed Bioprocessing Using Regional Biomass Pre-Processing Centers,” Journal ofAgricultural & Food Industrial Organization 5(2): 1203-1230.
Coyle, D. R., Coleman, M. D., Durant, J. A. and Newman, L. A., 2006, “Survival and growthof 31 Populus clones in South Carolina,” Biomass and Bioenergy 30(8):750-758.
Dutta, A., M. Talmadge, J. Hensley, M. Worley, D. Dudgeon, D. Barton, P. Groenendijk, D.Ferrari, B. Stears, E. Searcy, C. Wright, and J. Hess, 2011, Process Design and Economics for Conversion of Lignocellulosic Biomass to Ethanol - ThermochemicalPathway by Indirect Gasification and Mixed Alcohol Synthesis, NREL/TP-5100-51400,May 2011.
EC-DG-ENV. 2015. Environmental Implications of Increased Reliance of the EU on Biomassfrom the South East US. B. Kittler, A. S. Olesen, W. Price, F. Aguilar and S. L. Bager.Brussels, Belgium, Pinchot Institute for Conservation & COWI for the EuropeanCommission Directorate-General for Environment. ENV.B.1/ETU/2014/0043. Retrievedfrom http://www.aebiom.org/wp- content/uploads/2016/08/DG-ENVI-study-imports-from-US-Final-report-July-2016.pdf.
Emerson, R., T. Westover, D. Carpenter, B. Evans, and D. Howe, 2014, “ThermochemicalConversion Feedstock Interface, Combined Milestone Completion Report: INL, NREL and PNNL,” Idaho National Laboratory.
Erber, G., J. Routa, M. Kolstrom, C. Kanzian, L. Sikanen, and K. Stampfer, 2014,“Comparing Two Different Approaches in Modeling Small Diameter Energy Wood Drying in Logwood Piles,” Croatian Journal of Forest Engineering 35: 15-22.
FAO 2016. FAOSTAT - Forestry Production and Trade. Rome, Italy, Food and AgricultureOrganization of the United Nations. Retrieved fromhttp://faostat3.fao.org/download/F/FO/E, [February 2016].
Fisher, R. F. and D. Binkley, 2000, Ecology and management of forest soils, John Wiley and

31
Milestone Completion Report
Sons, Inc., New York.
Forest2Market 2015. Wood Supply Market Trends in the US South: 1995 - 2015. Charlotte,NC, USA, Forest2Market analysis for National Alliance of Forest Owners, US Endowment for Forestry and Communities, US Industrial Pellet Association. Retrievedfrom http://www.nafoalliance.org/images/pellets/Forest2Market_USSouthWoodSupplyTrends.pdf [November 22, 2015].
FORISK, 2011, “Woody Biomass as a Forest Product - Wood Supply and MarketImplications,” B. Mendell, A. H. Lang, and T. Sydor, Forisk Consulting and NationalAlliance of Forest Owners, http://nafoalliance.org/wp-content/uploads/NAFO-US-Wood-Markets-Report-102411.pdf, accessed August 13, 2015.
Gan, J. and C. T. Smith, 2007, “Co-benefits of utilizing Forest residues for bioenergy production:The case for East Texas, USA,” Biomass and Bioenergy 31(9): 623-630.
Graham, R., M. Langholtz, L. Eaton, J. Jacobson, C. Wright, M. Muth, D. Inman, E. Tan, M.Wu, Y. W. Chiu, S. Jones, L. Snowden-Swan, and A. Argo, 2013, “Investigation ofBiochemical Biorefinery Sizing and Environmental Sustainability Impacts forConventional Bale System and Advanced Uniform Biomass Logistics Designs,” Biofuels,Bioproducts and BioPower.
Greene, W., J. Cutshall, C. Dukes, and S. Baker, 2014, “Improving Woody BiomassFeedstock Logistics by Reducing Ash and Moisture Content,” Bioenergy Res 7(3): 816-823.
Grigal, D. F., 2000, “Effects of extensive forest management on soil productivity,” For. Ecol.Manag. 138(1–3): 167–185.
Hansen, J., J. Jacobson, and M. Roni, 2015, “Quantifying Supply Risk at a CellulosicBiorefinery,” In K. Chichakly and K. Saeed (eds.), Proceedings from the 33rd International Conference of the System Dynamics Society, Albany, New York: SystemDynamics Society.
Harris, R. A. and D. R. Phillips, 1986, “Density of Selected Wood Fuels,” Georgia ForestryCommission, Georgia Forest Research Paper 61: 6.
Hartley, D., D. Jones, M. Langholtz, M.Davis, C. Brandt, M. Griffel, Y. Lin, P. Burli, D Thompson. (2019). Q3 Quarterly Progress Milestone: Development of nth-plant modeling assumptions for grower payment, harvest & collection for herbaceous and woody feedstocks. Idaho National Laboratory, Idaho Falls, ID.
Hartley, D., M. Roni, E. Searcy and P. Lamers. 2015. Woody/Pyrolysis Feedstock 2015 Stateof Technology Report, INL/LTD-15-36596, September 2015.
Hartley, D., Thompson, D., Hu, H., Cai, H. (2018). Woody Feedstock 2018 State of Technology Report. Idaho National Laboratory, Idaho Falls, ID, INL/EXT-18-51655.
Hess, J. R., K. L. Kenney, L. P. Ovard, E. M. Searcy, and C. T. Wright, 2009, Commodity-Scale Production of an Infrastructure-Compatible Bulk Solid from Herbaceous

32
Milestone Completion Report
Lignocellulosic Biomass. Uniform-Format Bioenergy Feedstock Supply System Design Report Series, INL/EXT-09-17527, April 2009.
Hill, L. D., 1990, Grain grades and standards: Historical issues shaping the future, Chicago,IL, USA, University of Illinois Press.
Hodges, D. G., A. J. Hartsell, C. Brandeis, T. J. Brandeis, and J. W. Bentley, 2012,“Recession Effects on the Forests and Forest Products Industries of the South,” ForestProducts Journal 61(8): 614-624.
Howe, D, T. Westover, D. Carpenter, D. Santosa, R. Emerson, S. Deutch, A. Starace, I.Kutnyakov, and Lukins, 2015, “Field-to-Fuel Performance Testing of LignocellulosicFeedstocks: An Integrated Study of the Fast Pyrolysis-Hydrotreating Pathway,” Energy and Fuels 29(5): 3188-3197.
Humbird, D., R. Davis, L. Tao, C. Kinchin, D. Hsu, A. Aden, P. Schoen, J. Lukas, B. Olthof,M. Worley, D. Sexton, and D. Dudgeon, 2011, Process Design and Economics for the Conversion of Lignocellulosic Biomass to Ethanol: Dilute-Acid Pretreatment and Enzymatic Hydrolysis of Corn Stover, NREL/TP-5100-47764,http://www.nrel.gov/biomass/pdfs/47764.pdf, accessed June 30, 2014.
IBSS, 2014, “Wood energy: understanding the forest connection,” R. E. Bardon and D. W. Hazel, Southeastern Partnership for Integrated Biomass Supply Systems, http://www.se-ibss.org/publications-and-patents/extension-and-outreach-publications/wood-energy-understanding- the-forest-connection/at_download/file, accessed August 13, 2015.
Jacobson, J., P. Lamers, M. Roni, K. Cafferty, K. Kenney, B. Heath, J. Hansen, and J. Tumuluru,2014, Techno-economic analysis of a biomass depot, INL/EXT-14-33225, September 30,2014.
Janowiak, M. K. and C. R. Webster, 2010, “Promoting Ecological Sustainability in WoodyBiomass Harvesting,” Journal of Forestry 108(1): 16-23.
Jernigan, M. O., 2012, “High tonnage harvesting and skidding for loblolly pine energyplantations,” M.Sc. Thesis, Auburn University, Alabama
Johnson, L. R., D. Page-Dumroese, and H-S. Han, 2007, “Effects of machine traffic on thephysical properties of ash cap soils,” In D. Page-Dumroese, R. Miller, J. Mital, P.McDaniel, D. Miller (eds.) Proceedings of conference on Volcanic-ash-derived forestsoils of the Inland Northwest: properties and implications for management andrestoration, Proc. RMRS-P-44, Fort Collins, CO: U.S. Department of Agriculture, ForestService, Rocky Mountain Research Station: 69-82.
Jones, S, E. Tan, J. Jacobson, A. Meyer, A. Dutta, and L. Snowden-Swan, 2013, ProcessDesign and Economics for the Conversion of Lignocellulosic Biomass to HydrocarbonFuels: Fast Pyrolysis and Hydrotreating Bio-oil Pathway, Pacific Northwest NationalLaboratory, DRAFT Technical Report to the Bioenergy Technologies Office.
Kaczmarek, D. J., D. R. Coyle, and M. D. Coleman, 2013, “Survival and growth of a range ofPopulus clones in central South Carolina USA through age ten: Do early assessments

33
Milestone Completion Report
reflect longer-term survival and growth trends?,” Biomass and Bioenergy 49: 260-272
Kenney, K. L., W. A. Smith, G. L. Gresham, and T. L. Westover, 2013, “Understandingbiomass feedstock variability,” Biofuels 4: 111–127.
Klockow, P. A., A. W. D’Amato, and J. B. Bradford, 2013, “Impacts of post-harvest slash andlive-tree retention on biomass and nutrient stocks in Populus tremuloides Michx.-dominated forests, northern Minnesota, USA,” Forest Ecology and Management 291:278-288.
Lacey, J. A., J. E. Aston, T. L. Westover, R. R. S. Cherry, and D. N. Thompson, 2015,“Removal of introduced inorganic content from chipped forest residues via airclassification,” Fuel 160: 265-273.
Lamers, P. and D. Hartley 2016. Domestic feedstock use patterns to identify marketlinkages. Idaho Falls, ID, USA, Idaho National Laboratory.
Lamers, P., M. S. Roni, J. S. Tumuluru, J. J. Jacobson, K. G. Cafferty, J. K. Hansen, K.Kenney, F. Teymouri, and B. Bals, 2015a, “Techno-economic analysis ofdecentralized biomass processing depots,” Bioresource Technology 194: 205-213.
Langholtz, M, 2013, ORNL personal communication, December 2013.
Langholtz, M, 2014, ORNL personal communication, December 2014.
Lanning, D. N., J. H. Dooley, and C. J. Lanning, 2012, “Shear processing of wood chips intofeedstock particles,” in 2012 ASABE Annual International Meeting, Dallas, Texas, July29-August 1, 2012, American Society of Agricultural and Biological Engineers.
Muth, D. J., M. H. Langholtz, E. C. D. Tan, J. J. Jacobson, A. Schwab, M. M. Wu, A. Argo, C. C.Brandt, K. G. Cafferty, Y. W. Chiu, A. Dutta, L. M. Eaton, and E. M. Searcy, 2014,“Investigation of thermochemical biorefinery sizing and environmental sustainability impactsfor conventional supply system and distributed pre-processing supply system designs,”Biofuels Bioprod. Bior 8: 545-567.
Nurmi, J., 2007, “Recovery of Forest residues for energy from spruce (Pices abies)dominated stands,” Biomass and Bioenergy 31(6): 375-380.
Nurmi, J., 2014, “Changes in volumetric energy densities during storage of whole-tree feedstocks from silvicultural thinnings,” Biomass and Bioenergy 61: 114-120.
Owens, V. N., D. L. Karlen, and J. A. Lacey et al. 2016. Regional FeedstockPartnership Report: Enabling the Billion-Ton Vision. U.S. Department of Energyand Idaho National Laboratory. INL/EXT-15-37477.
Pace, D. P and N. A. Yancey, 2013, Biomass Feedstock PDU Project: BiomassComminution Study, INL/EXT-14-31058.
Pearson, C.H., Halvorson, A.D., Moench, R.D. and Hammon, R.W., 2010. Production of hybrid poplar under short-term, intensive culture in Western Colorado. Industrial Crops and Products, 31(3), pp.492-498.

34
Milestone Completion Report
Ponder, F., R. L. Fleming, S. Berch, M. D. Busse, J. D. Elioff, P. W. Hazlett, and R. A.Voldseth, 2012, “Effects of organic matter removal, soil compaction and vegetationcontrol on 10th year biomass and foliar nutrition: LTSP continent-wide comparisons,”Forest Ecology and Management 278: 35-54.
Ralevic, P., M. Ryans, and D. Cormier, 2010, “Assessing forest biomass for bioenergy:operational challenges and cost considerations,” The Forestry Chronicle 86(1): 43-50.
Reddy, D. V. and N. Krishna, 2009, “Precision animal nutrition: A tool for economic and eco-friendly animal production in ruminants,” Livestock Research for RuralDevelopment 21(3).
Roise, J. P., G. Catts, D. Hazel, A. Hobbs, and C. Hopkins, 2013, Balancing biomassharvesting and drying tactics with delivered payment practice, Technical Report-not heldin TRLN member libraries, Greenville, SC: U.S. Endowment for Forestry and Community.
Sami, M., K. Annamalai, and M. Wooldridge, 2001, “Co-firing of coal and biomass fuel blends,”Progress in Energy and Combustion Science 27(2): 171-214.
Searcy, E. and J. R. Hess, 2010, Uniform-Format Feedstock Supply System: A Commodity-Scale Design to Produce an Infrastructure-Compatible Biocrude from LignocellulosicBiomass,INL/EXT-10-2037.
Searcy E. M, C. T. Wright, J. R. Hess, and T. Westover, 2012, “Logistics Costs for the 2012Conventional Woody Biomass Feedstock Supply for Thermochemical Conversion,”Idaho National Laboratory Technical Report to Office of Biomass Program, U.S.Department of Energy, January 2012.
Shepard, J. P., 2006, “Water quality protection in bioenergy production: the U.S. system offorestry Best Management Practices,” Biomass and Bioenergy 30(4): 378-384.
Shih, J.-S. and H. C. Frey, 1995, “Coal blending optimization under uncertainty,” EuropeanJournal of Operational Research 83(3): 452-465.
Skog, K. E. and R. J. Barbour, 2006, “Estimating woody biomass supply from thinningtreatments to reduce fire hazard in the U.S. West,” In P. L. Andrews and B. W. Butler(compilers), Conference proceedings RMRS-P-41––Fuels management: How tomeasure success, Ft. Collins, CO: USDA Forest Service Rocky Mountain ResearchStation: 657-672.
Sokhansanj, S., A. Turhollow, and E. Webb, 2014, Simulation of the DOE High-TonnageBiomass Logistics Demonstration Projects-Auburn University, ORNL/TM-2014/505.
Spinelli, R., Cavallo, E., Facello, A., Magagnotti, N., Nati, C. and Paletto, G., 2012. Performance and energy efficiency of alternative comminution principles: chipping versus grinding. Scandinavian Journal of Forest Research, 27(4), pp.393-400.
Stokes B., T. McDonald, and T. Kelly, 1993, Transpirational drying and costs for

35
Milestone Completion Report
transporting woody biomass a preliminary review, Auburn, AL: USDA forest service,southern forest experiment station.
Thompson, J. and W. Sprinkle, 2013, Production, cost and chip characteristics of in-woods Microchipping. Council on Forest Engineering Annual Meeting, Auburn, AL (2013)
Thompson, V., J. Aston, J. Lacey and D. Thompson, 2016, Develop feedstock blends usingcombined chemical and mechanical separations along with formulation techniques to reduce feedstock costs and risks in the supply chain, 1.2.2.1 Milestone CompletionReport.
Townsend, P. A., S. P. Kar, and R. O Miller, 2014, “Popular (Populus spp.) Trees for BiofuelProduction,” accessed 9-6-2016: http://articles.extension.org/pages/70456/poplar-populus-spp-trees- for-biofuel-production.
Tumuluru, J.S., 2016, Specific energy consumption and quality of wood pellets produced using high-moisture lodgepole pine grind in a flat die pellet mill. Chemical Engineering Research and Design. 110(2016) 82-97.
U.S. Department of Energy, 2016a, 2016 Billion Ton Report: Advancing Domestic Resourcesfor a Thriving Bioeconomy, Volume 1: Economic Availability of Feedstocks, M. H.Langholtz, B. J. Stokes, and L. M. Eaton (Leads), ORNL/TM-2016/160, Oak RidgeNational Laboratory, Oak Ridge, TN: 448.
U.S. Department of Energy, 2016b, Bioenergy Technologies Office Multi-Year Program Plan,DOE/EE-1385, March 2016,http://www.energy.gov/sites/prod/files/2016/07/f33/mypp_march2016.pdf.
U.S. Department of Energy. 2011. U.S. Billion-Ton Update: Biomass Supply for a Bioenergy and Bioproducts Industry. R.D. Perlack and B.J. Stokes (Leads), ORNL/TM-2011/224. Oak Ridge National Laboratory, Oak Ridge, TN. 227p.
U.S. Department of Energy, Bioenergy Technologies Office, 2015, “Accomplishments and Successes,” http://www.energy.gov/eere/bioenergy/accomplishments-and-successes#2014, accessed July 2015.
U.S. Energy Information Administration, 2015a, “Electric Power Monthly: Table 5.6.A Average Retail Price of Electricity to Ultimate Customers by End-Use Sector,” accessed9/1/15: http://www.eia.gov/electricity/monthly/epm_table_grapher.cfm?t=epmt_5_6_a.
U.S. Energy Information Administration, 2015b, “Gasoline and Diesel Fuel Update,”accessed 9/1/15: http://www.eia.gov/petroleum/gasdiesel/.
U.S. Energy Information Administration, 2015c, “Natural Gas: Henry Hub Natural Gas SpotPrice-Annual History,” accessed 9/1/15: http://www.eia.gov/dnav/ng/hist/rngwhhdA.htm.
U.S Energy Information Administration, 2013, Manufacturing Energy Consumption Survey(MECS). Washington DC, USA, US Energy Information Administration (EIA). Retrievedfrom https://www.eia.gov/consumption/manufacturing/, accessed February 2016.
U.S. Forest Service, 2012, Future of America’s Forest and Rangelands: Forest Service 2010 Resources Planning Act Assessment. Washington, DC, USA, United States Forest
36
Milestone Completion Report
Service. Retrieved from http://www.treesearch.fs.fed.us/pubs/41976/, accessed February2016.
Vakkilainen, E., K, Kuparinen and J. Heinimö, 2013, Large Indusrial Users of Energy Biomass. IEA Bioenergy, Task 40: Sustainable International Bioenergy Trade. pp 75.
Vance, E. D., W. M. Aust, B. D. Strahm, R. E. Froese, R. B. Harrison, and L. A. Morris,2014, “Biomass Harvesting and Soil Productivity: Is the Science Meeting our PolicyNeeds?,” Soil Science Society of America Journal 78(S1): S95-S104.
Wang, J., D. S. Hartley, and W. Liu, 2013, “Biomass Harvesting Systems and Analysis,” In:M. Jacobson and D. Ciolkosz (eds.), Wood Based Energy in the Northern Forests: 101-120, New York: Springer.
Webb, E., S. Sokhansanj, and A. Turhollow, 2013a, Simulation of the DOE High-TonnageBiomass Logistics Demonstration Projects-AGCO Corporation ORNL/TM-2013/323.
Webb, E., S. Sokhansanj, and A. Turhollow, 2013b, Simulation of the DOE High-TonnageBiomass Logistics Demonstration Projects-FDC Enterprises, ORNL/TM-2013/338.
Webb, E., S. Sokhansanj, and A. Turhollow, 2013c, Simulation of the DOE High-TonnageBiomass Logistics Demonstration Projects-State University of New York College of Environmental Science and Forestry ORNL/TM-2013/376.
Webb, E., S. Sokhansanj, and A. Turhollow, 2013d, Simulation of the DOE High-TonnageBiomass Logistics Demonstration Projects-TennEra LLC, ORNL/TM-2013/375.
Wright, J., 2013, “Advances in Hardwood Plantation Systems Implications for Bio-energyfeedstock,” In: 2013 SWST International Convention, Austin, TX. June 9-11, 2013.
Yancey, N. A., C.T. Wright, C.C. Connor and J.R. Hess, 2009, “Preprocessing moistlignocellulosic biomass for biorefinery feedstocks,” Proceedings of the ASABE AnnualMeeting, Reno, Nevada.

37
Milestone Completion Report
APPENDIX A – 2019 Woody State of Technology Feedstocks Logistics Design and Assumptions
for Feedstock Supply to IDL
The 2019 woody SOT case for IDL (Figure A-1) consists of 50% clean pine and 50%forest residue and supplies 725,000 dry tons of biomass annually to the throat of the conversion reactor. The clean pine is harvested and preprocessed using a modified ground-based mechanized chip production system that is based on the system that was studied by Auburn University during their High Tonnage Logistics Demonstration Project. While the forest residues are preprocessed at the roadside using a system that is based on the chip processing system that was also studied by Auburn University during their High TonnageLogistics Demonstration Project. The processed forest residues are transported from theiraggregation points after preprocessing. The materials are delivered directly to the biorefinery, where they are dried using process heat before being delivered to the throat of the reactor.
The model relies on assumptions about exogenous factors such as interest rates, energyprices, and land rents. The prices for electricity, natural gas, and off-road diesel are identical to those used in the 2018 SOT for IDL. Table A-1 shows the values of the assumptions used.
Table A-1. Energy prices and interest rates used to model feedstock logistics costs for the 2019 woodySOT.
Component 2018 Assumptions 2019 Assumptions
Interest Rate 8%a 8%a
Electricity Price $0.0672/kWhb $0.0672/kWhb
Natural Gas Price $3.36/MMBtub $3.36/MMBtub
Off-Road Diesel Price $2.01/gald $2.01/gald
aJones et al. 2013.bEIA 2017

38
Milestone Completion Report
Standing TreesAsh:2%MC:50%
Felling
Skidding &Delimbing
Delimbed LogsAsh:1.4%MC:50%
Stack
Pile Dry
Dried LogsAsh:1.4%MC:30%
Debark
Chip
ChipsAsh:0.5%MC:30%PS: 2 in
Logging ResidueAsh:2%MC:30%
Chip
ChipsAsh:3%MC:30%PS: 2 in
Truck Transport
Truck Transport
Truck Unloading Truck Unloading
Pulp Chip Storage
Logging Residue Chip Storage
Pine Blend ChipsAsh:1.75%MC:30%PS: 2 in
Covered Storage
Thermochemical Conversion(Pyrolysis)
Final FeedstockAsh:1.75%MC:10%PS:2 in
Preprocessing
Rotary Drier
Dried Pine BlendAsh1.75%MC:10%PS: 2 in
Figure A-1. 2019 woody SOT feedstock supply system design supporting IDL.

39
Milestone Completion Report
Harvest and CollectionA.1
The 2019 woody SOT for IDL utilizes both clean pine and forest residues. The harvest of clean pine for energy is similar to harvest of materials for the production of paper or lumber, using integrated activities to prepare the raw material for transport from the field to the processing facility (Wang et al. 2013). The 2019 woody SOT for IDL maintains the same type of system for clean pine harvest and collection that was used in the 2018 SOT for CFP and is based on the system studied in the DOE High-Tonnage Biomass Logistics Demonstration Project carried out by Auburn University. The system uses a tracked feller buncher with a high-speed shear for felling the clean pine-sized material. Collection and primary transportation are completed using a grapple skidder with an oversized grapple to increase payload. Felling production using the feller buncher is 49 dry tons per hour (Cafferty and Hartley 2015, Sokhansanj et al. 2014, Jernigan 2012). Collection of the material is completed through use of a grapple skidder with a capacity of 40 dry tons per hour (Cafferty and Hartley 2015, Sokhansanj et al. 2014, Jernigan 2012).
Forest residues are materials, in the form of limbs, tops, cutoffs, and/or culled material thatoriginate from the harvest of saw log material. This material is accumulated at the landing as sawlogs are processed and stored in piles. Because the material is a byproduct of saw log processing,the cost of harvest and collection are not attributed to the material. Key harvest and collection assumptions for the 2019 woody SOT for IDL are shown in Table A-2.
Table A-2. Key harvest and collection assumptions for the 2019 woody SOT for IDL.
Component Clean Pine Forest Residue
Harvest Machine
Type Feller-buncher N/A
Rated Capacity (ton/hour) 75.38 N/A
Utilization (%) 65 N/A
Collection Machine
Type Grapple skidder N/A
Rated Capacity (ton/hour) 62 N/A
Utilization (%) 65 N/A
Average Extraction Distance (feet) 1,500 N/A
Initial Moisture Content 50% 50%
Field Dry Moisture Content 30% 30%
Operation Hours 50 week/year, 5 day/week, 8 hour/day
50 week/year, 5 day/week, 8 hour/day

40
Milestone Completion Report
StorageA.2
Storage involves stockpiling material to provide an adequate lead time for downstreamprocesses and accumulating material quantities for economical transportation. Woody biomassis subject to degradation by fungi, yeast, and bacteria that alter the feedstock’s composition.Degradation is a more prevalent problem in comminuted biomass, which has a higher surfacearea exposed and accessible to the damaging agents. Conversely, if the woody biomass isstored as uncomminuted material, the material is stable and can be kept for periods greaterthan a year without experiencing a reduction in quality (Nurmi 2014, Erber et al. 2014, and Ackerman et al. 2014). The additional benefit of storage in the field is that the material driesduring that time, reducing the moisture content before transportation (Stokes et al. 1993).
Field drying during storage (first included in the 2014 woody SOT and is also a keycomponent of Auburn’s High Tonnage Logistics Demonstration Project (Cafferty and Hartley 2015, Sokhansanj et al. 2014) is included in the 2019 woody SOT for IDL. A varietyof data show the effectiveness of field drying, which is highly variable by region, species,age, and methodology. A study conducted by North Carolina State University showed that byallowing logs to dry on the landing for a period of 330 to 360 days, the moisture content canbe reduced from 50% to approximately 18%, independent of time of harvest or tree type (i.e.,hardwood or softwood) (Roise et al. 2013). Because the study was completed in the sameregion as the defined study area, we can assume that similar results are likely and an assumption of a moisture reduction of 20% (from 50% down to 30%) in both clean pine and forest residue is conservative. Similar studies in other areas have shown greater moisturereductions in less time (Stokes et al. 1993, Greene et al. 2014).
When the materials reach the refinery they are stored in uncovered piles to await drying. Thestorage requirements at the conversion facility are assumed to be enough material to sustain the operation for 1 week. This quantity of material is assumed to be adequate to sustain operationsduring periods of time when material is not supplied due to weather or other disruptions, whilealso not being so great that storage losses will be large due to degradation (Table A-3).
Table A-3. Key storage assumptions for the 2019 woody SOT for IDL.
Component Clean Pine Forest Residue
Field-side
Type Log Pile Uncovered pile
Ground Cover None None
Material Loss (%) <1% <1%
Biorefinery
Type Uncovered pile Uncovered pile
Ground Cover Asphalt pad Asphalt pad
Material Loss (%) 2% 2%
Days of Supply 6 6

41
Milestone Completion Report
Landing PreprocessingA.3
The landing is the location where forest materials are initially aggregated, stored, and processed for transport and sale after harvest. Landing preprocessing is used to improve thetransportation and handling characteristics of the biomass feedstocks. Landing processing is designed to increase the bulk density and/or remove materials that will be considered wastefurther along the supply chain. Through both increasing density and removing waste materials, transportation cost for the material is reduced and subsequent processing is mademore efficient.
With clean pine the only processing operation at the landing is delimbing, Delimbing is accomplished just prior to stacking for storage using a delimbing gate. It is worth noting that use of the delimbing gate resulted in reduced productivity of the grapple skidder, since the stems are manually forced through a metal grid by the skidder to remove the branches.
Landing preprocessing for the forest residues included in the 2019 woody SOT for IDLblend begins before transportation to the depot. In this design the only preprocessing at the landing is chipping. The forest residues are chipped to a 2-in. chip using a mobile diskchipper. Production and fuel consumption for the chipper were taken from the DOE High-Tonnage Biomass Logistics Demonstration Project that was carried out by AuburnUniversity. The chips are then loaded into the chip trailer by the loader blowing the chipsfrom the out feed (Table A-4).
Table A-4. Key landing preprocessing assumptions for the 2019 woody SOT for IDL.
Component Clean Pine Forest Residue
Loader
Type Knuckle boom Knuckle boom
Capacity (ton/hr) 75.6 75.6
Delimbing
Type Gate N/A
Capacity (ton/hr) 50 N/A
Dry Matter Loss (%) 5 N/A
Size Reduction
Type N/A Chipper
Capacity (ton/hour) N/A 79.8
Dry Matter Loss (%) N/A 5
Particle Size Logs 2 in.
Moisture Content 30% 30%

42
Milestone Completion Report
Transportation and HandlingA.4
Transportation includes all processes involved in movement of material to a centralizedlocation (such as a preprocessing facility or to the biorefinery). Transportation includesprocesses such as loading, trucking, rail transport, and unloading. Beyond transportation,additional handling is required to transfer and queue biomass to the conversion facility. Surgebins, conveyors, dust collection, and miscellaneous equipment are used in handling operations.Handling operations depend on many factors, including biomass moisture content, bulkdensity, and particle size and shape distribution. Lignocellulosic feedstock inherentlypossesses characteristics that inhibit handling (e.g., high cohesivity, low density, highcompressibility, and high variability in particle size and shape uniformity) (Kenney et al.2013). For this reason, lignocellulosic feedstock handling operations are typically designed at150% of design capacity in order to accommodate variability in biomass handling properties.
The 2019 woody SOT for IDL uses truck transportation to the depot/biorefinery (Table A-5). The clean pine material is transported as logs on log trailers with a capacity of 3,600 ft3. Theforest residues are blown from the chipper into possum belly open back trailers with a capacity of4,000 ft3. The clean pine logs are assumed to have a bulk density of 16 lb/ft3, while the forest residue chips are assumed to have a dry bulk density of 11 lb/ft3 (Harris and Phillips 1986) andthe assumed moisture content at transportation is 30% (wet basis) (Greene et al, 2014). Thisresulted in a calculated weight-limited payload of 17.68 dry ton/load for the forest residuematerial. The draw radius for the clean pine was 51 miles while for the forest residue the draw radius was 104 miles, based on material availability.
Table A-5. Key transportation and handling assumptions for the 2019 woody SOT for IDL.
Component Clean Pine Forest ResidueTruck
Type Day cab Day Cab
Transportation Distance (mi) 51 104
Speed (mph) 50 50
Trailer
Type Log Trailers Open back possum belly
Volume 3,600 ft3 4,000 ft3
Dry Bulk Density 16 lb/ft3 11 lb/ft3
Moisture Content 30% 30%

43
Milestone Completion Report
Handling, Refinery OperationsA.5
The materials are offloaded at the facility using a truck tipper with a hopper, where theyare transported to storage by a conveyor. Depot operations include processing operationsrequired to create a uniform feedstock for distribution and use in the conversion process. Inaddition to processing of the feedstock, depot operations may also include necessaryauxiliary operations (such as dust collection and conveyors) to move material from one operation to the next.
The 2019 woody SOT for IDL refinery operations include only drying using process heat(Table A-6). The material is dried to 10% moisture content (wet basis) in a rotary drier using excess process heat from gasification. After drying, the chipped clean pine and forest residuesare placed in queue for feeding to the reactor.
Table A-6. Assumptions of key depot operations in the 2019 woody SOT for IDL.
Component Blended Chips
Loader
Capacity 120 ton/hr
Dryer
Capacity 1.5 ton/hr
Energy Consumption 38.78 kWh/ton
Waste Heat 178.57 MMBtu/hr
Moisture Reduction 20%

44
Milestone Completion Report
APPENDIX B – 2019 Woody State of Technology Feedstock Logistics Design and Assumptions for
Feedstock Supply to CFP
The 2019 woody SOT case for CFP (Figure B-1) consists of 50% clean pine and 50%forest residue and supplies 725,000 dry tons of biomass annually to the throat of the conversion reactor. The clean pine is harvested and preprocessed using a modified ground-based mechanized chip production system that is based on the system that was studied by Auburn University during their High Tonnage Logistics Demonstration Project. While the forest residues are preprocessed at the roadside using a system that is based on the chip processing system that was also studied by Auburn University during their High TonnageLogistics Demonstration Project. The processed forest residues are transported from theiraggregation points after preprocessing. The materials are delivered directly to the biorefinery, where they are dried using process heat before being delivered to the throat of the reactor.
The model relies on assumptions about exogenous factors such as interest rates, energy prices, and land rents. The prices for electricity, natural gas, and off-road diesel are identical to those used in the 2018 SOT for CFP. Table B-1 shows the updates that were used.
Table B-1. Energy prices and interest rates used to model feedstock logistics costs for the 2019woody SOT for CFP
Component 2018 Assumptions 2019 Assumptions
Interest Rate 8%a 8%a
Electricity Price $0.0672/kWhb $0.0672/kWhb
Natural Gas Price $3.36/MMBtub $3.36/MMBtub
Off-Road Diesel Price $2.01/gald $2.01/gald
aJones et al. 2013.bEIA 2017

45
Milestone Completion Report
Standing TreesAsh:2%MC:50%
Felling
Skidding &Delimbing
Delimbed LogsAsh:1.4%MC:50%
Stack
Pile Dry
Dried LogsAsh:1.4%MC:30%
Debark
Chip
ChipsAsh:0.5%MC:30%PS: 2 in
Logging ResidueAsh:2%MC:30%
Chip
ChipsAsh:3%MC:30%PS: 2 in
Truck Transport
Truck Transport
Truck Unloading Truck Unloading
Pulp Chip Storage
Logging Residue Chip Storage
Pine Blend ChipsAsh:1.75%MC:30%PS: 2 in
Covered Storage
Thermochemical Conversion(Pyrolysis)
Final FeedstockAsh:1.75%MC:10%
PS:<0.25in
Preprocessing
Rotary Drier
Dried Pine BlendAsh1.75%MC:10%
PS: <0.25 in
Rotary Shear
Milled Pine BlendAsh1.75%MC:30%
PS: <0.25 in
Figure B-1. 2019 woody SOT feedstock supply system design supporting CFP.

46
Milestone Completion Report
Harvest and CollectionA.6
The harvest of clean pine for energy is similar to harvest of materials for the production of paper or lumber, using integrated activities to prepare the raw material for transport from the field to the processing facility (Wang et al. 2013). The 2019 woody SOT for CFP maintains the same type of system for clean pine harvest and collection that had been used previously and is based on the system studied in the DOE High-Tonnage Biomass Logistics Demonstration Project carried out by Auburn University. The system uses a tracked feller buncher with a high-speed shear for felling the clean pine-sized material. Collection and primary transportation arecompleted using a grapple skidder with an oversized grapple to increase payload. Felling production using the feller buncher is 49 dry tons per hour. (Cafferty and Hartley 2015, Sokhansanj et al. 2014, Jernigan 2012). Collection of the material is completed through use of a grapple skidder with a capacity of 40 dry tons per hour (Cafferty and Hartley 2015, Sokhansanjet al. 2014, Jernigan 2012).
Forest residues are materials, in the form of limbs, tops, cutoffs, and/or culled material thatoriginate from the harvest of saw log material. This material is accumulated at the landing as sawlogs are processed and stored in piles. Because the material is a byproduct of saw log processing,the cost of harvest and collection are not attributed to the material.
Table B-2. Key harvest and collection assumptions for the 2019 woody SOT for CFP.
Component Clean Pine Forest Residue
Harvest Machine
Type Feller-buncher N/A
Rated Capacity (ton/hour) 75.38 N/A
Utilization (%) 65 N/A
Collection Machine
Type Grapple skidder N/A
Rated Capacity (ton/hour) 62 N/A
Utilization (%) 65 N/A
Average Extraction Distance (feet) 1,500 N/A
Initial Moisture Content 50% 50%
Field Dry Moisture Content 30% 30%
Operation Hours 50 week/year, 5 day/week, 8 hour/day
50 week/year, 5 day/week, 8 hour/day

47
Milestone Completion Report
StorageA.7
Storage involves stockpiling material to provide an adequate lead time for downstream processes and accumulating material quantities for economical transportation. Woody biomass is subject to degradation by fungi, yeast, and bacteria that alter the feedstock’s composition. Degradation is a more prevalent problem in comminuted biomass, which has a higher surface area exposed and accessible to the damaging agents. Conversely, if the woody biomass is stored as uncomminuted material, the material is stable and can be kept for periods greater than a year without experiencing a reduction in quality (Nurmi 2014, Erber et al. 2014, and Ackerman et al. 2014). The additional benefit of storage in the field is that the material dries during that time, reducing the moisture content before transportation (Stokes et al. 1993).
Field drying during storage (first included in the 2014 woody SOT and is also a key component of Auburn’s High Tonnage Logistics Demonstration Project (Cafferty and Hartley 2015, Sokhansanj et al. 2014) is included in the 2019 woody SOT for CFP. A variety of data shows the effectiveness of field drying, which is highly variable by region, species, age, and methodology. A study conducted by North Carolina State University showed that by allowing logs to dry on the landing for a period of 330 to 360 days, the moisture content can be reduced from 50% to approximately 18%, independent of time of harvest or tree type (i.e., hardwood or softwood) (Roise et al. 2013). Because the study was completed in the same region as the defined study area, we can assume that similar results are likely and an assumption of a moisture reduction of 20% (from 50% down to 30%) in both clean pine and forest residue is conservative. Similar studies in other areas have shown greater moisture reductions in less time (Stokes et al. 1993, Greene et al. 2014).
When the materials reach the refinery they are stored in uncovered piles to await drying. The storage requirements at the conversion facility are assumed to be enough material to sustain the operation for 1 week. This quantity of material is assumed to be adequate to sustain operations during periods of time when material is not supplied due to weather or other disruptions, while also not being so great that storage losses will be large due to degradation (Table B-3).
Table B-3. Key storage assumptions for the 2019 woody SOT for CFP.
Component Clean Pine Forest Residue
Field-side
Type Log Pile Uncovered pile
Ground Cover None None
Material Loss (%) <1% <1%
Biorefinery
Type Uncovered pile Uncovered pile
Ground Cover Asphalt pad Asphalt pad
Material Loss (%) 2% 2%
Days of Supply 6 6

48
Milestone Completion Report
Transportation and HandlingA.8
Transportation includes all processes involved in movement of material to a centralized location (such as a preprocessing facility or to the biorefinery). Transportation includes processes such as loading, trucking, rail transport, and unloading. Beyond transportation, additional handling is required to transfer and queue biomass to the conversion facility. Surge bins, conveyors, dust collection, and miscellaneous equipment are used in handling operations. Handling operations depend on many factors, including biomass moisture content, bulk density, and particle size and shape distribution. Lignocellulosic feedstock inherently possesses characteristics that inhibit handling (e.g., high cohesivity, low density, high compressibility, and high variability in particle size and shape uniformity) (Kenney et al. 2013). For this reason, lignocellulosic feedstock handling operations are typically designed at 150% of design capacity in order to accommodate variability in biomass handling properties.
The 2019 woody SOT for CFP uses truck transportation to the depot/biorefinery (Table B-4). The clean pine material is transported as logs on log trailers with a capacity of 3,600 ft3. The forest residues are blown from the chipper into possum belly open back trailers with a capacity of 4,000 ft3. The clean pine logs are assumed to have a bulk density of 16 lb/ft3, while the forest residue chips are assumed to have a dry bulk density of 11 lb/ft3 (Harris and Phillips 1986) and the assumed moisture content at transportation is 30% (wet basis) (Greene et al, 2014). This resulted in a calculated weight-limited payload of 17.68 dry ton/load for the forest residue material. The draw radius for the clean pine was 51 miles while for the forest residue the draw radius was 104 miles, based on material availability.
Table B-4. Key transportation and handling assumptions for the 2019 woody SOT for CFP.
Component Clean Pine Forest ResidueTruck
Type Day cab Day Cab
Transportation Distance (mi) 51 104
Speed (mph) 50 50
Trailer
Type Log Trailers Open back possum belly
Volume 3,600 ft3 4,000 ft3
Dry Bulk Density 16 lb/ft3 11 lb/ft3
Moisture Content 30% 30%

49
Milestone Completion Report
Landing PreprocessingA.1
With clean pine the only processing operation at the landing is delimbing, Delimbing is accomplished just prior to stacking for storage using a delimbing gate. It is worth noting that use of the delimbing gate resulted in reduced productivity of the grapple skidder, since the stems are manually forced through a metal grid by the skidder to remove the branches.
Table B-5. Key landing preprocessing assumptions for the 2019 woody SOT for CFP.
Component Clean Pine Forest Residue
Loader
Type Knuckle boom Knuckle boom
Capacity (ton/hr) 75.6 75.6
Delimbing
Type Gate N/A
Capacity (ton/hr) 50 N/A
Dry Matter Loss (%) 5 N/A
Size Reduction
Type N/A Chipper
Capacity (ton/hour) N/A 79.8
Dry Matter Loss (%) N/A 5
Particle Size Logs 2 in.
Moisture Content 30% 30%
Refinery OperationsA.2
The landing is the location where forest materials are initially aggregated, stored, and processed for transport and sale after harvest. Landing preprocessing is used to improve the transportation and handling characteristics of the biomass feedstocks. Landing processing is designed to increase the bulk density and/or remove materials that will be considered waste further along the supply chain. Through both increasing density and removing waste materials, transportation cost for the material is reduced and subsequent processing is made more efficient.
With clean pine the only processing operation at the landing is delimbing, Delimbing is accomplished just prior to stacking for storage using a delimbing gate. It is worth noting that use of the delimbing gate resulted in reduced productivity of the grapple skidder, since the stems are manually forced through a metal grid by the skidder to remove the branches.
Landing preprocessing for the forest residues included in the 2019 woody SOT for CFPblend begins before transportation to the depot. In this design the only preprocessing at the landing is chipping. The forest residues are chipped to a 2-in. chip using a mobile disk chipper.

50
Milestone Completion Report
Production and fuel consumption for the chipper were taken from the DOE High-Tonnage Biomass Logistics Demonstration Project that was carried out by Auburn University. The chips are then loaded into the chip trailer by the loader blowing the chips from the out feed (Table B-6).
Table B-6. Assumptions of key depot operations, including blending, in the 2019 woody SOT for CFP.
Component Clean Pine Forest Residue
Loader
Capacity 120 ton/hour 120 ton/hour
Chipper
Energy 19.3 kWh N/A
Capacity 25 ton/hour N/A
Debarker
Horsepower 50 N/A
Capacity 80 ton/hour N/A
Dry Matter Loss 3% N/A
Dryer
Capacity 4.8 ton/hour 4.8 ton/hour
Energy 50 kWh/ton 50 kWh/ton
Waste Heat 0% 0%
Moisture Reduction
20% 20%
Rotary Shear
Capacity 7.5 ton/hour 7.5 ton/hour
Energy 33.85 kWh/ton 33.85 kWh/ton
Screen Size 1/4-in 1/4-in
Operating Conditions
30% moisture 30% moisture
Dry Matter Loss 5% 5%
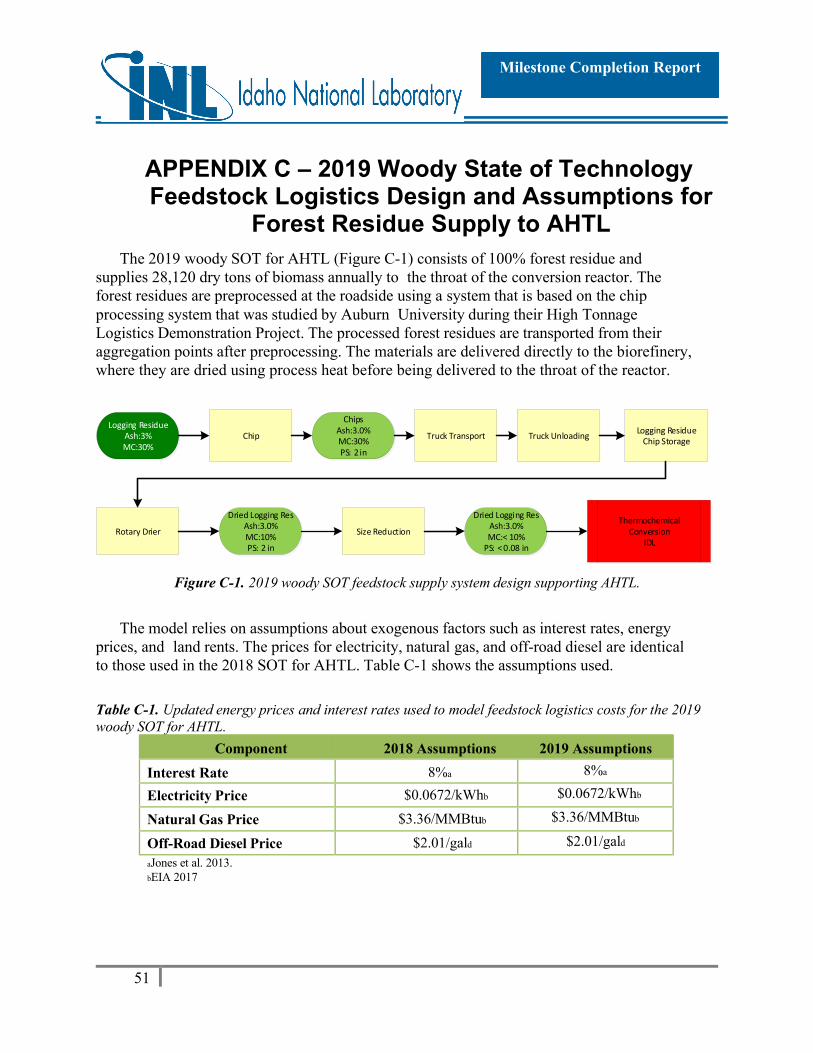
51
Milestone Completion Report
APPENDIX C – 2019 Woody State of Technology Feedstock Logistics Design and Assumptions for
Forest Residue Supply to AHTL
The 2019 woody SOT for AHTL (Figure C-1) consists of 100% forest residue and supplies 28,120 dry tons of biomass annually to the throat of the conversion reactor. The forest residues are preprocessed at the roadside using a system that is based on the chip processing system that was studied by Auburn University during their High TonnageLogistics Demonstration Project. The processed forest residues are transported from theiraggregation points after preprocessing. The materials are delivered directly to the biorefinery, where they are dried using process heat before being delivered to the throat of the reactor.
Logging ResidueAsh:3%MC:30%
Chip
ChipsAsh:3.0%MC:30%PS: 2 in
Truck Transport Truck UnloadingLogging Residue
Chip Storage
Thermochemical Conversion
IDLRotary Drier
Dried Logging ResAsh:3.0%MC:10%PS: 2 in
Size Reduction
Dried Logging ResAsh:3.0%MC:< 10%
PS: < 0.08 in
Figure C-1. 2019 woody SOT feedstock supply system design supporting AHTL.
The model relies on assumptions about exogenous factors such as interest rates, energyprices, and land rents. The prices for electricity, natural gas, and off-road diesel are identical to those used in the 2018 SOT for AHTL. Table C-1 shows the assumptions used.
Table C-1. Updated energy prices and interest rates used to model feedstock logistics costs for the 2019woody SOT for AHTL.
Component 2018 Assumptions 2019 Assumptions
Interest Rate 8%a 8%a
Electricity Price $0.0672/kWhb $0.0672/kWhb
Natural Gas Price $3.36/MMBtub $3.36/MMBtub
Off-Road Diesel Price $2.01/gald $2.01/gald
aJones et al. 2013.bEIA 2017
52
Milestone Completion Report
Harvest and CollectionA.9
The 2018 woody SOT for IDL utilizes only forest residues. Forest residues are materials, inthe form of limbs, tops, cutoffs, and/or culled material that originate from the harvest of saw logmaterial. This material is accumulated at the landing as saw logs are processed and stored in piles. Because the material is a byproduct of saw log processing, the cost of harvest andcollection are not attributed to the material.
StorageA.10
Storage involves stockpiling material to provide an adequate lead time for downstreamprocesses and accumulating material quantities for economical transportation. Woody biomassis subject to degradation by fungi, yeast, and bacteria that alter the feedstock’s composition.Degradation is a more prevalent problem in comminuted biomass, which has a higher surfacearea exposed and accessible to the damaging agents. Conversely, if the woody biomass isstored as uncomminuted material, the material is stable and can be kept for periods greaterthan a year without experiencing a reduction in quality (Nurmi 2014, Erber et al. 2014, and Ackerman et al. 2014). The additional benefit of storage in the field is that the material driesduring that time, reducing the moisture content before transportation (Stokes et al. 1993).
Field drying during storage (first included in the 2014 woody SOT and is also a keycomponent of Auburn’s High Tonnage Logistics Demonstration Project (Cafferty and Hartley 2015, Sokhansanj et al. 2014) is included in the 2019 woody SOT for AHTL. Avariety of data shows the effectiveness of field drying, which is highly variable by region,species, age, and methodology. A study conducted by North Carolina State Universityshowed that by allowing logs to dry on the landing for a period of 330 to 360 days, the moisture content can be reduced from 50% to approximately 18%, independent of time ofharvest or tree type (i.e., hardwood or softwood) (Roise et al. 2013). Because the study wascompleted in the same region as the defined study area, we can assume that similar results arelikely and an assumption of a moisture reduction of 20% (from 50% down to 30%) in bothclean pine and forest residue is conservative. Similar studies in other areas have showngreater moisture reductions in less time (Stokes et al. 1993, Greene et al. 2014).
When the materials reach the refinery they are stored in uncovered piles to await drying. Thestorage requirements at the conversion facility are assumed to be enough material to sustain the operation for 1 week of operation. This quantity of material is assumed to be adequate to sustainoperations during periods of time when material is not supplied due to weather or otherdisruptions, while also not being so great that storage losses will be large due to degradation(Table C-2).
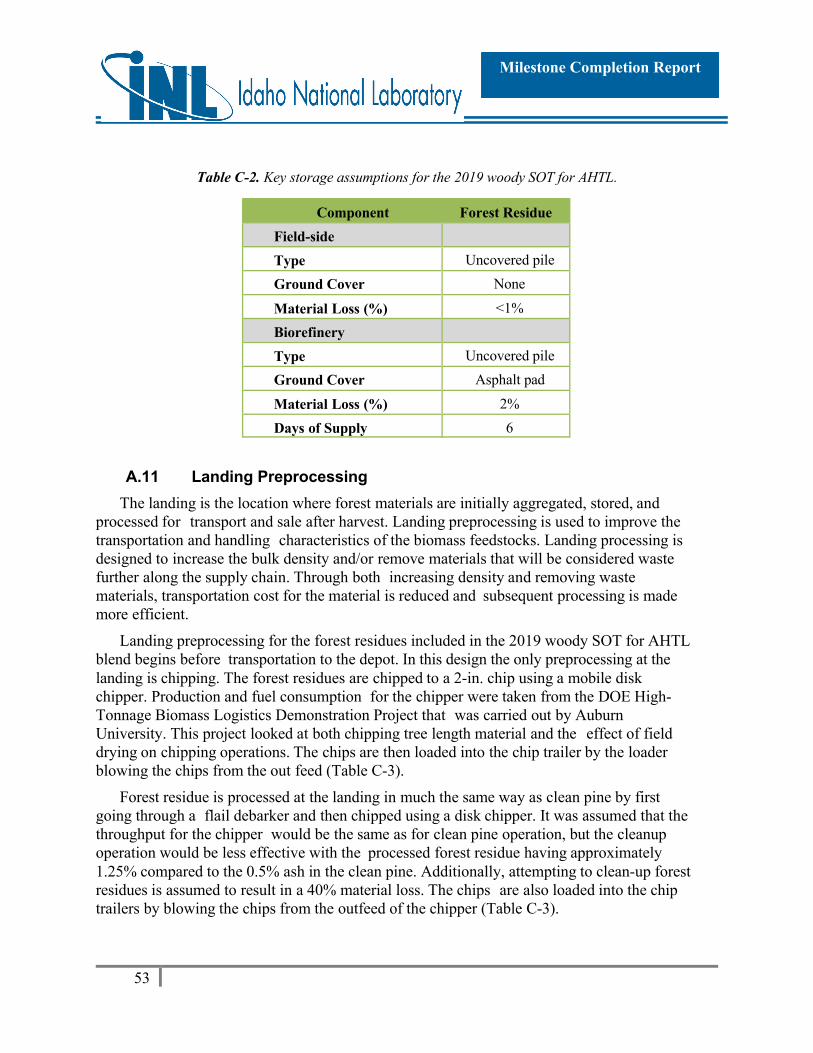
53
Milestone Completion Report
Table C-2. Key storage assumptions for the 2019 woody SOT for AHTL.
Component Forest Residue
Field-side
Type Uncovered pile
Ground Cover None
Material Loss (%) <1%
Biorefinery
Type Uncovered pile
Ground Cover Asphalt pad
Material Loss (%) 2%
Days of Supply 6
Landing PreprocessingA.11
The landing is the location where forest materials are initially aggregated, stored, and processed for transport and sale after harvest. Landing preprocessing is used to improve thetransportation and handling characteristics of the biomass feedstocks. Landing processing is designed to increase the bulk density and/or remove materials that will be considered wastefurther along the supply chain. Through both increasing density and removing waste materials, transportation cost for the material is reduced and subsequent processing is mademore efficient.
Landing preprocessing for the forest residues included in the 2019 woody SOT for AHTLblend begins before transportation to the depot. In this design the only preprocessing at the landing is chipping. The forest residues are chipped to a 2-in. chip using a mobile diskchipper. Production and fuel consumption for the chipper were taken from the DOE High-Tonnage Biomass Logistics Demonstration Project that was carried out by AuburnUniversity. This project looked at both chipping tree length material and the effect of fielddrying on chipping operations. The chips are then loaded into the chip trailer by the loaderblowing the chips from the out feed (Table C-3).
Forest residue is processed at the landing in much the same way as clean pine by firstgoing through a flail debarker and then chipped using a disk chipper. It was assumed that thethroughput for the chipper would be the same as for clean pine operation, but the cleanupoperation would be less effective with the processed forest residue having approximately1.25% compared to the 0.5% ash in the clean pine. Additionally, attempting to clean-up forestresidues is assumed to result in a 40% material loss. The chips are also loaded into the chiptrailers by blowing the chips from the outfeed of the chipper (Table C-3).

54
Milestone Completion Report
Table C-3. Key landing preprocessing assumptions for the 2019 SOT for AHTL.
Component Forest Residue
Loader
Type Knuckle boom
Capacity (ton/hr) 75.6
Size Reduction
Type Chipper
Capacity (ton/hour) 79.8
Dry Matter Loss (%) 5
Particle Size 2 in.
Moisture Content 30%
Transportation and HandlingA.12
Transportation includes all processes involved in movement of material to a centralizedlocation (such as a preprocessing facility or to the biorefinery). Transportation includesprocesses such as loading, trucking, rail transport, and unloading. Beyond transportation,additional handling is required to transfer and queue biomass to the conversion facility. Surgebins, conveyors, dust collection, and miscellaneous equipment are used in handling operations.Handling operations depend on many factors, including biomass moisture content, bulkdensity, and particle size and shape distribution. Lignocellulosic feedstock inherentlypossesses characteristics that inhibit handling (e.g., high cohesivity, low density, highcompressibility, and high variability in particle size and shape uniformity) (Kenney et al.2013). For this reason, lignocellulosic feedstock handling operations are typically designed at150% of design capacity in order to accommodate variability in biomass handling properties.
The 2019 woody SOT for AHTL uses truck transportation to the depot/biorefinery (Table C-4). The forest residues are blown from the chipper into possum belly open back trailerswith a capacity of 4,000 ft3. The material is assumed to have a dry bulk density of 11 lb/ft3
(Harris and Phillips 1986) and the assumed moisture content at transportation is 30% (wetbasis) (Greene et al, 2014). This resulted in a calculated weight-limited payload of 17.68 dryton/load for the forest residue material. The draw radius for the forest residue was 88 miles, based on material availability.

55
Milestone Completion Report
Table C-4. Key transportation and handling assumptions for the 2019 woody SOT for AHTL.
Component Forest Residue
Truck
Type Day Cab
Transportation Distance (mi) 88
Speed (mph) 50
Trailer
Type Open back possum belly
Volume 4,000 ft3
Dry Bulk Density 11 lb/ft3
Moisture Content 30%
Processing OperationsA.13
The materials are offloaded at the facility using a truck tipper with a hopper, where theyare transported to storage by a conveyor. Depot operations include processing operationsrequired to create a uniform feedstock for distribution and use in the conversion process. Inaddition to processing of the feedstock, depot operations may also include necessaryauxiliary operations (such as dust collection and conveyor) to move material from one operation to the next.
The 2019 woody SOT for AHTL refinery operations include only drying using process heat (Table C-5). The material is dried to 10% moisture content (wet basis) in a rotary drier.After drying, the forest residues are ground and placed in queue for feeding to the reactor.

56
Milestone Completion Report
Table C-5. Assumptions of key preprocessing operations in the 2019 woody SOT for AHTL.
Component Forest Residue
Loader
Capacity 120 ton/hr
Dryer
Capacity 1.5 ton/hr
Energy 350 kWh/ton
Waste Heat 0%
Moisture Reduction 20%
Grinder
Capacity 0.8 ton/hr
Energy 62.54 kWh/ton