(wloij3n t of impact resistant metal matrix ~.* (wloij3nt of impact resistant metal matrix united...
TRANSCRIPT

AFMLU-75-216
~.* (WLOIj3NT OF IMPACT RESISTANT METAL MATRIX
UNITED TECIJNOL OGLES RESEARCH CENTER
EAST HARTFOAD, CONNECTICUT 06108
- MARCH 1978
TECHNICAL REPOI T AFML-TR-75-216FINAL REPORT FOi PERIOD MARCH 1974- SEPTEMBER 1975
Approved for public release; distribution ulite 4
OC 1
AIR FORCE MATERIALS LABORATORY
AIR FORCE WRIGHT AERONAUTICAL LABORATORIES
AIR FORCE SYSTEMS COMMANDWRIGHT-PATTERSON AIR FORCE BASE, OHIO 45433

NOTICE
When Government drawings, specifications, or other data are usedfor any purpose other than in connection with a definitely relatedGovernment procurement operation, the United States Government there~yincurs no responsibility nor any obligation whatsoever; and the factthat the government may have formulated, furnished, or in any waysupplied the said drawings, specifications, or other data, is not tobe regarded by implication or otherwise as in any manner licensing tieholder or any other person or corporation, or conveying any rightsor permission to manufacture, use, or sell any patented invention thitmay in any way be related thereto.
This report has been reviewed and cleared for open publication and/orpublic release by the appropriate Office of Information (01) in accordancewith AFR 190-170 and DODD 5230.9. There is no objection to unlimiteddistribution of this report to the public at large or by DDC to theNational Technical Information Service (NTIS).
This technical report has been reviewed and is approved fo:publication.
J. S. Wilbeck, Capt. USAFProject Engineer
FOR THE COMMANDER
W. B. Crow ajor USAFStructural Metals Branch
Metals & Ceramics DivisionAir Force Materials Laboratory
Copies of the report should not be returned unless return is required bysecurity considerations, contractual obligations, or notice on a specificdocument.
its
UNCLASS I FIEDSECURITY CLASSIFICATION OF THIS PAGE rIWhon Dot. Entered)
PEPORT DOCUMENTATION PAGE BEFORE__COMPLETING__FORM
ER 2 GOT ACCESSION NO. 3 RECIPIENT'S CATALOG NUMDER
fArMLTR-75-216 4-4. TITLE (and S~bfiti.) / P Faa "I"ep--_
( DEVELOPM4ENT OF IMPACT RESISTANT METAL MATRIX -M a afq84-Setbq! 7tOPSTS6. P E,.r01FNOORG.REPOT NUu_"
1. AUTOR(*)B. CONTRACT OR GRANT NUMBER(@)
9. PERFORMING ORGANIZATION NAME AND ADDRESS III PROGRAM ELEMENT. PROJECT, TASK
United Technologies Corporation k* AREA & WORK UNIT NUMBERS
East Hlartfor'd C01CeiiC 00106 .1.LQA/It. CONTROLLING OFFICE NAME AND ADDRESS-1-Ia
Air Force Materials Laboratory September 30, 17Air Force Systems Command13 uBRF7
14 MONITOR4ING AGENCY NAM4E*-ADRESS("_U11M..nEfmn Con troling Ofice~) IS. SECURITYrih-atso AiCoreBae Oi 15l3 -i <
IS.. DECLASSIFICATION/ DOWNGRADING/ -/ /SCHEDULE
* lB. DISTRIBUTION STATEMENT fol thIhtRpattr
Approved for public release; distribution unlimited
17. DISTRIBUTION STATEMENT (of the abstre*nteed in Block 20. It different from, Report)
IS. SUPPLEMENTARY NOTES
19. KEY WORDS (Continue or, rere .#ol if necessry' .nd Identity by block nonmb.,)
Impact Tolerance Boron Aluminum Ballistic ImpactComposites Boron Titaniun Pendulum ImpactBoron Fiber M4etal Matrcix Coirju,,; it.e,:; CII:LIpy I s11jae t
IQ& ASTRACT (Conflo,,. -~ 0-1... old. If n.c .... y ad Idenify by block ... nb..)
etal matrix composites consisting of boron reinforced a1Iuminuiw, boron-aluminum-titanium, and Borsic reinforced I i f 'inisvi were fabricated to achieveimproved impact tolerance. Test procedures incliided both static, instru-
mented pendulum impact, and ballistic impact. It was demonstrated thRI
composite specimens can be fabricated and tested to achieve a wide 1vangcr ofImpact resistance. Ejncrgy" dicS ipation)j (-II 'xc-(eed 11hit (of "It'llo i thu c
enieri alloys, however t his smi erioritYi vrs icootr do eell t
DJO I4 ~73 1473 EDITION OF I NOV 69 IS OBSOLETE 1NLS3 I~S/N 0102-014-6601,
SECURITY CLASSIFICATION OF THIS PAGE (When Dae g,,tftd)

.wq - -. - (1- 7 -F, " --7AX N YMMM
ttv
* PREFACE
This report describes research conducted by the United Technologies., Research Center, Division of United Technologies Corporation, East Hartford,* .Connecticut, under USAF Contract No. F33615-74-C-5062. The author is
Dr. Karl M. Prewo.
The effort described was conducted in support of Project No. 7351 andTask 735107 for the Structural Metals Branch of the Metals and CeramicsDivision during the period March 1974 - September 1975. The contract monitorwas Capt. James S. Wilbeck. This program was partially funded with AirForce Materials Laboratory DIRECTOR'S FUNDS.
This report was submitted by the author in January 1976 for publicationas a Materials Laboratory Technical Report.
CtESSION 13F/
I..
S~i Whtt Section
t-.50 Seto
I iii
......... ........ .. .. .. .. .. .

TABLE OF CONTENTS
SECTION PAGE
I INTRODUCTION 1
II EXPERIMENTAL PROCEDURE 3
A. Materials 3B. Composite Fabrication 3C. Instrumented Pendulum Impact Testing 4D. Tensile Testing 4E. Ballistic Impact Testing 5
III RESULTS AND DISCUSSION 6
A. Instrumented Pendulum Impact 6B. Pendulum Impact of Boron Aluminum 9C. Pendulum Impact of Boron - Aluminum - Titanium 15D. Pendulum Impact of Borsic Reinforced Titanium 16E. Ballistic Testing 17
IV SUMMARY AND CONCLUSIONS 20
V FUTURE DIRECTIONS 23
TABLES
ILLUSTRATIONS
REFERENCES
V

LIST OF" TABLES
TableNo. T1itle
I Experimentally Determined Properties of Plasma Sprayed
Material with Foil
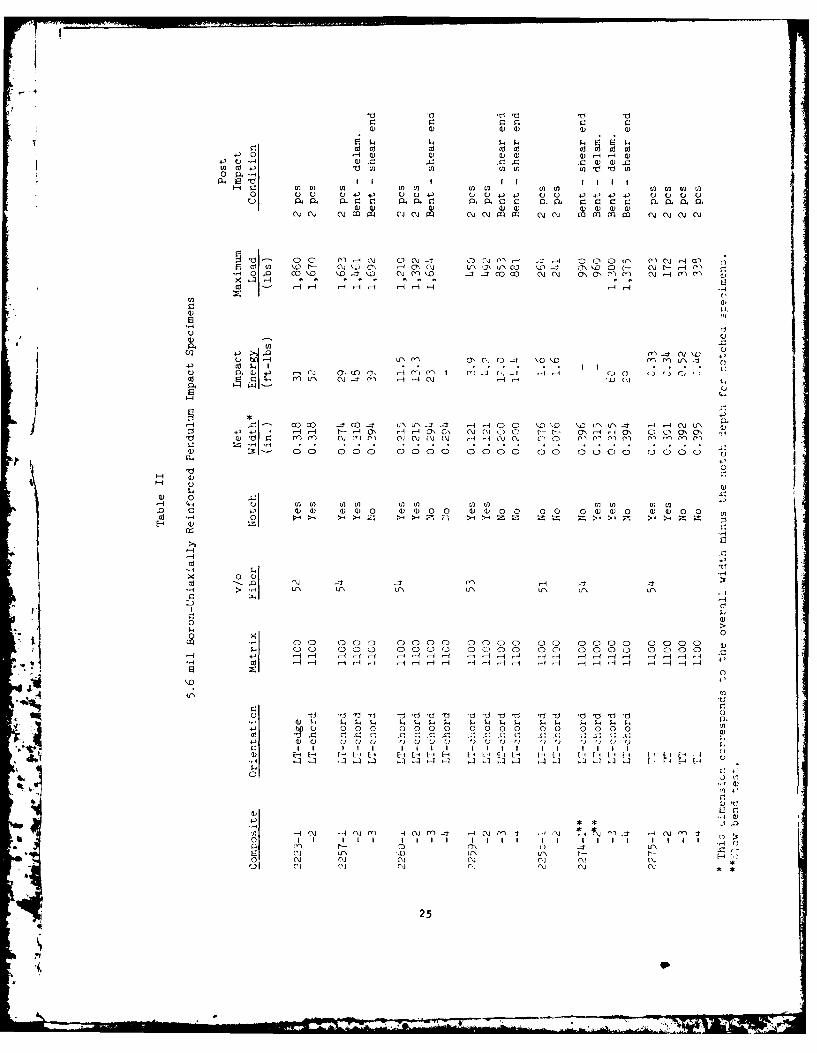
II 5.6 mil Boron-Uniaxially Reinforced Pendulum Impact Specimens
Tensile Test Data 5.6 mil Boron-Reinforced kluminim
IV 5.6 mil Boron - 4220 Reinforced Pendulum Impact ,pccinens
V 5.6 Mil Boron - +450 Reinforced Pendulum Impact Specimens
VI 5.6 Mil Boron - Comparison of Shell-Core and Distributed Ply
Concepts
VII 8.0 Mil Boron-Uniaxially Reinforced Pendulum Impact Specimens
VIII A. 8.0 Mil Boron-Reinforced Aluminum (Avco Fiber)B. 8.0 Mil Boron Reinforced Aluminum (CMC Fiber)
IX Calculated KID Values for Charpy V-Notch Specimens
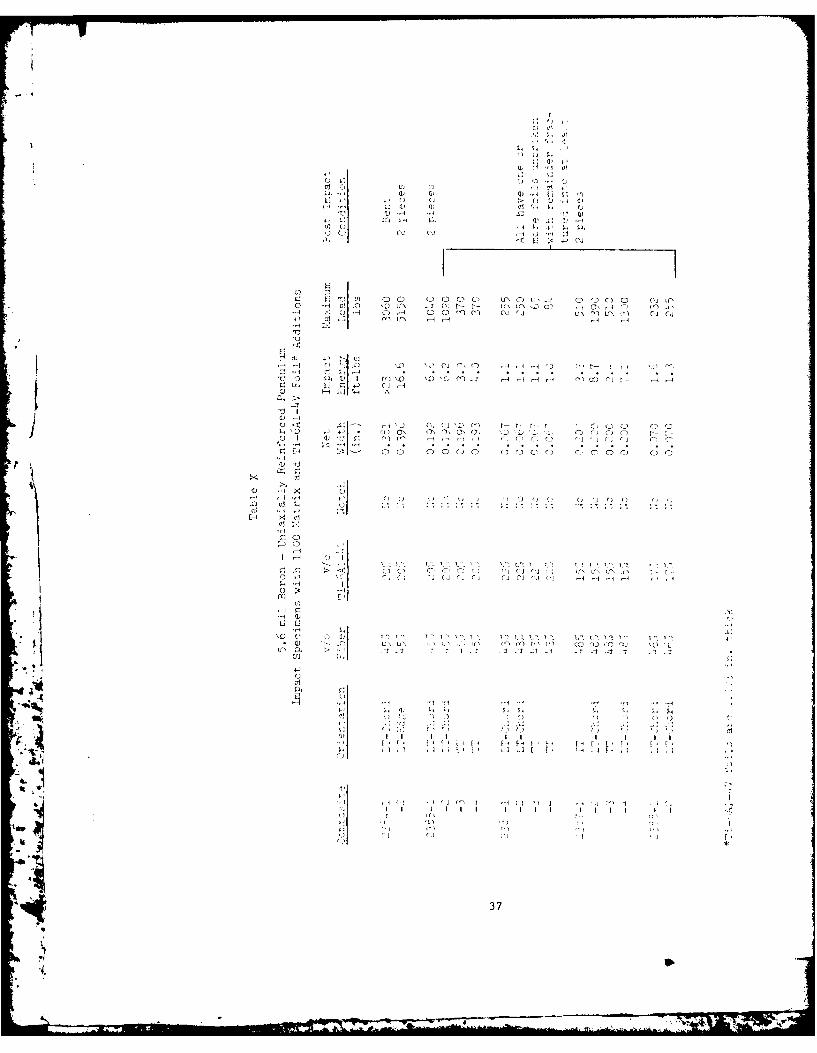
X 5.6 Mil Boron - Uniaxially Reinforced Pendulum Impact Specimenswith 1100 Matrix and Ti-6AI-4V Foil" Additions
XI 5.7 BORSIC-Uniaxially Reinforced Ti-6Al-4V-
XII Tensile Properties of 5.7 Mil BORSIC Uniaxially ReinforcedTi-6Al-4V (tymC)
XIII Tensile Properties of 5.7 BORSIC Uniaxially ReinforcedTi-6AI-4V (TRW)
XIV Cantilevered Ballistic impact 'Specimens (Multiple Impact perr;pet imen
XV Cantilevcred llallirtic Impact pccimen. (:Iilgle Impact perSpecimens
01imply 2lpporte. , l i:' i-c ImRpac t ''Jfc!i: (S 'i le rlripactper :2peclmeii)
×41] '1 ,ri d ! r1 r rurijnirl iled I mpa e 'lo' s T I:i r, of '.pecimens Alro'ic '-,,d Iy Hlallist.Ic Impact
vi
* 1 .. ... ... ..... , I

LIST OF ILLUSTRATIONS
FigureNumber Title
1 Variation Of Impoct ergy Per Unit Area With TheParameter Vfdf(a' uf) For Borsic R + Aluminum AndBoron + Alumin Composites of the LT Type
2 5.6 mil Boron-llO0 Aluminum Charpy Impact Specimens
3 Stress Strain Behavior of 5.6 mil Boron-60614 Instrumented Charpy Impact Machine5 Pendulum Impact Specimen Uleometry
6 Pendulum Impact Specimen Orientations
7 Ballistic Impact Specimen Configurations8 Impact Specimen Geometry9 Theoretical Shear Interaction Diagram for Aluminum
Matrix Composites (LT Orientation)
10 Theoretical Flexural Interaction Diagram for AluminumMatrix Composites (LT Orientation)
11 Flexural Interaction Diagram12 Load Deflection Curves For LT-5.6 B-6061 Unnotched
Three Point, Bend Specimens13 Energy Per Unit Volume to Maximum Load14 Shear Interaction Diagram15 Flexural Interaction Diagram16 Flexural Interaction Diagram17 Instrumented Impact Traces18 LT-5.6 B-11O0 Impact Specimens
19 Instrumented Impact Traces20 LT-5.6 B-1100 Impact Specimens21 Instrumented Impact Traces
22 Instrumented Impact Traces23 Instrumented Impact Traces24 Instrumented Impa)ct Traces25 Instrumented Impact Traces26 LT-5.6 B-6061 impact Specimens27 Instrumented Impact Traces
28 Instrumented Impact Traces29 Instrumented Impact Traces30 LT-5.6 B-202i Tmjct Specimenr31 Instrumented Impact Traces32 ±15'-5.6 B-11OO Impact Specimen
iY
JI

List Of Illustrations (Cont'd)
Figure
Number Title
33 Instrumented Impact Traces34 ±22°-5.6 B-11O0 Impact Specimens
35 Instrumented Impact Traces36 ±22-5.6 B-1100 Impact Specimens (Region of
Tim-Specimen Contact)
37 Instrumented Impact Traces38 Instrumented Impact Traces
39 Instrumented Impact Traces
40 ±68-5.6 B-11O0 Impact Specimens41 Instrumented Impact Traces42 j450-5.6 B-1IOO Impact Specimens43 Instrumented Impact Traces
44 1450-5.6 B-6061 Impact Specimens45 Instrumented Impact Traces46 ±450-5.6 B-2024 Impact Specimens
47 Instrumented Impact Traces48 Flexural Interaction Diagram
49 Instrumented Impact Traces50 LT-8.0 B-1100 Impact Specimens51 Instrumented Impact Traces
52 LT-8.O B-6061 Impact Specimens
53 Instrumented Impact Traces
54 Fiber Splitting in Transverse Tension
55 Flexural Interaction Diagram
56 Instrumented Impact Traces57 Notched and Unnotched Ti-6AI-4V Impact Specimens
58 Instrumented Impact Traces59 Instrumented Impact Traces60 Energy Dissipated as a Function of Specimen Geometry61 Flexural Interaction Diagram62 Instrumented Impact Traces63 instrumented Impact Traces64 Instrumented Impact Traces65 Flexural Interaction Diagram66 Energy Dissipated as a Function of Specimen Geometry
For 5.7 Borsic Reinforced Ti-6AI-4V in LT Orientation67 Instrumented Impact Traces
68 Inctrumented Impact Traces
= a

List Of Illustrations (Cont'd)
FigureNumber Title
69 Cantilevered Ballistic Test Specimens (Clamped At
Right End)70 Simply Supported Ballistic Test Specimens
71 Ballistic Impact of Borsic Titanium
72 Cantilevered Ballistic Test Specimens
73 Cantilevered Ballistic Test Specimens (Clamped At
Right End)74 Cantilevered Ballistic Test Specimens (Clamped At
Right End)
vi
ix

* PRECIDIIO P NOT 11124h'D
'-.4 I. INTRODUCTION
At the inception of this program the major inhibitor to the use of metalmatrix composites for jet engine fan blades was the low impact resistance ofthis class of materials. This observation has, in the past, been demonstratedthrough both actual component and laboratory specimen tests in which, whencompared to current monolithic titanium, composite specimens appeared lessresistant to impact by objects. The herein described program was begun,however, because of several findings which indicated that metal matrix compos-ite impact tolerance could be significantly improved.
The first of these findings was a demonstration that the impart resis-tance of boron aluminum composites, as measured by the total energy to failureof a standard notched Charpy specimen, could be significantly altered by con-trol of fiber effective strength, filament volume percent, filament diameterand matrix shear strength (Ref. 1). As shown in Fig. 1, this dependence wasfound to exist over a wide range of filament and matrix combinations andindicated that significant improvements in energy dissipation capability could
L J be achieved if a high strength 8.0 mil diameter filament could be developedIand used in conjunction with a low shear strength matrix.
Shortly thereafter, guided by the data developed in Ref. 1, it was dem-onstrated that boron reinforced aluminum composites could be fabricated andtested to achieve notched Charpy impact energy levels significantly greaterthan those characteristic of titanium alloys (Refs. 2, 3). This demonstrationillustrated, for the first time, the point that aluminum matrix compositeswere not necessarily brittle and, in fact by a selected test procedure, theywere superior in impact tolerance to state-of-the-art engineering alloys. Thespecimen shown in Fig. 2 dissipated over 22 ft lbs of impact energy and
remained substantially unbroken while similar geometry specimens of Ti-6AI-4Vfailed after dissipating approximately 15-20 ft lbs of energy. In this work,Ref. 2, it was also shown that a hybridization concept, which included theuse of both low shear strength matrix areas (for high impact energy) and highstrength matrix areas (for high shear and transverse strength), could beutilized to combine high impact tolerance with high off-axis compositestrength in one composite system.
Indications that the meanured impact re:;istance of composites Is stronglyaffected by composite specimen geometry were also reported (Refs. 1, 2, 3).The rationale for this was postulated to depend on the relative contributionsof matrix plasticity and filament fracture to ultimate composite failure.Very large amounts of energy can b( dissipated by matrix deformation, however,the applied stress state must be such as to permit this to be a controlling mode
Ki
.4!
- 2

of failure. The comparison of tensile stress-strain curves for boron aluminumshown in Fig. 3 is illustrative of this point. The matrix shear controlledfailure of a 450 specimen dissipated a much larger quantity of' energy thanthe filament controlled failure of a 0* specimen or the constrained matrixcontrolled failure of the 900 specimen. The recognition of this importanceof stress state-composite interaction clearly pointed out the need for testingand descriptive procedures going beyond the simple overall notched Charpyimpact energy.
Finally, another concern which contributed to the formulation of thisprogram was the recognition that impact energy dissipation capability was notthe only criterion important in achieving a highly impact resistant composite.The load-time history and maximum load sustained during impact are al]no ofgreat importance. This was clearly illustrated for the cI;C o" :.ilica 1i A a-ment reinforced epoxy, (Ref. 4), where the exposure to a steam environment ofthese composites caused only a small (14 percent) decrease in specimen impactenergy; however, the maximum impact load carrying capacity decreased by 45percent. The description of material impact resistance solely on the basisof energy dissipation can be misleading and hence, the herein described pro-gram emphasized the use of an instrumented test procedure which permitted theevaluation of both the load-time impact history of a specimen as well as the
overall impact energy. It should also be noted that this additional loadinginformation is absolutely essential if composite specimen performance is to beused to design actual engine components. Charpy impact energy is not a designtool, it is only a qualitative indicator of material performance. The use ofmore sophisticated treatments such as those based on frncture mechanics,(Refs. 5, 6 and 7) are needed for structural design in the presence of flawsand, as will be demonstrated in this report, analyses relating performance totest geometry and stress state are necessary to effectively select materialsfor the fabrication of structures resistant to impact.
I.
V.
M2

II. EXPERIMENTAL PROCEDURE
A. MATERIALS
The following materials were purchased from the indicated sources.
5.6 mil diameter boron filament - Composite Materials Corporation5.7 mil diameter Borsic filament Composite Materials CorporationAl alloy foils - Composite Materials CorporationAl alloy powder - Composite Materials Corporation8 mil diameter boron filament - Avco CorporationTi - 6A1 -4V foil - Teledyne Rodney Metals
5.7 Borsic Reinforced - Ti-6A-hV - TRW Corporation
B. COMPOSITE FABRICATION
1. Boron Reinforced Aluminum
)All of the boron filament reinforced aluminum composites evaluated during
this program were fabricated at UTRC using plasma sprayed precursor tapes anddiffusion bonding procedures. The fabrication of the precursor tapes has beendescribed in detail in several previous reports (Refs. 1, 8), and will not berepeated here. All diffusion bonding was performed in a vacuum of 10-5 Torr,at applied pressures in excessof 2,000 psi and with the composite layers
confined in close walled dies.
The temperature of bonding depended on the composition of the matrix,however, it was always below the alloy solidus temperature.
The properties of the aluminum alloys used during this investigation aretabulated in Table I.
2. Boron-Aluminum-Titanium
Composite specimens were fabricated containing added layers of Ti-6Al-4V.Bonding conditions used were substantially similar to those used for all alu-minum matrix composites, however, in this case temperatures were also limited*1, to prevent the formation of an intermetallic layer between the added titanium
V, foils and the aluminum.
3. Borsic-Titanium
Two sources of Borsic reinforced titanium were evalua+.ed under this pro-gram. Several panels, fabricated by TRW, were purchased and additional panels
,
i % . ....,

were fabricated at UTRC. The composite panels fabricated at UTRC were
diffusion bonded using polystyrene bonded precursor tapes. Each tape consisted
of Ti-6AI-4V foil with an overlayer of evenly spaced Borsic fibers bonded tothe foil by the polystyrene fugitive. Hot pressing was performed by heatingin vacuum to 450-490"C to first remove the polystyrene a-rd then raising to
the ultimate bonding temperature followed by final high pressure application.
C. INSTRUMENTED PENDULUM IMPACT TESTING
All pendulum impact tests were performed using an instrumented tup which
permits the generation of load-time traces describing the impact event.
Continuous load measurement is achieved through the use of strain gaLes mountedon the tup and a calibration to translate strain readings into load. Thestrain gage output is monitored on an oscilloscope producing a load-time trace
which is then photographically recorded.
Two instrumented impact testers were constructed at UTRC for this purposeusing standard 23 ft lb and 260 ft lb capacity pendulum impact machines. The23 ft lb tester is shown in Fig. 4.
Specimens of both standard and thin nonstandard sizes were tested during
this program. To insure uniform impact loading of the thin specimens, shimshave been fabricated to position the cpecimen impact face properly with respect
to the bottom of the pendulum swing.
D. TENSILE TESTING
padsComposite tensile specimens were parallel sided with fiberglass doubler
pads bonded onto each end. The overall specimen dimensions were five inches
long and 0.4 inch wide with a final effective gage length of 1.0 inch.
,1 Measurements of modulus and failure strain weie obtained using straingages mounted on opposite specimen sides.
The pendulum impact specimen geometries tested are shown in Fig. )4. The
specimen orientations tested are indicated in lig. 5. They eonsi:;t of two
basic types, LT and TT. This notation was first introduced during another
UTRC program, (Ref. 1). The letters refer to the directions which are longi-tudinal (L) or transverse (T) with respect to the specimen principal fiberaxis. The first letter of each pair refers to the normal to the crack
growth plane while the second letter refers to the direction of crack growth.-' I The LT type specimens were also tested in two orientations, edgewise or chord-
wise. These designations refer to impact orientations based on jet engine
fan blade terminology. A chord,-ise impact on a fan blade consisting of layers
:4!n 4
_ _ _

of boron aluminum tape is simulated by the uppermost specimen in Fig. 5, inthat the direction of impact is normal to the tape plies. An edgewise fan
blade impact configuration is simulated by the impact direction being in the
plane of the tape plies.
E. BALLISTIC IMPACT TESTING
All ballistic impact tests were perforimed at the Air Force Materials Lab-oratory, Wright Patterson Air Force Base. Two geometries of impact were
utilized (Fig. 7) to demonstrate, as in the case of pendulum impact, the
dependence of material performance or imposed stress state. Strain gages
were located on some of the ballistic specimens and their locations are
indicated in Fig. 7. All ballistic tests were performed using RTV cylinders
having a weight of approximately 0.36 gm. The cylinders were 0.295" diameter,
0.295" long, and were fired with the use of a sabot which was caught prior to
specimen impact.
All ballistic tests were monitored using a slit camera which recorded
specimen and projectile motions at the point of impact. In addition strain
gage data and framing camera records were taken on selected specimens. The
use of these data to interpret and correlate specimen performance was not
within the scope of this program. However, these data will prove extremely
useful to other investigators who may wish to investigate material impact
resistance.
:1
k ..
.

H1 . RESUL'IS AND DI ..... 1ON
A. INSTRUMENTED PENDULUM IMPACT
The instrunented petdulum impact. t.(:t. war the I .- it r:(I no:. exl.en:,ivoly
during the performance of this program. A.; -. t ald it I, to inlt.rodi o t l, if.was clear to the investigator that a simple measure of the total energy tofail a standard Charpy specimen was not a sufficient criterion b! which torank potential fan blade materials. The use of the instrumented tuJp war- amajor step forward in achieving truly meaningtiul data. Many prvious puli.-cations have described the details of the procedure and precautions neces-sary to achieve accurate instrumented impact data, Refs. 3, 9, 10. The majorproblem lies in recording a signal which accurately describes the loadinghistory of the tup during impact. Extensive precautions were taken at UTBCto insure that this was the case and impact specimens were shared with twoother independent laboratories, Refs. 11, 12, to insure that the equipment andprocedures developed at UTRC were capable of providing accurate and precisedata. It was concluded that this was the case.
The interpretation of load and energy data obtained from the instrumentedpendulum impact test is only meaningful if one considers the dependance of the
*composite response on specimen geometry and hence imposed stress state.
Multiple composite failure modes are possible, depending on the dimensions ofthe specimens tested.
Figure 8 illustrates the problem at hand. Specimen dimensions of L andh are shown in this figure. For Charpy inpact or three point bend, the Lrefers to the specimen span and h to the width over which crack propagationmust occur. The standard Chapy !.s I with an i/t hta. i o of' 5 (t ol.chcd) or )(unnotched) is not at all similar to the infcMmkml blade application whereeffective L/h values can exceed 100. On a local damage scale, the similaritymay be closer; however, it is clear that the geometry dependence of compositeIperformance must be understood prior to any extension of pendulum impact data
* to blade design. The inclusion of this geometry dependence can be accom-piished with existing understanding of composite beam testing, Refs. 13, 14.Through the use of these concepts, and simple beam equations, it is possibleto plot interaction diagrams which illustraie the dependence of unnotchedcomposite beam strength on specimen geometry. Although these equations weredeveloped for the standard bend tests which are performed at slow rates ofload application, usually 0.01 to 0.1 inches per minute, they apply equallywell to specimens imipacted at. (,000 to 10,000 inches per minute, which is the
6
.4,

usual range of velocity for Charpy ihpact testing. The dependence of material
strength on impact velocity is another matter independent of the method of
analysis.
For an unnotched bend test of a simply supported composite beam ofrectangular cross section, simple equations predict nominal levels of maximumshear and flexural stresses. The maximum shear stress occurs at the neutralsurface and is given by
1,T 3/4 -
max bh
The maximum flexural stress occurring at the same time isPL
amax = 3/2 P
and occurs at midspan at the top fibers (side away from the loadiniw nose).
The use of these equations presupposes a series of assumptions which aresatisfied quite well by composites of the types tested in this program and fort which the principal axes of orthotropy coincide with the axes of symmetry of
the test specimen. The use of these equations is recognized by the investiga-
tor to be overly simplistic in light of effects of stress concentrations inthe areas of the loading points, Ref. 15, and the need for more sophisticated
stress analyses to completely characterize the existant stresses, particularly
for multiaxially reinforced specimens Refs. 16, 17, 18. However, as will bedemonstrated in this report these simple equations are useful in rationaliz-
ing and predicting composite beam response.
Figure 9 is a theoretical construction of a series of shear intcractionidiagr ms for various boron fiber reinforced metal matrix composite systems in
the LT orientation based on assumed values of composite arnd matlrix sI.ri,,x,.hms.The horizontal lines in the low L/h region indl.cate the expected levels of
* composite shear strength obtainable for composites either yielding or frac-turing due to matrix yield or failure. The ne true levels oC matl..rial shearstrength Tmax are independent of specimen geometry (1,/h), however, t.hemeasured (ooserved) values of T max will not be independent at higher levelsof (L/h) due to a transition of failure mode from shear to flexural. In the
higher L/h regions a calculation of shear strength would ie incorrect. Thecalculated curves of decreasing observed shear strength are based on assumedvalues of composite flexural strength, oo . Similarly, in Fig. 10. a flcxuralinteraction diagram, the transition into a shear failure region is noted bythe drop in calculated composite flexural strength at small values of L1h.
In both figures the L/h values for notched and uinnotched standard sizedCharpy specimens are denoted by the shaded regions indicating that, for 1100and 6061 aluminum matrix composites, the specimen behavior is controlled by
shear strength.
7
9 !

To experimentally demonstrate the validity of the above approach, aseries of unnotched 5.6 mil diameter boron reinforced 6061 specimens of theLT-chordwise orientation were tested in three point bend. These specimenswere tested over a range of span to width (T,/h) ratios by varying both 1, andh. The resultant load-deflection traces were analyzed utilizing the flex 'alinteraction diagram approach. Calculation of the flexural strength of eachspecimen based on the maximum load to failure, and plotting the resultantvalues as a function of L/h resulted in Fifg. 11. As has been dis cunsed a|,ovo.the apparent flexural strength is a function of 1,/h, and only for large valuesof L/h does the flexural strength reach a constant level. The sloping linefor low values of L/h was calculated using the known shear strength of 6061aluminun and agrees well with the observed decrease in apparent. flexuralstrength. The acttial matrix ,.hear stren ,th was mult ipil id 1, a t'ac t ,r or' 1.15which is introduced to include the effects of constraint due to the fiberspresent.
It is interesting to compare the behavior of specimens tested in differ-ent regions of the interaction diagram. Figure 12 presents the load-deflec-tion traces for three specimens. Specimen 2317-1 exhibited a large degree ofplasticity and a very round curve. Specimen 2320-1, however, with a larger
value of L/h, failed more abruptly and with less energy dissipated by plas-ticity. Finally, specimen 2320-4 exhibited no signs of plasticity at all.These modes of fracture agree well with the behavior expected, i.e., shearcontrolled or flexural strength controlled, as shown in Fig. 11 depending onL/h value.
Another method used to examine the effect of specimen L/h ratio was todetermine the energy required to raise each of the specimens in Pig. 11 tothe maximum load prior to failire. This value is less than the totalrequired to fracture each specimen by that amount required to propagate acrack through the system (i.e., we observed stable crack growth). When theinitial energy is divided by the total voliune of each specimen, a very strongdependence on L/h is evident, Fig. 13. Tn the flexural strength controlledregion (high L/h), this value reaches the theoretical limit calculated forfully elastic behavior as shown in the figure.
The same type of dependence on L/h is true for the testing of notchedmetal matrix specimeAs. The data in Figs. 14 and 15 were obtained previousto this study at U'[RC, Ref. 19; however, now they are plotted as a function
of L/h. Once again the interaction diagram concept provides agreementbetween calculation (based on 1100 matrix shear strength) and experimentaldata.
.'

; . I
Because of the above noLed very stiv'ng dependences of compositeperformance on test specinen geometry, it is unrealistic to try and rankcomposite systems simply on 'he basis of a standard Charpy energy value. At
least this is true if one wishes to achieve more than just a qualitativeunderstanding of composite behavior.
B. PENDULUM IMPACT OF BORON ALUM]NI4
The following sub-sections will describe the most important pointsderived from the instrumented pendulum impact testing of boron fiber rein-forced specimens. The data will be presented primarily in graphical form,however, tabulations of the basic data are also included.
The major observation to be made is that the pendulum impact performanceof boron reinforced aluminum composites can be varied over a very wide rangethrough choice of matrix, fiber and orientation. Extremes of impact ener-
gies, for standard Charpy specimens, of from 1 ft lb to specimens that couldnot be fractured by a 260 ft lb pendulum strike, were recorded. The control-
ling factors are discussed below.
(1) Matrix Composition
The impact data obtained by testing unidirectionally reinforced 5.6 mildiameter boron reinforced alaminiun matrix composites are listed in Table I[.The comparison of LT-type specimen data, Fig. 16, indicates the role ofmatrix composition and strength in both the shear controlled (low L/h) andtensile strength controlled (high L/h) regions. The lines drawn in the lowL/h regions were calculated omi the basis of matrix alloy shear strengths andfound to agree in each case quite well with the experimentally obnerve.1 opeci-men strength. The maximum load (hence specimen strength) withstood duringimpact, increased with increasing matrix strength. It is interesting to note
that the matrix control of observed flexural strength is similarly signifi-
cant in the high L/h region. The increase of strength with increasint; matrix
strength was unexpected, at least to the degree to which it is evident.
Tensile specimen data, Table ITi, for axially reinforced specimens did not
indicate the same dependence of 00 tensile strength on matrix strength,although previous investigations have demonstrated the axial compositestrength can increase with increasing matrix strength.
The observed ability of LT type specinens to dissipate energy during
impact and fracture was also strongly dependelit on composite matrix strength.SIn this cshowever. increasing matrix strength caused a decrease in pr
formance. This is best demonstrated by discussion of the oscilloscope tracesobtained during impact and the resultant specimen deformations observed.
9

(a) LT Type 5.6 Boron Reinforced 1100
1100 matrix specimens have demonstrated the ability to dissipate alarge amount of energy in the LT orientation, however, at the expense of
fracture strength. Figure 17 demonstrates the importance of impact orienta-tion with regard to the tape ply planes. Examination of Figs. 17 and 18demonstrates that interlaminar shear between taipe plie': ef PPe0Jiv,!1 divert.:the fracture path and dissipates large quarititiec o[' eneriry l.ittLe chaitge
in maximum load is observed.
Figures 19 and 20 demonstrate the differences between notched andunnotched specimens with large h dimensions. Both specimens sheared off atone end during passage through the impact machine. (The sheared off end waslost for the notched specimen). Thus, in both cases the observed energy levelsare less than could have been dissipated. This explains the anomaly of alower energy value for the unnotched specimen than the notched.
The load-time traces for additional specimens of decreasing thickness (h)in both notched and unnotched condition are shown in Figs. 21, 22, and 23. InFig. 21 the unnotched specimen required two inpacts to cause fracture andboth traces are shown in the same photo.
(b) LT Type 5.6 Boron Reinforced 6061
The 6061 matrix specimens failed at considerably higher maximum load(and stress) levels than the previously described 1100 matrix specimens.
This was, however, accompanied by lower values of enerrgy dissipation, arnd asshown in Fig. 24, by less extended load-time traces. One inLtcrcsi anomalyoccurred, however, in Fig. 25. The unnotched specimen 228'(-3 exceeded by
139 lbs the maximum load of similar specimens 2287-2,4. This was accompaniedby a very large amount of iute rlairirar :ear arid te eo a.irdl io whi 'Ii w;;: ii I
typical of the other 6061 specimens, Fig. 26. :pecinen 3 indicates crackdiversion and link up with the cracks emanating from the zone of damage inthe contact region. Specimen 4 also exhibited small amounts of interlaminar
failure, however, these were not as extensive as those of specimen 3. Theslightly higher maximum load apparently succeeded in causing the extension ofinterlaminar cracks and the more gradual decrease in load with time, Fig. 25,due to effective crack blunting.
(c) LT Type 5.6 Boron Reinforced 2024 and 5052/56
Both 2024 and 5052/56 matrix type specimens exhihited only small indica-
tions of plasticity even for the specimens wit, low values of (T/l). 'lhi
instrumented traces indieate only\ a small degree of' nonlitearD.y, "igs. 21and 28, with the specimens of smallest h exhioiting a completely linear
I0

behavior, Fig. 29. The fractured specimens, Fig. 30, clearly indicate this
lack of extensive plasticity for both notched and unnotched configu rations.Absence of damage in tile region of contact with the tip is also noted.
(2) FiLer Orientation
The dependence of composite impact performance on fiber orientation iseven greater than that noted above for matrix strength.
(a) 5.6 B - Uniaxially Reinforced Specimens
As indicated by the data in Table I there is a very large decrease inimpact load and impact energy by changing from the LT to the TT orientation.The reasons for this are that; firstly the matrix is so highly constrained bythe fibers that it can not exhibit much plasticity during failure in the 900mode; and secondly composite transverse strength is so much lower than axial
strength.
() ±150 -5.6 Boron Reinforced 1100
Figure 31 presents the instrumented impact traces for +150 reinforcedspecimens with an 1100 matrix. Both in maximum load carrying capability andimpact energy dissipation, these specimens performed in a manner similar to
LT type specimens. Figure 32 illusfrates that a considerable amount of dela-mination took place as well as the shearing off of one end of the specimen.
(c) 4220 -5.6 Boron Beinforced iOO, 6061 and 202h1
The load-timu traces for 5.6 boron-ll00 specimens of edgewise and chord-wise orientations are compared in Fig. 33. It is interesting to note thehigher level of energy dissipated for the notched specimen which delaminated
more severely than the unnotched specimen, Fig. 34. This observation is
unexplained, particularly in view of the expected higher load carrying capa-city of the unnotched specimen. On the basis of maximum stress, however, thenotched specimen reached a flexucral tensile stress of 102,000 psi while the
unnotched specimen only reached a level of 84,000 psi. The edgewise impact
of similar specimens, Figs. 34 and 36, resulted in much higher maximum loadsto failure but also lower energy dissipation. The photos in Fig. 36 show theareas of contact of specimen and tup illustrating the very large anounts of
local damage.
Figures 37 and 38 demonstrate the impact beavior of thin specimens withvarying matrix composition. rhe 2024 and 6061 matrix composite specimens
exhibited very high failure strengths while the 1100 matrix specimen failed
A%
." _ __ .. . •....,1.

p at a much lower strength level. The level of enerrgy dissipated war notdecreased, however, due to the post maximm load eriergy dissipation exhibited
by the 1100 specimen.
The +680 orientation was also tested, Finn. 39 and 40. and found to bevery poor in impaci, tolerarice. Both maxbtium load:; a,,ul reergy dinsipat, ioncapacity were very low. it is interesting to note that specimen 2277-1 didnot fracture; ductility was sufficient to permit a large amount of deforna-
tion.
The data for these specimens are tabulated in Table IV.
0(d) +45 -5.6 Boron Reinforced 1100, 6061 arid. 2024
Figures 41 and 142 illustrate the large deformation and hence energydissipation capacity of the 1100 matrix with 145 ° fibers. Both chordwise
and edgewise impacts deform, but do not fracture, the specimens. The narrow,C-2231, as well as wide, C-2226-1, specimens exhibit this capacity. The 6061
matrix specimens of similar orientation also exhibit high energy dissipationcapacity, however, this is accomplished with a very significant increase inload carrying capacity, Figs. 43, 44. Uimilar observations can be made forthe 2024 matrix composite system, Figs. 45, 46. It can be noted that forboth the 6061 and 2024 composite specimen types, crack propagation was moreextensive than for the 1100matrix system.
The data for these specimens are tabulated in Table V.
(e) 3hell-Core and Distributed Ply Lay Up
A comparison was made between two different methods of achieving
multiaxially reinforced blade structures. The first scheme was to have the
outer shell of each specimen consist of 450 plys and the inner core consistof 00 plys. The second arrangement consisted of intermixing these plys inthe shell with fewer 00 plys in the core.
The comparison of the shell/core and distributed ply layup schemes isgiven in Table IV on the bafzis of pendulum impact testing. As might beexpected, the maximum loads exhibited du-ing failure were highest for thedistributed ply specimens 0ith 0 plys near the outer specimen surfaces.The 0450/,00 specimens of the dis' ributed ply type were also significantlystronger than the f)45')/9 0 ' shell/core specimens and at present this is no'explainable. In c-tntrast to this, the shell/core specimens consistently dis-sipated larger levels of enervy than the distributed specimens. The load-
time traces in Fig. 47 illustrate the difference in performance. The shellcore specinen faile,' at a fairly high initial load and then continued to

support a lower impact load as the -5)- ply:.; deformed to the point offracture. In contrast for the other lay up the distributed ItO Plys 1,er,constrained by their 00 neighbors and fracture was much more abrupt afterthe initial load drop. This cause'd the specim(, to cissijatc far 12:;n, crw.ry.
(f) Angle Ply Comparison
Flexural strengths obtained by calculation based on 1100 matrix pendulumimpact data are presented in Fig. 48 as a function of L/h. 'The data reportedin 1973 (Ref. 19) are also included for comparison. The drawn line in the lowL/h region is calculated on the basis of 1100 matrix shear strength and fitswell the data for all orientations. In the higher L/h refgJons The data sepa-rate into groups depending on the true flexural strengths of each compositetype.
(3) Fiber Diameter
As was discussed in the introduction, previous work at U',RC, ef. 1, haddemonstrated that the use of larger diameter boron fiber can cause signifi-cant increases in composite impact energy dissipation. 'This was investigatedfurther in this study through the reinforcement of 1100 aluminum with 8 mildiameter boron fiber. Impact data are presented in ['able VII. Figures 140 and50 demonstrate the very larige capacity of 8.0 mil boron reinfor,,d 1100 matrix
specimens to dissipate energy. The initiation arid propagation of the crackis effectively blunted by interlaminar shear so that, as shown in Figr. 50,shear, delaminatiot and btidij , prevent, Ia't'ae(1rc of' the, opec butt; . the'unnotched specimen dissipated a lower level of energy than the notched speci-men due to the shearing off of' one end.
Composites with a 6061 matrix behaved very differently. The maximumloads are much higher than those for 1100 matrix specimens, however, theenergy levels dissipated are lower and actually less than those typical of5.6 mil boron reinforced specimens, Fig. 51. The specimens shown in Fig. 52demonstrate this low energy dissipation capacity by exhibiting little or nodistortion.
The superiority of the 1100 matrix in energy dissipation can also bedemonstrated in thin specimens, Fig. 53. 'The ability to sustain load afterthe initial peak in the load-time curve is the reason for the 1100 compositesuperiority.
The results of tensile testing S nil boron-reinforced composites werequite disappointing, Table VI II-A. The fiber w.as AAserved to split in trans-verse ten3ile specimens Fig. 54, and low axial strengths were generally
it
A

obtained. As a point of interest, data obtained independently at 1tC using8 mil boron from another source (Table VIII-B) gave much higher axial andtransverse composite strength values and did not show any signs of spllttin,.Impact specimens fabricated and tested using this fiber, however, did riotdemonstrate the same high levels of impact energy dissipation. The differ-ences in tensile and impact performance noted indicate an as yet unexplainedfundamental difference between these two fibers.
(4) Comparison With Unreinforced Materials
Because unreinforced titanium alloys have exhibited sufficient FOD tole-rance, impact specimens of Ti-6AI-4V were also tested and subjected to anal-ysis similar to that described previously herein for boron aluminum. I.Ipeci-mens of 6061-T6 metal were also tested for additional comparison. The inter-action diagram concept was used to analyze the data obtained for these twomonolithic unreinforced metals. Instrumented impact tests were performed onspecimens having . variety of notch depths. The data are presented in Fig.55. It is interesting to note the constant level of flexural strengthobtained. No data were obtained in the very low L/h region (where a drop off1 in strength might be expected) due to specimen size restrictions. Therefore,the extensions of the drawn curves into this region are conjecture and werecalculated for the sake of completeness. The value of observed flexuralstrength for these materials was found to be quite high and correspond tobetween 2.5 and 2.9 times the tensile yield strength of the alloys. This isnot unreasonable in the prosence oi' t ln notch ,o:i' lt, howcvcr, a moto ,:;ualmethod to represent metal resistance to crack growth is by use of fracturemechanics. Therefore, values of KID were also calculated for several of thesespecimens using standard fracture mechanics formulations. These values aregiven in Table IX along with data available from a standard handbook for com-parison. The herein obtained values in both cases exceed the literature data.This is probably due to the fact that full constraint is not obtained in theCharpy specimen thickness as well as the fact that the Charpy notch is fairly[ blunt. !
The load-time traces for full sized notched and unnotched Ti-6AI-4Vspecimens are given in Fig. 56. Cumulative energy dissipated as a functionof time is also given for both. As illustrated by the tested specimens inFig. 57, it is clear that the notched specimen failed in a fairly brittlemanner while the unnotched specimen deformed to a very large extent, andcould not be fractured using the 260 ft-lb impact machine. Narrow shear lipson the notched specimen outer edges indicate the low level of local plas-ticity. The load-time traces of notched specimen performance with decreasingspecimen width (h) are shown in Figs. 58 and 59, indicating small amounts ofplastic deformation at the maximum loads prior to failure. All specimensfailed at the notch with signs of extensive plasticity.
L M

Figure 60 compares the data obtained for the unreinforced metals withcomposite data. As has been shom in the pa:.t in ,evera l fractuire rnechan[co Iprograms, the energy dissipated in fracturing a notched unreinforced metal3-point bend specimen varies linearly with net specimen width (h). Both theTi-6AI-4V and 6061-T6 demonstrate this. When compared with 5.6 boron rein-forced 1100 material, which also displays a linear dependence, it is observedthat large differences which exist for large values of h disappear in thesmall h regime. The fact that the order of superiority may reverse in thesmall h region may be of particular importance for thin blade-like structures.
C. PENDULUM IMPACT OF BORON - ALUMINlN - I'ITANIUM
Boron fiber (5.6 mil diameter) reinforced 1100 alminum matrix compositeswere fabricated with the added reinforcement. of Ti-6AI-4V foils. l'hese foilswere 0.003 in. thick and improved both the off axis tensile strength andimpact resistance of the base composites. 'The Ti-6AI-hV foils were inter-spersed with the layers of B/Al tape. Two sets of composites were fabricated.Specimens 2384, 2385, and 2386 were assembled with one layer of 'ii foil foreach two layers of tape, as well as on both composite surfaces, while compos-ites 2387 and 2388 consisted of one layer of Ti for every three layers oftape and again foil on both outer composite surfaces.
p The data obtained from the Ti-6AI-4V foil enfhajnced B/Al spe-1,niens arcpresented in Table X and Fig. 61. The major improvement in impact performancefor these specimens occurred when testing in the off-axis (TT) orientation.Both energy and maxiinum load values were curioiderably higher than those ofuniaxially reinforced B/Al alone. it is interesting, to note that most of thespecimens tested did not fracture completely due to the added titanium foils.
A major difference was found to exist between the chord and edgeorientations of these specimrens, Fig. 62. The lower interlaminar shearstrength of the former, due to the continuous layers of aluminum available
A for shear, cause both a low maximum impact load and a high impact energy.* Chordwise failure is strongly related to 1100 aluminwum matrix shear arid, as
can be seen in Fig. 61 the strength of specimens in the low L/h region agreeswell with calculations based on 1100 aluminum shear strength. [he edgewisespecimen tested failed at a much higher stress level due to the importance ofthe Ti foils in preventing interlaminar shear iin this orientation. Figures63 and 64 are additional load-time traces for specimens of higher L/h valuesin both the LT (chordwise) and TT orientatiomns. The addition of the Litaniumfoils '.as improved considerably1 the TT specimen performance over that ofu-axial B/Al both from enerEy arid maximiun sustaincd load points of view.
- :.4

D. PENDULMJN IMPACT OF PORS1] F;IIIFOPCEID 'I'TTANTI ,
The pendulum impact testing of 5.7 mil Borsic uniaxially reinforced
Ti-6Al-4V specimens revealed that, in all orientations and geometries, theoverall ability to dissipate energy was considerably less than that of bothboron reinforced aluminum and boron aluminum titanium. Table XI, containsthe data for the impact specimens tested and includes materials supplied by
TRW and also specimens fabricated at UTRC. The data obtained for uunotchedand notched (with a sharp Charpy notch) specimens were used to calculate aflexural interactioi diagram, Fig. 65. The maximum load data reported in
Table XI for standard sized Charpy specimens indicated a very high loadcarrying capability for Borsic-titanium as compared with B/Al. As can beseen from Fig. 65, however, this was simply due to the fact that specimenswere well away from the L/h region in which shear failure would be expectedto occur, In actuality, a level of flexural strength of 24o,000-280,000psi is slightly lower than that for 5.6 boron/6061 of the same orientation.The tensile data for both UI'RC and TRW fabricated materials are preserite in
Tables XlI and XIII. As would be expected, the levels of axial strengthmeasured were also somewhat less than those of 5.6B/6061, Table III, Jinagreement with the flexural diagram analysis.
A comparison with 5.6/IIOO on the basis of eniergy dissipated as at function of specimen geometry, l.'ig. 66, reveals that for large values of h
(e.g., low values of L/h) the alumitum matrix composite is far superior. Atthe lower values of h, however, where the deformation of aluminum contriutes
little to overall specimen failure, the values of energ y become comparable.In this region the primary contribution to energy dissipation is throughelastic deformation and fracture, and since both systems exhibited nearlythe same flex strength (Figs. 16 and 65), this convergence of performance is
to be expected.
Instrumented impact traces for several composite specimens are presentedin Figs. 67 and 68. The 5.7 Porsic reinforced titanimu specimens of thechordwise orientation exhibited a marked duplex load trace with a sharp dropfrom maximum load followed by a plateau prior to final failure, Fig. 67.
* This was not true of the edgewise specimens Fig. 68, which failed abruptlyafter the maximum load had been achieved. Examination of the specimen frac-
'4W ture surfaces indicated that. interlaminar failure occurred, on a small scale,
in the chordwise specimens and not in the ediewise. It is not clear as towhether this interply failure occurred prior to or during gross crack propa-
gation. In all cases chordwise specimens railed at flexural stress levelsslightly below those of ehgewise specimens which may indicate some interplyfailure prior to final fracture. The net effect of Ihis lower interplystrength was to increase the total energy requird to fil i a :,pecijuen I'ymaking ciack propagatioik more difficult,. Fdgewise Lpeciiiens dissipated onlyapproximately 75 percent of the einergy typical of' choriwisc spec inens.
,o lb
i'

E. BALLISTIC TESTING
On the basis of the data obtained by pendulum impact testing, a series
of composites was selected for ballistic impact testing. Matrices of 6061,1100, Ti-6AI-4V, arid hybrid aluminum-titaniiun were selected to make compari-sons on the basis of matrix plas"icity and shear strength. in addition,both 5.6 mil and 8.0 mnil diameter fibers were ittilized as well as orientationof +45/0, +22, and 0. Because of the very important effect of specimen geom-
etry noted during pendulum impact, comparisons were made between cantileveredand simply supported specimens whenever possible.
The ballistic test data are presented in Tables XTV, XV, and XVI. Ineach case the specimen numbers and descriptions are given, along with a seriesof projectile impact velocities. Resultant specimen condition is indicated,in each case, by a notation beneath each of the impact velocities.
The data in Table XIV are for multiple impacts of specimens, which wereperformed to attain an indication of the relative damage tolerances of eachmaterial. The remaining tests, Tables XV and XVI, were then performed usingonly one impact per specimen.
)(1) Matrix Composition
r As in the case of pendulum impact, matrix composition (matrix 2hearU. strength) was an important determinant of composite performance. As an
example one can compare the performance of +220 oriented specimens reinforcedwith 5.6 mil boron, Fig. 69. In this series of cantilevered tests the B/6061specimens deformed much less than B/1100 specimens. The B/6061 specimensalso failed at the root after an impact at 936 fps while the P/1100 specimensdid not fail until a velocity of 1297 fps was reached aid then failureoccurred at the point of impact. The very large capacity of the B/1100
*specimens to deform relieved the buildup of high tensile stresses in the rootarea while the higher shear strength 6061 matrix specimens could not achieve
* the same relief. So, on the basis of survivability in this cantilever test,it could be stated that 1100 matrix specimens appear to be more FOD tolerantthan 6061 matrix specimens. Of course, one should also consider the excessiveamount of deformation which took place in the case of the B/1100 specimenswhich could be undesirable for fan blade performance.
It is also interestinlg to note for the cartflilevered tests Ihat ,o11 ihe
6061 and 1100 matrix specinens exhibited approximately the same t-olerance for
local damage. The B/6061 specimens failed completely at the point of impact(FI) at 1233 fps while the P/1100 specimens failed at fhis location at 1297fps.
17
1?

A similar survivability ranking in the case of the simply supported
beamr test geometry (Fig. 70) would reverse rhe order of preference. In this
case the B/6061 specimens failed at approximately 1160 fps while the ,/IO0
specimens failed at a lower velocity of ()41 fps,. !Ihe P/1100 :pc eis arcdelaminated and heavily deformed at the region of failure (which corresponds
to the region of iipact) and it appears that the deformation capacity of the
system had been locally exceeded. '[he L'igher -shear strength 6061 matrix
specimens, however, did not delaminate and, be-ause high tensile stresses
were not generated near a retention in this test geometry, they deformed
under the point of impact until final failure.
Thus, from the above it is clear that material ranking canrot be stated
without regard for the test geometry used. It is also anticipated that if
the cantilevered specimens had been impacted at several different positions,
to alter the ratio of root tensile stresses to local tensile and shear
stresses, a variation of material ranking could occur for jiust cantilevered
specimens. The relationship of these test results to fan blade considera-
tions is also veryi difficult to clearly define. Depending onl blade design
, Iand location of impact., a wide variety of stress states can h glencra!ed tby
SjFOD events which could resemble either of the herein described, or other,ballistic tests.
(2) Horsic Reinforced Titanium
. Both types of Borsic-reinforced titanium specimens (heavily clad and
unclad) behaved like the B/6061 specimens described above. They failed at the
root location for the cantilevered tests and showed minimal deformation inthis configuration (Fig. 72). In the simply supported test, however, tiny
exhibited a very high resistance to failure and deformed a great deal. Again,
this is due to the ability to generate higher ratios of shear to tensile
stress in the simply supported configuration. The BORSIC-Ti specimens with
0.012 in. of Ti on each face were among the most impact resistant of all thespecimens tested. The large amount of Ti on the surface is clearly the
reason for this performance advantage.
(3) Boron-Aluminum-Titanium
I fpec Lmens 247 3 -'(1- and 2475-'To were con, rct-el wi ih on O'r lnyers of i i
over a uniaxiai core of 10/110. Ilhese < peois,* in 1A e cani _,, e,
behaved in a manner remarkably s iml .ar to i , BPJ IC-tilanium spec im ns hav-* ing equivalen t, thickies s I surface layers ( ' . V2). 'Ihey t, faileld a, the
root at velocities in the sne range. The s It,. supporl d sp-cinens how-ever, failed at muich lower velocites than .he sini:ar P I- . -i specimensi.
This rela'es, aaiti, to the poor performance of he 1100 malrix ma erial in-p the s ipli supported test. The local shear s' esres and extonsive irnerlam-iriar defornat Lon exceed the oapacity of the 1100 al:mA 1!nM. 1111Z is monst
I 15
"° -

pronounced in the shnply supported (s..) confiijuration L ecaise 'the ratio ofmaximum shear stress to maxiimium tensile stress for a *)..'. beam is twice thatof a cantilevered bean of the same dimensions. Lt would appear that for theconstruction of future hybrids of this t,pTe, a higher strength 60i. 2024, or5052/5056 matrix should be used.
(4) Fiber Diameter
Three sets of ballistic specimens were fabricated, and tested in thecantilevered configuration using 8.0 mil diameter boron in the 1100 matrix.As would be expected from the pendulun impact data, these specimens allexhibited high levels of deformation. Figs. 73. 74. Py claddin' a tuiaxiallyreinforced composite with 0.015" thick surf'ace lnyersE t, 'i-,l\-hV it ..
possible to achieve the most impact resistal composite of the entire pro-gram. The comparison between 8 mil and 5.6 mil boron reinforced 1100, in the
+22 orientation, indicates that little if any advantage is achieved with the
larger diameter fiber. Comparison of Figs. 69 and 73 indicates that bothcomposite types exhibit large amounts of deformation prior 1.o failure at bothimpact site and root. The magnitude of the differences between !Ie abov(-specimens is, however, somewhat cloudled by the variation in thickness. it islikely that this effect is at least linear and, in fact, may go as the spIare
of the thickness, in which case rarnking may change. Again, reotr" effec'7
become every bit as imp( rta0t. ai nate:rial e I'I::.
-1
419
S '
,i

1V. SUI4ARY AND CONCLUSIONS
The initial purpose of this program was to achieve a metal matrixcomposite with optimum impact resistance. It has been demonstrated, however,that a material fabrication and test program cannot achieve this goal in a
simple "build and bust" manner. Metal matrix composites, because of their
multiplicity of failure mode:, cal exhibit a wide range of impact tolerancedepending on not onljmaterial, but also imposed stress state.
The major test technique utilized during this program was a three point
bend instrumented pendulum impact procedure, based on the standard Charpyimpact test. This test technique provides not rcnly the total enerr dissipated
by a specimen during impact, but also a continuous record of the load applied
to the specimen throughout the impact event. It was this ability to charac-terize the loading history of an impacted specimen which led to the use ofthe interaction diagram concept to describe the impact load tolerance of
composite and also monolithic material specimens. Based on a simple beamanalysis, used in the past to reconcile specimen geometry and material vari-ables in the short beam shear test, it was possible to demonstrate thatmeasured material impact re: 1 tanee is s1f i Fi cuiin I ,y i Y i ' i '.q I,, i
stress state. It is the interaction of this irhosed stress state with themultiple failure modes of the composite specimens which then determined com-posite behavior. Composite specimens which were fabricated to have a small(L/h) ratio of span lencth (L) to width (h) were subjected to a large ratioof maximum applied shear stress to flexural stress. These specimens would
tend to deform in shear prior to e:xtensive crack wowth and the maximum load
sustained during impact would be controlled by the shear strength of the
matrix. Such specimens would frequently appear highly deformed after impactand very large levels of impact energy were usually dissipated. In contrast,
specimens of the same composite nmterial cotuld be made to behave in a fullyelastic manner during impact by testing, with a much larger (L/h) ratio. Tlheuppermost specimen in Fig. 8 illustrates the test specimen geometry while the
load-deflection traces in Fi -. 12 (lemonstrate the very s ignJficant variationpossible. A single composite material, in this cas;e 5.6 mil boron reinforced6061 can exhibit a significant variation in load-deflection history. With anL/h ratio of 3.8 the material is capable of lar;'e scale defornation prior tocrack Crowth and, when crack tgrowth does occiu', it occurs in a controlledmanner, i.e.. additional increments of eneroj must be supplied to continuecrack growth. In contrast, the very samle material tested with an L/h ratio
of 21.4, exhibited no ovidenr'e of plasticity il complete specimen fractureV., occurred utilizing the elasiir eo1err st,orc(1 in Hie :.,ecinci arid te:t sys-
tem prior to instability. ligures 11 anid 12 further demontrate the point.

- - For Fig. 11, the maximum load sustained by each specimen was converted to
the maximum applied flexural stress, and plotted as a function of (L/h).
Only for values of (L/h) greater than approximately 11 was there the expectedconstancy of composite tensile strength. Below this value matrix sheardetermined specimen strength. Similarly, it is shown in Fig. 13 that for
(L/h) values less than 11 the energy per unit volume required to raise speci-
mens to their maximum load prior to fracture is well above that requiredelastically.
Thus it was demonstrated that the interaction between applied stressstate (which is controlled by test configuration) and composite failure modes(which are controlled by composite failure criteria) both determine overallcomposite response. No one single test can be used to determine a fundamen-tal quantity which characterizes material impact tolerance. It was shownthat the combined use of interaction diagrams Figs. 10, 11, 14, 15, 16, 48,
* 61, 65 and enerry dissipation vs (h) diagrams, ].'Jits. , 6 provide: a muchmore complete picture of the impact tolerance of composite specimens. In
addition, comparisons can be made with existing engineering materials.
The second test technique used to evaluate impact resistance was a
ballistic test. Small RTV cylinders were fired over a range of velocitiesat composite specimens. Once again, to point out the importance of test
r geometry, specimens were held in both simply supported and cantilevered con-kk figurations. Impact tolerance was then judged on the basis of the projec-
tile velocities required to cause visible damage and fracture of the speci-
mens. As in the case of the pendulum impact test, specimen behavior wasrelated to both the material and the test geometry. It was show-n thatrelative material rankings could be altered by changing the test procedureand again, higher levels of plasticity and specimen deformation were obtainedfor test configurations which maximized applied shear stresses and minimizedbeam surface flexural stresses.
One of the most important points I be noted from this study Is thatvery substantial changes in composite pc;rformance can be achieved by changingmaterial composition and layup. Levels of energy dissipation can exceed those
of monolithic aluminum and titanium alloys, if these materials are constrained
to fail locally, i.e., in the presence of stress raisers such as a notch.
Composites containing low shear strength matrices such as 1100 aluminum, withhigh strength fibers, cause extensive shear cieforation Lo take place overlarge volumes of matrix maLerial. 'tife use of lare,,cr dianetner fibers, ofhigh strength, provides both longer transfer lengths and more massive inter-
Ifiber matrix areas for shear deformation to take place. For this reason,of the uniaxially reiriforced compo.ite:, 8 mil boron reitilforced 1 lO din. -i-pated the hijjiest levels of energy. This abilit y to defol-ri also extends over
21
7fi

- a large range of (L/h) values. It is, however, obtained at the expense of
composite maximum load carrying capability. Thus 1100 matrix specimens will
deform under a lower threshold impact event than comparab] e 6061, 2021h oreven Ti-6Al-4V matrix specimens. Further, it is only by deformation that 11.00
* matrix composites can indicate a superiority over hioher shear strength
*. matrix composites. Thus, increased resistance to catastrophic failure and
material separation can be achieved by paying the penalty of structural defor-
mation. Clearly, in the case of close tolerance aerodynamic structures such
as fan blades, a careful balance must be achieved between threshold level and
deformability.
A highly deformable matrix can also provide a benefit in reducing the
stresses transmitted to other areas of a fan b]ade removed from tie point of
impact. Thus, the choice of air foil deformation threshold must be chosen
in light of the blade root retention construction. Blade designs incorpora-
ting high strength retention schemes will likely permit the use of higher
shear strength matrices in the air foil.
j The use of Ti-6Al-4V foils to hybridize aluminum matrix specimens wasshown to be an effective way to increase ballistic impact tolerance. It
was also shown, however, that since the titanium foils are essentially bonded
together with interlayers of aluminum alloy, in the presence of high inter-
laminar shear stresses (effectively low L/n region) composite performance is
once again controlled by the aluminum matrix.
The all titanium matrix composite system was shown to behave in a lessductile manner due to the very high shear strength of the matrix. Thlus, Ol
all the systems, this one dissipated the lowest levels of energy over the
largest range of L/h values. It, however, has one significant advantage.
It can be bonded to a surface layer of titanium by a very high shear strength
bond. During impact this lowers the effective flexural stresses on the com-
posite and, most significantly, provides a very effective FOD tolerant
cladding.
From the above it can be concluded that the achievement of the maximum
FOD tolerance in a structure will require knowledge about both overallmaterial performance and the stress state during, operation and impact. Ulti-
mate success without both of these will not he inpos:[ic * howeer., it wi.1 Ibe fortuitous.
2 24D1'-2-

- 4 V. FUTUb.E DIRECTIONS
The following are areas in which future research should be conducted to
improve the FOD tolerance of metal matrix composite materials and fan blades
fabricated out of these composites.
Additional laboratory scale testing should be performed to provide
a technique which will provide meaningful quantitative data charac-
terizing the impact resistance of composites. The results of this
program are a first step along this line.
Ballistic testing, of specimens clorely rerm-hi irig the iitclled fnaiblade application .liotld bo litu .,d. TII, t'I 0i ,: 7 I' 1,t',11 tilt
test geometries are critical and should be based on probable real
blade design concepts. The data obtained from this type of test are
necessary to assess the validity of any laboratory test procedures.
Because of recent advances made in the low cost fabrication of metal
matrix composites, emphasis should be placed on evaluating the impact
tolerance of materials made by these new procedures. Future fan bladeswill have to combine low cost and FOD tolerance.
..
23
* .

-.4 Table I
Experimentally Determined Properties of Plasma
Sprayed Material with Foil
U1 t imate
Elastic Yield Stress Tensile Strain to
Modulus at 0.2% Offset 'Strength Fracture
Al0loy JO psi i0 3 Isi 10 psi (1. il. gnc Qngt-h)
6061 10.2 11.2 19.6 16%
2024 10.4 18.6 35.0 ]3%
1100-11145 9.1 6.2 12.5 0
5052/S6 9.8 19.5 38.6 13%
Tpical Properties of Wrought Material
in the Annealed Condition*
Ultimate
Tensile Strain toYield Stress Strength Fracture
10j psi 10 3 _psi (2 in. gage length)
cCl 8.0 18. 0 25%
20.0 31. 0
* 1U00 5.0 13.0 3y%
5052 1 2. 2c.'q C. ) ,o
505t ;:. )u.,
* * "'Al aai ',nw ,,,. I l'rroper(, fi-:; , [ny.; i caL Metal I urgy and l'hn:;e Ii; ra:c
'. . ? t 0. b", Kirv , Va9n
24
qTTl.l
-'.4
0 $4 00 0
0 0
0. .0 00. .~ -T 0 Q(1- 0 0 0.0 N -4c
0-4 -
01 U]U]0
ca 41)I
41) Inl-:4.))
Q1 -P.0c f 'o- Y 1ArCd fn c,., cl __I0j.
LI0 N ('l cj N N N (NJ -4 '4 '.0 '.0 CN ((N 7f1
00
I x 00
'0>
U] . .00 3 U] U] U] U] 0] U] U]. U] U] CD U] U]00 0 0
. 0 J 00 0 ) ( 00 00 0 c) 0 0 0 0 ) 0)0 U] 4 0 CU] - 01 -4- 1- '- > - q-4 -i ~-4 1 rA>4 14 -1:21- 4 4 '
El 0
((1(n
T- -0 .d 1 '
u 0o00- 0000 0 0 0H 0
xA 0
-4 (NJ ' H -4 N---(\'HnC~ 4'4-4- ' -4H--I -- '\j --1 -4(\j 'H H H -- I
H U] 'H'H 'H~-.--4 'H'H H'H 'H.-'H'H 'H'H .- 4' H'H 'H' ' '0*
LI"0\E.\4 (.\ t oj c ~
("I o (Ij Ij cl
0 25

41:
4.) C) 4-)
w) U) U n w w m w 0 w 0 m ()E n 0 w w () u nEC) C) U) u ci un () ) u) () C) U U) U ) CU) U) U U) U ) U
o N C C)j -:) C) C C)j C)j C) Cj Cj C)j C)j ci L' N) C) C)j N C)j N) N
0 0C') C ) C'j C'C\0C\ CSCJ'9CJ C\CJ') CD--10 o (D N t- \D 0 0 c'J 0
'-4 0.'-) U\o OC0 r- -A \1Oj H c C'-CS mOCX (sJ\ t-C) .4 ~j I M -- 11-.14CN 0 s l 1 -I CC) -NJC'9JC\JC'Y) tJI (0mN9m")C) -4 --1(j
c 4 G z D 14 IDk 7 * z - ,-A 1 -)tC-CsJ
N. Lc -t -4 -i-4- N9C N (nU'NIO '-) s-I (11
oC' a\ 0- t-'. (0
0 '-- sr1 D -'-4," ,-I .- I C\ C) 0 -1 -- 1-)4 o -'HON -O 01\ )-- C\ NrH NH 0 0 t--t--t- CLJCN0 C 0 0 0
ai ) 'd 00 ( '0(m' ) (Y(90(m ( -t -T_- 0 0o0 r)(0c -I04m( (0 0 )
10
-4C) Ui) (n m) U) mf w U) U) (n En u) U) U)-94- a)0 a) 0 Q) a)0a) Q) a) 0 1) a) 0 00 a) ) 00 0 1w910 0
091)0f' 40 0' 0 - i - - -4-A H i 1- r- \L r\ f
0- 00 0 0 \ 1 D 1- \D \ \' \ HsHs-I- \4-.-- ) C) \,DI'DIs- \,DL-- - -- -4'S4 rA 1 0 0 0 0 00 ( 00 00 C- \0 0 0 NC~ I
0 ( ) ( ) C-)IIUN '\ 1 ( L I'S
4-
V)A Q 4" 1 3 - - " C yI-
E I I I I I
m ~ ~i 0" R )
A-
U) ,-(4 s-s) ,44")I 4()0 .(40 ,-rs 0) .- C260-

-- 4
04-' C)U w w m n u u
H O CJCi *
'JC\N C)C\J cl CJ NCNJCC
2 Cdj~ 00 O t- c oa~ao~ 0- 00 C ~ -ic'J r- ON C0
(43
UC)
4 ) 4 -
C 0 0 0- 0C) 0 0
~.H 00 0000 04-'
h~} z0
(U 4- 0 0 Q) wO0 00 00 >1~
0 OD
(p.\ U'\
C4 CJ (NJ -Z-J S -: - -14)U ,U' (\I (-j O CQ NX C\J C\I
tj 0 0- 0 -1) 0 C, 0- L) (-)Lf)\ WN C\J\C (Ii C)CN)N(\C)
0C 'Cl. -I.: C: vld 'U '" 'C;
C) ~ ~ () C-))I I I I II I
EA) H, [E F-4 E-. F
4)
U) 4 4 NJ C') --1 -4 N) CI I I I
27

Table Ill
Tensile Test Data5.6 mil Boron-ileinforced Aliuninun
Comp. Vol UTS f
No. Matrix Fiber Layup ]03 psi 106 p5i
2273 1100 53 [0] o. 8 f)o
231 .5 ,.'( 0.i'o
2278 1100 52 [+221 51.1 - -
8o.5 - -60.0 - -81.6 - -
J 2279 1100 52 [+45] 8.2
8.17.06.7
2280 1i0 54 [+4 5/03]s 147.:? - -
152.9 - -148.9--
160.5 - -
2281 1100 514 [0/-o5/C/+45/0S I ,.5 - -
15. 0 - -
2282 liO0 52 (0/-22/0/+P2/01 161.0 - -1." " l2.5 --
143.0 - -
2283 606) 5o.6 [o 1.81.o 35.3 0.606
26. o 34.2 0 76
28
A
-, .. . .. _ _.. 1 1 '

Table Ill (Coiit'd)
Comp. Vol 10US E F fNo. Matrix t'iber Layup 103 t)si ]06 ns i
2284 6o61 49 [+12 ]146.0 29.4 1.24
157.5 31. 3 1 .1 38.0i 3. (
2285 6061 51 [+4 5] 52.5 -
63.5 - 1 .45.; - 38.552.7 - 43.0
2306 2024 52 [0] 229.0 36.8 0. 70224.0 37.0 0.66227.0 -
j : -I
2307 5052/56 53 [0] 268.2 39.5 0.85215.5 35.8 o.i66241.0254.0
2419 6o6i 50 [+45/031 s 172.6 28/18 0.90166.8 /19 .W6
2422 1100 53 [4 5/03]s 1.)5. 27/19 0.8,1,--., 2 /19 0. 71 ::
2426 6001 52 [+4 5/0] t69.y( 33/t9 09. 7d $31 /;-0 0 .W l
ib 29
"4,

0 o r4
t-4 to to w) wU to Ul bo to V) to LU ) U) to Uo toU0 C+- ) 4C) C- C) ) () C) C) C-) C) ()(C ) C) )
cl C)Jcl C~j ( j jCj C'j N N(\j (IiJ (<J N C\J) fn mC\)C)N
'0 C
CD0. C-7.N C)~ 0 CC. (\I)~- Nt- 1 A (<--i --- -4--1It- ,.-D- -4 -4\0 t C), C0( A \C - C) -- -II
r) U)c r
C) --- C) Cj 1
0. .
f) $- , i C) ,--I OXi N0 -4 ONO -, ( -- c,\ -- T 'O t-0 t -C0- O O\(1) .1; CS ON4Vi
'00 I
U)N UU)iO 0 Nj rC- - r r 0Cjr
F-I '0 nCn0 0 "10 .I C 'A nr r 0
C'- 0 1) ll 0 rd w 0 0 0 0 Q) w) 0 0 0 0 0 0- 0 00
CO C
+ C)Q
+1 0c0
00
0 C)- D C- D ' 1 ) (C) 0 l) t., (
-4~~~~G a)- 00'. $0 0 0 00 -- 4 4- -. 4
-- C) -4.C) 0 0 C'D0 7 0 ~ C 0CC 00 C) uD &-4--)- -.- 4-4- tO,- 0-, - ' 0 0 0 NJ? W--,-4
4ID I ~ '-CJ' -C))) -0 ,4NC) -0 -4
(M C) -4 0C) C C-l
30
*OK

4 0,T-4 4- 41 -4- ' 1 ~ - . .,0 -4- -4-
U) Lr I-) 1 1 C )(' 0 '
X- 122
(NI'- \NJ ((N NJ-4 L;I (C) 0, (D C L:N f'(2.211111 0N) .~-
4'~~~I C0 42C. CC, C-,- Nj(N'(N 4-D C)Q-(1 N01 , ,IC
4-~ .- '--' 0~ C) C)l C Q- ' 0 C'-) MN ' ( -. C N)
C0 .C 0U2 CA k0(N CaI 0 C0C 0- j> C)
0 D ' 0 0 00c 0 0 0 0 0 0 0 0 0 0
C))
(NN
cD), '.0'- 0'C (NJ(0N C
I VI~I "I 0 '7 ( (2 -
-\ -11 4 \1"
"31

1... . , • . . .. ,-. .
CI4 " 40 4 4
'4 - - . 3 C
C
' 1 .4I > 44 4' 4 4 ' - 4' 4 '-
IN-". ""N ,.N ,:.,4", ,, ,
4, . 4
"32
,. _. .,- .. ....... . . ... .. .-. , . ---

41* C.'V)0 C,+
4- + +1 41.
FH 0 * U) UC. (n'0l 11 1 h U Q
0, ric P;Ii , '
7. r~ n ~ U)i N , N N 'j ' (" (Q C' l (Ii (fC. C
0 0 1. I. 4- o 0 C t- C. , ) c 'i CD C. L) - cr 1 C
I I CC - C'CUC 0NU CC, (' ( 1 ) JO CC ('._I
"0 Cl))
0. CU U'0 &C I) ,--UDU -t. -
4- -A '-4 UN (1 Cl -A ~ - ~ (Ni - t-- (NU (C . (
Q) 0
0,a
C. 1- -0 C N 0 -1-) ,-A -i --A U) D- C) C C- D C-- c-0, (D4 4.4 10C,-C) 0 0 0 0 1 ,D , 0,
UC11 C- -- 1 0 NOC ::) -i 'A,>f - UfNU0 - - A-A -40 L) U)0 D) ~ -1 U)0 I' 0 0 0 --4 4 - ?--
(3055 5 555500
F- E- t
-I jot
6- .,C l l 00.0 0p 4)) 4 4)0 . 40 00 0 0 00 0 0 0
U) 0 4--,' '-Cl) -~4,,C33

AA C
4>C ,
4>~~~ C>D (2 c i D ) ;
Cu
41
4)\ fri
U t ~34
-rAPC fl C). (2 6 '

41.--IC-
*!- (74
W C)O
'-4 -- I IC>
In1:4 -4 C4j
C CL'C) C H4~> ,-4
.~4) (7 'C
In
1.. 4 C -~
C) C) 44) 4) ,~.4 '-1
Cr.o
CN
4-fl C. I I ~'~I a0
1)
I
H
> '(4- F' C--'-; -j-4-,- '--444 -> (4 717 (4-.7 4-> (7)7 ~-'-A ~ (~ C.C) C >-4H'-4,--4 ~-I,-I ,-44 C)
t C) F -- -C--a.04'4- Cc 4..CC -C
I H
-- '~ '7~4iC I -'- -I
CC
'-4 CC I C)
.0C) 4" C 0
- -) -I -~'~' ----- 44-7) - -'-C. ''-4 0
CC* I'
-"C
--4 4 " '--I- -' 44 4) C)
7) C -C' .4 '(4-
C)4'
*, -- .44 -'-4
- - '4 4~) .44-.2' '''' - - C) .4-4 (4J44 4 I '-C C) I' 41
.4 1.'ir~

- - Table IX
Calculated KID Values for CharpyV-Notch Specimens
Total Crack Total Specimen MaximumMaterial Length Width Failure Load KID
(in) (in) lbs ksi/in.
6o61-T6 0.0(9 0.394 167(o 31.60.174 0.394 835 30.0
Handbook Value* 26.5
'Ti-6A-hV 0.079 0.394 6500 123.00.174 0.394 3430 123.0
Handbook Value* 96.0
*Damage Tolerant Design Handbook MCIC-HD-01
;. A
Ij
: i 36
.4,.4
- 4
IJO
iF-1 E: tr' V) 0: 0 1J ), 0 , cC . j , j L
0" 44 0.
. .. . . . J . .
0 "t b 0 C) C C ) ID _: C, I C) 0 c
C1d
C) C ' Qj i If '1! t\ f
0 4) ci If A1 -4]F- [-- - O r ./ r'
v-- ' 4 :0 ' a4 0 Uo J r / I , 1 C
'- [ L- -
4 'It Li -4 3- Ctilr ua inE-H r- ';'-
'r
IC Li 0 ±' C-
711
'04' (U ON CJ ('N r-N ON < C' d O] . 0 ,-- 0 4 0 1-
,-4
',-' 1 ,1 , CI ' U ' K 3. '1 0 U4 l f ,1 ,l 1
cC 0:
."O 0
,N,,C,,c--a,,[,-- -i - ,3,3,3 131...?.(.31 .. .... 1 .. 3 1343_..,

V _
JiL i Ta ,le XI
5.7 BORSIC-Uniaxially Reinforced Ti-6A1-4V**
Post
v/0 Net Impact Maximum Impact
Orientation Fiber Notch Width Enery Load Condition(in.) ft-lbs lbs
SN-139-1 LT-Chord Yes* 0.-327 5.8 - 2 pieces
-2 LT-Chord Yes* 0.333 7.1 4000
-3 LT-Edge Yes* 0.317 3.8 4000-4 LT-Edge Yes* 0.317 4.0 1000
-5 LT-Chord No 0. 112 11.4 5180
-6 LT-Chord No 0.412 9.6 6120
-7 LT-Edge No 0.396 7.4 64Q0
-8 LT-Edge No 0.396 7.6 6490
-9 TT Yes* 0.332 2.2 1760
-10 TT No 0.412 3.3 -
-i LT-Chord Yes* 0.332 6.8 4080
-12 LT-Chord Yes 0.313 7.8 3556
SN-129-3-8 LT-Chord No 0.052 i.1 44
-9 LT-Chord No 0.052 1.0 140
-11 TT No 0.052 0.3 74
-12 TT No 0.052 C 3 84
pI
sii-14i-3-8 LT-Chord No 0.063 2.2 186
-9 LT-Chord No 0.063 2.5 167
-i T' No 0.063 0.7 102
-12 TT Do 0.063 1.1 133
Si-148-1 LT-Chord Ye"; 0.317 7.6 3627-2 LT-Chord Ye3 0.317 7.8 3627
-3 L0-Edge Yet 0.321 4.7 3840
-4 Ye! 0.321 4.9 3840o-5 11 0.396 7.9 65142
-6 No 0.395 7.3 6115-7 No 0. 232 3.0 1849
o 0.203 3.3 1849-9 No 0.100 1.9 h69
-10 No 0.100 1.8 460
-12 Y"; 0.318 -I -113 Y o. .'I -ll
38
4 :

Table Zi (Cont'd)
PostV/o Net Impact Maximm Impact
Composite Orientation Fiber Iotch Wiith Energy Load Condition
(in. ) ft-lbs lbs
2472-i LT-Chord 49 No 0.133 1.9 825 2 pieces-2 LT-Chord Do 0.132 1.7 "/1i
24 70a-I LT-Chord 45 1o O.06h 1.3 178b-i LT-Chord 1o O.062 1.1 164c-i LT-Chord 110 O.062 1.0 1614
* The notches machined into these specimens were 0.079 in. deep, however,
due to the use of the wrong cifttini] wheel they were fInt. bot, teoiie -L not V-shaped.
* Spec. 129, 139, 141 and 1148 were obtained from TRW.
* Specimens of set 141 all had extra 0.012 in. thick layur.; of Ti-3AI-2 1/? V
on each surface.
r.
39
"4,
wv#R777Ma'

Table Xii
T .- sile Properti.eE" of 5.( mil bORSIC UniaxiallyReinforced Ti-bAI-14V
(rroc)
Conpo s i e UTS Efumu Fiber Orientation I03 psi 10 psi
Si 00 167.1
155.7127.6
2 6, u44 00 150.013) .2
i 7 9 5j.8 3%. 6 o. 11
2J extracted fibers average UPS = (362 + 83) l03 psi
0" 13.
(Ia C0 rI TT. 3] 82.7
bb , 113.8
1-4 t-., 39{ -o
. 2,0 0. 30
16 7a2 939.2
S0.6 29.1 0.22
2 4 7 L 5, o )r 1 ." . " 1.9 3] o. .25
.4

Table XIII
Tensile Properties of 5.7 BU2ISIC UniaxiallyReinforced Ti-6AI-4V
(TIM)Uj,'-pc i .uk linll Lur Orientu'.,ion !'; If
]Ub pJsi 103 'Usi 7
212I-I. ''-
-i 00 38.0 115.8 0.40
-2 0 39.0 1148.0 o.40
-3 0° - 135.0 -
-. 900 31.5 53.8 0.46
-5 90 33.2 62.7 0.55
-o 90- 64.o -
-7 90 64.9 -
-L 00 3h.2 132.0 0.21
- extrat,' d fibers - uvj.. tit'; = (33)1 + 125) x 103 psi
o- 900 27.24 67.3 0.58
S-900 ?2.8 69.3 0.73
'1 -7 0 -2.1
S* AlI.:t~t j't". ll thli 1.1lejj wa; O. t,3 it,. i.ith 0.0 4 in. of ' .i-3- . 1,2 on
• 41
FR. A

Table XIV
Cantilevered Ballistic Impact Specimens
(Multiple Impact per Specimen)
Velocity (ft/sec) and Damage
Specimen tMaterial V1 V2 V3 V11 __ V6
2419-2420 5.6B/6061 126 186 331 483 68 884 1746[+45/0312 NV NV D ) D ) F-I-R
t = 0.070 in.
2422-2424 5.uB/]l00 129 282 467 7] 8 910
(+450.067 in. (Incompletet+501 = 0.06 in. D Incoplt
Fracture)
2427-2428 5.6B/6061 158 339 721 858 1238[+45/0312 NV NV D D F-R
] jt = 0.067 in.
SN-129-2 5.7 BORSIC 133 173 326 714Ti-6AI-4V NV NV D F-Rt = 0.052 in.
2479 5.6B/6061 188 )438 692 841 1122[+2215 NV NV NV DI FR
t = o.o69 in.
2480 5.6B/1100 196 440 694 870 903[+22]5 NV D D-DI D-DI D-DIT
t = 0.066 in.
2473-74 5.6B/I100 )3 : 04 (,88
00 DI DI Dl0.003 in.-
*,' Ti-6AI-4V
on each facet = 0.053 in.
42
4 442mlt

- "Table XIV (Cont'd)
Velocity (ft/sec) and Damage
Specimen Material V1 V2 V3 Vj V5 V6 V-(
SN-129-1 5.7 BORSTr/ 697 872Ti-6A1-. D FR
00
0.003 in. -
Ti-3-2 1/2
on each face
t = 0.052
NV = no visible damage
D = deformation
F = fracture
I = at impact site
R = at root
L
43.
i 43

Tat I e XV
Cant ileveredI Bal liftic Impact Spucimvn3
Vi n(2 1 Lnpn Cel Spe ti:C:l d)a!
Spec Imen ~ aei . :1 V1 V,~ V V
2419-2420 5.B bIo")e 1 iS 8 1 b3~ 11V liv IU - -R
2422-2424 .t''/11'1 6 6.1 113
0+ 3/U DV 1)U
t 0. OuL in.
2427-2428 5 .6i/oi 20?P ')C) Y I
+_ ) NVU 1) 1
t = .Ou'( in.
S-J-129-2 5. 0i' 611 LTi-6~A1- 1IV i iV iNV F-H
=0.052) in.
2479 5.LL6i 71 Yl13 93(, -'76 1233
1+ D -Di U-LI U-FR U-FR Fl-FRt 0.009
2480 5.13 11 M) 0) 8'' 0 i) ii >
+2,) U-lDIt L -D)1 CR-D] CR-Fl IP- Fi I JR1-FT
2473-74, 5. ()I/11l00 813 8)114
0.00J3 in. - 1 -U 11F
oneach face
t =0.053 in.
*I~~~. 2475-70; 5. 613 /1 110')'0 7 "1)-I U-U1)! 1-LI I-I) 1 -1) 1 Li-I F
L' 1) in.u- v
()n ea'fo 2
t= .00) i n.
44

- lfable XV ((kullt',i)
Vel , i t / r ) :mod 1l" ,
Specimen "Tlte I. V1 V,, V2 , ,
Ti-AA - V D-I" I 1-i- I I-F]
0
0.05," in.Si-1I1-4,5 5.7 'A}§IC/ 9 ? I I I I1 1 I
Ti-)AI- V ) ]1-1)1 D-Di I-IL -]:]-10 0
0.012 ir. -
Ti-3-- /
n each f'ace
t = 0.0b3
2578 8.0/1100 I,) 55. ,, . , "
[+220 I-: D-I )- D D
t 0.075 in.
2779 8.01/1]O0 71C/ 700 ,, ,. ,
t = 0.075 in.
2580 8. OB/] - 00 0, } K '-010thr0 layors of U)-UI *;-0.i b-! i!~~ )11 ]-~. l-.d
;" i .0.05 in.
' Ti-iAl -i, on
t 0. 085
iv~~ ~ NV no ilU'
D dfiornat ion
'5.,' C cracklng visible
-'1 I = at iiypact areaV 3 :at root al-7oa
45

'Taid e XVI
Simply Suppjrtei Ballist, ic limpact 4pecimens
('3ingle Impact per Specimen)
VeLociLy (l't/sc c) nn P ariaLe
L7~e c ime: it later i al VI V, V VV
2419-2420 5.6b/o06] 199 h2 872 1 Oh S±0_5/0 3 D2 L ) I i)
t 0.070 in.
2522-2424 5.6b/1100 199 417 907 183
1 / 12 ) D D F-It = o.067 in.
2427-2428 5.613/6061 190 4 39 897 1392[/h5/03]2 D D D F-It = o.o67 in.
S;I-129-2 5.7 BO30103C-0 0 190 439 903 ]33CTi-UA1-OV 1V D D D
t = 0.052 in.
2479 5. i/600] 86 93i 1155 66 oo[ 5 1 D D F1 F1
2480 .6B/iLO : 1
2- 273-70 5.013/1100 51h9 .qL2 95 15 11')7[+2 ]5 0° I~ F" ""I "
2l 43 7 i3 7 1,1713
0.003 in. -
on each facem t 0.05'j irn.
':0 .
,0.009 in. -
I[
46
. - --- - , - -.
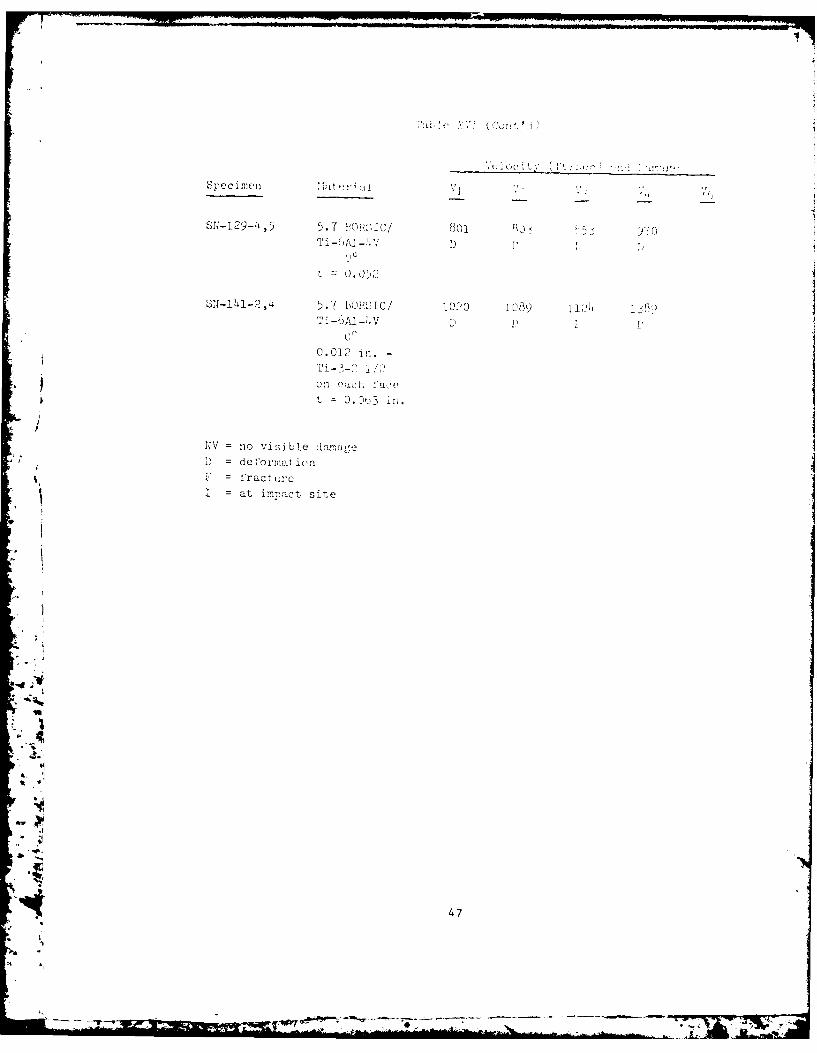
jRdL VIo' ( Cnu. ,i
Iu c i tf / *'
Spec imen ta:
SN-129-4 ,5 5.7 O0? 1 C/ 801 ,. '/70Ti -hd -00',' D ';0!
S0-141-2,4 5.7 o).IC/ P'00 1089 I) C0
0.01? in. -
- ) ' Ion caclli,'aet : 0.3e3 *n.
14V = no visible damage
D = deformrat ion= fracture
I = at impact site
AII• '
.44
'47
",2 S

Ujnnotched In;' cun;.m: t fl ipact 2e tin; of Specimenst , ' e;ed i P Il i t1 7 I L C' 1,
I i--ao t Oax i town i41 exu ral
Specimen ______ _'_ '.-lW; [L;; (I u i.
2420 5.10Bt/4001 1.1 12 I7 C_ 0 3 .0 1)42 170
t = (.)<2 in.
2424 5.6B/i/OO 1.3 121 145+45/C3]1 1.3 121 142
t = 0.070 in.
2428 5. 6B/0,,' 1.0 1142 180[+4 5/O1] o.8 142 179
IL t = 0.070 in.
SN-129 5.7 BORSIC/'i'i-6AI-4V 1.1 144 320
0 ° 1.0 ]140 3100.003" - Ti-3-2 1/2 on each face
t = 0.052 in.
Sii-ihi 5.7 ORSIC/T'i-6A1-,V 2.2 86" * 00 2.5 7
0.012" - Ti-3-2 1/% ,n each Dace
t = 0.063 in.
2473-74 5.6B/1100 1.. 1900. 2 120 295
0.003" - Ti-6Ai-)V on each face
t = 0.053 in.
2475-76 5. UIIO •3-" " 0 ° ] . : !74 h.'
0.c09" - i-6A-)V onl each facet 0.006 in.
'4
4 48
"- - vvp7

S'Table XVII (Cot'd)
impact Maxi mum F] exural
Erle rgy Load St rength,ater a I ft-lbs lbs 10 3 p!-,i)
24'5.0B/66 ].5 191 229
[+z20 ]1 .5 198 22"t = 0.0b9 in.
2480 5.6B/1100 .) 150[+22] 5 3.h 125 ta
t = 0.06 in.
2578 8. 0/Ii00 1.8 i)j6[+~22] 2.0 1D3
t : 0.075 in.
2579 8 .0B/IOo 1.2 97 97[+ 5/0"'] 1.6 97 100
t = 0.075 in.
2580 8.03/Of00 2.5 264 218"0 2.9 264 216
thiree layers of 0.005 in.
jTi-(,A-hV on eart-ii face
t = 0.085
" j1
1
:,'4 49~

M
0o o
0 0 c
"1 0
L) U U-) l
(N 0N 0 0 N 0N( E
>>> > >
v Lw
4..4
-ELA
* 0
0 -0
0~C 0 0
>4C
4) 4-' ~ <

TOP--NOTCHED ENERGY GREATER THAN 23 FT LBS
BOTTOM UNNOTCHED ENERGY 48 FT LBS
(RE F. 2-1972)
'A FIG. 2 5.6 mi BORON-1100 ALUMINUM CHARPY IMPACT SPECIMENS
51
4 77,
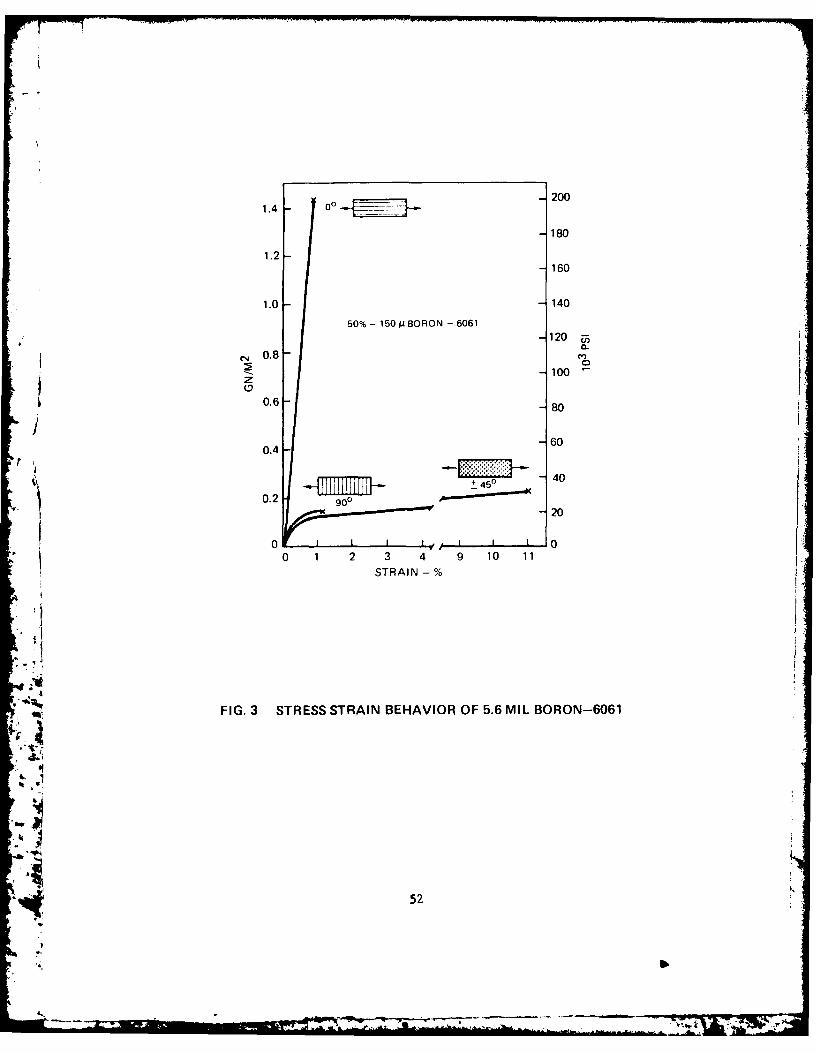
1.4 - 00 200
180
1.2160
1.0 140
50% - 150 U BORON -6061120
0-
C4 0.8 - t
2 -1000.6 80
*18
0.4 60
+ 450 4
0.2 900 A--
0 .I I I 20
0 10""0 1 2 3 4 9 10 11
, STRAIN - %
FIG. 3 STRESS STRAIN BEHAVIOR OF 5.6 MIL BORON-6061
52
.I
1

414
I a:
IL.
4 1z
U iLl
ICI
'CL
U.7
II

STANDARD V NOTCHED SPECIMEN
I Omm(.394in.)
55mm(2.1 85in.)
UN-NOTCHED FULL SIZE SPECIMEN
.394in.
1 Ommi.394in.) _______
THIN UN-NOTCHED SPECIMEN
55mm(2.1 65in.)
.4 FIG. 5 PENDULUM IMPACT SPECIMEN GEOMETRY
i 54
e .a~q 4*

LT-CHORDWISE IMPACT SPECIMEN
TAPE - - _ _ _ _ _ _ _ _ _ _ _
PLYS II
LT-EDGEWISE IMPACT SPECIMEN
r ITT-IMPACT SPECIMEN
0aoooaooooo 0o~o
ii FIG. 6 PENDULUM IMPACT SPECIMEN ORIENTATIONS

4.5"
IMPACT
EGAGES -,2 Ao NDEG7E
CATiLEVERED SPECIMENS
i4.5
IMPACT
E GAGE =3 E GAGE :e2 GG
SIMPLY SUPPORTED SPECIMENS
~. ~ FIG. 7 BALLISTIC IMPACT SPECIMEN CONFIGURATIONS
56

CHARPY IMPACT
BLADE-OVERALL RESPONSE
t, BLADE-LOCAL RESPONSE
r NVFIG 8 IMATSEIMNGOER
-y,
57
1A

00
co z
,nL
CC
CNC
0I20
E -U-J LL
C 0
x
I 0
*1 LL
I
!sd Cot) XeW.
SW H19N38i1S HV3HS C13AH3SBO

0 00
0
C
N0
-U
c~
-J
Hi E
0(0C0
(00
c I (C 00
roI~
4 59

<C
00
> -i
2 0
4x
x 0
x x
0 C 0 C
4k4
06
W.
.&I do-

3600 -.----. - ---
3000F2400
1800-
0
0 0.02 004 0,0( 00 OR 1)DEF LECTI()N (IN
600
-480
0240 -C 2320 1
L 1.57 IN. h 0.14 IN. L h I11.?
120
00 0.02 0.04 0.06 0.08 0.0 )012
DEFLECTION (IN.)
600
480
-~360
0240
120
A __ ____ ___ ____ ____ ___ ____ ____ ___
00.025 0050 0.075 0,100 00 0150DEFF CTION (IN.)
FIG. 12 LOAD DEFLECTION CURVES FOR LT -5.6 B-6061UNNOTCHED THREE POINT REND SPECIMFNS
61

CN
Z) I
0N
100D
I 0U
00
0 >0
('N t_
0 z
x cc
I U-
00 CD C
Ni Sfl1 NI iV~FY1(A I INn H~d ADWINI
62

00
zzZcc
o u w
0 0
00 0
0m O)"' IN8SH 3SGA I9
*63
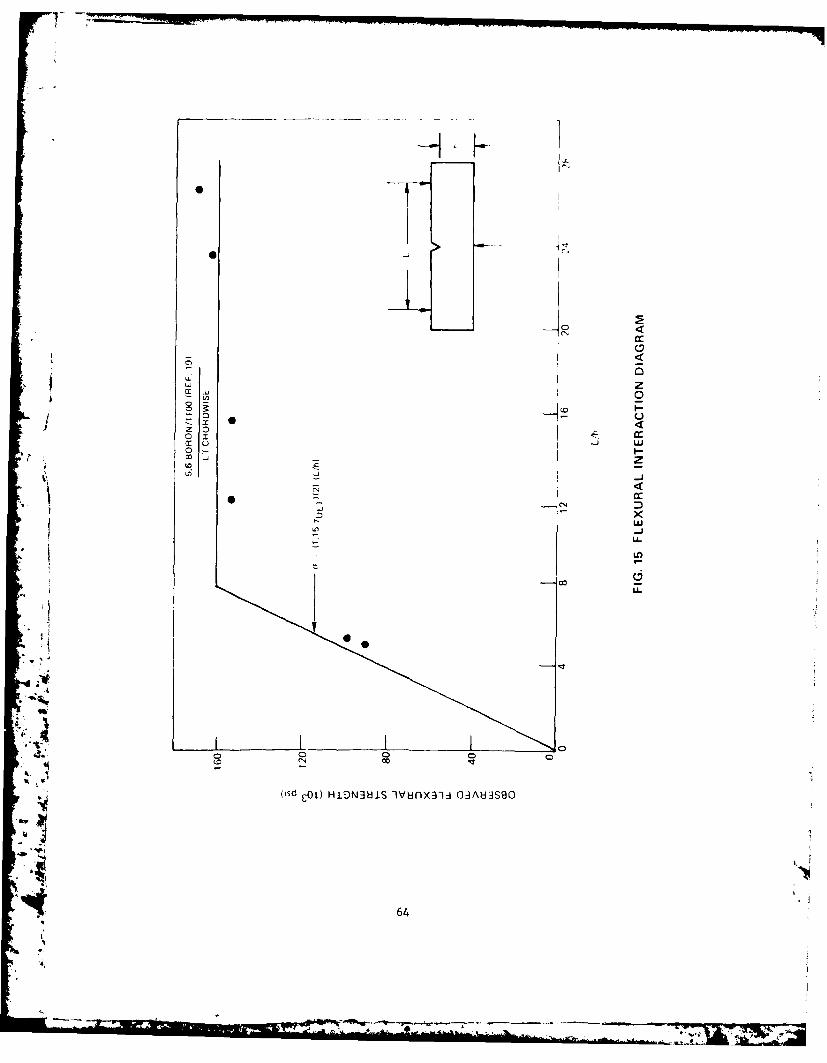
00
00
w (A
LOI-- CU)
N cz
(is CO - N81 v n 33 1A 3B
644

x0
x u
< 0 0< H x H , H
(00 ~ -0 2 0 Z0 Zt'- Z z z z :) I
NL - 0 X
0 x x x x x cc EE 1
0J < < <
.2 CD
0 ol<3<3
0 cc
C>
0
c-
x
U-
IL
* 0< <~
'65
W'3"A

PMAX 1,86( t BS
LOADI I WAL 31 Fl L H
8111 LEIS
-T IME
0 5 MSECC ?223 156 B1/11001 LI EDIGEWISE NOTCHED h 11318 IN
-~ -.- l+.4f MAX 16I O
L OAT)OAIB
(II IMF
568/1 1001 tT CHOHlI)WISE NOICfIF) D 1 0,318 IN
FIG. 17 INSTRUMENTED IMPACT TRACES
'4 66

C-2223- 1 EDGEWISE NOTCHED
C-232jODWS OCEit
FI.8 L -. -10IP C P CM N
.67

PMAX 1461 LBS
ETOTAL 48 1I- LBS
t OAD
400 S
TIME
f) MSECC 2257 2b" F5.6 B/1100 LT CHOHDVVISE NOTCHED h 0.318 IN
,MAX 1692 I BS
I lOI AI 39 F L "BS
LOAD)I I!
•- TIMEMS L-. C 22 / 3
56 B/1 00 tT CHOHL)WISE UNNOICHE[ h 0.394 IN
FIG. 19 INSTRUMENTED IMPACT TRACES
'4 68

.... ..
LC-2257-2 NOTCHED -CHORDWISE
*4C - 2257-3 UNNOTCHED - CHORDWISE
FIG. 20 LT-5.6 B-1100 IMPACT SPECIMENS
'4 69

L MAX 13!V t B
L TOT At 1:33: t W.
LOAD
400 LBS
-~TIMEj0.5 MSEC C 2260 2
5,6 B/i1100 11 CHORDW'ISE NO T(HI 1) 1 1 021 ) IN
p MAX 1 62l I i's
I (I AI > I il
LOGAD
400 uBS .
timE
0.5 MSEC
c 2260 3
FIG. 5.6 B/1100 II CFHRDWISI UNN9WIl 1, h oI '.10 IN
FI.21 INSTRUMENTED IMPACT 1 RACES
70
LOA

PMAX 49.) L J
10 1IA[ 4..2 f I i I-
LOAD
160 LBS
T TIME
0 2 MSEC C 2259 25 6 B/1 100) L CHORDWISE NOTCHED h 0.121 IN.
p MAX 881 L BS
E [ 14 4 f I If,
L DAD
- 1160 1 Bs8
0 1 MSE 11- 4
t. 'IFIG. 22 INSTRUMENTED IMPACT TRACES
71

p MAX :164 1 H
80o L BS
TIME
10 2 MSEC C ?258 15. B/1 100 LT ( HOI-DWISE UNNOTCHLED h 001L(i IN
FIG. 23 INSTRUMENTED IMPACT TRACES
72
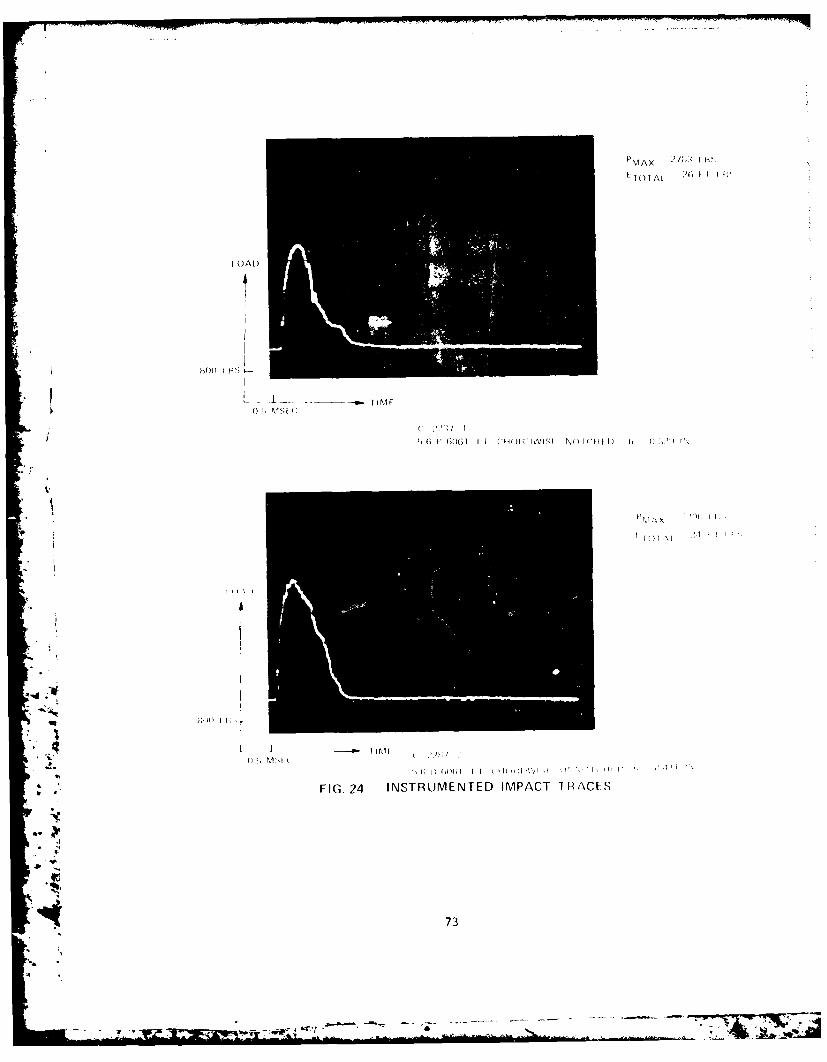
p MAX m)~:
i OAL)
I f
MI) Mf C
r A \
FIG. 24 INSTRUMENTED IMPACT TRACES
73

L I it'll
ki ' cC" S1 W
11' "'FIG, 25 INSTRUMENTED IMPACT TRACES
74

C-2287-3 CHORDWISE UNNOTCHED
r
4,
C-2287-4 CHORDWISE UNNOTCHED
FIG. 26 LT-5.6 B-6061 IMPACT SPECIMENS
75

p MAX 33( 1W
I I A l
8 00 1 Fis
I TIMlE
1, '1304 21. 1 '3/1:4 I Cll jfIAVSE 1 NOW~ii ) f, o ioo IN
* , MAX ~~
II
I IME
FIG. 27 INSTRUMENTED IMPACT TRACES
76
47- *Id~ ~~' ~-jam"---

I, MAX 3il101 H.
fC)IAI 10 I I I'
800) 1 Bs
TIMF
0 ? MSEC c 231016 (3H5I j' , I I CHII)IiNISf Nf) ICif1) h 1 () 1 M4Il
PMAX '191) I3
LOAD
'480(0 1 WS-
TIM(
(3 f C C 2311 300 H'YIO!, !,6 1 (:HflFj)'uj,5 (JNNO I CiI 1 1 I.C
FIG. 28 INSTRUMENTED IMPACT TRACES
4 77

MAX I S
0l )I Al () 4 1 1 1 t,!
LI)AU
80 LBS
11ML0.? MS (
; C 131.5 1
S5.6 0- 2024 1 I CH(O1I)VVIS[ UNNO)ICIQl I) h (0U; IN
p MAX 3(6i I ll"
[II)IAI (('1/ 1 1 I :
I OAD
I IM(:,. I ') ' 1%Nil,| ( C: 2 {Il
G, H M11, I I IOHI() WI/l lNNO I ll I) h, MA1ll, IN
FIG. 29 INSTRUMENTED IMPACT TRACES
78

C-2304-2 CHORDWISE NOTCHED
1C-2304-4 CHORDWISE UNNOTCHED
FIG. 30. LT-5.6 B-2024 IMPACT SPECIMENS
'4 79
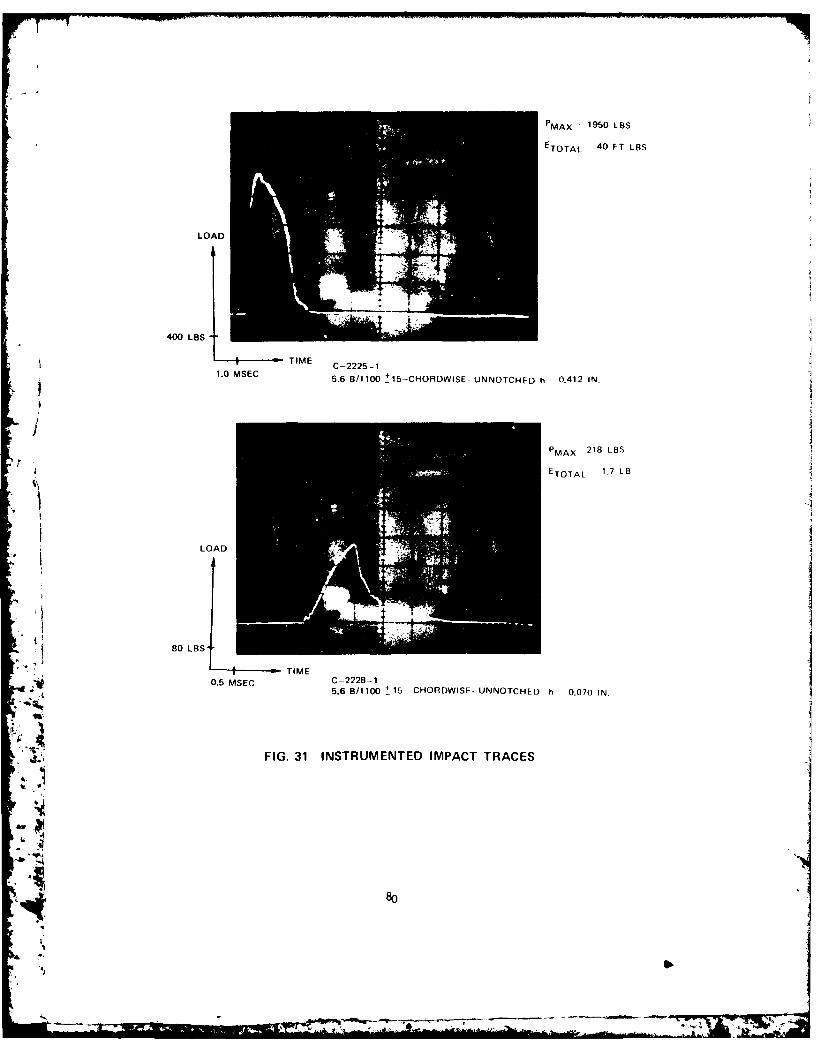
PMAX - 1950 LBS
ETOTAL - 40 FT LBS
LOAD
400 LBS
TIE C-2225-11. MEC5.6 B/1100 + 15 CHOROWISE- UNNOTCHED h 0.412 IN.
PMAX 218 LBS
'4ETOTAL 1.7 LB8
LOAD
80 LBS-
TIME
0.5 MSEC C-2228-1
5.6 B/1100 4 15 -CHORDWISE- UNNOTCHED h 0.070 IN.
J FIG. 31 INSTRUMENTED IMPACT TRACES
41
'8

jIL
C-2225-1 CHORDWISE UNNOTCHED
FIG. 32 +150-5.6 B-1 100 IMPACT SPECIMEN
81

TMAX 1,693 1 WS
L TOTAL 4 '
tOAt)
400 188B
TIME
115 MSE C C 22 63 2
5. 6 B11001 22 CHOfIIOWIS[ NOICLIE D 0.:H1, IN
PMAX 218(1) H S
LOAD
1()''() 1 Es
0.11 MSI, 0.3 :I.6 H 1 1001 2211)iIVIIINNIIICHEI, .9 N
FIG. 33 INSTRUMENTED IMPACT TRACES
82
VIEW.

II
1 C-2263-3 CHORDWISE LINNOl CHED
awFIG. 34 + 220-5.6 B-1 100 Irv PACT SPECIMENS
ir4 83

P MAX 2182 LBS
EJOTAL 24f1 IBS
LOAD
800 L BS
TIME0.5 MSEC C 2276 2
. 5.6 B/1 100 22 EDGEWISE NOTCHEDhI 0.3131N.
PMAX 3617 LBS
ETOTAL 48 F T I BS
~LOAD
800 LBS
" -TIME C 2216 3O"MS C6 B 110(0 22 ED(,EVISE UNNO Hi D h 0 3Hi4 IN
FIG. 35 INSTRUMENTED IMPACT TRACES
aw v 84
'4IP
. . .. . . . ..-. . . r -' --' - --.... , . ;.. , ..

C-2276-1 EDGEWISE NOTCHED
Cj27 HRWS NOCE
FI.31'25. - 0 MPC PCM N
(RGO OFTP-SEIMNCNAT
~~85

p MAX 167 LBSE TOTAL 1,71 FT LBS
LOAD
' 80OLBS
TIME C -2261 -10 2 MSEC 5,6 B/i 100 t22 CHORDVVISE -UNNOTCHED h -0.073 IN,
FIG. 37 INSTRUMENTED IMPACT TRACES
5
*4 86
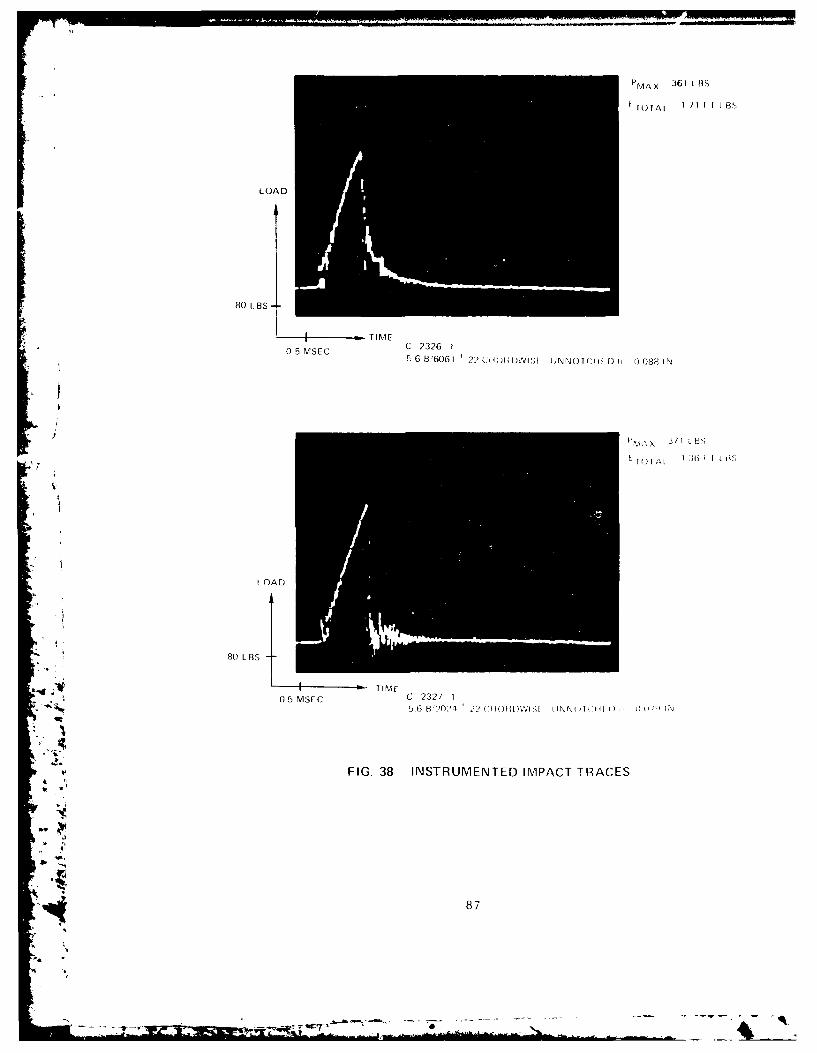
PM,, 361 L BS
TOTAL 1 11 F I L BS5
L OAD0
80 LBS -
I TIME0 5 MSEC C 2326 1
536'061 2?CI [V;ItNNOlC~it Dh 1, 0883 IN
X3 11 L BS
E TOTAL 1 36 1 L W,
OAD
80 LBS
TIME05 MSECC 2327 1
5,68 'fl'4 2) (ll(IVI M LJNNoT(AI 1) I IN~F'
FIG. 38 INSTRUMENTED IMPACT TRACES
87
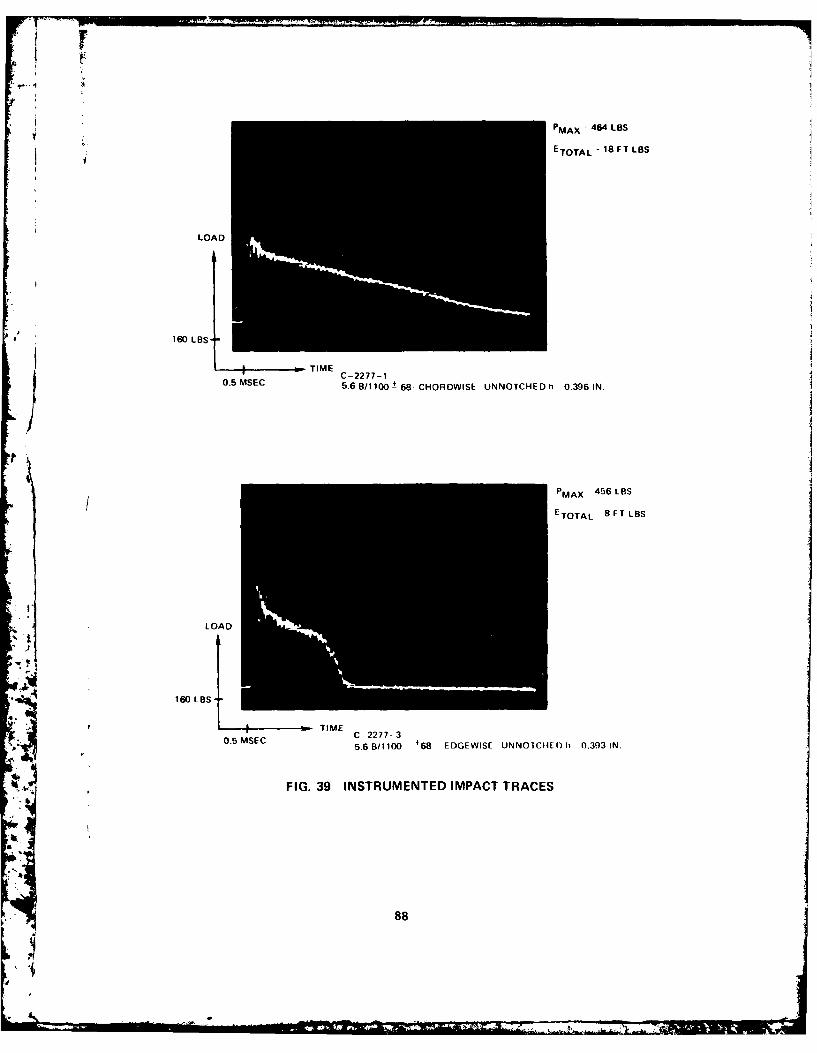
PMAX 464 LBS
* ETOTAL -18S FT LBS
LOAD
* 160LBS.
TIEC-2277-10.5 MSEC 5.68/1100! 68- CHOROWISE UNNOTCHEDIih 0.3961IN.
PMX 456 LBS
* ETOTAL 8FTLBS
LOAD
A 1601LOS
TIMEC22730.5 MSC5.6 8/1 100 '68 EDGEWISE UNNOTCHII) h 0.393IN.
FIG. 39 INSTRUMENTED IMPACT TRACES
ilk
88
4'

JC-2277-1 CHORDWISE UNNOTCHED
C-2277-3 EDGEWISE UNNOTCHED
FIG. 40 + 68-5.6 B-i1100 IMPACT SPECIMENS
89

~MX 125 LBS
ETOTAL 92 FT LBS
LOAD
400 LBS-
TIME0.5MSEC C-2226 -10.5 MSEC5.6 8 / 1 10 0 '4 5
0 -CHORDWISE-UNNOTCHED h -0.407 IN
PMAX 32 LBS
ETOTAL 1.23 FT LBS
A 80 LBS-TIME
0e 5SCC216B/1100 45" CHORDWISE UNNOTCHEDf, 0067 IN
FIG. 41 INSTRUMENTED IMPACT TRACES
90

C-2226-1 CHOROWISE UNNOTCHED
C-2226-2 EDGEWISE UNNOTCHED
FIG. 42 + 450 -5.6 B-100 IMPACT SPECIMENS
91

PMAX 3020 LBS
ETOTAL - 155 FT LBS
LOAD
400 LBS
-mTIME2.0 MSEC C-2322-1
5.6 B/6061 +45i - CHOROWISE- UINNOTCHED h 0.435 IN.
PMAX 2410 LBS
ETOTAL 105 FT LBS
LOAD
800 LBS
TIMEII2.0 MSEC C-2322-25.6 B/6061 _' 45- EDGEWISE - NNOTCH ED h 0.396
FIG. 43 INSTRUMENTED IMPACT TRACES
92

i)C-2322-11 CHORDWISE NOCE
C 2322 2 EDGEWISE UNNOICHED
FIG. 44 +4S505.6 B-6061 IMPACT SPECIMENS
93

4 MAX 2780 LBS
EIM I 88.FT LBS
- LOAD
800 LBS
TIME2.0 MSECC- 2324-12. MEC568/2024 145-CHORDWISE-UNNOTCHED h 0.380 IN
PMAX 2500 LBS
ETOTAL 75 FT LBS
LOAC
800 LBSI
TIMEC 2324 2
2.0 MSEC 5,6 B/2024 45 CHORDWISE UNNOTCHED h 0.380 IN.
FIG. 45 INSTRUMENTED IMPACT TRACES
94
'.4L

C-2324-1 CHOROWISE UNNOTCHED
FIG. 46. + 450.6 B-2024 IMPACT SPECIMENS
59

pmx 936LBS
E TOTAL 11.8FT/LBS
LOAD
I 450 LBS
I I TIME C26-0.5 MSEC c26-5.B100i 5301
Pmax 1020 LBS
E TOTAL 6.1 FT/LBS
LOAD
450LBS
TIME0.5 MSEC c-2371-T4-2
5.613/1100- [(w-45/0/+45)3 03]S
FIG. 47. INSTRUMENTED IMPACT TRACES
96
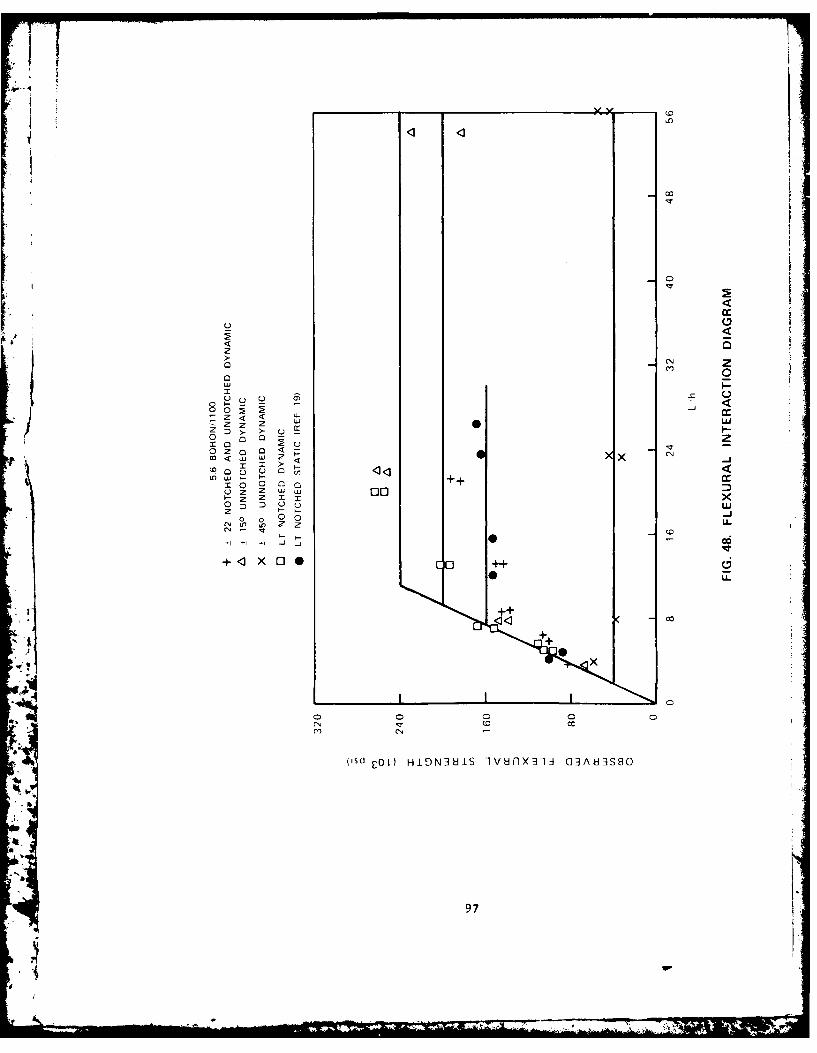
00
Y0
N1 z
oow I-
0x 0 L)
20 z aco~ < < -uL X N1
+ +QZ Z WW 00
Z F- -00 0 0
F-- j _~ j 0 C-
+ X000 -H-0 L-
++
1
m C14
(isd EOL) H I DN 3 IS v 8fnX 31~ J 0A83SO
97
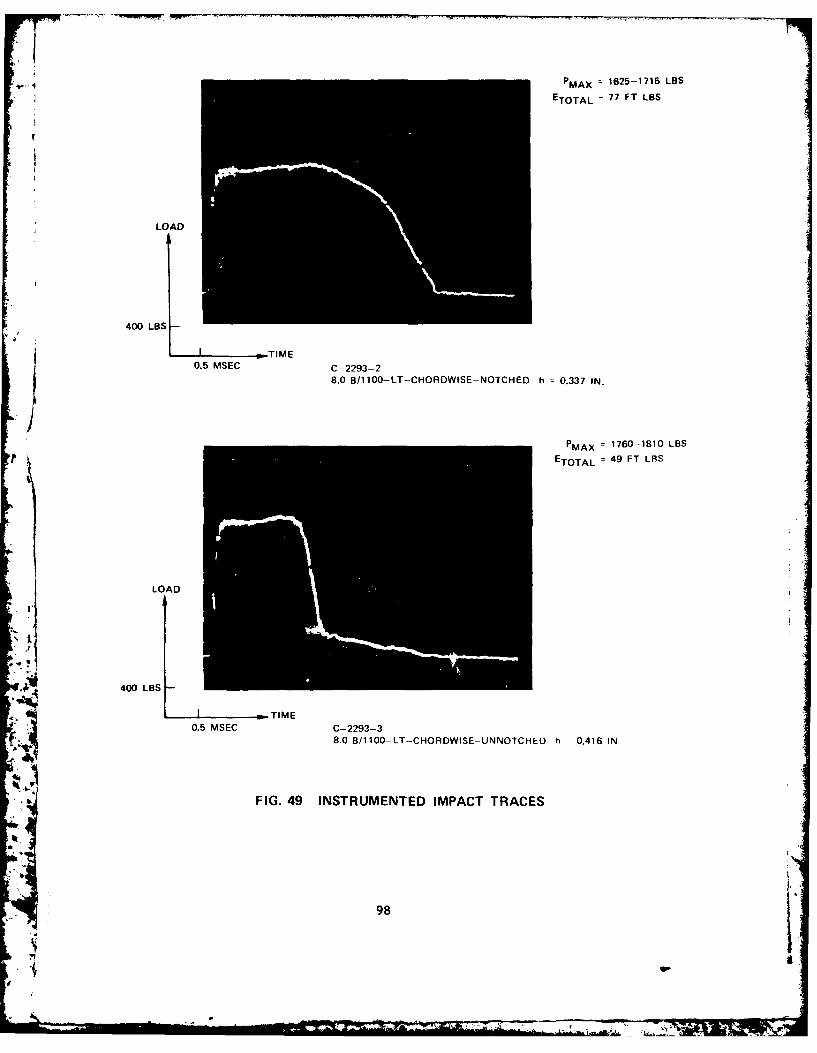
PMAX =1625-1715 LBSETOTAL 77 FT LBS
LOAD
400 LBS
I -a-TIME0.5 MSEC C-2293-2
8.0 B/1 100- LT-CHQRDWI SE- NOTCHED h =0.337 IN.
PMAX =1760-1810 LBSETOTAL = 49 FT LBS
LOAD
400 LBS
I ~ -TIME0.5 MSEC C-2293-3
8.0 B/1100-LT-CHORDWISE-UNNOTCHED h 0.416 IN
FIG. 49 INSTRUMENTED IMPACT TRACES
98
WF%"-V

4
I'C- 2293--3 CHORDWISE NOTCHED
FI.0L-. -10IPC PCMN
* 99

-lml= -T!'.-'-w.*r.--'- .
PMAX 3430 LBS
ETOTAL 13.5 F T LOS
LOAD
800 LBS
TIME
0.5 MSEC C-2294-28 0 B/6061 -LT CHOR DWISE- NOTCHED h 0.339 IN.
DMAX 4460 LBS
I ETOTAL -25 FT LBS
LOAD
BOO LBS
0.5 MSEC C- 2294 38.013/6061 LT- CHOROWISE UNNO1CHL-D h 0.418 IN.
FIG. 51 INSTRUMENTED IMPACT TRACES4 100

C-2294-3 CHORDvlSE NOTCHED
I
4f
C-2294-2 CHOROWISE UNNOTCHED
FIG. 52 LT-8.0 B-6061 IMPACT SPECIMENS
101

pMA 232 LIDSETOTAL 3.4 FT LBS
LOAD
80 LEIS
I TIME2.0 MSEC C-2297-3
8.0 911100-LT-CHOR~DWISE-UNNOTCHED h 0.073 IN.
PMAX -260 LBSETOTAL 1.1 FT LBS
LOAD
80 LFS
-TIME
8.0 8/6061-LT-CHORDWISE- UNNOTCHED h 0.073 IN.
FIG. 53 INSTRUMENTED IMPACT TRACES
102

A.
~103

x2
I-
I- I- w- LU
0 0 LU
0 0 0- QI z U,
F- w 0 C
z zi 0U >F- < cc N
0 < c,
> 4j
*1 F> >
0 0 0 4U. w w
I IN
-j
XXO 4
xxxw
C)C~
104
'.w-

PMAX = 5300 LBSETOTAL = 16.5 FT LBS
EINST. 8 FT LBS
ENERGY LOAC
I5 FT/LBS 1000 LBS
I0.5 MSEC Ti-6A1-4V NOTCHED h 0.315 IN.
I. PMAX = 12,000 LBS FT
ETOTAL>2 6 O FT LBS
ENERGY LOAD
4 B~__ _ _ _ _
5 FT LS- 2000 LBS
0. SCTi-6A1--4V UNNOTCHED h 0. 394 1 N.
FIG. 56 INSTRUMENTED IMPACT TRACES
105

FIG. 57 NOTCHED AND UNNOTCHED Ti-6AI-4VIMPACT SPECIMENS
Ile
106
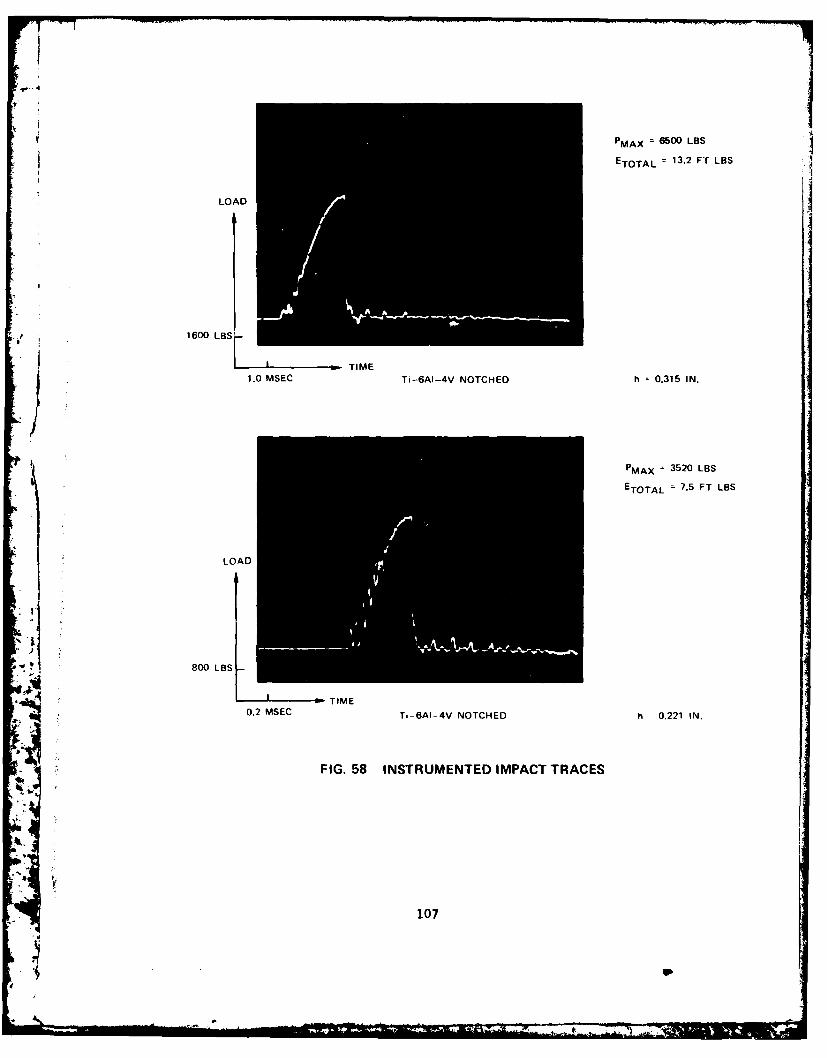
PMAX 6500 LS
ETOTAL =13.2 FTr LBS
LOAD
p 1600 LBS
L ' TIME1.0 MSEC Ti-6AI-4V NOTCHED h 0.315 IN.
PMAX 3520 LBS
ETOTAL 75FT LBS
LOAD
800 LBS
I TIME.9%0.2 MSEC Ti-6AI-4V NOTCHED h 0.221 IN.
FIG. 58 INSTRUMENTED IMPACT TRACES
107

I PMAX -972 LBS
ETOTAL 3.8 FT LBS
LOAD
400 LBS
TIME)Ti-6A1--4V NOTCHED h 0.121 IN.
p MAX 325 LBS
ETOTAL -1.8 FT LBS
LOAD
AI*160 LBS
I -TIME
0. SCTi-6A1--4V NOTCHED hi 0.071 IN
FIG. 59 INSTRUMENTED IMPACT TRACES
10

1000
* Ti-6AI 4V-UNNOTCHEDv I 6061-T6-UNNOTCHED
Ti-6AI-4V- NOTCHED
6061-T6- NOTCHED
LT-5.6B-1100-NOTCHED
+ 450-5.6B-1100-UNNOTCHED
[. 100
/LLI- /LI/
0-
//
0.01 0.1 1.0
h (INCHES)
FIG. 60 ENERGY DISSIPATED AS A FUNCTION OF SPECIMEN GEOMETRY
109

IlkV
0 0
2: x 0
xxj 10
A CD
0 0
4
I zLiUI-L.
a 4
x
i Al
1100
00'L .

PMAX 3060 lbs
ETOTAL >23 It lbs
UNBROKEN
LOAD
800 lbs
TIME C-2384-1
t 0.5msecLT-CHORO-5.6 B/i 100/Ti -6 Al-4 V
UNNOTCHED h =0.381 IN
PMAX 5150 lbs
ETOTAL 16.6 It lbs
LOAD
800 lbs
Qe4LT-EDGE-5.6 B/i 100/Ti--6 A1--4 V
0.Fsa IEC-34-UNNOTCHED Ih 0.396 IN
FIG. 62 INSTRUMENTED IMPACT TRACES

p MAX 1040 lbs
ETOTAL -6.6 Ii
LOAD
4 . 400 lbs
TIME
0.5 msec
C 2385 1
LT CHORD 5.6 8/1 100)/T 6 Al 4 V
UNNOTCHED h 0,19? IN
p MAX 370 lbs
E-JTOTAL 3.9 It lbs
LOAD
* 160 lbT
0.5 msec TIMEC- 2385 3
' TI 5.6B/1100[T, 6A1 4V
UNNOTCHED h 0.01IN
a FIG. 63 INSTRUMENTED IMPACT TRACES
112

PMAX 255 lbs
ETOTAL 1.1 it lbs
LOAD
80 lbs
C -2386 10.5 msec TIME
LI CHOHt7J 5-6 61100/i 6 Al 4V!
UNNOICHEF h 0.067 IN
p MAX 84 lbs
ETOTAL - 1.0 it lbs
LOAD
4..A 80 lbs
0.5 msec
Va~. C 2386 4
TT 5.6 B/100)/Ti 6 Al 4 V
UNNO ICHED h 0.06/ IN
FIG. 64 INSTRUMENTED IMPACT TRACES
113

00uJ
fl w 000
cc a : 0I~0 2 0U W a Q a
I W, W W
++ l 0 0 T
0 00 o 0F - Z Z ZX N
0 0 z 2 z UJ zz D Z)DZ
X~ q0 +
0
-Jz
wI-
U-
CD
co
10-J
0~0 o
0 NCD co41Ad CO1 0L HiON381S iv~flX31 A(3H3G.4 114

TRW
X - NOTCHED-EDGE UTRC
A- NOTCHED-CHORD 0 -UNNOTCHED-CHORD*- UNNOTCHED-EDGE
o- UNNOTCHED-CHORD - --- 5.6B 1100
100 - UNNOTCHED-CHORD WITH EXTRA FOIL]
/ 4
(D 10.0/
z
.01 0.j/1.
h (INCHES)
FIG. 66 ENERGY DISSIPATED AS A FUNCTION OF SPECIMEN
GEOMETRY FOR 5.7 BORSIC REINFORCED Ti-6AI-4V IN LT ORIENTATION
115
*l2
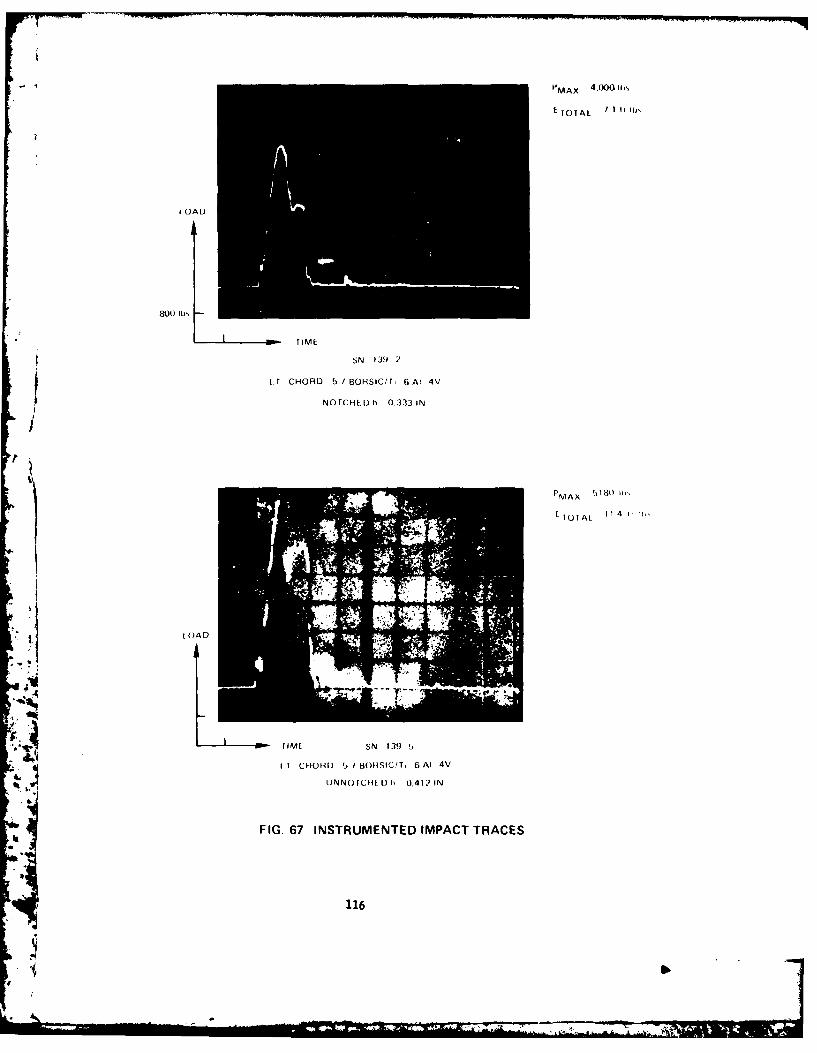
- ~'MAX 4,00011)%
£TOTAL /.1It b
0 DAD
800 Lb1,
IN TME
SN 139 2
I TCHORD 5.7 BORSICIT G Al 4V
NOTCHED h 0.333 IN
IITA 1 14
TIME SN 139 5,
I I CHOHD 51, BDOSIC/T- 6 Al 4V
UNNC)ICIL I 0.412)IN
FIG. 67 INSTRUMENTED IMPACT TRACES
116

Pmax 3840
E TOTAL 4.7FT/LBS
LOAD
800LBS
0.2 MSEG IM' 'N 148 3
LT ED~iE -5.7BORSICTi-6Al--4V) NOJTCHED 0.321
t Plildi 6.542
ETOTAL LS
LOAD
1600LBS
0.2 MSECSN-148 5LT-EDGE-537BORSIG'Ti-6A1 -4V
UNNOTCHED h 0.396
FIG. 68 INSTRUMENTED IMPACT TRACES
117

,-~-.".,.V, - 702 fps
Now- V2 = 713
V3 936
-V 4 1076
OM P V5 1233
C-2479
1± 2215 5.6B/6061 t =0.0691N.
V3 = If116
V 4 - 1297
V5 =1324
V6 =1362
C-2480
1±2215 5.6B/1100 t 0 .0661N.
FIG. 69 CANTILEVERED BALLISTIC TEST SPECIMENS (CLAMPED AT RIGHT END)
118
Zl

V 1 846 fps
- ~ V 2 933
V3 1155
V4 1160
V 5 -1245
C-2479
1±221 5 5.68/606t t 0.0691N.
V, 352 fps
V 2 761
.2 1 V3 941
V4 1193
C-2480
[±2215 5.6B/1100 t 0.0661N.
FIG. 70 SIMPLY SUPPORTED BALLISTIC TEST SPECIMENS
l)

SIMPLY SUPPORTED BALLISTIC TEST SPECIMENS
V1 190 fp
- -. -V 2 =439
V3 =903
V4 =1330
SN- 129-2I0"-5.'7 BORSIC/Ti-6A1-4V t 0.0521N.
p CANTILEVERED BALLISTIC TEST SPECIMENS (CLAMPED AT RIGHT END)
__________V, =705fps
V2 =786
V3 =816
"mama V4855
SN- 129-1
00- 5 7 BORSIC/Ti-6A1--4V t 0.0521N.
FIG. 71 BALLISTIC IMPACT OF BORSIC TITANIUM
120

V, 705 fps
V2 = 79
V3 =845
V4 =990
tV5 1050
C-2475-76
0O-5.6B/1 100 WITH 0.009 Ti-6AI-4VON EACH FACE t -0.0661N.
FIG. 72 CANTILEVERED BALLISTIC TEST SPECIMENS
121

V1 718tfps
-V 2 791
V3 = 856
V 4 = 880
_____________________________V 5 = 1136
V6 =1179
C-2579
1+ 45/02 12 -8.08/1 100 0 .0751N
-V ~ 1 446 fps
~. *-.. ~V 2 =553
V 3 8 56
V 4 =1096
V 5 1116
.4
3 VG 1359
C-2578
.. I j!22j 4 -8.08/1100 t=0.0751N.
FIG. 73 CANTILEVERED BALLISTIC TEST SPECIMENS (CLAMPED AT RIGHT END)
A
122
I -aL

-p O V2 1025
V 3 1488K) V4 1562
V5 = 1645
WIN V6 = 1838
C- 2580
00 -8.0B/1100 t= 0.0851N.
WITH THREE LAYERS OF 0.0051N. THICK Ti- 6AL-4V ON EACH FACE,
FIG. 74 CANTILEVER ED BALLISTIC TEST SPECIMENS (CLAMPED AT RIGHT END)
123

REFERENCES
1. K. G. Kreider, L. Dardi, K. M. Prewo, AFML,-TR-1-204.
2. K. M. Prewo, Jl. Comp. Matls., Vol. 6, p 442, 1972.
3. K. I4. Prewo, Proc. Third Intl. Conf. on the Strength of Metals and Alloys,
Cambridge, England Vol. 1, paper no. 57. 1973.
4. C. Ellis and B. Harris, Ji. Comp. Matls., Vol. 7, p 76, 1973.
5. T. Guess and W. Hoover, Jl. Comp. Matls., Vol. 'I, p 2, 1973.
6. W. R. Hoover and R. E. Allred, Sandia Labs. Rept. SAND-74-0193, 19 7 4a.
7. W. R. Hoover, Sandia Labs. Rept., SAND-74-0323, 1975.
8. R. A. Wulaert, in "ASTM-STP 466," 1970 pp 148-164.
i- 9. W. R. Hoover, Sandia Labs. Rept. SLA-73-0972, 1973.
10. D. R. Ireland, Effects Technology Reprint, TR-73-25R.
11. D. R. Ireland, Effects Technology, Santa Barbara, Calif.
12. W. R. Hoover, Sandia Labs., Albuquerque, New Mexico.
13. J. V. Mullin and A. C. Knoell, Matls. Res. and Stds., Vol. 10, #12, p 16.
14. A. W. Christiansen, et al, Fib. Sci. & Tech., Vol. 7, 1974, p 1.
15. C. A. Berg, et al, ASTM-STP-497, 1972 pp 206-218.
16. S. A. Sattar and D. H. Kellogg, ASTM-STP-460, 1969, j 62.
17. K. T. Kedivard, Fib. Sci. & Tech., Vol. 5, 1972, p 85.
18. C. Chamis, private communication.
19. K. M. Prewo, Third International Conference on Lhe Strength of Metals andAlloys, Cambridge, England 1973.
124