with zman & ivmanwith zman & ivman - 제목 없음 · pdf filenew file creation during...
TRANSCRIPT

ZIVZIVEE Smart Manager SoftwareSmart Manager Software
With ZMAN & IVMANWith ZMAN & IVMANWith ZMAN & IVMANWith ZMAN & IVMAN
Designing the Solution for ElectrochemistryPotentiostat/Galvanostat І Battery Cycler І Fuel Cell Test Station+82-2-578-6516 І [email protected] І www.zivelab.com І www.fctest.com

FeaturesZIVE Smart ManagerZIVE Smart Manager
• Supports fourteen(14) kind of EIS techniquespp ( ) q• Current interrupt IR measurement/IR compensation• Pulse charge/discharge test available• Bipolar pulse capability• High speed data sampling time
- 50usec/sample in burst mode- 1msec/sample in normal mode- 2usec/sample in fast sweep mode
• Software packages - Energy software package (BAT)- EIS software package (EIS)- Electrochemical analysis software package(EAS)Electrochemical analysis software package(EAS)- Corrosion software package (COR)
• Free software package
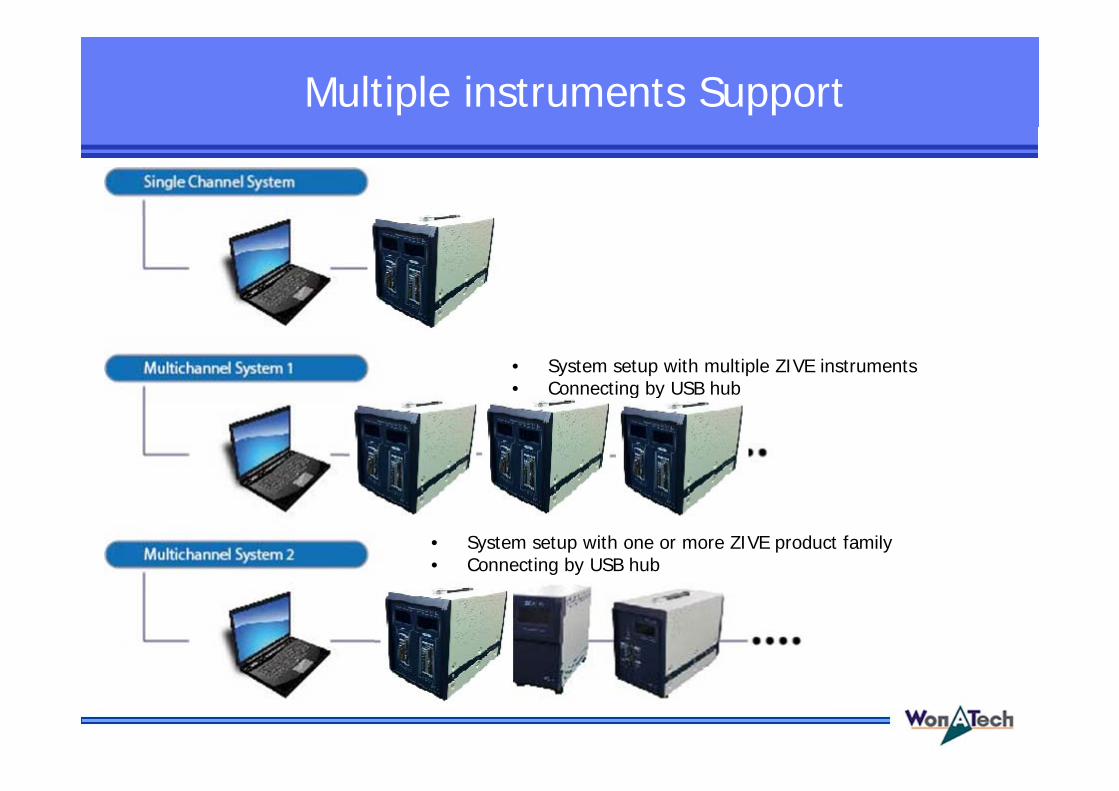
Multiple instruments Support
• System setup with multiple ZIVE instruments• Connecting by USB hubg y
• System setup with one or more ZIVE product family• Connecting by USB hub
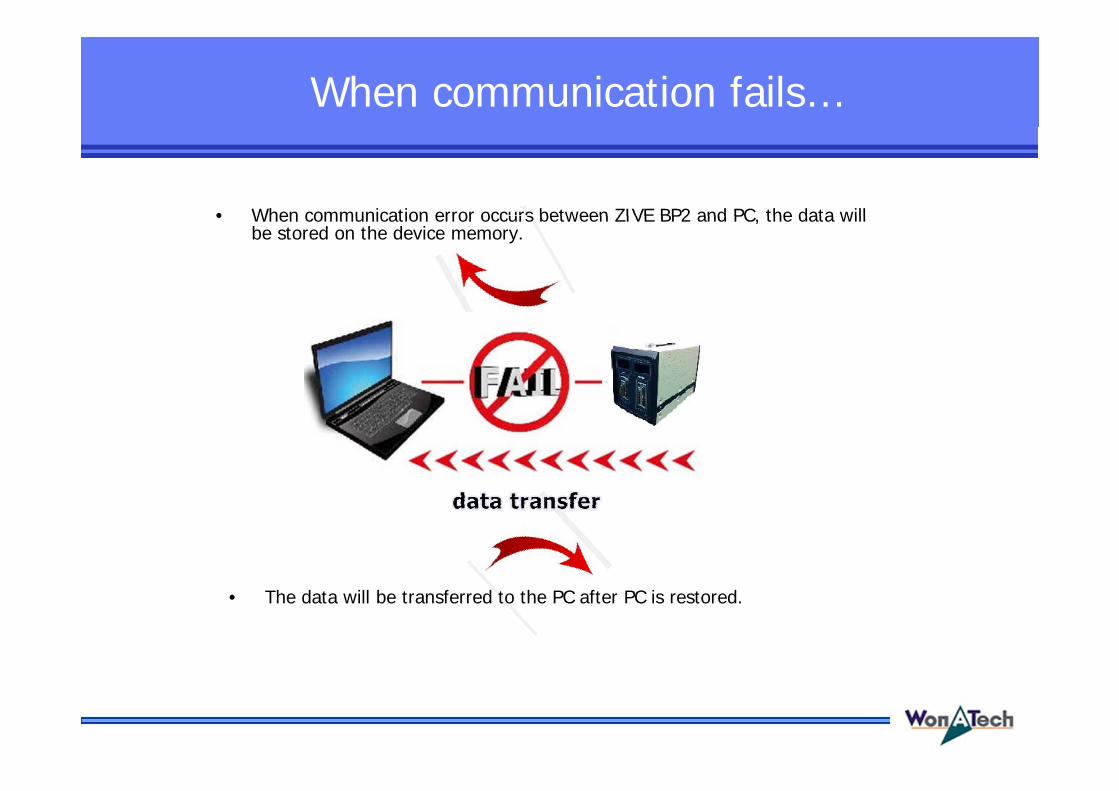
When communication fails…
• When communication error occurs between ZIVE BP2 and PC the data will• When communication error occurs between ZIVE BP2 and PC, the data will be stored on the device memory.
• The data will be transferred to the PC after PC is restored.

Strong Point
• Highly user friendly software
• Universal graphic (DC/EIS/Cycle)
• Experimental plan by following three methods: Technique menu
S fil dit: Sequence file editor - User can create a complex series of experiments by making scripting
: Bath file- User can make a batch file by combining technique menu and sequence
file. Consequently, it helps user to create his own test methods.
BCO(button click operation) function : Click icon for the system operation
Fail function
Safety limit setting
New file creation during experiment
Bipolar pulse capability
Sine wave control available

Strong Point
• Basic Echem techniques as standard1) Potentiostatic2) Galvanostatic3) Double step potentiostatic4) D bl t l t ti4) Double step galvanostatic5) OCP measurement6) Potential sweep7) Current sweep8) Cyclic voltammetry9) F t t ti l9) Fast potential sweep10) Potentiostatic Ru measurement11) Galvanostatic Ru measurement
• Advanced software package can be selectable depending on user’sAdvanced software package can be selectable depending on user s application
- EIS software package(EIS/EISe)- Energy(Battery) software package(BAT/BATe)- Corrosion software package(COR/CORe)- Electrochemical analysis software package(EAS/EASe)Electrochemical analysis software package(EAS/EASe)
• Analyze data with independent EIS and DC data analysis softwarewithout purchasing license codes- ZMANTM impedance data analysis software
IVMANTM DC data analysis software- IVMANTM DC data analysis software
Strong Point
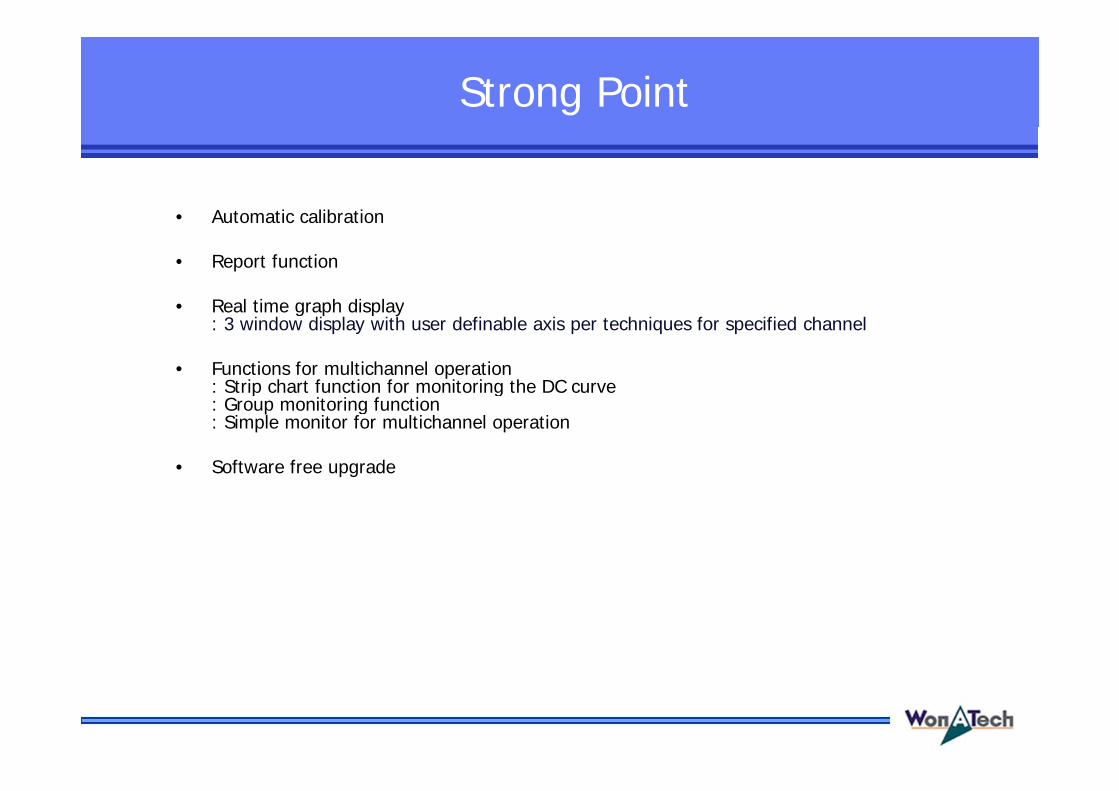
• Automatic calibration• Automatic calibration
• Report function
• Real time graph display• Real time graph display: 3 window display with user definable axis per techniques for specified channel
• Functions for multichannel operation : Strip chart function for monitoring the DC curvep g: Group monitoring function: Simple monitor for multichannel operation
• Software free upgrade

Smart Manager(SM) Software
f f f• Electrochemistry software for ZIVE family- provides support for all techniques and device functionalities- provides user defined test sequence using sequence file, technique menu and
batch file. The batch file allows user to do a serial test by combining sequence files and/or technique filesand/or technique files.
- SM software is easy to use and supports various electrochemical experiments including functions of system control, schedule file editor, real time graph, analysis graph, user calibration, and data file treatment etc.

Basic Technique
B i T h i ith St d d F ti• Basic Technique with Standard Functions1) Potentiostatic2) Galvanostatic3) Double step potentiostatic4) Double step galvanostatic) p g5) OCP measurement6) Potential sweep7) Current sweep8) Cyclic voltammetry9) Fast potential sweep 50 usec data sampling) p p10) Potentiostatic Ru measurement11) Galvanostatic Ru measurement
50 usec data sampling
Peak find moduleDC h Peak find moduleDC graph

EIS Software Package (EIS)
EIS S ft P k (EIS/EIS )• EIS Software Package (EIS/EISe)1) Potentiostatic EI2) Galvanostatic EIS3) Pseudo Galvanostatic EIS4) OCP(*) EIS4) OCP(*) EIS 5) Potentiodynamic PEIS6) Galvanodynamic GEIS 7) Potentiodynamic HFR8) Galvanodynamic HFR
OCV EIS8) Galvanodynamic HFR9) Potentiostatic HFR monitor10) Galvanostatic HFR monitor11) Multisine Potentiostatic EIS12) Multisine Galvanostatic EIS Potentiodynamic PEIS12) Multisine Galvanostatic EIS13) Intermittent Potentiostatic EIS14) Intermittent Galvanostatic EIS
(*) The system measures open circuit potential before for
Potentiodynamic PEIS
( ) The system measures open circuit potential before for each frequency change and applies AC sine wave on this potential.
Rs, Cp & Idc vs Vdc plotRs, Cp & Idc vs Vdc plot

Electrochemical Analysis Software Package (EAS)(EAS)
• Electrochemical Analysis Software Package ( / )
g(EAS/EASe)1) Step Techniques
- CA (Chronoamperometry)- CC (Chronocoulometry)
CP (Chronopotentiometry)- CP (Chronopotentiometry) 2) Sweep Techniques
- LSV (Linear Sweep Voltammetry)- SDV (Sampled DC Voltammetry)
Fast CV
50 usec sampling
- Fast CV- Fast LSV
3) Pulsed Techniques- DPV (Differential Pulse Voltammetry)
SWV (Square Wave Voltammetry)Sdv_charging/sdv discharging- SWV (Square Wave Voltammetry)
- DPA (Differential Pulse Amperometry)- NPV (Normal Pulsed Voltammetry)- RNPV (Reverse Normal Pulse Voltammetry)
DNPV (Differential Normal Pulse Voltammetry)
sdv_discharging
- DNPV (Differential Normal Pulse Voltammetry)
NPV & RNPV overlay

Corrosion Software Package (COR)
• Corrosion Software Package (COR/CORe)g
Corrosion technique supports IR compensation.
1) Tafel (Tafel Experiment)2) Rp (Polarization Resistance)3) RpEc Trend4) PDYN (Potentiodynamic)
Tafel plot
5) CYPOL (Cyclic Polarization Resistance)6) GDYN (Galvanodynamic)7) Reactivation8) Galvanic Corrosion Polarization resistance9) Potentiostatic ECN10) Galvanostatic ECN11) ZRA mode ECNTS
Polarization resistance
Cyclic polarizationi tresistance

Battery/Energy Software Package (BAT)
• Battery/Energy Software Package (BAT/BATe)
B tt /E ft t IR tBattery/Energy software supports IR measurements.1) Battery Test Technique
- CC/CV test for Lithium Battery charging/discharging cycle life test- CC/CC test for NiCd & NiMH battery charging/discharging cycle life test
Discharging test- Discharging test- EVS (Electrochemical voltage spectroscopy)- Variable scan rate CV- Potentiostatic IV curve
Galvanostatic IV curve- Galvanostatic IV curve - Steady state CV- GITT(Galvanostatic intermittent titration technique) test- PITT(Potentiostatic intermittent titration technique) test- Pulse mode is available for GSM & CDMA profile.
P l h fil b d b ’ d dPulse shape profile monitor
Pulse shape profile can be measured by user’s demand.p p
(micro sec order)
C t i
CC/CV test EVS
Current sine wave (charge ripple simulation)

Battery/Energy Software Package (BAT)
2) Control Mode- Charge: CC, CC(CP,Crate,CR)-CV, pulse, sine wave- Discharge: CC, CC(CP,Crate,CR)-CV ,CP, CR, pulse, sine wave
3) Cutoff Condition- Time, voltage, current, power, auxV etc.- Various battery charge/discharge test is available including pulse discharge for GSM,
CDMA application.

Sequence Editor
Control
Tree
Cut-Off Sampling

Control Parameters

Advanced Parameter Setting
Staircase samplingStaircase sampling
Safety SettingCell InformationPulse settingPulse setting
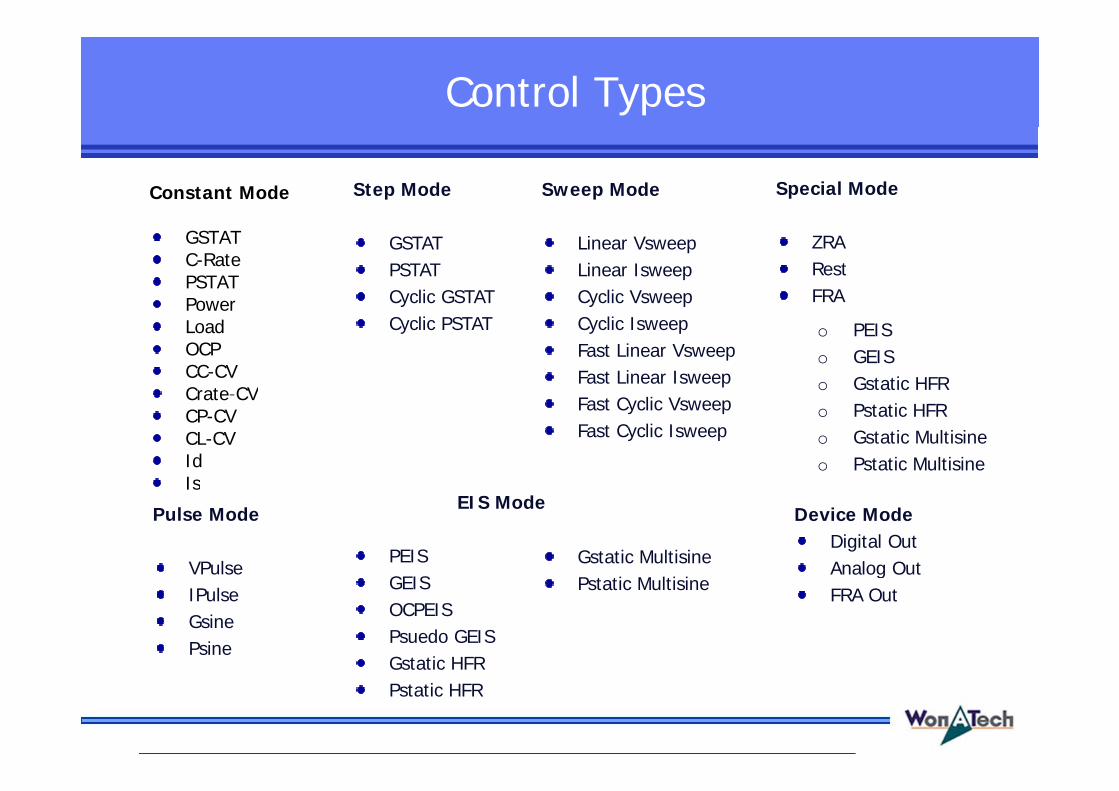
Control Types
Constant Mode Step Mode Sweep Mode Special Mode
GSTATC-RatePSTATPower
GSTATPSTATCyclic GSTAT
Linear VsweepLinear IsweepCyclic Vsweep
ZRARestFRAPower
LoadOCPCC-CVCrate-CV
yCyclic PSTAT
y pCyclic IsweepFast Linear VsweepFast Linear Isweep
o PEISo GEISo Gstatic HFRCrate CV
CP-CVCL-CVIdIs
Fast Cyclic VsweepFast Cyclic Isweep
o Pstatic HFRo Gstatic Multisineo Pstatic Multisine
Is
Pulse Mode
VPulse
EIS Mode
PEIS Gstatic Multisine
Device ModeDigital OutAnalog Out
IPulseGsinePsine
GEISOCPEISPsuedo GEISGstatic HFR
Pstatic Multisineg
FRA Out
Gstatic HFRPstatic HFR

Gsine/Psine

Pulse Profile
Control valueControl value
seg7
seg1
seg4
seg1
seg10
time

Pulse Profile
Zoom up Profile recording On Profile recording off
The first two pulse train will be recorded per 50usec time resolution

CC(CP,Crate,CR)-CV
S ti l t l i t C t t (I C t P L) C t t lt• Sequential control in one step: Constant (I,Crate,P,L)-Constant voltage
Constant(I,Crate,P,L) control
V•No time delay
Constant voltage control
VConstant voltage Value
Time

Last Value Control
C t t (V I P L) S (V I) St (V I)Constant (V,I,P,L), Sweep(V,I), Step(V,I)
Prev. Step Current Step
VTime delay to setup new step
VConstant Last Value
Sweep Last Value
TimeLast value control is based on the reading value of last point in previous step.g p p p

Cyclic Control
S (V I) St i (V I)Sweep(V,I), Staircase(V,I)
VNo time delay
V
Cyclic sweep
Time
Cyclic control is based on the control value at vertex pointCyclic control is based on the control value at vertex point.
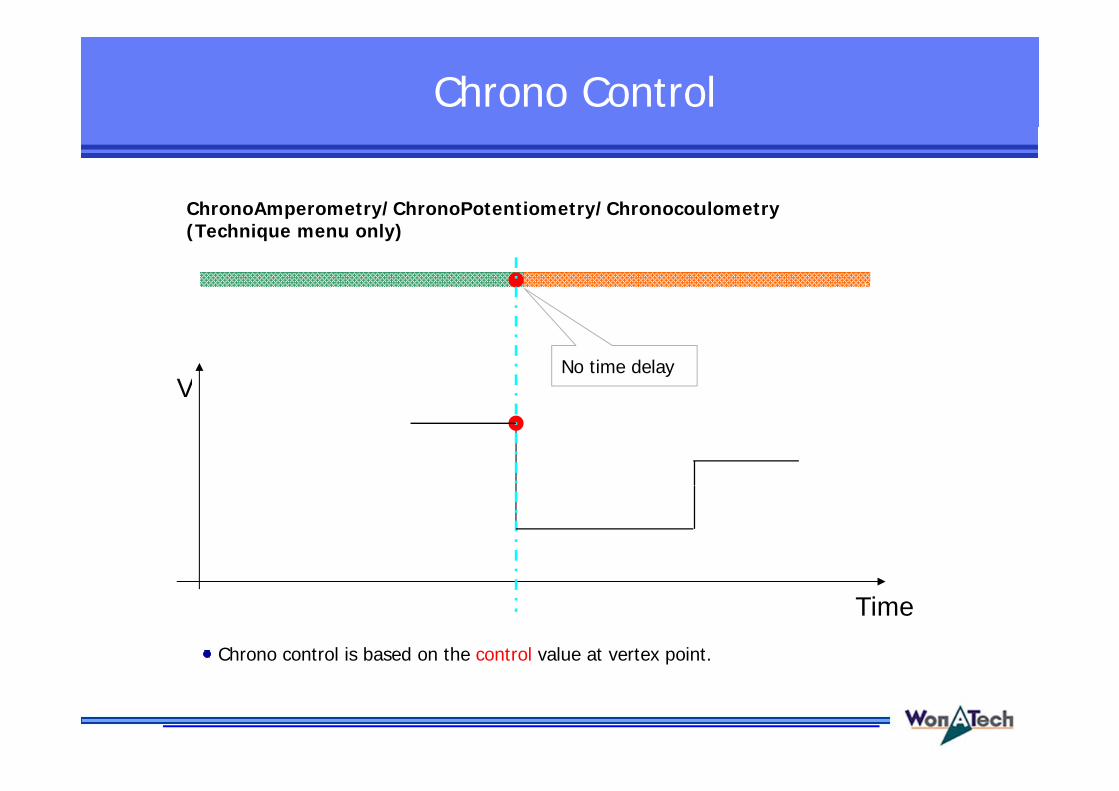
Chrono Control
ChronoAmperometry/ChronoPotentiometry/Chronocoulometryp y/ y/ y(Technique menu only)
VNo time delay
V
Time
Chrono control is based on the control value at vertex point.

Fast Sweep
•Control interval: 200nsec
•Data sampling interval: 2usec
•Smart manager support fast sweep with fast sampling mode. When you select FAST‐P or FAST‐G in sweep mode using sequence editor or Fast potential sweep, fast LSV, fast CV using technique menu, DAC updating rate is 5MHz. Smart Manager can change DAC value per 200nsec. ADC updating rate is 500kHz. Smart Manager can read data per 2usec.

FRA Function
FRA function is to control external electronic load or potentiostat for EIS measurement
•FRA potentiostatic EIS•FRA galvanostatic EIS•FRA potentiostatic HFR•FRA galvanostatic HFR

Cut-Off Condition
Step timeVoltage
FCDLCC
Loop timeEoc VoltVoltage
CurrentCurrent densityCapacity
LCDPowerTotal Ahr
l h
|dV/dt||dI/dt||dT/dt|
-dVEocWHrFCC
Total WhrCycle timeTest timeLoop next
AuxV1,2,3StepEndC-rateTemperatureFCC Loop next TemperatureDI channel

Timer
• Step Time, Test time• C-time=> Cycle Time• L-time=> Loop time
CycleLoop
Test timeStep time
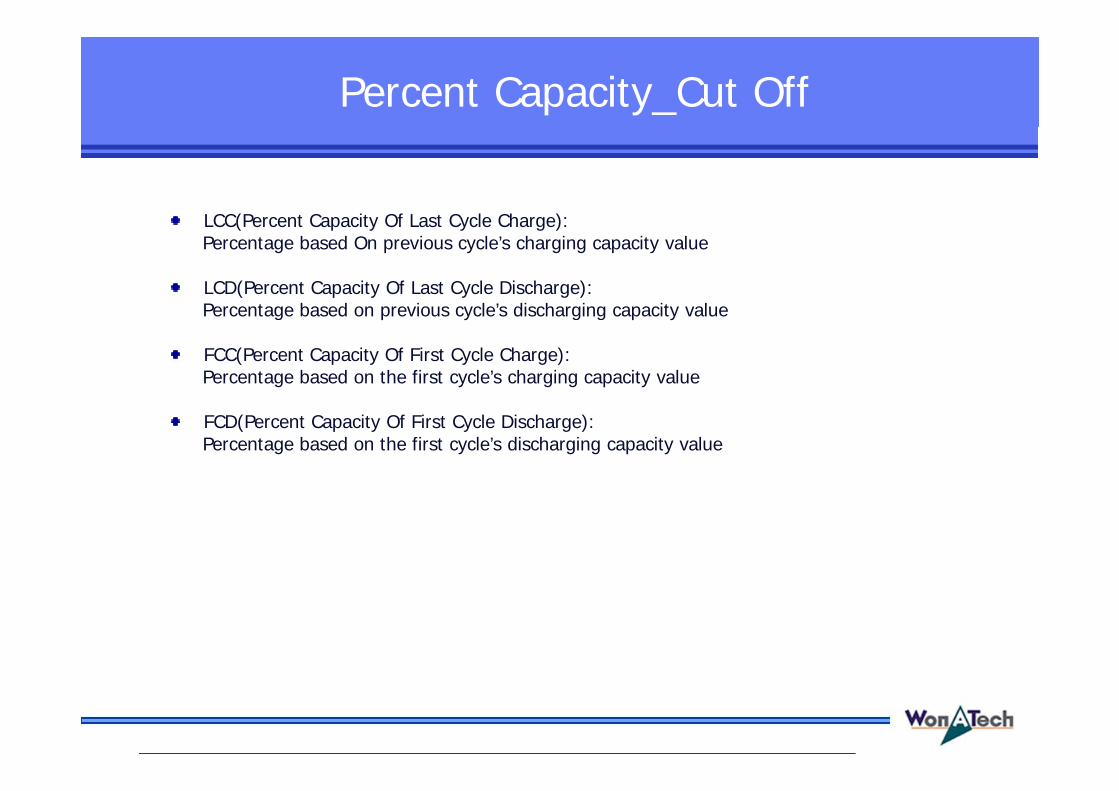
Percent Capacity_Cut Off
LCC(P t C it Of L t C l Ch )LCC(Percent Capacity Of Last Cycle Charge): Percentage based On previous cycle’s charging capacity value
LCD(Percent Capacity Of Last Cycle Discharge): P t b d i l ’ di h i it lPercentage based on previous cycle’s discharging capacity value
FCC(Percent Capacity Of First Cycle Charge): Percentage based on the first cycle’s charging capacity value
FCD(Percent Capacity Of First Cycle Discharge): Percentage based on the first cycle’s discharging capacity value

Cut-Off Condition(and/or logic)(and/or logic)
Priority ‘Or’ Logic
‘And’ Logic
Priority Or Logic

Sampling
Or LogicOr Logic
Time Unit Input : ####=>sec, AA B C => AA hr B min C secAA B C => AA hr, B min C secAA:B:C => AA hr, B min C sec

Advanced Setting for Each Step
User can change hardware setting for each step following experiment condition.
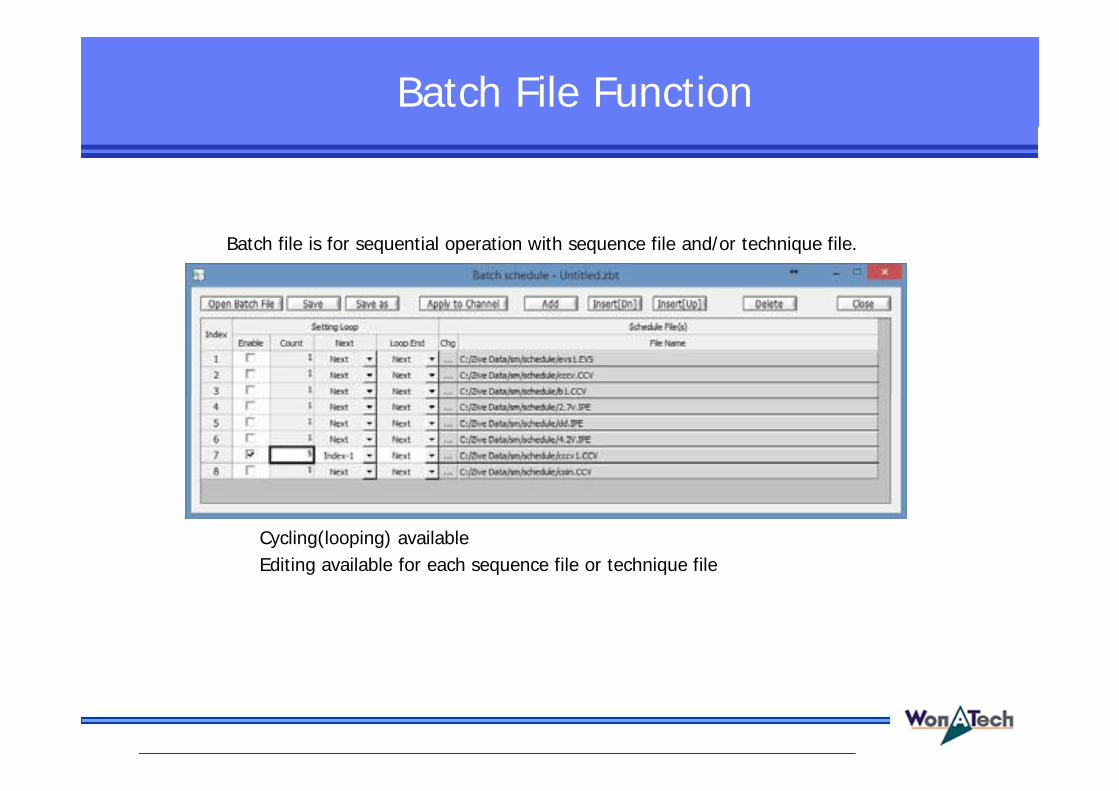
Batch File Function
Batch file is for sequential operation with sequence file and/or technique file.
Cycling(looping) availableEditing available for each sequence file or technique file

Control Menu

Virtual Control Menu
Single channel control/status view

Start Experiment

Real Time Graphfor Single Channelfor Single Channel
EIS data real time plot DC data real time plot

Real Time Graph Setting
axis setting for sequence data axis setting for technique data

Real Time Graphfor Multichannelfor Multichannel
Single channel operation Multichannel operation
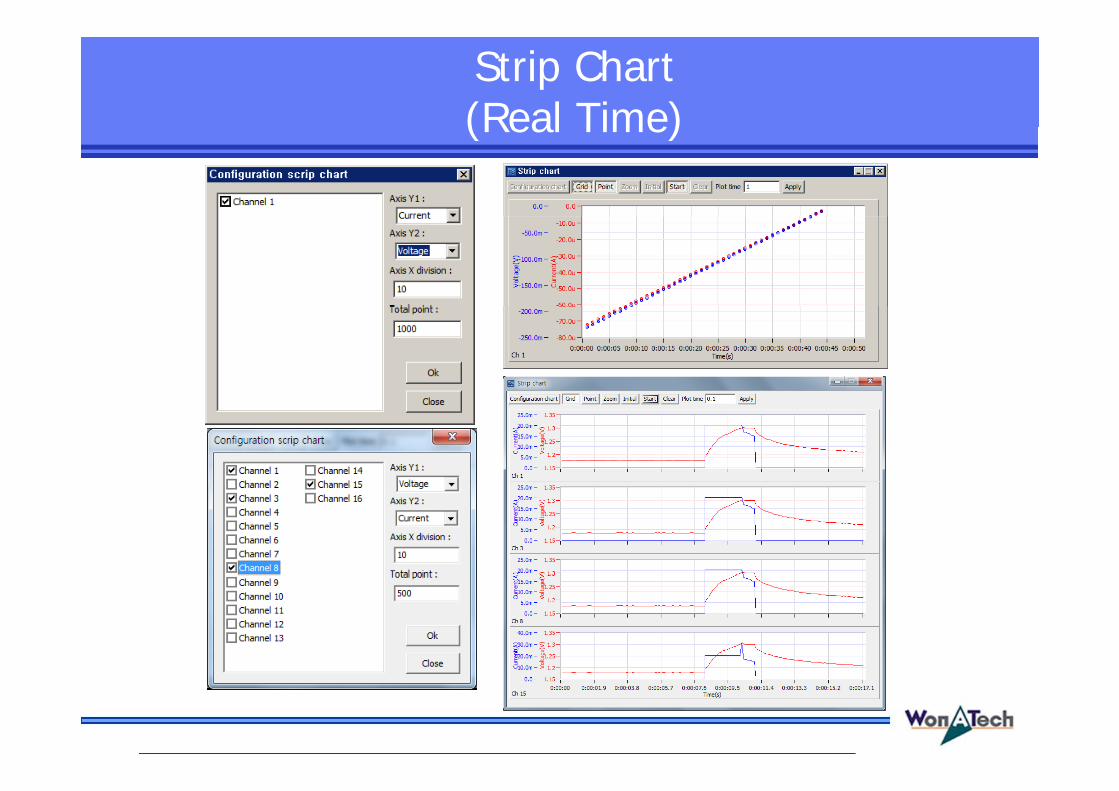
Strip Chart(Real Time)(Real Time)

Simple Monitor
• For EIS test • For DC test• Highest layer location
Color
Highest layer location
• Grey: idle• Violet: charging• Blue: discharging• Green: EIS measurement• Yellow: calibration• Red: error (safety limit etc.)

Data Files
DC data only: File(.sdo)- DC graph & cycle graph
EIS data only: File(.seo)EIS data only: File(.seo)- EIS graph
DC data and EIS data: File(.sde)DC/EIS/Cycle graph- DC/EIS/Cycle graph
IVMANTM software reads .sdo and .sde file for DC data analysis.
ZMANTM software reads .seo and .sde file for EIS data analysis.

Data Converting(Binary to ASCII or Excel Format)(Binary to ASCII or Excel Format)
Multiple data files conversion
Conversion from report
Data conversion from graph
p

Advanced Graph Setting

Graph Option

DC Graph Shortcut
Shortcut iconShortcut icon

DC Graph Parameters
•X axis: total test time(test time), Voltage(Eref), current(I,I_s,I_d), Aux1, Log(I,I_d,I_s), load, Load_s, Load_d, Charging capacity(ChQ,ChQ_s,ChQ_d), discharging capacity(DchQ, DchQ_s, DchQ_d),charging power(Ch P, Ch P_s, Ch P_d), discharging power(Dch P, Dch P_s, Dch P_d), charging energy(Ch‐Wh Ch‐Wh s Ch‐Wh d) discharging energy(Dch‐Wh Dch‐Wh s Dch‐Wh d)charging energy(Ch‐Wh,Ch‐Wh_s, Ch‐Wh_d), discharging energy(Dch‐Wh, Dch‐Wh_s, Dch‐Wh_d), accumulated energy(Sum Wh, Sum Wh_s, Sum Wh_d)), Accumulated capacity(Sum Q, Sum Q_d, Sum Q_s), absolute accumulated capacity(Sum|Q|, Sum |Q_s|, Sum |Q_d|), absolute Capacity(|Q|,|Q_s|,|Q_d|), Cycle time, Step time
Max. 4 Y axis
•Y1,Y2,Y3,Y4axis: Voltage(Eref), current(I), current(I,I_s,I_d), Aux1, Log(I,I_d,I_s),load,Load_s,Load_d, Charging capacity(ChQ,ChQ_s,ChQ_d), discharging capacity(DchQ, DchQ_s, DchQ_d),charging power(Ch P, Ch P_s, Ch P_d), discharging power(Dch P, Dch P_s, Dch P_d), charging energy(Ch‐Wh,Ch‐Wh_s, Ch Wh d) Discharging energy(Dch Wh Dch Wh s Dch Wh d) accumulated energy(Sum WhCh‐Wh_d), Discharging energy(Dch‐Wh, Dch‐Wh_s, Dch‐Wh_d), accumulated energy(Sum Wh, Sum Wh_s, Sum Wh_d)), Accumulated capacity(Sum Q, Sum Q_d, Sum Q_s), absolute accumulated capacity(Sum|Q|, Sum |Q_s|, Sum |Q_d|), absolute Capacity(|Q|,|Q_s|,|Q_d|), Polarization resistance(Rp), Capacity difference vs. voltage difference(dQ/dV, dQ_s/dV,dQ_d/dV)
•_d: density (/area)•_s: specific(/weight)

EIS Graph Shortcut
Shortcut iconShortcut icon

EIS Graph Parameters
•X axis: Log frequency(Freq), Z real(Zre), Y real(Yre), Zphase(Zph), Yphase(Yph), Rs(R-C), Cs(R-C), Rp(R|C), Cp(R|C), Rs(R-L), Ls(R-L), Q(R-L), time,Rs(R C), Cs(R C), Rp(R|C), Cp(R|C), Rs(R L), Ls(R L), Q(R L), time, voltage(Vdc), current(Idc), auxiliary voltage(Aux1), frequency
•Y axis:•Y axis: Zreal(Zre), -Zimaginary(-Zim), |Z|, Zphase(Zph), Yreal(Y’), Yimaginary(Yimg),Y absolute value(|Y|), Yphase (Yph), LogZ, LogY, Rs(R-C), Cs(R-C), Rp(R|C), Cp(R|C), Rs(R-L), Ls(R-L), Q(R-L), time, voltage(Vdc), current(Idc) auxiliary voltage(Aux1)current(Idc), auxiliary voltage(Aux1)

Cycle Graph Shortcut
Shortcut iconShortcut icon

Cycle Graph Parameters
X a is• X axis: cycle number(Cycle No), charging capacity(ChQ,ChQ_s,ChQ_d),
discharging capacity(DchQ, DchQ_s,DchQ_d), accumulated capacity(Sum Q, Sum Q_s, Sum Q_d), Coulomb efficiency(Coulomb Eff), Charging
( h h h h h h d) d h ( h henergy(Ch‐Wh, Ch‐Wh_s, Ch‐Wh_d), discharging energy(Dch‐Wh, Dch‐Wh_s, Dch‐Wh_d), accumulated engergy(Sum Wh, Sum Wh_s, Sum Wh_d), energy efficiency(Energy Eff), Minimum voltage(MinV), Maximum voltage(MaxV), charging average voltage(ChVavg), discharging average
l ( h ) l l ( ) h f d hvoltage(DchVavg), cycle average voltage(Vavg), Depth of discharge
• Y axis: charging capacity(ChQ ChQ s ChQ d) discharging capacity(DchQcharging capacity(ChQ,ChQ_s,ChQ_d), discharging capacity(DchQ,
DchQ_s, DchQ_d), accumulated capacity(Sum Q, Sum Q_s, Sum Q_d), Coulomb efficiency(Coulomb Eff), Charging energy(Ch‐Wh, Ch‐Wh_s, Ch‐Wh_d), discharging energy(Dch‐Wh, Dch‐Wh_s, Dch‐Wh_d), accumulated engergy(Sum Wh Sum Wh s Sum Wh d) energyaccumulated engergy(Sum Wh, Sum Wh_s, Sum Wh_d), energy efficiency(Energy Eff), Minimum voltage(MinV), Maximum voltage(MaxV), charging average voltage(ChVavg), discharging average voltage(DchVavg), cycle average Voltage(Vavg), Cycle number, Log(Cycle number), ChQ/Q0, DischQ/Q0 ChQ-Q0 DischQ-Q0
•_d: density (/area)•_s: specific(/weight)
DischQ/Q0, ChQ Q0, DischQ Q0

IR measurement/compensation
Exponential fitting Linear fitting
Current Interrupt IR measurement
Positive feedback IR compensation & Dynamic IR compensationPositive feedback IR compensation & Dynamic IR compensation
• I,IR vs. timeCC/CV charging CC discharging with dynamic IR measurement

IR measurement/compensation
IR measurement only in techniques IR measurement and compensation in techniques1 Basic techniques (Positive feedback)
•You can enable/disable IR measurement for the following techniques1.Basic package (Current Interrupt Method)
A Potentiostatic Ru measurement
1. Basic techniques (Positive feedback)A. PotentiostaticB. Potential sweepC. Cyclic voltammetry
A. Potentiostatic Ru measurementB. Galvanostatic Ru measurement
2.Energy package (Dynamic Method)A. CC/CV test
2. Corrosion techniques (positive feedback or dynamic)A. TafelB. PotentiodynamicC. Cyclic polarization
B. CC/CC testC. EVS testD. Variable scan rate CVE. Pstat IV curve
D. polarization resistanceE. RpEc trendF. Reactivation potential
3. Echem analysis package (positive feedback)F. Gstat IV curveG. Steady state CV
3. Echem analysis package (positive feedback)A. ChronoamperometryB. ChronocoulometryC. Normal pulse voltammetryD Differential pulse voltammetryD. Differential pulse voltammetryE. Reverse normal pulse voltammetryF. Squarewave voltammetryG. Linear sweep voltammetryH. Sampled DC voltammetry
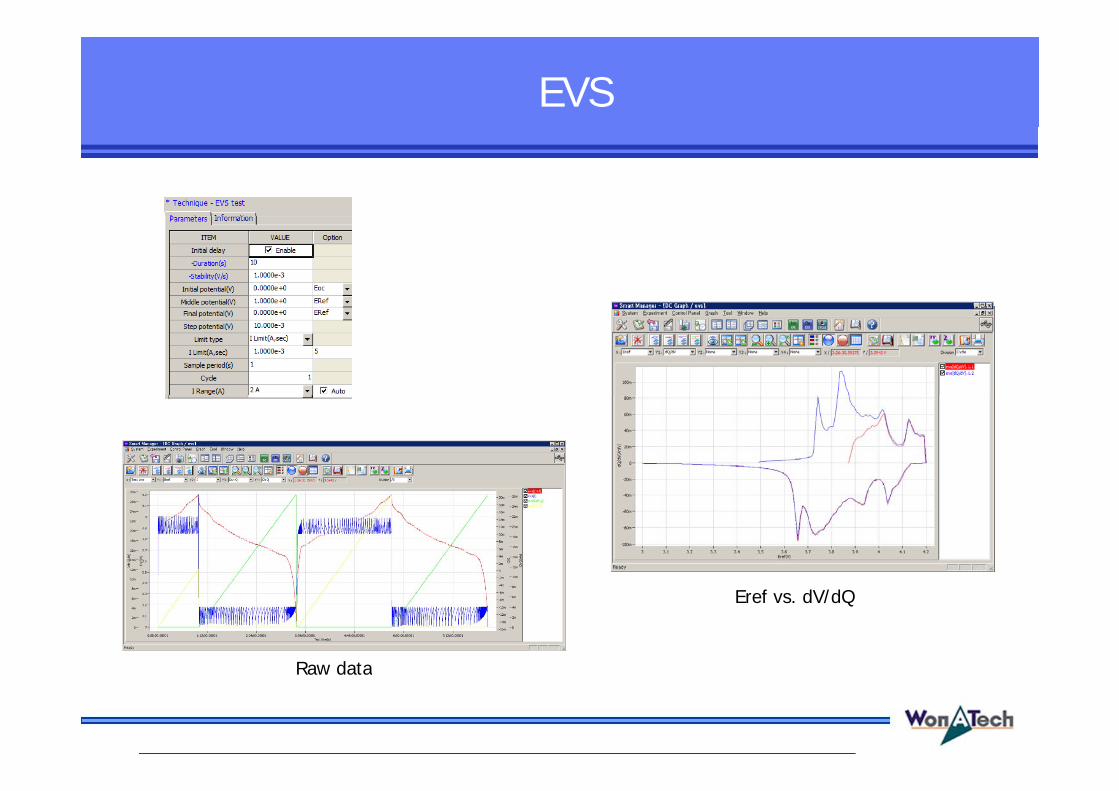
EVS
Raw data
Eref vs. dV/dQ
Raw data

GITT/PITT
• GITT • PITT• GITT PITT
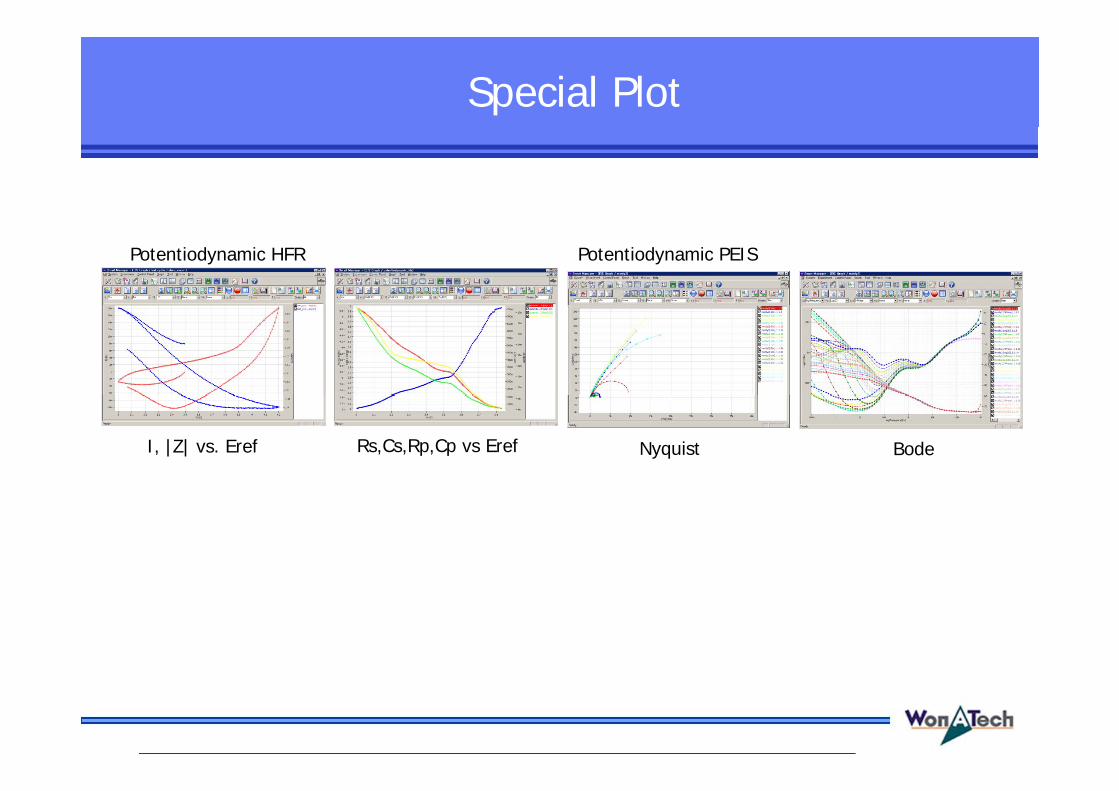
Special Plot
Potentiodynamic PEISPotentiodynamic HFR
I, |Z| vs. Eref Rs,Cs,Rp,Cp vs Eref Nyquist Bode

Report/Data Editing
DC data report EIS data report
Filtering
Data deleteEditing
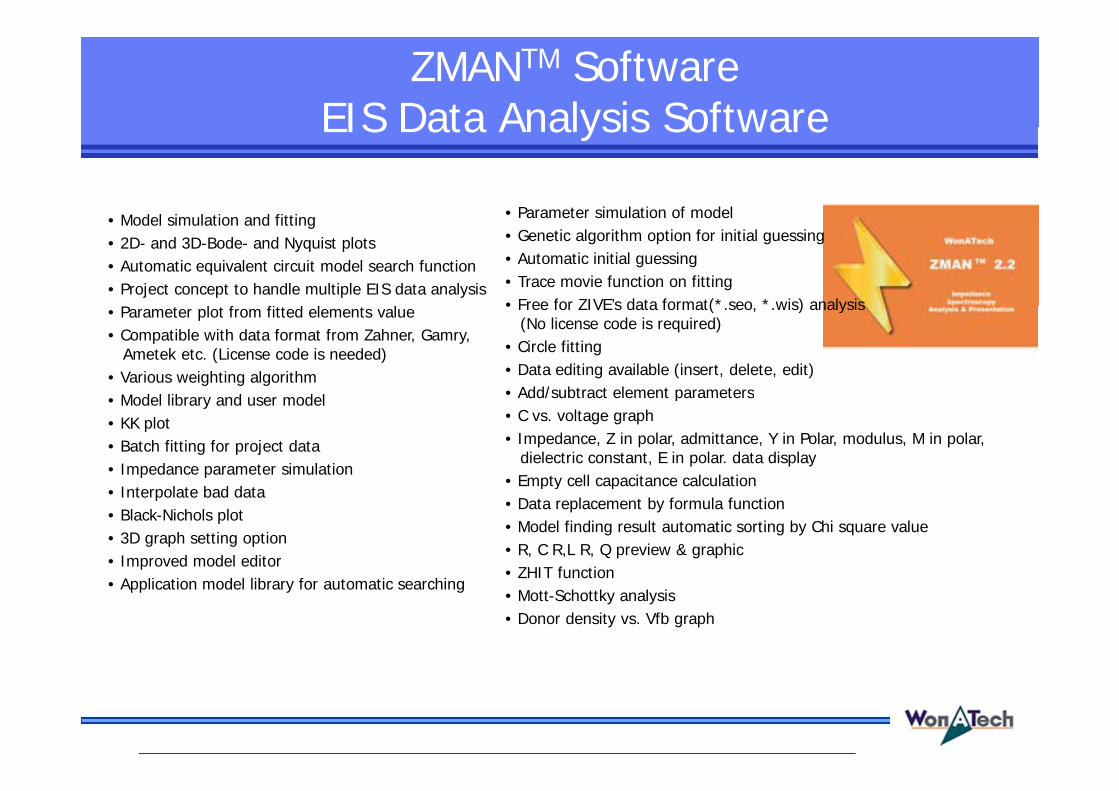
ZMANTM SoftwareEIS Data Analysis SoftwareEIS Data Analysis Software
M d l i l ti d fitti • Parameter simulation of model• Model simulation and fitting• 2D- and 3D-Bode- and Nyquist plots • Automatic equivalent circuit model search function• Project concept to handle multiple EIS data analysis
l f fi d l l
Parameter simulation of model• Genetic algorithm option for initial guessing• Automatic initial guessing• Trace movie function on fitting• Free for ZIVE’s data format(* seo * wis) analysis• Parameter plot from fitted elements value
• Compatible with data format from Zahner, Gamry, Ametek etc. (License code is needed)
• Various weighting algorithmM d l lib d d l
• Free for ZIVE s data format( .seo, .wis) analysis (No license code is required)
• Circle fitting• Data editing available (insert, delete, edit)• Add/subtract element parameters• Model library and user model
• KK plot• Batch fitting for project data• Impedance parameter simulation
Add/subtract element parameters• C vs. voltage graph • Impedance, Z in polar, admittance, Y in Polar, modulus, M in polar,
dielectric constant, E in polar. data display• Empty cell capacitance calculation
• Interpolate bad data• Black-Nichols plot• 3D graph setting option• Improved model editor
Empty cell capacitance calculation• Data replacement by formula function • Model finding result automatic sorting by Chi square value• R, C R,L R, Q preview & graphic• ZHIT function
• Application model library for automatic searching• ZHIT function • Mott-Schottky analysis• Donor density vs. Vfb graph

ZMANTM SoftwareEIS Data Analysis SoftwareEIS Data Analysis Software
Project manager with Cursor data displayImporting 3rd parties3D Bode plot for series measurement
Parameter plotProject manager with data preview
Cursor data displayImporting 3rd partiesASCII data file
Fitting displayData replacement byformula function
Model editor & model library
Automatic model searching LEVM fitting Parameter simulation Element add/subtraction Finding data file menug

ZMANTM SoftwareEIS Data Analysis SoftwareEIS Data Analysis Software
Circular fitting 2D Nyquist plot Rp,Cp vs frequency (R|C) Empty cell capacitance2D Bode plot
KK consistencyDonor density vs. Vfb graphd l i
Mott-Schottky analysis windowand analysis
C/R-V graph

IVMANTM SoftwareDC Data Analysis SoftwareDC Data Analysis Software
IVMANTM ft k i t fIVMANTM software package consists of• IVMAN software• IVMAN utilities- IVMAN differential analysis software- IVMAN photo voltaic cell analysisIVMAN photo voltaic cell analysis- IVMAN Tafel analysis- IVMAN extractor- IVMAN peak find module
IVMANTM Mail Software • Electrochemical analysis software• Ideal for DC corrosion data analysis and
Polarization resistance fitting Polarization analysis result
yelectro-analytical data analysis
• Initial guessing function on Tafel analysis• Automatic Tafel fitting• Polarization resistance fittingo a a o a g• 3D graph• Find peak function• Interpolation, differentiation, integration etc.• Reporting function
Time graph Find peak menu
Reporting function

IVMANTM SoftwareDC Data Analysis SoftwareDC Data Analysis Software
CV graph 3D graph Edit data menu
Universal graph

IVMANTM SoftwareDC Data Analysis SoftwareDC Data Analysis Software
IVMAN DA™ Battery Test Data Analysis Software• Battery test data analysisy y• Electrochemical voltage spectroscopy (dQ/dV vs. V)• Voltage vs. capacity analysis (V vs. Q)• Cycle graph (Q vs. cycle)• Differential voltage graph(dV/dQ vs. Q) Differential voltage graph(dV/dQ vs. Q)
V vs. Q Cycle graphMeasured data
dV/dQ vs. QExport ASCII file
dQ/dV vs. V
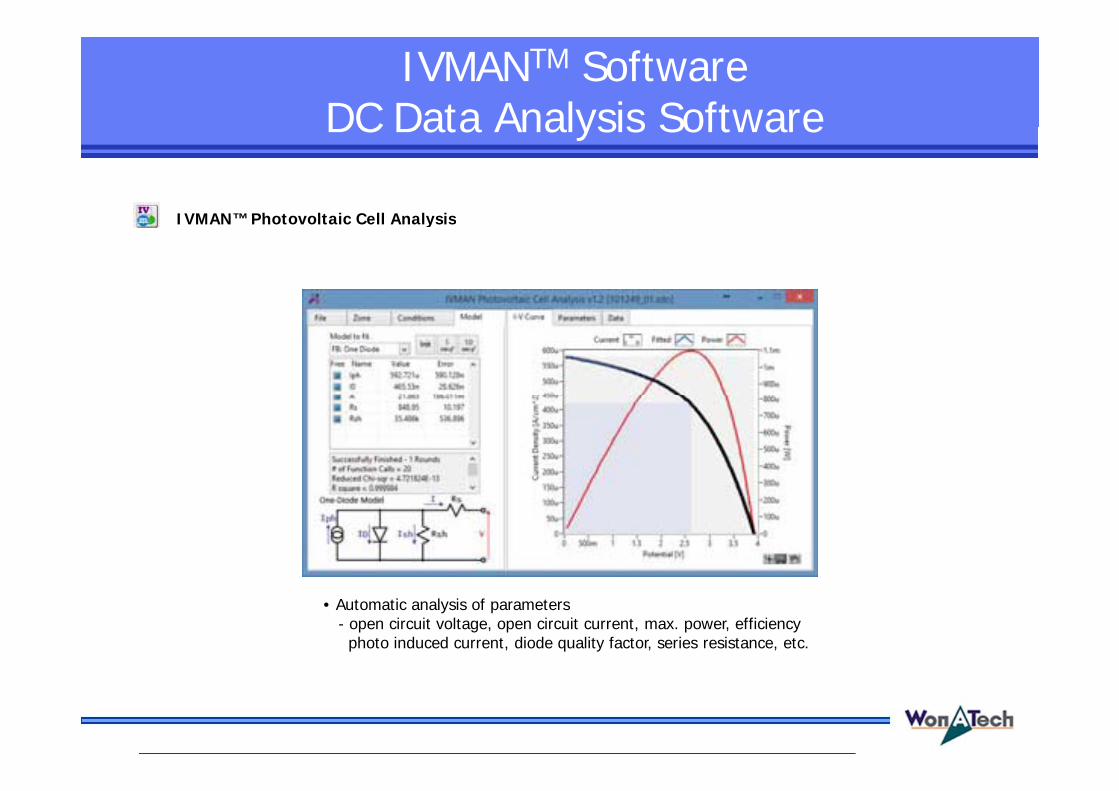
IVMANTM SoftwareDC Data Analysis SoftwareDC Data Analysis Software
IVMAN™ Photovoltaic Cell Analysis• IVMAN™ Photovoltaic Cell Analysis
• Automatic analysis of parameters- open circuit voltage, open circuit current, max. power, efficiencyphoto induced current, diode quality factor, series resistance, etc.
IVMANTM SoftwareDC Data Analysis SoftwareDC Data Analysis Software
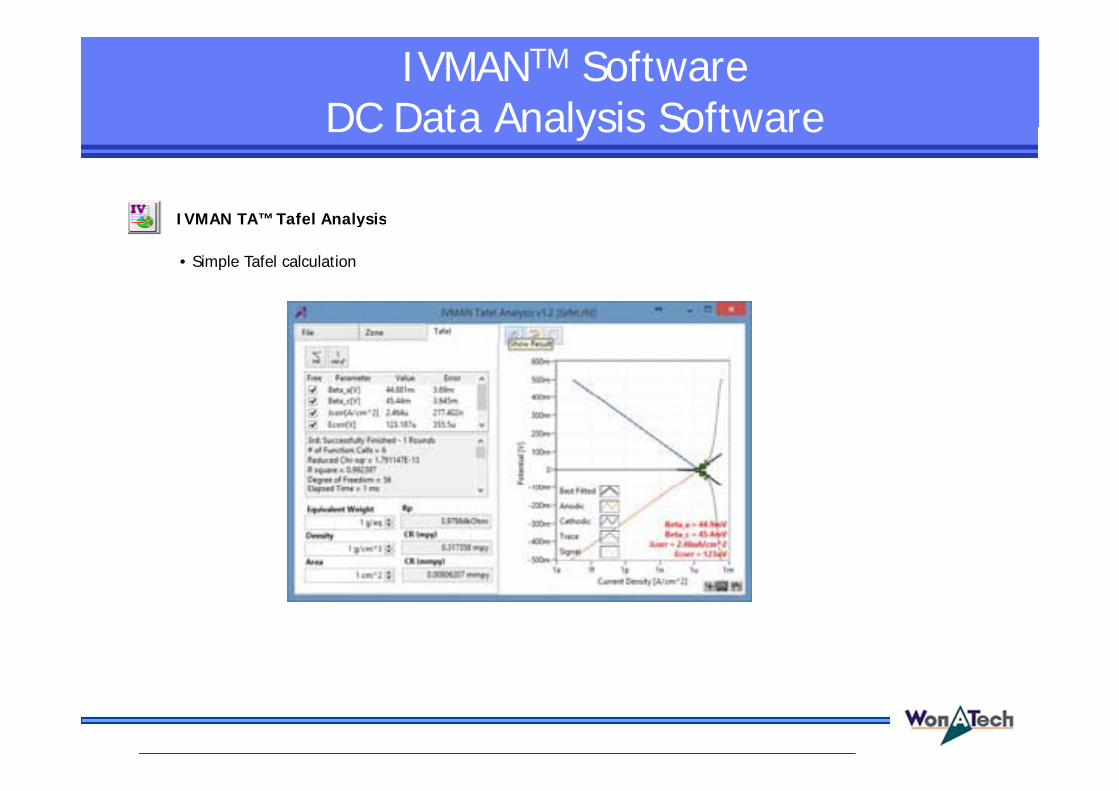
IVMAN TA™ Tafel Analysis• IVMAN TA™ Tafel Analysis
• Simple Tafel calculation

IVMANTM SoftwareDC Data Analysis SoftwareDC Data Analysis Software
Extractor• Extracting data by cycle number or step
• Exporting ASCII file
Peak Find Module• Independent peak finding software
Export ASCII file

Applicable FieldMarket For the ProductMarket For the Product
Other Application- Coating evaluation- Heavy metal detection- Semiconductor- EDLC- Membrane- Bioelectrochemistry- Material testing etc.g


Thank o !Thank you !