with assembly of an immature immunological synapse
TRANSCRIPT
doi:10.1182/blood-2005-03-0996 Prepublished online Aug 11, 2005;
Jonathan Lamb, Giovanna Lombardi, Margaret J Dallman and Daniel M Davis Leo M Carlin, Kumiko Yanagi, Adrienne Verhoef, Esther N Nolte-'t Hoen, John Yates, Leanne Gardner,
with assembly of an immature immunological synapseSecretion of IFN-{gamma} and not IL-2 by anergic human T cells correlates
http://bloodjournal.hematologylibrary.org/misc/rights.dtl#repub_requestsInformation about reproducing this article in parts or in its entirety may be found online at:
http://bloodjournal.hematologylibrary.org/misc/rights.dtl#reprintsInformation about ordering reprints may be found online at:
http://bloodjournal.hematologylibrary.org/subscriptions/index.dtlInformation about subscriptions and ASH membership may be found online at:
. Hematology; all rights reservedCopyright 2007 by The American Society of DC 20036.by the American Society of Hematology, 1900 M St, NW, Suite 200, Washington Blood (print ISSN 0006-4971, online ISSN 1528-0020), is published semimonthly
For personal use only. by on October 19, 2010. www.bloodjournal.orgFrom
CARLIN et al The human anergic T cell immunological synapse
1
IMMUNOBIOLOGY
Secretion of IFN-γ and not IL-2 by anergic human T cells correlates
with assembly of an immature immunological synapse
Leo M. Carlin, Kumiko Yanagi, Adrienne Verhoef, Esther N.M. Nolte-‘t Hoen, John Yates, Leanne
Gardner, Jonathan Lamb, Giovanna Lombardi, Margaret J. Dallman, and Daniel M. Davis
From the Department of Biological Sciences, South Kensington Campus; the Department of Allergy
and Clinical Immunology, National Heart and Lung Institute; the Department of Immunology,
Hammersmith Campus, Imperial College London, UK; and Translational Medicine and Genetics,
Clinical Pharmacology and Discovery Medicine, GlaxoSmithKline, Greenford, Middlesex, UK.
L.M.C., K.Y., A.V., E.N.M.N.H. and J.Y., contributed equally to this work.
M.J.D. and D.M.D. contributed equally to this work.
Reprints: Daniel M. Davis or Margaret J. Dallman, Division of Cell and Molecular Biology, Sir
Alexander Fleming Building, Imperial College, London, SW7 2AZ, UK. E-mail:
[email protected] or [email protected]
Supported by the BBSRC, the HFSP and MRC. JY holds an MRC Training Fellowship.
Manuscript Correspondence to Daniel M. Davis, Division of Cell and Molecular Biology, Sir
Alexander Fleming Building, Imperial College, London, SW7 2AZ, UK. Phone: +44-207-594-5420;
Fax: +44-207-594-3044; E-mail: [email protected]
Blood First Edition Paper, prepublished online August 11, 2005; DOI 10.1182/blood-2005-03-0996
Copyright © 2005 American Society of Hematology
For personal use only. by on October 19, 2010. www.bloodjournal.orgFrom
CARLIN et al The human anergic T cell immunological synapse
2
Abstract
We report differences in the supramolecular organization of the immunological synapse (IS) formed
by resting and anergic human T cells with agonist-peptide loaded antigen-presenting cells (APC). T
cells reactive to influenza A haemagglutinin peptide or Fel d 1 peptide 4 were rendered both anergic
and regulatory by incubation with high doses of agonist peptide in the absence of APC. At the IS
between resting T cells and peptide-loaded APC, both CD3ε and CD3ζ initially accumulate within a
ring or arc before redistributing within 30 min to single or multiple foci more central to the contact. In
contrast, at synapses formed by anergized T cells, CD3ε and CD3ζ remained organized within an arc
or ring and failed to redistribute centrally. However, intercellular communication between anergic
human T cells and agonist-peptide loaded APC was not a null event, since it triggered secretion of T
cell IFN-γ, but not for example IL-2. Thus, distinct organizations of CD3 at the T cell IS correlate with
different cytokine profiles; the mature IS formed by resting T cells correlates with their production of
both IFN-γ and IL-2 whereas the immature IS formed by anergic T cells seems able to facilitate IFN-γ
but not IL-2 production.
For personal use only. by on October 19, 2010. www.bloodjournal.orgFrom
CARLIN et al The human anergic T cell immunological synapse
3
Introduction
T cell anergy can be defined as a condition in which T cells following exposure to antigen (Ag) fail to
proliferate upon re-stimulation with the same specific antigen. Anergic T cells are thought to be one
of the mediators of peripheral tolerance either by directly suppressing other T cells via cytokines 1,2,
or by direct cell contact with either T cells or antigen presenting cells 3-5. Ag presentation in the
absence of appropriate co-stimulation 6-8, or Ag presentation from one MHC class II-expressing T cell
to another 9-12, can produce this non-proliferative phenotype. Unlike human T cells, mouse T cells do
not express class II MHC protein, though it is possible that they can still be rendered anergic by T–T
Ag presentation through the use of class II MHC protein acquired from neighboring cells 12. T cell
anergy can also be induced by treatment with ionomycin, triggering sustained calcium and
calcinuerin signaling 13. Functional responses of anergic T cells re-challenged with antigen and
APCs vary with the method of anergy induction, but could be broadly characterized as anti-
proliferative 1.
At the contact between T cells and APC or the immunological synapse (IS), molecules segregate into
micrometer-scale domains, i.e. supramolecular activation clusters 14-16. Initially at the immature CD4
T cell IS, LFA-1/ICAM-1 concentrate at the central region of the IS, while TCR/MHC accumulate in
the periphery. This pattern may then invert such that TCR/MHC moves into the center of the mature
T cell IS 15,17. Functions for the supramolecular organization at the IS can include enhancing or
terminating T cell signaling or facilitating intercellular secretion 18. In ionomycin-induced anergic
mouse T cells, MHC protein accumulates briefly in the center of the T cell – APC interface, but the IS
is quickly disrupted and never becomes a stable mature T cell IS 13. A subset of memory mouse T
cells may be anergic in phenotype and also showed deficiencies in synapse formation, for example,
being unable to recruit LAT to a T cell/APC interface 19. Here we set out to examine the organization
of the anergic human T cell IS and test for functional responses of anergic human T cells upon re-
challenge with Ag-loaded APC.
For personal use only. by on October 19, 2010. www.bloodjournal.orgFrom

CARLIN et al The human anergic T cell immunological synapse
4
Materials and Methods
Antibodies
Antibodies used were as follows (BD Pharmingen, Cowley, UK, unless noted otherwise): anti-human
CD3ζ (8D3), anti-human class I MHC (HC-10), FITC labeled anti-human CD3ε (UCHT1), FITC
labeled anti-human CD4 (RPA-T4), FITC labeled anti-human HLA-DR (G46-6), Alexa Fluor 633
labeled goat anti mouse IgG (Molecular Probes), Cy5 labeled goat anti-mouse IgG (Jackson Immuno
Research laboratories), Zenon mouse IgG Ab labeling kit Alexa Fluor 647 (Molecular Probes), PE-
Cy5 labeled anti-human CD4 (RPA-T4), FITC labeled anti-human IFN-γ (B27), PE labeled anti-
human IL-2 (MQ1-17H12), and control mAb FITC labeled mouse IgG1 (MOPC-21) and FITC and PE
labeled mouse IgG2a (G155-178).
T cell lines
T cell lines reactive to influenza virus A haemagglutinin residues 306-318 (PKYVKQNTLKLAT,
Advanced Biotechnology Center, London, UK), or Fel d 1 (the major allergen of cat, Felis
domesticus) peptide 4 (Fel d 1 p4; KALPVVLENARILKNCV, Advanced Biotechnology Center) under
HLA-DR1 restriction, were generated from peripheral blood mononuclear cells (PBMC) isolated from
a DRB1*010 positive individual as described previously 11,20. PBMC were plated at 106 per well of a
24-well plate in 1 ml of complete medium (RPMI 1640, Invitrogen; supplemented with 1% L-
glutamine, Invitrogen; and 5% human serum type AB, Sigma-Aldrich) with 2.5 µg/ml HA peptide or 10
µg/ml Fel d 1 p4 as appropriate. Ten days later T cells were re-stimulated with irradiated (3000 rad)
autologous PBMC with 0.5 µg/ml HA peptide or 1 µg/ml Fel d 1 p4 in complete medium with 10%
human T-Stim without PHA (a conditioned lectin-free medium containing IL-2; BD) or 10 ng/ml IL-2
(R&D systems, Abingdon, UK). Subsequently, T cells were stimulated weekly with irradiated PBMC
and peptide in complete medium with T-Stim or IL-2, followed by the addition of 5% T-Stim or 5 ng/ml
IL-2 3 days later. After three rounds of stimulation with peptide, T cell surface markers were
analyzed by flow cytometry and proliferation to peptide was tested.
For personal use only. by on October 19, 2010. www.bloodjournal.orgFrom
CARLIN et al The human anergic T cell immunological synapse
5
T cell clone
The HLA-DRB1*0701 restricted human T cell clone 7P.73, specific for influenza virus haemagglutinin
(HA) peptide HA306-318, has been described previously 21. Cells were cultured in medium as before
except that 10% human AB serum (Biowest, Ringmer, UK) was used. Cells were stimulated with the
B-lymphoblastoid cell line (B-LCL 9050), pre-pulsed overnight with 1µg/ml of HA306-318, irradiated
and then washed. IL-2 (Roche, Lewes, UK) was added at 5 iU/ml every 2-3 days with fresh medium,
and cells re-stimulated every 2 weeks. Before anergy induction by T-T cell presentation, residual
dead B-LCL and T cells were removed by density gradient centrifugation and washed. Viable cells
were rested for 3 days in fresh medium and 2 iU/ml IL-2, before washing. Experiments were carried
out 2 weeks after the last stimulation.
APC
The EBV-transformed human B cell line 721.221, that expresses HLA-DR1, was used as APC for the
T cell lines specific for HA and Fel d 1 p4, and B-LCL cells were used as APC for the T cell clone
7P.73. Where noted, a transfectant of 721.221 expressing enhanced YFP was used.
Anergy Induction
Anergy was induced by incubating 2 x 10⁶/ml resting T cells in the absence of APC with 10-25 µg/ml
HA or Fel d 1 peptide for 3 or 4 days in RPMI medium. After washing the T cells thoroughly, their
proliferative response to HA peptide (0.05-5.0 µg/ml), Fel d 1 p4 (0.1.or 1 µg/ml) or 10 % T-stim or
10iU/ml IL-2 was tested. All data shown are representative of at least three experiments on at least
two independently derived T cell lines.
T cell proliferation assays
Seven days after stimulation, 2.5 x 10⁴ resting T cells were tested for their proliferative response to
peptide (0.05-5.0 µg/ml), 10 % T-stim or 10 iU/ml IL-2. Irradiated (3000 rad), autologous or matched
PBMC (2.5 x 10⁴) were used as APC. Comparison of the response of the resting and anergized
7P.73 clone to peptide was carried out by stimulating 104 viable T cells with 3 x 10⁴ irradiated B-LCL,
pre-pulsed with a range of HA307-319 concentrations (0-10ug/ml). In the same assay, the response
For personal use only. by on October 19, 2010. www.bloodjournal.orgFrom

CARLIN et al The human anergic T cell immunological synapse
6
to 10 iU/ml IL-2 was also measured. 1 µCi/well [3H] TdR (ICN pharmaceuticals) was added to
cultures after 48 h and cells were harvested 16 h later.
T cell suppression assays
Fel d 1 p4-reactive T cells (2.5x10⁶/ml) were rendered anergic for 48 hours as described above. 0.25
x 106 irradiated (3000 rads) anergic T cells were washed, and co-incubated with 0.5x10⁶ CFSE-
labeled (0.5 µM) resting Fel d 1 p4-reactive T cells in 1 ml, and stimulated with 0.25x10⁶/ml irradiated
721.221 EBV-B cells as APC with or without 1 µg/ml Fel d 1 p4 for 7 days. As a control for a non-
specific inhibitory effect, irradiated resting Fel d 1 p4-reactive T cells were co-incubated with other
resting Fel d 1 p4-reactive T cells and stimulated in the same manner. In transwell experiments, T
cell cultures were set up as above, but irradiated anergic or resting T cells were separated from the
responder T cell population by a transwell membrane, with APC added to both compartments. After
one week of culture, dilution of CFSE in the live responder T cells was measured by flow-cytometry
to indicate proliferation. At least 10,000 events were acquired with CellQuest (BD Pharmingen) and
analyzed (Proliferation Wizard module, Modfit LT software,Verity Software House, USA). Proliferation
Index (PI) was used to express the extent of proliferation, defined as the sum of cells in all
generations divided by the number of parent cells present at the start of culture. A PI of 1 indicates
that no proliferation has occurred.
Intracellular cytokine staining
Anergic and resting Fel d 1 p4-specific T cells (0.5 x 10⁶ per well) were incubated with 721.221
antigen presenting cells (0.25 x 10⁶ per well) with or without 1 µg/ml Fel d 1 p4 for 5 h in the
presence of 10 µg/ml Brefeldin A for the detection of intracellular IFN-γ and IL-2. Cells were then
stained with PE-Cy5 labeled anti-human CD4 for 15 min. After washing, cells were fixed (Cellfix, BD
Biosciences, USA) and permeabilized (Perm/Wash buffer, Pharmingen, USA). Cells were then
labeled with FITC-labeled anti-human IFN-γ and PE-labeled anti-human IL-2 or isotype-matched
control mAb FITC-labeled mouse IgG1 and PE-labeled rat IgG2a. Once labeled, cells were analyzed
by flow cytometry (FACScalibur, BD) and percentages of cytokine-positive CD4+ T cells were
determined (CellQuest, BD).
For personal use only. by on October 19, 2010. www.bloodjournal.orgFrom
CARLIN et al The human anergic T cell immunological synapse
7
Measurement of supernatant cytokines
IFN-γ was measured by sandwich ELISA. Plates were coated with primary anti-IFN-γ mAb (clone 43-
11, ImmunoKontact, UK) and biotinylated secondary mAb (clone 45-15, ImmunoKontact) and
blocked with BSA using standard protocols. Plates were developed using streptavidin-peroxidase
followed by tetramethylbenzidine (Cambridge Biosciences, UK). The optical density at 450 nm was
determined (Tiertek Multiscan PLUS, UK). IL-2 was measured by bioassay using CTLL-2 cells.
Proliferation of CTLL-2 to supernatants was compared to proliferation to twelve 2-fold dilutions of a
10 iU/ml IL-2 standard, plated in triplicate in the same assay. Proliferation to supernatants was within
the dynamic range of the standard curve in all assays. Alternatively, supernatants were analyzed for
cytokine production by flow cytometry (Cytometric Bead Array kit, BD Biosciences, Cowley, UK)
according to the manufacturer's instructions. The lower limits of detection were 2.6 pg/ml for IL-2 and
IL-4, 3.0 pg/ml for IL-6, 2.8 pg/ml for IL-10 and 7.1 pg/ml for IFN-γ.
Conjugation assay
Viable T cells, unstained by Annexin V (Molecular probes), were selected by flow cytometric sorting.
Sorted cells were then loaded with 4 µM SNARF-1 (Molecular probes) and re-suspended in RPMI
medium at 5 x 10⁷/ml. HA peptide pulsed (5 µg/ml) or un-pulsed 221-EYFP cells were washed in
RPMI medium and re-suspended in RPMI medium at 5 x 10⁷/ml. An equal number of SNARF-1
loaded T cells and 221-EYFP cells were co-incubated at 37°C for 60 min and then conjugates were
fixed in 2% paraformaldehyde/PBS for 20 min at RT and analyzed by flow cytometry.
Imaging
APC were pulsed with 1-5 µg/ml peptide in complete medium for 6 h, washed and mixed in a 1:1
ratio with T cells that had been sorted to be negative for Annexin V. Cells were centrifuged at 800
rpm for ~ 20 s and then incubated at 37°C, 5% CO2 for the times indicated. Co-cultures were then
fixed and permeabilized (Cytofix/Cytoperm, BD) for 12 min at 4°C, blocked with 10% horse serum
and 3% BSA in buffer (Cytoperm/Cytowash, BD) for 45 min at 4°C, washed in PBS containing 0.1%
Tween 20 (Sigma-Aldrich; PBS-T) and then incubated with anti-CD3 mAb in the blocking buffer for
60-90 min at 4°C. After washing, cells were stained with goat anti-mouse Alexa Fluor 488 in blocking
solution for 30-45 min at 4°C, washed, fixed and washed again. Samples were then stained with
For personal use only. by on October 19, 2010. www.bloodjournal.orgFrom
CARLIN et al The human anergic T cell immunological synapse
8
Zenon Alexa Fluor 647 labeled anti-class I MHC mAb for 45 min washed three times in PBS-T and
again fixed and washed. After washing again, cells were imaged using the 63X oil-immersion
objective of a laser scanning confocal microscope (TCS SP2, Leica). Stacks of optical sections were
acquired by scanning every 0.3 µm throughout each cell conjugate. The distribution of fluorescence
at the IS was classified by eye as being either: (1) homogeneous, i.e. an apparently equal
fluorescence intensity throughout the intercellular contact, (2) ring or arc shaped, i.e. approximately
>80% of fluorescence being located at the periphery of the intercellular contact, (3) multi- or single-
focal, i.e. with specific patches of increased intensity within the central region of the intercellular
contact.
For quantification, the mean fluorescence intensity and volume were measured within a mask at the
cell-cell contact (Volocity, Improvision). The mean fluorescence intensity of an area of the same
volume but away from the cell-cell contact on the T cell surface was also measured. The ratio of
fluorescence intensities at the IS and elsewhere on the cell gave the fold change in fluorescence at
the IS. The mean fluorescence and volume of the whole confocal stack was also measured, such
that the percentage of fluorescence at the interface was calculated as: (Volume at interface x Mean
fluorescence intensity at interface) / (Volume of stack x Mean fluorescence intensity of stack) x 100
Statistical evaluation.
Differences in synapse patterns between anergic and resting T cells were analyzed by multinomial
logistic regression analysis with fixed model design. A p-value of <0.05 was considered statistically
significant (SPSS, Version 12.0 for Windows, Chicago, IL, USA).
For personal use only. by on October 19, 2010. www.bloodjournal.orgFrom
CARLIN et al The human anergic T cell immunological synapse
9
Results
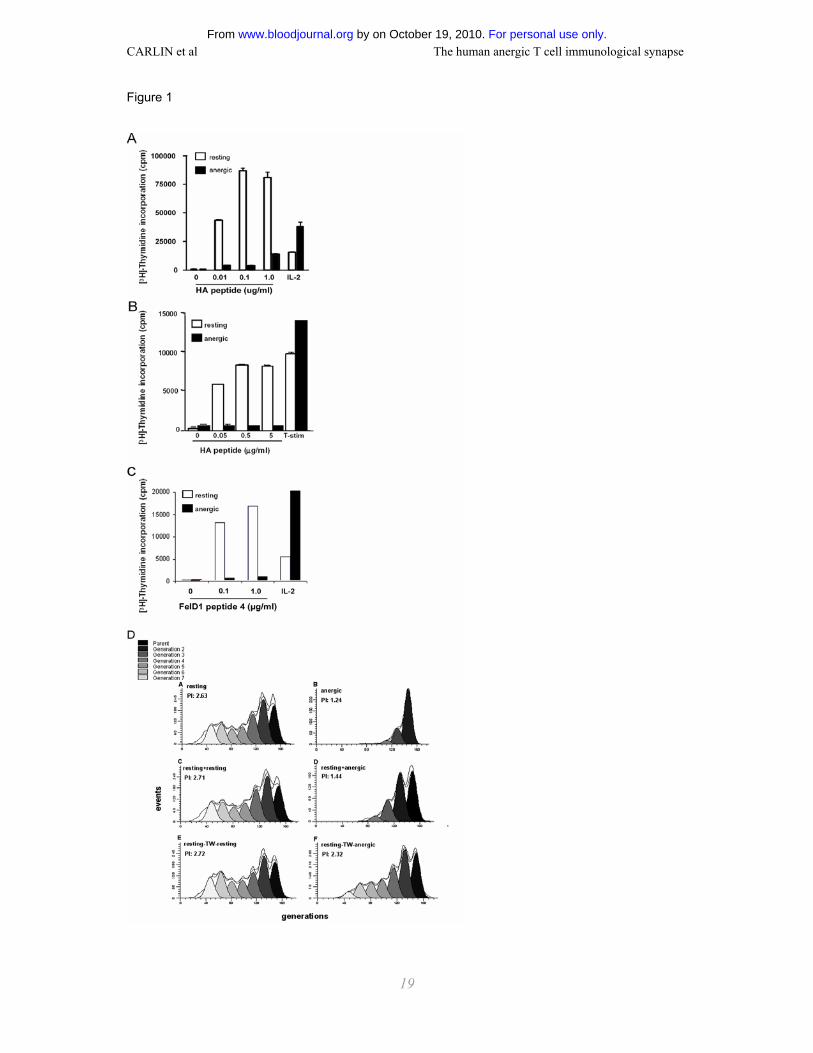
Phenotypic analysis of T cells
A T cell clone (7P.73) responsive to HA peptide (HA306-318; Fig. 1 A) and T cell lines responsive to
HA peptide (HA308; Fig. 1B) and Fel d 1 peptide 4 (Fel d 1 p4; Fig. 1 C), proliferated in an antigen
dose-dependent fashion in the presence of irradiated PBMC or B-LCL 9050 (7P.73). Culturing these
T cells with high doses of agonist peptide in the absence of APC for 48-96 hr caused a subsequent
failure of these cells to proliferate when re-challenged with antigen-loaded APC (Fig. 1). However,
the T cells did proliferate when stimulated with IL-2 (Fig. 1 A and C) or the IL-2 containing
conditioned media T-Stim (Fig. 1 B), confirming that the cells remained viable. An irrelevant peptide
(HA306-318) for Fel d 1 p4 T cells did not trigger any proliferation (data not shown). Interestingly, Fel
d 1 p4 T cells incubated with peptide in the absence of APC were not only hyporesponsive, but could
also suppress proliferation of co-cultured Fel d 1 p4 T cells (Fig 1 D). When anergic and responder T
cell populations were separated by a transwell membrane, the suppressive effect was largely
abrogated. Thus, an anergic and suppressive phenotype can be induced in T cells by stimulation with
a high dose of peptide in the absence of APC.
Supramolecular organization of CD3 is different at the anergic and resting T cell IS
As the TCR is essential for Ag-specific proliferation, and the distribution of CD3 at the IS between
mouse T cells and APC is well characterized, we set out to compare the distribution of CD3 at the IS
formed by resting and anergic human T cells. Laser scanning confocal microscopy was performed on
mAb-labeled T cell – APC conjugates fixed 30 min after co-culture. 3D reconstructions of these
images were produced to reveal the organization of CD3 at the ‘face’ of the IS.
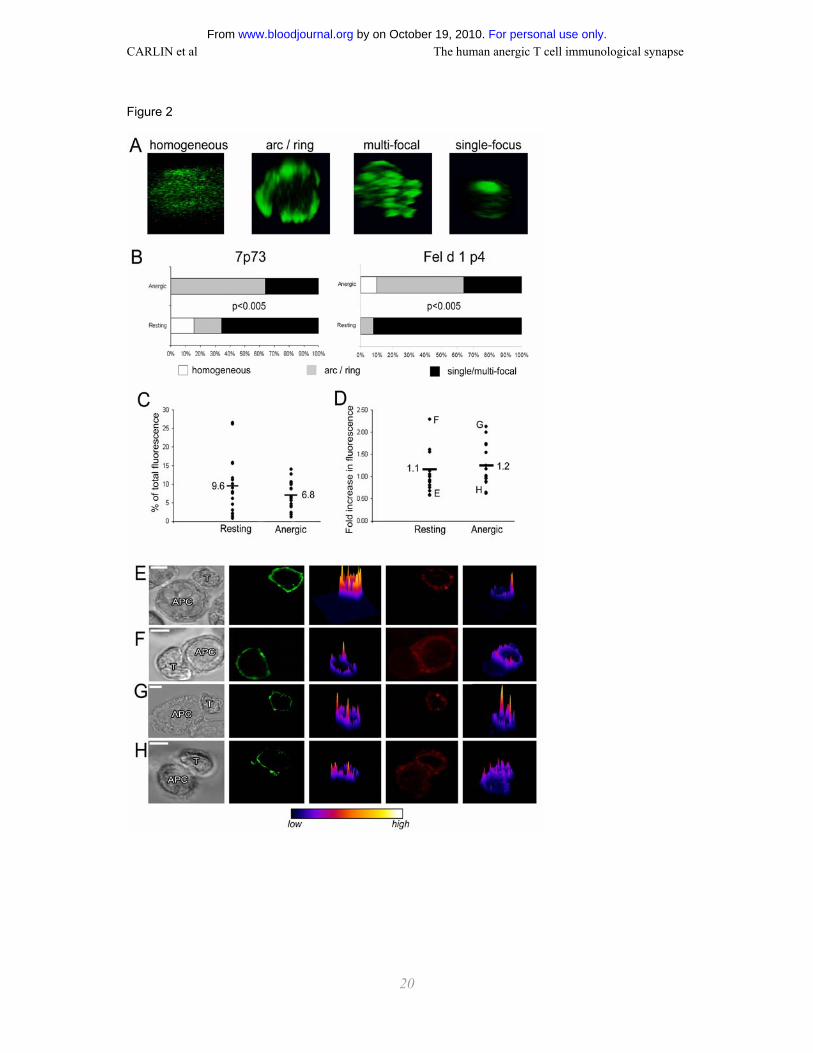
The distribution of CD3 at the IS of both anergic and resting T cells was classified as being either: (1)
homogeneous, (2) ring or arc shaped, (3) multi- or single-focal, examples of which are shown in Fig.
2 A. In both the T cell clone 7P.73 and the T cell line Fel d 1 p4 the majority of resting T cells
organized CD3ε in multiple or single foci (~90% 7P.73, ~70% Fel d 1 p4; Fig. 2 A and B) at the IS
formed with Ag-loaded APC. At the same time after co-incubation of T cells and APC, 50-60% of
anergic T cells derived from both the clone and line, organized CD3ε in ring or arc structures. If APC
For personal use only. by on October 19, 2010. www.bloodjournal.orgFrom

CARLIN et al The human anergic T cell immunological synapse
10
were pre-pulsed with a ten times higher peptide concentration, the percentage of anergic T cell
synapses with a more central accumulation of CD3 increased, but still not to the level of resting T
cells (data not shown).
Quantification of CD3 at the resting and anergic T cell IS
T cell – APC conjugates were imaged by confocal microscopy and the fluorescence images analyzed
to determine the amount of CD3 at the IS as a percentage of the total CD3 on the T cell (Fig. 2 C).
Additionally, the fold change in the amount of CD3 at the IS compared to elsewhere on the T cell
surface was also calculated (Fig. 2 D). The actual percentage accumulated at the IS is variable
between individual conjugates, ranging from <5%-25% (Fig. 2 C). The fold change in CD3 over a
similar sized area on the T cell membrane away from the IS is also variable, ranging from ~0.5 fold to
~2.5 fold (Fig. 2 D). However, despite clear differences in the organization of CD3 at the resting and
anergic T cell IS, no significant difference was found in the amount of CD3 at the IS for resting or
anergic T cells.
To investigate non-specific accumulation of membrane at the contact as a possible cause for the
organization of CD3 observed at the IS, class I MHC protein expressed by T cells (unlikely to be
ligated at the CD4 T cell – APC IS) was imaged at the same time as CD3. Although there is some
overlap where class I MHC protein and CD3 are seen to accumulate at the IS, at 80% of synapses
(n=49) CD3 and class I MHC are seen to cluster independently (data not shown). Additionally, the
relative amount of class I MHC protein clustered was rarely as much as CD3, as can be seen in
examples of synapses with minimal or maximum clustering of CD3 (Fig. 2 E-H). Thus, the dominant
cause of the organization of CD3 seen at the IS is protein-specific interactions rather than membrane
accumulation.
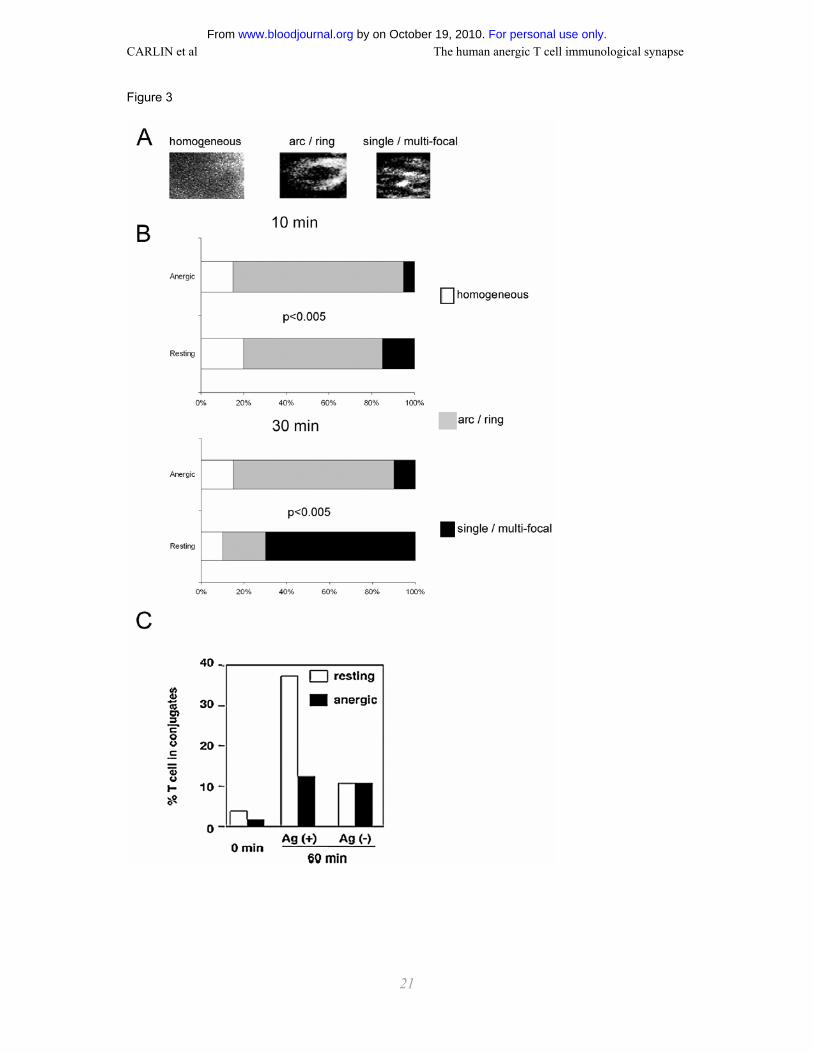
Dynamics of CD3 organization at the resting and anergic T cell IS
CD3 organization at resting and anergic T cell IS was compared after different times of co-incubation
of T cells with the Ag-loaded APC. Cells were fixed 10 or 30 min after co-incubation and the
organization of CD3ζ at the face of the IS was assessed as before. After 10 min of co-incubation,
CD3ζ is organized in ring or arc structures at 70-80% of synapses involving either resting or anergic
For personal use only. by on October 19, 2010. www.bloodjournal.orgFrom
CARLIN et al The human anergic T cell immunological synapse
11
T cells (Fig. 3 B). However, 30 min after cell mixing, ~70% of resting T cell synapses organize CD3ζ
in single/multi-foci, whereas anergic T cells organize CD3ζ in single/multi-foci only ~10% of the time.
Single- or multi-focal distributions of CD3 were usually seen central to the intercellular contact. Thus,
the change in organization witnessed at the resting T cell IS broadly resembles the inversion seen at
maturing murine T cell IS 15,17, and it seems that anergic T cells fail to undergo this inversion.
Demonstrating the generality of this result, this difference in synapse organization was seen for both
CD3ε and CD3ζ in two different anergic T cell lines and an anergic T cell clone (Fig. 2 and 3).
Anergic T cells form fewer conjugates with Ag-loaded APC than resting T cells
The ability of anergic T cells to conjugate with Ag-loaded APC was tested by flow cytometry.
Fluorophore-labeled HA308 T cells were mixed with YFP-expressing APC with or without agonist
peptide, and the percentage of resting and anergic HA308 T cells in T cell – APC conjugates was
measured (Fig. 3 C). 60 min after cell mixing, almost 40% of the resting T cells are in conjugates. In
contrast, about 12% of anergic T cells are in conjugate, similar to the percent of T cells in conjugate
with APC in the absence of agonist peptide.
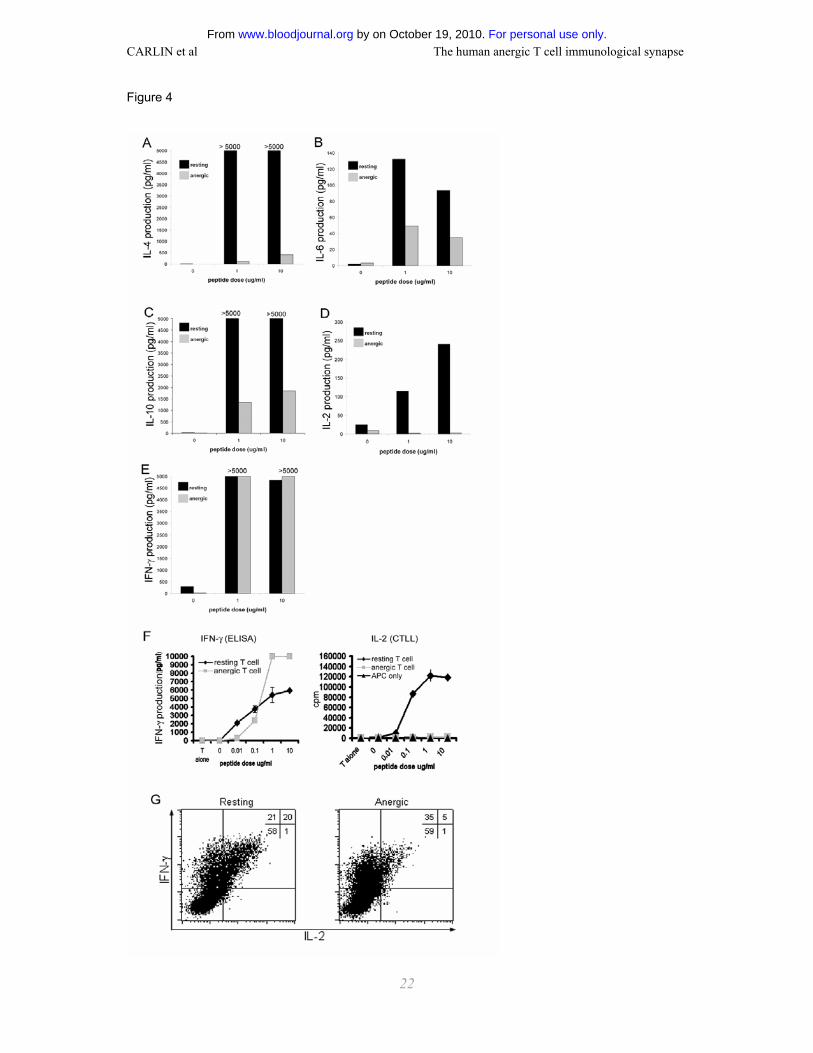
Cytokine production by resting and anergic T cells after contact with Ag-loaded APC
Since the anergic T cells were found to form fewer stable conjugates, do not organize CD3 into
single or multiple foci at the IS, and do not proliferate upon TCR stimulation, we next questioned
whether or not the anergic T cell IS triggers cytokine production. Although the production of IL-2, -4, -
6, and -10 was largely abrogated in anergic T cells, IFN-γ could be detected in supernatants of
anergic T cell/Ag-loaded APC co-cultures (Fig. 4 A-G) at a similar level to that produced by resting T
cells. Analogous data were obtained with T cells of different antigen specificity (Fig 4 F) confirming
the generality of this result. Furthermore, intracellular cytokine staining confirmed that, after co-
incubation with Ag-loaded APC, resting T cells produced IL-2 and IFN-γ whereas anergic T cells did
not produce IL-2 22, but could produce IFN-γ (Fig. 4G). Thus, intercellular communication between
anergic T cells and Ag-loaded APC is not a null event and leads to preferential IFN-γ secretion.
For personal use only. by on October 19, 2010. www.bloodjournal.orgFrom

CARLIN et al The human anergic T cell immunological synapse
12
Discussion
Human T cells rendered anergic by high doses of agonist peptide in the absence of APC (Fig. 1)
were used to compare the organization of anergic and ‘normal’ T cell synapses. We found that the
characteristic of anergic T cells to not proliferate in response to Ag-loaded APC cannot be due to a
difference in the amount of CD3 recruited to the IS (Fig. 2 C and D), but instead correlates with
distinct patterning of CD3 at the IS. Specifically, we found that at the majority of anergic T cell
synapses CD3ε and CD3ζ remained distributed within an arc or ring and failed to redistribute
centrally, as occurs in the ‘normal’ T cell synapse (Fig. 2 and 3). Thus, assembly of the anergic
human T cell synapse seems arrested at the stage of an ‘immature’ IS 15,17.
This is reminiscent of an inhibitory NK cell IS, where signaling from inhibitory Killer Ig-like Receptors
(KIR) dominates the intercellular communication leading to an ‘immature’ patterning of proteins at the
synapse 23-25. Signaling from KIR also leads to fewer conjugates formed with target cells 26 and
similarly, we report here that anergized human T cells formed fewer conjugates with Ag-loaded APC
than resting T cells (Fig. 3). Thus, for both T cells and NK cells, discrete stages in the assembly of
the IS can provide a framework for establishing different effector responses 18,27.
It is intriguing that we found that anergic human T cells produce IFN-γ after encountering Ag- loaded
APC, though as expected they fail to produce IL-2 (Fig. 4). There is evidence that IFN-γ production
can be associated with tolerance induction and, in some situations, can act as an anti-proliferative
agent in vivo 28. This is corroborated by recent data showing a unique role for IFN-γ production by
alloantigen-reactive regulatory T cells during tolerance induction 29. Therefore, the secretion of IFN-γ
by anergic human T cells may be important in the induction or maintenance of peripheral tolerance.
For personal use only. by on October 19, 2010. www.bloodjournal.orgFrom
CARLIN et al The human anergic T cell immunological synapse
13
Acknowledgements
We thank Catarina R. Almeida for critical comments on the manuscript, Aaron Rae for help in cell
sorting, and Fabiana Gordon (Statistical Advisory Service, Imperial College London) for help with
statistical analysis.
For personal use only. by on October 19, 2010. www.bloodjournal.orgFrom

CARLIN et al The human anergic T cell immunological synapse
14
References
1. Schwartz RH. T cell anergy. Annu Rev Immunol. 2003;21:305-334
2. Lombardi G, Hargreaves R, Sidhu S, Imami N, Lightstone L, Fuller-Espie S, Ritter M,
Robinson P, Tarnok A, Lechler R. Antigen presentation by T cells inhibits IL-2 production and
induces IL-4 release due to altered cognate signals. J Immunol. 1996;156:2769-2775
3. Taams LS, van Rensen AJ, Poelen MC, van Els CA, Besseling AC, Wagenaar JP, van
Eden W, Wauben MH. Anergic T cells actively suppress T cell responses via the antigen-presenting
cell. Eur J Immunol. 1998;28:2902-2912
4. Lombardi G, Sidhu S, Batchelor R, Lechler R. Anergic T cells as suppressor cells in vitro.
Science. 1994;264:1587-1589
5. Vendetti S, Chai JG, Dyson J, Simpson E, Lombardi G, Lechler R. Anergic T cells inhibit
the antigen-presenting function of dendritic cells. J Immunol. 2000;165:1175-1181
6. Gimmi CD, Freeman GJ, Gribben JG, Gray G, Nadler LM. Human T-cell clonal anergy is
induced by antigen presentation in the absence of B7 costimulation. Proc Natl Acad Sci U S A.
1993;90:6586-6590
7. Greenwald RJ, Boussiotis VA, Lorsbach RB, Abbas AK, Sharpe AH. CTLA-4 regulates
induction of anergy in vivo. Immunity. 2001;14:145-155
8. Marelli-Berg FM, Lechler RI. Antigen presentation by parenchymal cells: a route to
peripheral tolerance? Immunol Rev. 1999;172:297-314
9. Lamb JR, Feldmann M. Essential requirement for major histocompatibility complex
recognition in T-cell tolerance induction. Nature. 1984;308:72-74
10. Taams LS, van Eden W, Wauben MH. Antigen presentation by T cells versus
professional antigen-presenting cells (APC): differential consequences for T cell activation and
subsequent T cell-APC interactions. Eur J Immunol. 1999;29:1543-1550
11. Sidhu S, Deacock S, Bal V, Batchelor JR, Lombardi G, Lechler RI. Human T cells cannot
act as autonomous antigen-presenting cells, but induce tolerance in antigen-specific and alloreactive
responder cells. J Exp Med. 1992;176:875-880
12. Tsang JY, Chai JG, Lechler R. Antigen presentation by mouse CD4+ T cells involving
acquired MHC class II:peptide complexes: another mechanism to limit clonal expansion? Blood.
2003;101:2704-2710
For personal use only. by on October 19, 2010. www.bloodjournal.orgFrom
CARLIN et al The human anergic T cell immunological synapse
15
13. Heissmeyer V, Macian F, Im SH, Varma R, Feske S, Venuprasad K, Gu H, Liu YC,
Dustin ML, Rao A. Calcineurin imposes T cell unresponsiveness through targeted proteolysis of
signaling proteins. Nat Immunol. 2004;5:255-265
14. Monks CR, Freiberg BA, Kupfer H, Sciaky N, Kupfer A. Three-dimensional segregation
of supramolecular activation clusters in T cells. Nature. 1998;395:82-86
15. Grakoui A, Bromley SK, Sumen C, Davis MM, Shaw AS, Allen PM, Dustin ML. The
immunological synapse: a molecular machine controlling T cell activation. Science. 1999;285:221-
227
16. Bromley SK, Burack WR, Johnson KG, Somersalo K, Sims TN, Sumen C, Davis MM,
Shaw AS, Allen PM, Dustin ML. The immunological synapse. Annu Rev Immunol. 2001;19:375-396
17. Lee KH, Holdorf AD, Dustin ML, Chan AC, Allen PM, Shaw AS. T cell receptor signaling
precedes immunological synapse formation. Science. 2002;295:1539-1542
18. Davis DM, Dustin ML. What is the importance of the immunological synapse? Trends
Immunol. 2004;25:323-327
19. Eisenbraun MD, Tamir A, Miller RA. Altered composition of the immunological synapse
in an anergic, age-dependent memory T cell subset. J Immunol. 2000;164:6105-6112
20. Zanders ED, Lamb JR, Feldmann M, Green N, Beverley PC. Tolerance of T-cell clones
is associated with membrane antigen changes. Nature. 1983;303:625-627
21. Hargreaves RG, Borthwick NJ, Montani MS, Piccolella E, Carmichael P, Lechler RI,
Akbar AN, Lombardi G. Dissociation of T cell anergy from apoptosis by blockade of Fas/Apo-1
(CD95) signaling. J Immunol. 1997;158:3099-3107
22. Jenkins MK, Pardoll DM, Mizuguchi J, Chused TM, Schwartz RH. Molecular events in
the induction of a nonresponsive state in interleukin 2-producing helper T-lymphocyte clones. Proc
Natl Acad Sci U S A. 1987;84:5409-5413
23. Vyas YM, Mehta KM, Morgan M, Maniar H, Butros L, Jung S, Burkhardt JK, Dupont B.
Spatial organization of signal transduction molecules in the NK cell immune synapses during MHC
class I-regulated noncytolytic and cytolytic interactions. J Immunol. 2001;167:4358-4367
24. Davis DM, Chiu I, Fassett M, Cohen GB, Mandelboim O, Strominger JL. The human
natural killer cell immune synapse. Proc Natl Acad Sci U S A. 1999;96:15062-15067
For personal use only. by on October 19, 2010. www.bloodjournal.orgFrom
CARLIN et al The human anergic T cell immunological synapse
16
25. Carlin LM, Eleme K, McCann FE, Davis DM. Intercellular transfer and supramolecular
organization of human leukocyte antigen C at inhibitory natural killer cell immune synapses. J Exp
Med. 2001;194:1507-1517
26. Burshtyn DN, Shin J, Stebbins C, Long EO. Adhesion to target cells is disrupted by the
killer cell inhibitory receptor. Curr Biol. 2000;10:777-780
27. Davis DM. Assembly of the immunological synapse for T cells and NK cells. Trends
Immunol. 2002;23:356-363
28. Konieczny BT, Dai Z, Elwood ET, Saleem S, Linsley PS, Baddoura FK, Larsen CP,
Pearson TC, Lakkis FG. IFN-gamma is critical for long-term allograft survival induced by blocking the
CD28 and CD40 ligand T cell costimulation pathways. J Immunol. 1998;160:2059-2064
29. Sawitzki B, Kingsley CI, Oliveira V, Karim M, Herber M, Wood KJ. IFN-{gamma}
production by alloantigen-reactive regulatory T cells is important for their regulatory function in vivo. J
Exp Med. 2005;201:1925-1935
For personal use only. by on October 19, 2010. www.bloodjournal.orgFrom

CARLIN et al The human anergic T cell immunological synapse
17
Figure Legends
Figure 1. Functional phenotype of resting and anergic T cells. The proliferative response of
resting and anergic T cells to various doses of agonist peptide in the presence of irradiated
autologous PBMC was determined by [3H]-thymidine incorporation. The resting T cells proliferated in
a dose-dependent manner, whereas anergic T cells were hyporesponsive upon stimulation with
agonist-peptide/PBMC. However, both resting and anergic T cells proliferated upon stimulation with
IL-2 or T-Stim. The results are expressed as mean cpm for triplicate cultures and the data shown are
representative of at least three independent experiments. (A) T cell clone 7P.73, (B) T cell line HA
308, (C) T cell line Fel d 1 p4. (D) Irradiated anergic or resting Fel d 1 p4 T cells were co-incubated
with resting, CFSE-labeled responder Fel d 1 p4 T cells, in the presence of Ag-loaded APC for 7
days. Proliferation of responder T cells was measured by flow-cytometry. The two top panels show
the extent of proliferation of re-stimulated resting responder or anergic T cells alone, as controls.
The middle two panels show the proliferation of re-stimulated responder T cells in the presence of
irradiated resting or anergic T cells. The lower two panels depict data from transwell experiments, in
which irradiated anergic or irradiated resting T cells were separated from the responder T cell
population by a transwell membrane (TW). Both the irradiated cells and the responders were
incubated with Ag-loaded APC. The right-hand peaks represent the parental population and
generations of dividing cells are depicted leftwards along the x-axis. The results shown here are
representative of three independent experiments.
Figure 2. CD3 organization at the resting and anergic human T cell IS. (A) Organization of
CD3ε at the T cell – APC contact was categorized as follows: no clear polarization, ‘homogeneous’;
ring or arc shaped CD3 accumulation, ‘arc/ring’; multiple foci or a single focus of CD3 accumulation,
‘single/multi-focal’. Examples of these categories, which are representative for both resting and
anergic T cells, are given. (B) Charts show the percentage of each type of CD3 organization at
synapses between APC and resting or anergic 7P.73 T cells or Fel d 1 p4 T cells. P<0.005 for both
7P.73 and Fel d 1 p4, comparing the CD3 organization in resting versus anergic T cells. The amount
of CD3 at the T cell – APC contact was calculated as a percentage of total CD3 on the T cell (C), or
as a fold increase in comparison with an area away from the intercellular contact (D). Plots show
For personal use only. by on October 19, 2010. www.bloodjournal.orgFrom

CARLIN et al The human anergic T cell immunological synapse
18
measurements for individual conjugates as dots and the mean for resting and anergic 7P.73 T cell
synapses. (E-H) Representative conjugates are shown, which depict high or low levels of CD3
accumulation at the IS. The corresponding data points are marked on (D). (E) Fel d 1 p4 resting T
cell, (F) 7P.73 resting T cell, (G) Fel d 1 p4 anergic T cell, (H) 7P.73 anergic T cell– APC conjugates
were stained with a pan class I MHC mAb to control for non-specific membrane accumulation at the
IS. The images are from left to right: transmitted light; CD3ε; CD3ε intensity profile; class I MHC;
class I MHC intensity profile. The intensity profiles have been color coded according to the scale
given below the images. Scale bars represent 5 µm.
Figure 3. Assembly of the resting and anergic T cell IS after 10 and 30 min. (A) Organization of
CD3ζ at the HA308 T cell – APC contact was categorized as follows: no clear polarization,
‘homogeneous’; ring or arc shaped CD3 accumulation, ‘Ring/Arc’; and multiple foci or single focus of
CD3 accumulation, ‘Single/Multi-focal’. (B) Charts show the percent of resting T cell – APC or anergic
T cell – APC conjugates exhibiting each type of CD3ζ organization at the IS. Cells were fixed and
stained 10 or 30 min after co-incubation. Comparing CD3ζ organization at the IS formed by anergic
or resting T cells, p<0.005 for both 10 min and 30 min, even though at 30 min the difference in
distribution of patterns is more striking. (C) The percent of resting and anergic HA308 T cells
conjugated to APC was assessed by flow cytometry at 0 and 60 min after co-incubation with APC in
the presence or absence of agonist peptide.
Figure 4. Cytokine production by resting and anergic T cells upon challenge with Ag-loaded
APC. Production of (A) IL-4, (B) IL-6, (C) IL-10, (D) IL-2, and (E) IFN-γ by resting and anergic Fel d
1 p4 T cells as measured by Cytometric Bead Array. (F) Supernatant IFN-γ and IL-2 for resting and
anergic 7P.73 T cells incubated with Ag-loaded APC was assessed by ELISA and CTLL proliferation
respectively. (G) Intracellular cytokine staining for IFN-γ and IL-2 by resting and anergic T cells was
assessed by flow cytometry. Dot-plots and the percentage of cells in each quadrant for IL-2 and IFN-
γ staining of resting and anergic Fel d 1 p4 T cells after mixing with Ag-loaded APC are shown.
Unexpectedly, anergic cells produce IFN-γ upon re-challenge. All data are representative of at least
two independent experiments.
For personal use only. by on October 19, 2010. www.bloodjournal.orgFrom
CARLIN et al The human anergic T cell immunological synapse
19
Figure 1
For personal use only. by on October 19, 2010. www.bloodjournal.orgFrom
CARLIN et al The human anergic T cell immunological synapse
20
Figure 2
For personal use only. by on October 19, 2010. www.bloodjournal.orgFrom
CARLIN et al The human anergic T cell immunological synapse
21
Figure 3
For personal use only. by on October 19, 2010. www.bloodjournal.orgFrom
CARLIN et al The human anergic T cell immunological synapse
22
Figure 4
For personal use only. by on October 19, 2010. www.bloodjournal.orgFrom