wind to wave relationship reference...wind to wave relationship reference overview: this wind to...
TRANSCRIPT

Wind to Wave Relationship Reference Overview: This Wind to Wave Relationship Reference is a compilation of wind and wave data spanning the period from 2011 – 2013. The reference serves as a guide for several locations across the Chesapeake Bay and coastal waters. The reference is meant only as a guide providing boaters an idea of what sea/wave conditions to typically expect at given locations. Wind to wave relationships vary greatly with wind direction at each location due to fetch (the distance the winds travels across the water before reaching the buoy). Other local effects such as tides and currents will result in deviations from the guidance provided in this reference. The graphs display wave heights associated with varying sustained wind speeds for given directions. Inside the Chesapeake Bay, data sources for the relationships were developed from certain Chesapeake Bay Interpretive Buoy System (CBIBS) buoys while relationships for the coastal waters were developed using National Data Center Buoys (NDBC). The CBIBS buoys report both significant and maximum wave height every hour, while the coastal site buoys from NDBC only record significant wave height. Significant wave height is defined as the mean wave height (trough to crest) of the highest one third all waves over a given timeframe. The wave heights referenced within National Weather Service forecasts for the Bay and coastal waters are for significant wave heights. Maximum wave height represents the peak wave height recorded over a given timeframe. Keep in mind that NWS forecasts do not provide predictions of maximum wave height, although waves of this magnitude would likely be experienced by a boater at the given location though with a low frequency of occurrence. The graphs provided show hourly data points for significant wave heights (red crosshairs). The red line represents a best fit line for all of these observations. For maximum wave height, the individual data points are not plotted, but a best-fit curve (blue line) is shown. Please note that the max wave height best fit line does not represent the maximum wave ever recorded for a given wind speed. For the NDBC buoys, there is no “maximum wave height”, but a green line is plotted, showing the best fit for all significant wave heights when the dominant wave period less than 9 seconds (i.e. mainly wind wave).

How To Interpret Wind to Wave Relationships:
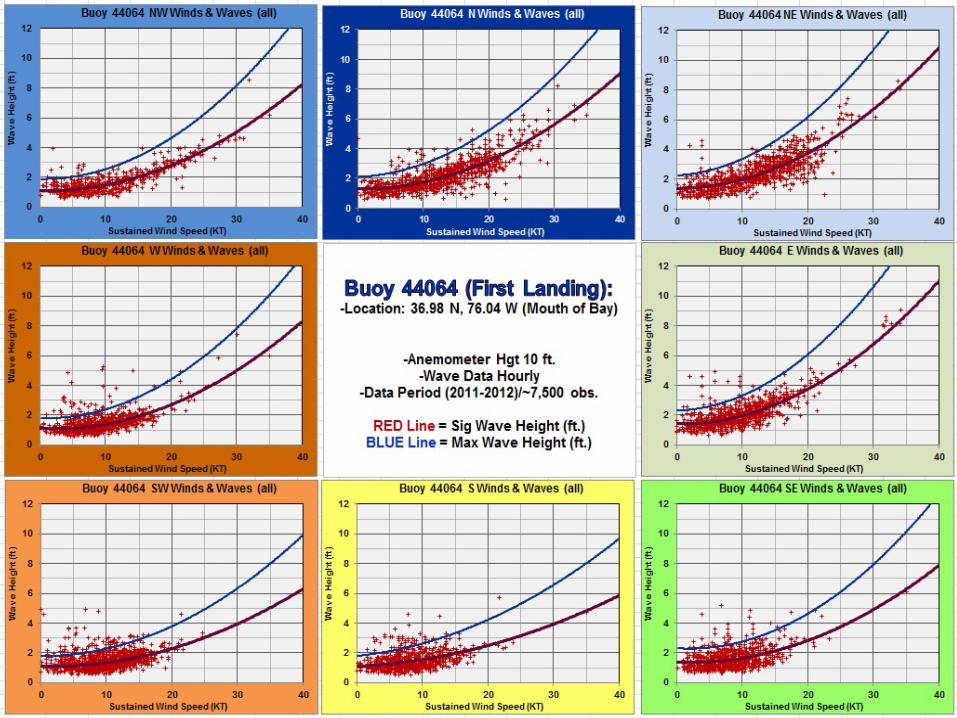
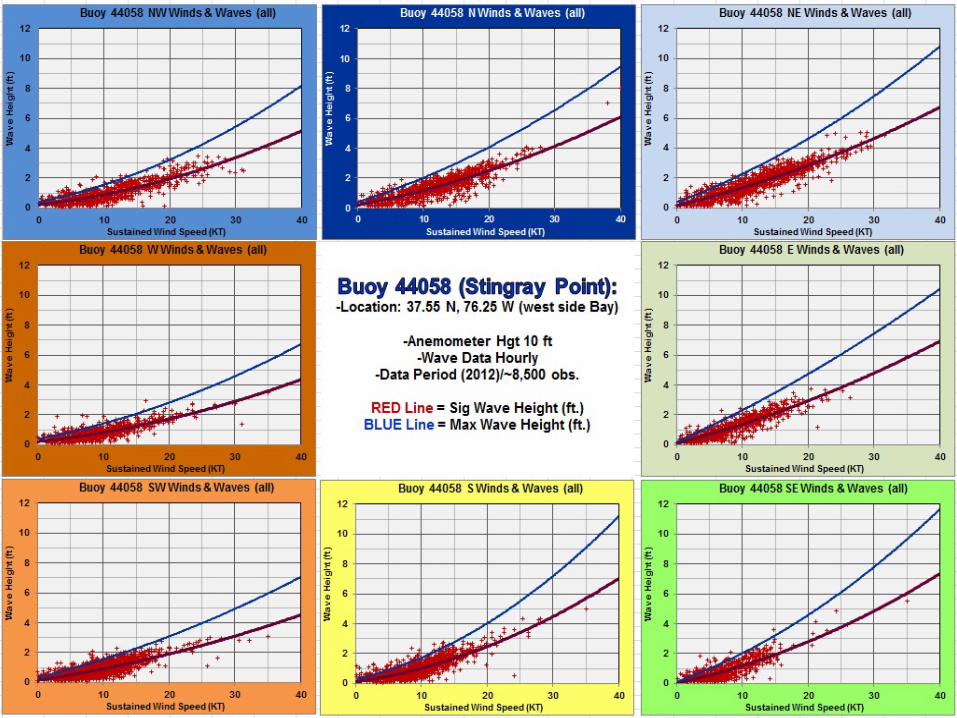
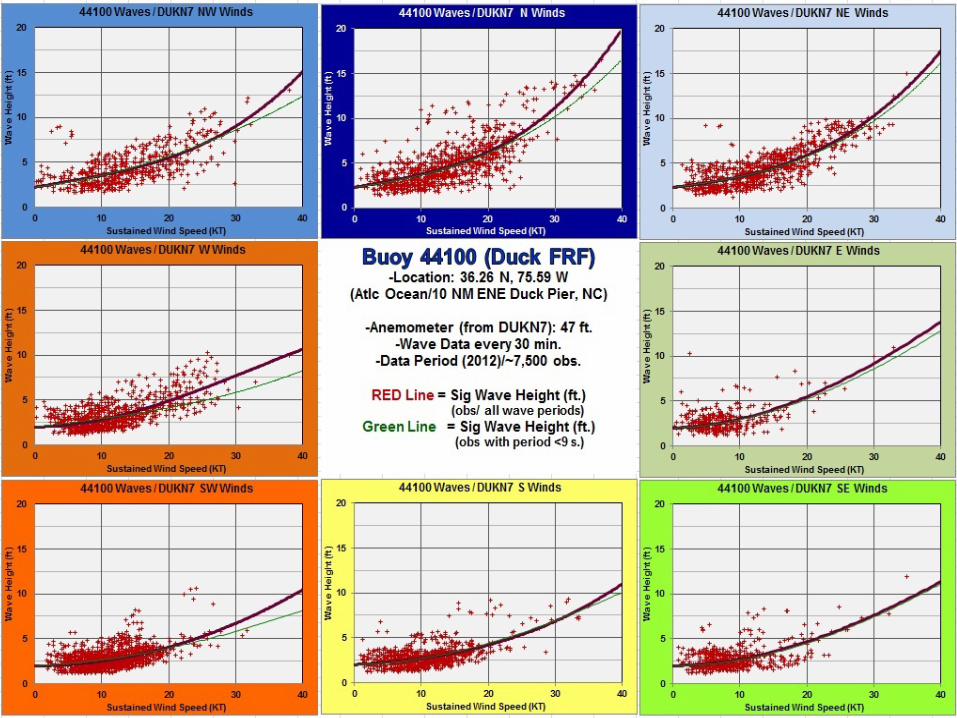
Each buoy reference (page) contains a series of 8 charts representing the different compass directions (N, NE, E, SE, S, SW, W and NW). The graphs show hourly data points for significant wave heights (red crosshairs). The red line represents a best fit line for all of these observations. For maximum wave height, the individual data points are not plotted, but a best-fit curve (blue line) is shown. (For NDBC buoys, there is no “maximum wave height”, but a green line is plotted, showing the best fit for all significant wave heights when the dominant wave period less than 9 seconds).
This graph represents significant and maximum wave heights experienced during a northeast (NE) wind (wind blowing from the northeast between 22.5 and 67.5 degrees) at the First Landing buoy in the mouth of the Chesapeake Bay. Based on the best fit lines, a sustained northeast wind of 25 kt produces a significant wave height of 5 ft with a maximum wave height of 8 ft.