wind power systems 475 wind power systems...wind energy industry could support up to 380,000 job...
TRANSCRIPT

WIND POWER SYSTEMS
HARVESTING THE WIND
Dr. Magdi Ragheb
University of Illinois at Urbana-Champaign,
216 Talbot Laboratory,
104 S. Wright Street,
Urbana, Illinois, 61801, USA
http://www.mragheb.com
O: (217)-333-6569
H: (217)-356-9193
Fax: (217)-333-2906
January 23, 2020
Copyright © 2005, by M. Ragheb. All rights reserved. Written in the United States of America. Reproduction or
translation beyond that permitted by Section 107 or 108 of the 1976 United States Copyright Act is unlawful. No
part of this publication may be reproduced, translated or distributed in any form or by any means, or stored in a data
base or retrieval system, without the prior express and written permission of the author.

PREFACE
“Everything on Earth belongs to princes, except the wind.”
Victor Hugo, French author
The fundamental aspects of the science and technology of Wind Power Systems are
covered from a cross-disciplinary perspective. It should be of interest to readers from the
different engineering and scientific disciplines, as well as members of the public with a
reasonable level of mathematical knowledge.
The Bureau of Labor Statistics (BLS) identifies wind turbines engineers and technicians
as the fastest growing profession in the nation. The Department of Energy estimates that the
wind energy industry could support up to 380,000 job opportunities by 2030. This is a significant
increase over the 88,000 jobs existing in 2016.
Two impediments to the growth of the wind energy industry are the need to develop extra
power transmission and energy storage systems for the generated power. In 2011, a Regional
Transmission Operator, MISO, representing 30 transmission owner members including 13 mid-
western states and parts of Canada approved a portfolio of projects designated as Multi-Value-
Projects (MVPs) to increase the transmission capacity and address its reliability issues.
Wind power made up 41 percent of the new USA electrical installed capacity of 14,468
MWe in 2015. They were primarily installed in the Midwest and Great Plains region which
boasts tremendous wind energy resources. These wind projects provide tax revenue and job
opportunities to the local communities and royalty payments to land owners.
Figure 1. Wind energy projected cumulative installed capacity. Source: AWEA.
In 2012, wind energy installed capacity reached 60 GigaWatts (GWs) and ranked first in
new electricity generation capacity for the first time in the USA at 43 percent of all new electric
additions with $25 billion in investments. About 13 GWs of new wind power capacity was added
to the USA electric grid, about double the capacity added in 2011. Wind power capacity powers
about 15 million homes in a year. Since 2000, the cumulative wind installed capacity has
increased 22-fold. About 72 percent of the wind turbine equipment installed in 2011 was
domestically manufactured, tripling from 25 percent in the period 2006-2007. Distributed wind
reached about 69,000 units across the 50 states.

It must be recognized that renewable energy technology is called upon to replace carbon
sources, yet it is still being developed supplying just about 3 percent of the current world energy
demand. Its expansion is facing constraints that need to be surmounted in research and
development, manufacturing, materials availability, design choices, and systems integration in
the electrical grid system and the labor force. Yet, the existing fossil fuel energy sources,
because of depletion and pollution, can only be considered as a bridge into a future where the
renewable sources predominate, with energy storage options being developed to overcome their
intermittent nature.
Figure 2. Top ten states in wind energy adoption. Source: USA Today.
Engineers and scientists have foregone fighting the proverbial battle of the last war, and
turned their attention into fighting the first battle of the next war. They face challenges of
economic growth in the USA and the developed world whose economies have substantially
slowed down. Other factors hurting the world economy include depleting resources, global
warming, failing infrastructures, ineffective educational systems, dearth of new jobs creation,
persistent unemployment, work force shrinkage, falling households incomes, dramatic reductions
in standards of living, pay cuts, pensions and savings hair-cuts, health care triage, massive banks
insolvency, monumental sovereign and private debt, large trade imbalances, budget deficits,
rampant austerity measures, and global and local income inequality. In effect a new form of
egregious serfdom and slavery is prevalent where the citizens of the debtor countries struggle to
make a living and become de-facto debt-slaves to their lenders.
Historically, salt and its control were at a certain time a major source of power because of
its ability to preserve food and consequently life. Roman legions soldiers were paid in salt,
hence the names “Salaire” in French and “Salary” in English. Electricity and refrigeration
replaced salt and its control and importance faded away. The control and importance of
petroleum as an energy source could similarly fade away as renewable energy in different forms
gradually replace it and relegate it to a lower level of importance.
The world is embarking on a third industrial revolution: the Low Carbon Age; with the
use of electricity replacing the use of hydrocarbons, and wind power is being reinvented to help
fill the need. It is recently blooming all over the world, particularly in the USA, the European
Community and China as an answer to the problems of fossil fuels depletion, greenhouse gases
emissions, global warming considerations and adherence to the Kyoto Treaty.
SUSTAINABILITY OF ELECTRICAL RESOURCES: THE ENERGY SMART GRID
For a sustainable electrical energy supply, the engineering and scientific consensus is the
need for the implementation of the "Smart Grid System" in both developed and emerging
economies. Using a Complex Systems description, its different components include an energy
mix at its nodes with interconnected exchanges:
1. Base power stations including nuclear, coal, hydroelectric and geothermal stations. These
supply continuous electric service to industries and basic infrastructures.
2. Renewable Energies. These include wind, solar thermal and photovoltaic, and essentially have
a zero cost of the energy supply but suffer from their nature as intermittent sources, except for
biomass.
3. To overcome the intermittency problems of the renewables, storage systems such as battery,
hydrogen and pumped storage, as well complementary sources such as natural gas turbines plants
are also needed.
4. Smart metering for consumers and industry would encourage conservation and the use of the
produced energy when it is readily available. In this case, they pay for the actual unsubsidized
price of energy which would encourage its production. To advance an analogy, consumers must
be encouraged by laws and regulations to catch the fish, use some of it for their own need, and
sell the surplus into the market place. This concept is implemented in Germany where farmers
use part of their pastures to produce photovoltaic electricity, use part of it on their farms, store
part of it, and sell the surplus to the electrical grid system. In Denmark, homeowners with small
tracts of lands produce wind power for their own use and the electrical utilities are obligated to
purchase their excess surplus production and feed it into the electrical grid.
5. Decentralized control of the smart grid system turning the grid system on and off depending
on the demand.

Figure 3. Smart grid configuration using the Energy Internet of Things “IoT” connecting
renewables and conventional energy sources to electricity consumers through decentralized
control of the power grid.
Renewable Energy
Sources Wind, solar thermal and
solar photovoltaic are
intermittent in nature.
Base Load Power
Stations Nuclear, hydroelectric,
coal and geothermal
power stations are not
very flexible in meeting
the varying energy
demand.
Energy Storage, Peak
Power Spinning Pumped storage, batteries,
flywheel, hydrogen and
stored reserves. Gas
turbine and thermal
stations provide peak
power needs.
Conservation, Smart
Metering
Private and Industrial
consumers are charged for
electricity based on: 1. Current available
supplies, 2. Current prices.
Energy Internet of Things “IoT” Smart
Electric Grid Configuration
Internet of Things “IoT”
Control Network of physical objects
that contain embedded
technology to communicate
and sense or interact with
their internal states or the
external environment.
Power stations are turned on
and off depending on the
supply and demand state of
the smart grid.
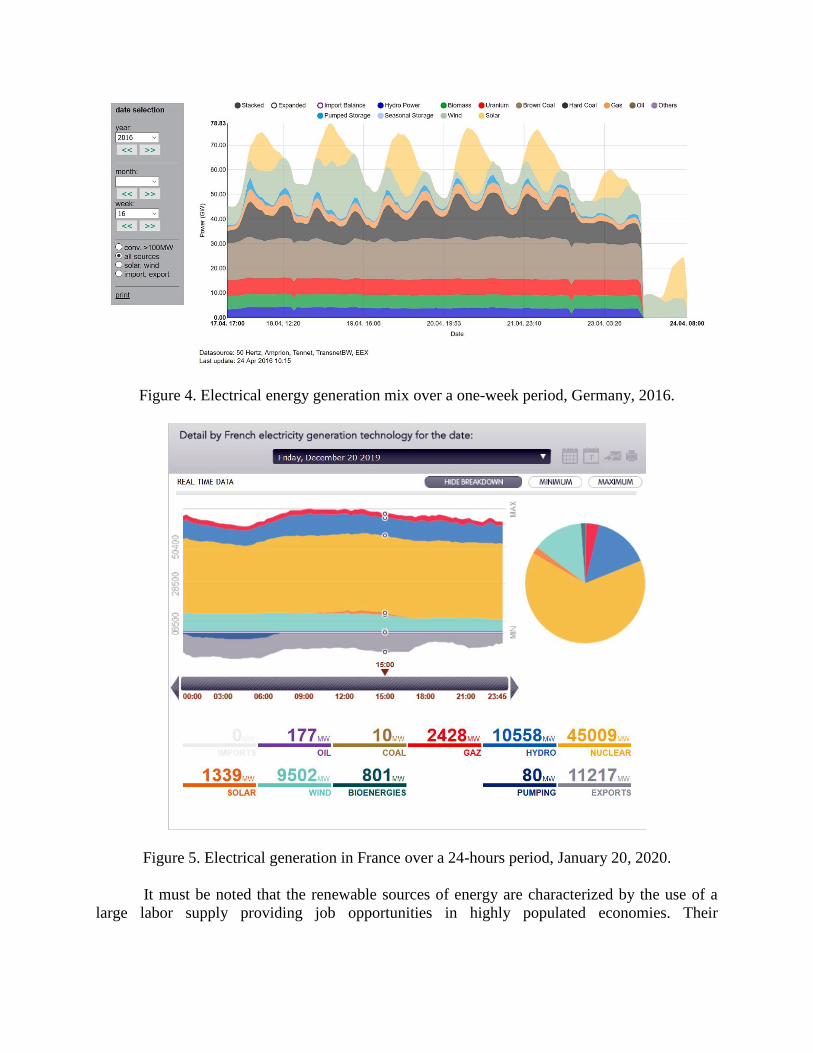
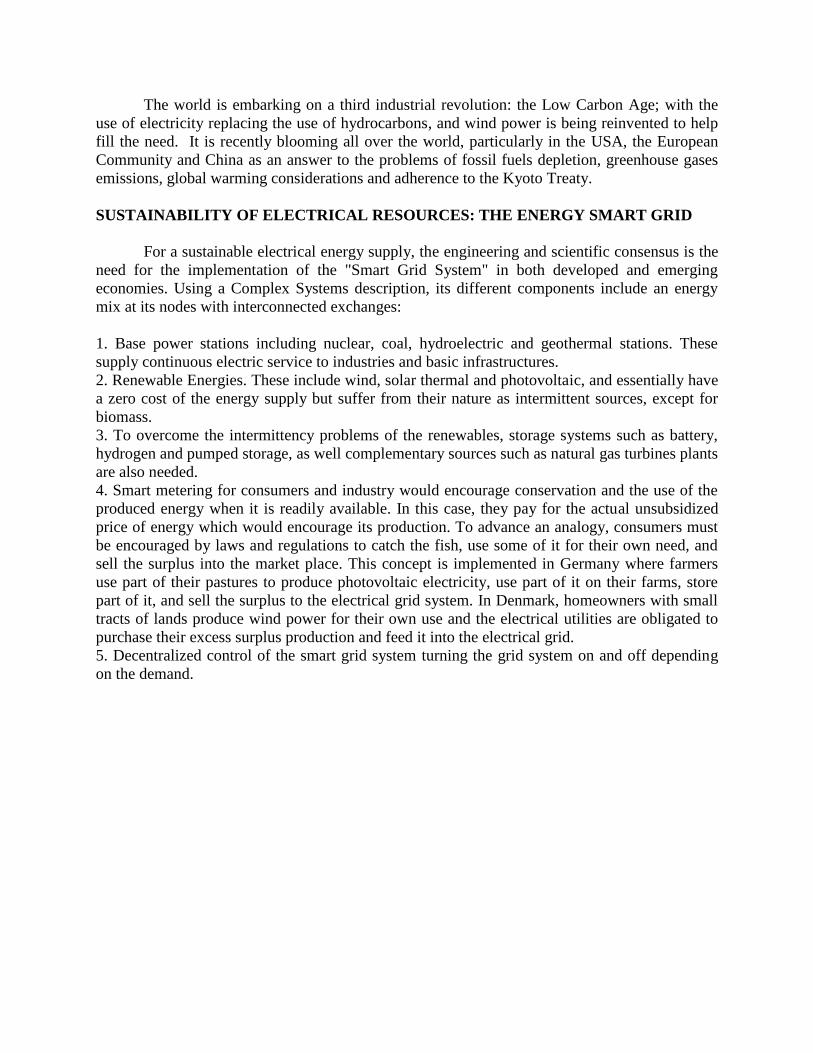
Figure 4. Electrical energy generation mix over a one-week period, Germany, 2016.
Figure 5. Electrical generation in France over a 24-hours period, January 20, 2020.
It must be noted that the renewable sources of energy are characterized by the use of a
large labor supply providing job opportunities in highly populated economies. Their

implementation is rapid: it takes about 2 years in the USA for the implementation and production
from wind parks since they only require local regulations, whereas nuclear power stations require
5-10 years or more because they are bound by federal bureaucratic regulations.
Figure 6. Symbiotic coupling of nuclear and wind technologies views during winter and
summer. The two-units 2,309 MWe Boiling Water Reactors, BWRs LaSalle nuclear power plant
near Marseilles, Illinois operated by Exelon Nuclear corporation and the Grand Ridge Wind
Farm operated by Invenergy LLC in the adjacent farmland near Ransom in Illinois, USA. The
nuclear reactor and the wind turbines are both manufactured by the General Electric (GE)
Company. The GE 1.5 MW SLE wind turbines have a hub height of 80 m and are net recipients
of electrical power from the grid on a standby basis, but then become net exporters of electricity
into the electrical grid under favorable wind conditions.
Figure 7. Total System Levelized Cost of Electricity for various methods of electricity
generation. Source: DOE-EIA.
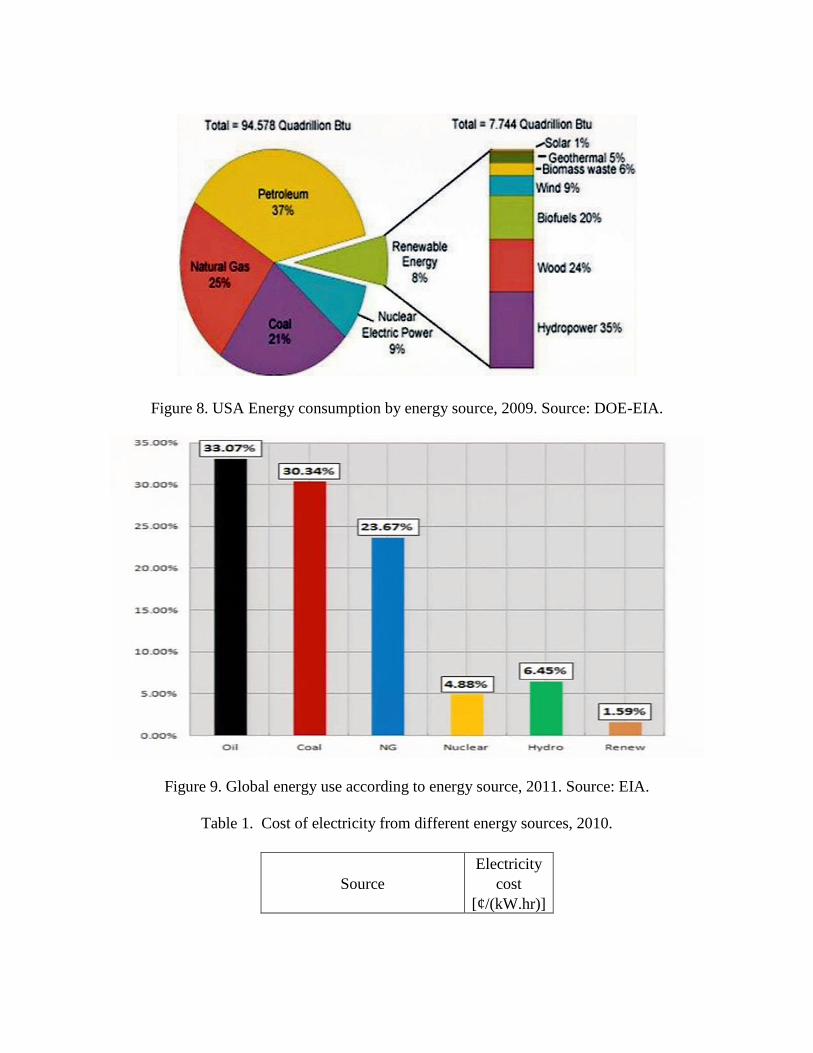
Figure 8. USA Energy consumption by energy source, 2009. Source: DOE-EIA.
Figure 9. Global energy use according to energy source, 2011. Source: EIA.
Table 1. Cost of electricity from different energy sources, 2010.
Source
Electricity
cost
[¢/(kW.hr)]

Hydroelectricity 4.6
Coal 6.6
Geothermal 6.7
Nuclear 6.7
Natural gas 6.9
Biomass 9.5
Wind 11.0
Solar 38.0
Table 2. Typical capacity factors of different energy sources, 2010.
Source
Capacity
factor
[percent]
Nuclear 91.1
Coal 72.2
Natural gas, combined cycle 40.7
Petroleum 9.2
Geothermal 90
Hydroelectric 37.2
Onshore wind 20-40
Offshore wind 40
Biomass 90
Photovoltaic solar 12-19
Thermal solar 15
Table 3. Sources of electricity supplied over 12 months by September 30, 2016 by the electric
utility Ameren Illinois.
Source [percent]
Biomass 0
Coal 48
Hydroelectric 1
Natural gas 23
Nuclear 16
Oil 4
Solar 0
Wind 7
Other sources 1
Total 100
The USA’s goal for wind power production is from presently 2 percent up to 20 percent
of electrical energy production by 2030. To accomplish this goal, the USA would need to add
1,700 Gigawatts (1 Gigawatt, GW = 1,000 Megawatts, MW) of wind power installed rated
capacity per year.
The states of Iowa and South Dakota lead the nation in reaching the 20 percent goal of
electrical generation by wind power in 2011. The investor-owned electrical utility Xcel Energy
in Colorado through its subsidiary Public Service Company of Colorado reached on October 6,
2011, the milestone of 55.6 percent of its electricity coming from wind power.
Wind turbines prices decreased by 33 percent between 2008 and 2010. Global
competition between European and Chinese manufacturers led to the drop. This is supplemented
by more efficient USA manufacturing that saves on the transportation and shipping costs.
Technology improvements are producing better and more efficient turbines.
The state of California established a new Renewable Energy Standard (RES) of 33
percent by 2020. This ambitious RES includes near-term and incremental targets of 20 percent
by the end of 2013 and 25 percent by the end of 2016.
The USA Department of Energy (DOE) and the Department of the Interior unveiled a
coordinated strategic plan to pursue the deployment of 10 GigaWatts (GWs) of offshore wind
capacity by 2020 and 54 GWs by 2030. A high priority “Wind Energy Areas” program off the
coasts of New Jersey, Delaware, Maryland and Virginia is established. The Cape Wind’s
offshore farm project was approved. A commitment of $43 million over five years was made for
technical innovations, to drive down costs, and to reduce market barriers such as supply chain
development, transmission and infrastructure. A new consumer label, “Windmade” was launched
for products with at least a 25 percent proportion of wind power used in their manufacturing.
Fifteen companies such as Motorola Mobility, Deutsche Bank and Bloomberg have committed to
obtaining the new label.
About 50 power plants totaling 7,000 MWe of capacity unexpectedly went offline in
Texas due to unusually cold weather early in 2011. Wind power was available to help stabilize
the system and played a critical role in limiting the severity of the blackout, providing enough
electricity to keep the power on for about three million typical households. ERCOT, the Texas
grid operator, confirmed that wind energy was providing between 3,500 and 4,000 MWe of
electricity; about 7 percent of ERCOT demand at that time during a critical 2 hours window
when the grid needed power the most.
In early 2014, the USA was subject to a cold wave, designated as a "Polar Vortex," that
froze the piles of coal at coal power plants, and gas turbine and diesel fuel plants could not be
started. What saved the nation from blackouts was its installed wind and nuclear capacities.
On October 3, 2008 a small wind tax credit was signed into law in the USA. It involves a
30 percent tax credit of up to $4,000 per property, off the installed cost of a small wind turbine
system.
The Renewable Energy Alternative Production Act (S. 1094) would provide a Production
Tax Credit (PTC) for nonelectric renewable energy production for the first 10 years period of
operation for a design lifetime of 20 years as a current PTC for wind and other renewable
electrical generation systems. A four years extension was introduced in Congress as H. R. 3307,
the “American Renewable Energy Production Tax Credit Extension Act.” It was renewed to the
end of 2013 unless extended.

Industrial companies that are active in wind power generation in the USA are General
Electric (GE) Energy, Siemens Power Generation from Germany, Vestas Wind Systems from
Denmark, Clipper Turbine Works from the UK, Suzlon Energy from India and Gamesa
Corporation from Spain.
It is estimated that the USA could realistically have 300 GW of wind rated installed
capacity by 2030 at an electrical generation cost of 6-8.5 cents / kW.hr, including the cost of
transmission to access existing power lines. The cost of integrating the variable wind power into
the USA power grid would be under 0.5 cents per kW.hr.
For comparison, concentrated solar thermal power, also known as Concentrated Solar
Power, or CSP would provide electrical power at 14 to 15 cents per kW.hr.
It must be noted that wind turbines provide energy with an average intermittency factor
of 20-40 percent. Fossil and nuclear power plants have a capacity factor that averages 90
percent. At an intermittency factor of 1/3 for wind power and a capacity factor of unity for fossil
or nuclear power, this suggests that it takes 300 GW of wind rated capacity to deliver as much
electricity as about 100 GWe of fossil or nuclear installed capacity, and implies the need for
developing energy storage and backup options for the successful implementation of wind energy
for the long term.
A symbiotic relationship could be contemplated between wind power production for peak
power production and nuclear power for base production as a replacement to depleting fossil fuel
supplies and reducing greenhouse gas emissions. A visionary approach for remote and arid
locations wind power can be stored as compressed air to be used to increase the efficiency of
open cycle gas cooled fission reactors using the thorium fuel cycle and molten salts that would
not require water cooling.
The state of Illinois would contribute more than 10,000 MW (10 GW) of wind power
rated installed capacity. As of December 2006, Illinois wind projects had just a 107 MW rated
installed capacity.
Germany was the world leader in wind power production with 16,629 MW of rated
installed capacity as of 2004. Spain was second with 8,263 MW of rated installed wind energy
capacity, the USA is third with 6,740 MW and Denmark, which gets 20 percent of its electricity
from the wind, was in fourth place with 3,117 MW of installed capacity. The European Union
planned to increase its use of renewable energy sources to 21 percent by 2010, with much of it
from wind power.
By the summer of 2008, the USA wind industry moved past the 20,000-megawatt (MW)
installed rated capacity milestone. It passed Germany to become the world leader in wind
generation. By the end of September 2008, the USA had over 21,000 MW of installed rated
wind capacity.
However, in 2010 and 2011, China (62,363 MW) has become the leader, ahead of the
USA (46,919 MW), Germany (29,060) and Spain (21,674 MW) in terms of installed rated wind
capacity.
In the USA, the top five states in wind power development are: California with 2,096
MW installed rated capacity; Texas with 1,293 MW of installed rated capacity; Iowa with 632
MW installed rated capacity; Minnesota with 615 MW installed rated capacity; and Wyoming
with 285 MW installed rated capacity. Vermont has one commercial 6 MW operating wind
farm.

The chapters in this work are mostly self-contained and can be read in the order that the
reader wishes. The work is still in progress and is evolving and is frequently being updated; or
in the parlance of the World Wide Web, it is continually “under construction.” In fact, it is an
ongoing effort that started sprouting and taking the present form on November 25, 2005. It has
evolved as the basis of the reviewed and approved course: Wind Power Systems, NPRE 475, at
the University of Illinois at Urbana-Champaign.
The hope is that this modest effort will contribute to the scientific literacy of the readers
in the Wind Power Systems area of knowledge, and satisfy their intellectual curiosity about its
potential contribution to the future of energy science and technology.
According to Thomas Carr:
“The word ‘energy’ incidentally equates with the Greek word for
‘challenge.’ I think there is much to learn in thinking of our federal energy
problem in that light. Further, it is important for us to think of energy in terms of
a gift of life.”
Dr. Magdi Ragheb
Champaign-Urbana, Illinois, USA
January 23, 2020

ACKNOWLEDGEMENTS
The author gratefully acknowledges the intellectual interaction with the students, both
undergraduate and graduate, and university faculty colleagues, about the content, the questions
they raised and their suggestion in presenting the class notes in the present format. Comments,
including error corrections, about the present material are welcome and would be highly
appreciated in view of improving future versions of this work.
The author particularly wishes to acknowledge the contributions of the following
individuals at different times in encouraging and reviewing the material and suggesting
improvements: Prof. Enrique Reis, The University of Illinois, Lt. USA Navy Mark Hardwidge,
USA Navy, Ret., Parkland College, and Adam M. Ragheb, The University of Illinois. The
comments and discussions with Prof. of Aviation Emeritus Thomas H. Gordon, from the Illinois
Institute of Aviation, University of Illinois at Urbana-Champaign, who attended the course in the
fall of 2013, are highly appreciated. The comments by Prof. Enrique Reis from the Department
of Industrial and Mechanical Engineering and the critical review by Prof. of Aviation Emeritus
Thomas Gordon from the Illinois Institute of Aviation, University of Illinois at Urbana-
Champaign are greatly acknowledged.
The following gratefully contributed to the development of the contents as members of
the class taught in the Spring of 2007: Benjamin Asher Holtzman, David Joseph Gennardo,
David K. Lartonoix, Gregory James Gugle, Jason Douglas Draper, Jennifer M. Gail, Joel
Michael Dixon, Julio Eduardo Mayen, Lt. USA Navy Mark E. Hardwidge, Paul Richard Gush,
Paul William Lenz, Rachael W. Jabush, Robert J. Steinmentz, Robert Richard Nagel, Ryan M.
Rymarczyk, and Stefan Joseph Janucz.
Contributions from members of the class of Spring 2008: Mark B. Adams, Suhail F.
Barot, Aras A. Buntinas, Priya Gandhi, Isaac L. Han, Min N. Lwin, Rao Harikrishna, John P.
Sapp, Nehal S. Shah, Craig M. Starr, Michael C. Steele, Sean D. Wynne, Hector A. Pulgar
Painemal, Wei Ren Quah, Melissa A. Schear, and Adam P. Steele, are acknowledged.
Contributions from members of the class of Spring 2009: Scott Aderhold, Dieter B.
Brommer, Jacob Coutre, Dylan C. Erb, Drew G. Griffiths, Jun Jiang, Seng Khai Keng, Stephen
F. Kohlhase, Michael A. Kurowski, Michael A. Mangan, Eric B. Spigelman, Jihn R. Tramm,
Carlos Valverde Martinez as undergraduates and James A. Babiarz, Hector Beltran, Gabriel F.
Benavides, Christopher T. Cirone, Sudipta Dutta, Mitchell Minarick, Charles J. Murray, Harrison
K. Pappas and Sebastian S. Smater as graduates, are acknowledged.
Contributions from members of the class of Spring 2012: Majid A. Alhilali and Miao Lu,
are acknowledged. The review by Dishant Parish is appreciated.
Upon review by the College of Engineering and University faculty by January 2009, the
material forms the basis of an approved regular course on “Wind Power Systems,” NPRE 475,
offered to the undergraduate and graduate students in the spring semester at the University of
Illinois at Urbana-Champaign.