wind power feasibility analysis under uncertainty in the
TRANSCRIPT
�������� ����� ��
Wind Power Feasibility Analysis under Uncertainty in the Brazilian ElectricityMarket
Giancarlo Aquila, Paulo Rotela Jr., Edson de Oliveira Pamplona, Ander-son Rodrigo de Queiroz
PII: S0140-9883(17)30134-2DOI: doi:10.1016/j.eneco.2017.04.027Reference: ENEECO 3627
To appear in: Energy Economics
Received date: 25 February 2016Revised date: 18 March 2017Accepted date: 28 April 2017
Please cite this article as: Aquila, Giancarlo, Rotela Jr., Paulo, de Oliveira Pam-plona, Edson, de Queiroz, Anderson Rodrigo, Wind Power Feasibility Analysisunder Uncertainty in the Brazilian Electricity Market, Energy Economics (2017),doi:10.1016/j.eneco.2017.04.027
This is a PDF file of an unedited manuscript that has been accepted for publication.As a service to our customers we are providing this early version of the manuscript.The manuscript will undergo copyediting, typesetting, and review of the resulting proofbefore it is published in its final form. Please note that during the production processerrors may be discovered which could affect the content, and all legal disclaimers thatapply to the journal pertain.

ACC
EPTE
D M
ANU
SCR
IPT
ACCEPTED MANUSCRIPT
WIND POWER FEASIBILITY ANALYSIS UNDER UNCERTAINTY IN
THE BRAZILIAN ELECTRICITY MARKET Giancarlo Aquila
1 ([email protected]),
Paulo Rotela Junior 2 * ([email protected]),
Edson de Oliveira Pamplona 1 ([email protected]),
Anderson Rodrigo de Queiroz 3 ([email protected]).
1 Institute of Production Engineering & Management
Federal University of Itajubá, Itajubá-MG, Brazil 2 Production Engineering Department
Federal University of Paraíba, João Pessoa-PB, Brazil 3 Department of Civil, Constr. and Environ. Engineering
North Carolina State University, Raleigh – NC, USA
*Corresponding author: [email protected] (Phone: +55 35 3216-7200). Cidade
Universitária, s.n. – João Pessoa, PB, 58051-900, Brazil

ACC
EPTE
D M
ANU
SCR
IPT
ACCEPTED MANUSCRIPT
WIND POWER FEASIBILITY ANALYSIS UNDER UNCERTAINTY IN
THE BRAZILIAN ELECTRICITY MARKET
ABSTRACT
Investors must be able to plan and analyze their investments in order to optimize decisions
and turn them into profits associated with a particular project. Since electricity producers in
the Brazilian electric power system are exposed to a short-term market, the goal of this paper
is to propose a framework for investment analysis capable of encompassing different
uncertainties and possibilities for wind power generators in a regulated market, characterized
by auctions. In order to reach the proposed objective we employ a simulation technique
which allows modeling cash flows considering uncertainties in variables related to project
financial premises, electricity generation and producer exposure to the short-term market. For
such goal, this study presents a new approach for investment analysis that allows the
identification of the main uncertainty parameters and risks associated to this class of projects
in the Brazilian electricity market. We also employ the Value at Risk technique to perform a
risk management analysis in such context.
Keywords: Wind Power; Stochastic Power Generation; Electricity Markets; NPV;
Renewable Energy.
1. INTRODUCTION
Brazil experienced a broader policy with international repercussion directed to the
renewable energy sector after 2000, with the creation of the alternative source incentive
program (PROINFA). Through a strategy similar to the European feed-in tariffs (FIT), 3300
MW of energy were hired and built in the first phase of PROINFA. Investments were mostly
directed to small hydroelectric power plants (SHPs), biomass power plants and wind farms.

ACC
EPTE
D M
ANU
SCR
IPT
ACCEPTED MANUSCRIPT
The second PROINFA phase began after 2009 and gradually incentivized the purchasing of
renewable energy through auctions (DUTRA and SZKLO, 2008).
As a manner of complementing the support to the insertion of renewable energy
sources (RES), special financing lines from the Brazilian national development bank BNDES
along with targets for minimum participation requirement of national equipment in the hired
projects created new strategies to leverage the sector. Such initiatives were relevant to
motivate the sector growth, since the environment until 2001 was adverse for investments in
RES in the country (WACHSMANN and TOMALSQUIM, 2003), besides hydro.
Concerning the results of such applications, since PROINFA creation, RES, specially
wind power generation has been gradually reaching more space in the Brazilian energy
matrix (JUAREZ et al., 2014; MARTINS and PEREIRA, 2011). According to Silva et al.
(2013), Brazil has more wind power plants than any other Latin American country. In August
of 2012 Brazil presented around 2 GW of installed wind power capacity and in December of
2014 this value jumped to 5.9 GW, according to the Brazilian wind power association
(ABEEÓLICA, 2015), accounting for 4.4% of the country’s energy matrix.
With the steady expansion of the wind power installed capacity and its production, it
is important to perform analysis related to this type of investment. Several studies have
emphasized in this type of analysis, such as Simons and Cheung (2016), who develop a
quantitative approach focusing on the selection of wind farm projects to evaluate different
parameters such as profitability and payback, energy efficiency and carbon emissions.
Ayodele et al. (2016) assessed wind power potential and economic feasibility in different
regions in Nigeria, the study provides guidelines on which regions of the country it is
worthwhile to adopt incentive policies for the insertion of wind energy. Colmenar-Santos et
al. (2015) analyzed whether repowering is a financially viable alternative to allow the
continued integration of wind energy into the Spanish energy sector when the electricity
ACC
EPTE
D M
ANU
SCR
IPT
ACCEPTED MANUSCRIPT
generated is valued at the market-clearing price. The work presented in (RAMADAN, 2017)
evaluated the viability of the use of wind power as an alternative for generating electricity in
the eastern part of Sinai. In this study the economic evaluation of a 200 MW wind farm was
performed, the results show significant benefits for wind power exploration in the region.
In order to perform a more robust, it is important to consider the fact that the producer
gains and losses are intimately connected to generation uncertainties. Therefore, in this work,
we consider the intrinsic uncertainties related to energy production of a wind farm project
contracted in an auction, see more in Del Rio (2014), and also the market conditions where
this electricity must be traded.
Monte Carlo Simulation (MCS) techniques have rarely been used within the context
of risk management of RES structures as they require considerable data processing and the
definition of probability density functions for random variables (ARNOLD e YILDIZ, 2015).
In the literature there are some applications in the wind energy sector presented in (AQUILA
et al., 2016; LI et al., 2013; ERTURK, 2012; MONTES et al., 2011; WALTERS and
WALSH, 2011).
In this present work, we follow the consideration of the settlement of the differences
in the investment analysis presented in Aquila et al. (2016). Aquila et al. (2016) analyzed the
impact of incentive mechanisms and different market environments on the risk of investment
in wind farms in Brazil. For this, a quantitative approach that allows an analysis of
investments from the simulation of NPV values for different scenarios was used. However,
the main contribution of this study is not to compare incentive mechanisms, we build in the
previous work to propose the use of Value at Risk (VaR), considering the settlement of the
differences, which depends on the behavior of the wind energy and the electricity prices in
the spot market. This novelty approach suggests the evaluation of the wind power project

ACC
EPTE
D M
ANU
SCR
IPT
ACCEPTED MANUSCRIPT
under uncertainty in the Brazilian market as a mean to enhance decision-making for a
potential investor.
Therefore, in general terms, this paper aims to propose a risk analysis approach,
through VaR, useful to capture the impact of settlement of the differences in the short-term
market for wind power generation projects contracted in auctions of alternative sources.
Besides this introductory section, this paper is divided as follows: Section 2 presents
the theoretical foundations of evaluation of the energy production by wind generators and the
short term market (STM) exposure for power generators in Brazil. Section 3 presents the
proposed framework for investment analysis under uncertainty for wind power plant in a
Brazilian energy auction, and the VaR methodology used for risk management. Section 4
presents a case study for a wind farm project to be located in Brazil along with a discussion
of the main results obtained. Section 5 presents the final considerations and conclusions
about this work.
2. WIND POWER GENERATION AND THE BRAZILIAN ELECTRICITY
MARKET
Over the past decade renewable integration expanded in the Brazilian interconnected
power system following global trends (SOLANGI et al., 2011; PEREIRA et al., 2012; REN
21, 2015). The main reasons for this expansion in the country are the country’s on-shore
(Northeast and South regions) (MARTINS and PEREIRA, 2011) and off-shore wind power
potential, growth of the wind energy industry (BLANCO, 2009; ISLAM et al., 2013), and the
long-term auctions for alternative energy sources with BNDES loans support (JUAREZ et al.,
2014).
Wind power generation has been attracting new investments and providing a
sustainable path for the development of the country energy matrix (FIDELIS et al., 2013).
Maestropietro et al. (2014) explains that renewable energy sources can be hired through

ACC
EPTE
D M
ANU
SCR
IPT
ACCEPTED MANUSCRIPT
regular auctions or through energy reserve auctions, the second have been oriented towards a
competition among renewables. In these auctions specific products are tailored according to
the peculiarities of the wind energy source. Moreover, specific accounting mechanisms are
used to allow wind farms to compensate for seasonal and inter-annual wind fluctuations in
the long-run.
In the present context, where wind generation is growing along with the success of the
long-term auctions, it is appropriate to evaluate new investments for this source in Brazil.
Our goal is to incorporate uncertainties in terms of electricity production, electricity prices
and analyze the producer exposure to the STM. In this work we consider an investment in a
wind farm that will negotiate its electricity production in long-term regular auctions. In this
section we present the basis to compute wind power production for a wind farm, and the
circumstances where the producer can be exposed to the STM.
2.1. Electricity production from Wind Power plants
In order to perform statistical analysis and evaluate the energetic potential from wind
sources, the Weibull distribution is broadly used in the literature. According to (LI et al.,
2013; SAFARI and GASORE, 2010; AKDAG and GULER, 2009; CUSTODIO, 2013) the
Weibull distribution is considered to be the most adequate probability density function (pdf)
to represent the behavior of wind speed. According to Safari and Gasore (2010), the use of
Weibull distribution is also justified due to its simplicity in estimating parameters to
approximate wind speed distribution of presented wind speeds. The probability density
function for a Weibull distribution with two parameters is given by Equation 1, proposed by
Justus et al. (1978).
1
( )
kk v
Ck vf v e
C C
(1)

ACC
EPTE
D M
ANU
SCR
IPT
ACCEPTED MANUSCRIPT
Where, v is an average wind speed given in [m/s], C is the Weibull scale parameter given in
[m/s], k is the Weibull form parameter (dimensionless). In order to obtain both the scale and
the form parameters, Custódio (2013) presents a calculation that uses Equations 2 e 3,
respectively:
11
vC
k
(2)
Where, represents the gamma function.
It is worth to emphasize that the Gamma function, also called exponential integral
function, is often used as a function of the Weibull k form parameter (CUSTÓDIO, 2013).
Equation 3, presents the Gamma function from (2) as a function of the arguments
11
k for
the k values according described in (CUSTÓDIO, 2013).
1.086
kV
(3)
Where, is the wind speed standard deviation in [m/s] and V is the average wind speed in
[m/s].
Regarding the calculation of the wind energy potential for wind power generators, it is
important to mention that a wind turbine captures a portion of the wind kinetic energy, which
passes through an area swept by the rotor and transforms it into electricity. The electric
power output in [W] is a function of wind speed to the cube (AMARANTE, 2010) as
presented in Equation 4.
31
2r PP A v C (4)
Where, ρ is the air density given in [kg/m³], Ar is the area swept by the rotor (given by
2 4D , with D being the rotor diameter) in [m2], CP is the rotor aerodynamic power

ACC
EPTE
D M
ANU
SCR
IPT
ACCEPTED MANUSCRIPT
coefficient, and η is the efficiency of the mechanical rotor and electric generator-transmission
set.
According to Custódio (2013), the CP of a wind turbine varies according to the wind
speed at the wind farm location. From this assumption, through the computation of a cubic
regression, it is possible to update the CP value based on random wind speed values obtained
at the wind farm location. In the next Section, we discuss how we employ MCS to obtain
wind speed ensembles to be used when evaluating uncertainties in the project investment
analysis.
According to Amarante et al. (2001), with Weibull distribution parameters, k and C,
and the average air density, it is possible to estimate the production of a wind turbine with
good accuracy. The wind turbine monthly electricity production (MEP) in [kWh] can be
calculated by integration of power profiles and wind speed occurrence frequency as presented
by Equation 5.
max
min
0.73 ( ) ( )v
v
MEP P v f v dv (5)
Where, ( )P v is the energy produced as function of randomness of wind speed monthly
average and ( )f v dv is the probability density function that describes the monthly wind speed
average. It is worth mentioning that MEP has to satisfy the maximum power generation limit
of each turbine.
The MEP computation must be compared to the sum of electricity that the wind farm
can sell in the electricity market, know as assured energy or physical guarantee. The concept
of physical guarantee is similar to firm energy rights, presented by Faria et al. (2009), which
refers to the maximum continuous production of electricity from a power generation plant
during a specific period. However, in the case of wind power plants, the physical guarantee is
ACC
EPTE
D M
ANU
SCR
IPT
ACCEPTED MANUSCRIPT
calculated after the studies of performance regarding the wind profile at the specific location
during a certain period of time.
2.2. Producer exposure to the STM in Brazil
In a situation where the wind power producer cannot generate 100% of the electricity
amount stated in the sell-purchase contract, it is necessary to calculate and liquidate the
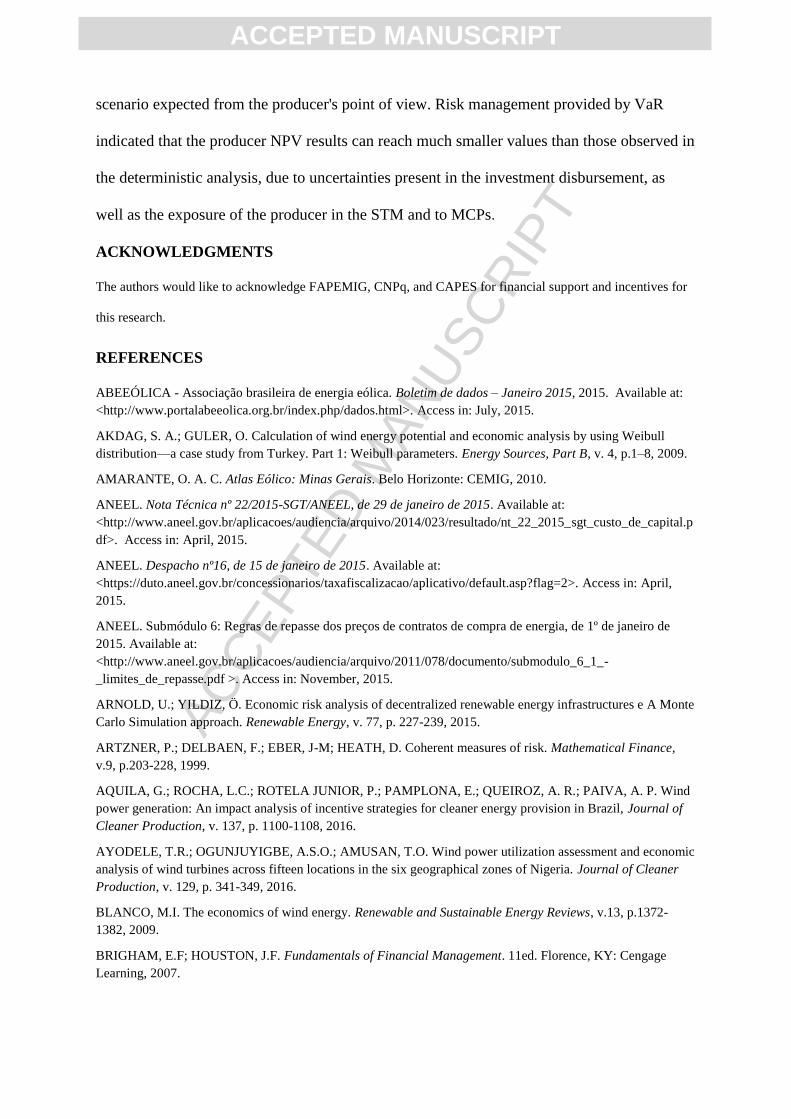
differences in the STM and fulfill the contract coverage (CCEE, 2010). Figure 1 illustrates a
particular example where the producer generates more electricity than the contract values.
Figure 1– Settlement of the difference between the energy hired and the energy verified in the STM.
With this picture in mind, the producer also becomes exposed to market clearing
prices (MCP) fluctuations, it is possible to valuate the energy traded in the STM computed
through the use of data considered by the independent system operator (ISO) represented by
ONS in Brazil when optimizing the operation of the interconnected electric power system
(SIGNORINI et al., 2015). The MCP is determined on a weekly basis in Brazil for each load
baseline (low, medium, and heavy), limited by maximum and minimum values, effective for
each electrical region (also known as electric submarket) Southeast/Center-West, South,
North, and Northeast (CCEE, 2015).
Dalbem et al. (2014) explain that since the main source of electricity generation in
Brazil is hydroelectric, the MCP value goes down in wet seasons or in moments when the
reservoirs are full. On the other hand, in dry periods, the thermal plants with expensive
operational marginal costs may be needed and dispatched, what increase the MCP values.
Because ISO decisions to use or not the stored water volumes from hydro plants reservoirs
also influence price formation, the methodology for MCP calculation relies on mathematical
optimization models and algorithms, such as those described in the work of Maceira et al.
(2002). It is worth mentioning that MCP prices are volatile and plays a fundamental role in
the economic viability of a power generation project such as a wind farm.

ACC
EPTE
D M
ANU
SCR
IPT
ACCEPTED MANUSCRIPT
However, in a low MCP scenario, the differences between contract and generation
are liquidated by the annual reference value, which is used to regulate the transfer of the final
acquisition costs of electricity to the tariffs for final electricity consumers (ANEEL, 2015).
We adopted a criterion based on the higher value between the MCP and the annual reference
value to serve as a computation baseline of the electricity production differences in the STM.
3. A FRAMEWORK FOR WIND POWER INVESTMENT ANALYSIS UNDER
UNCERTAINTY
In this Section we present a general framework for investment analysis in wind power
generation under uncertainty. Such methodology is further applied to evaluate new
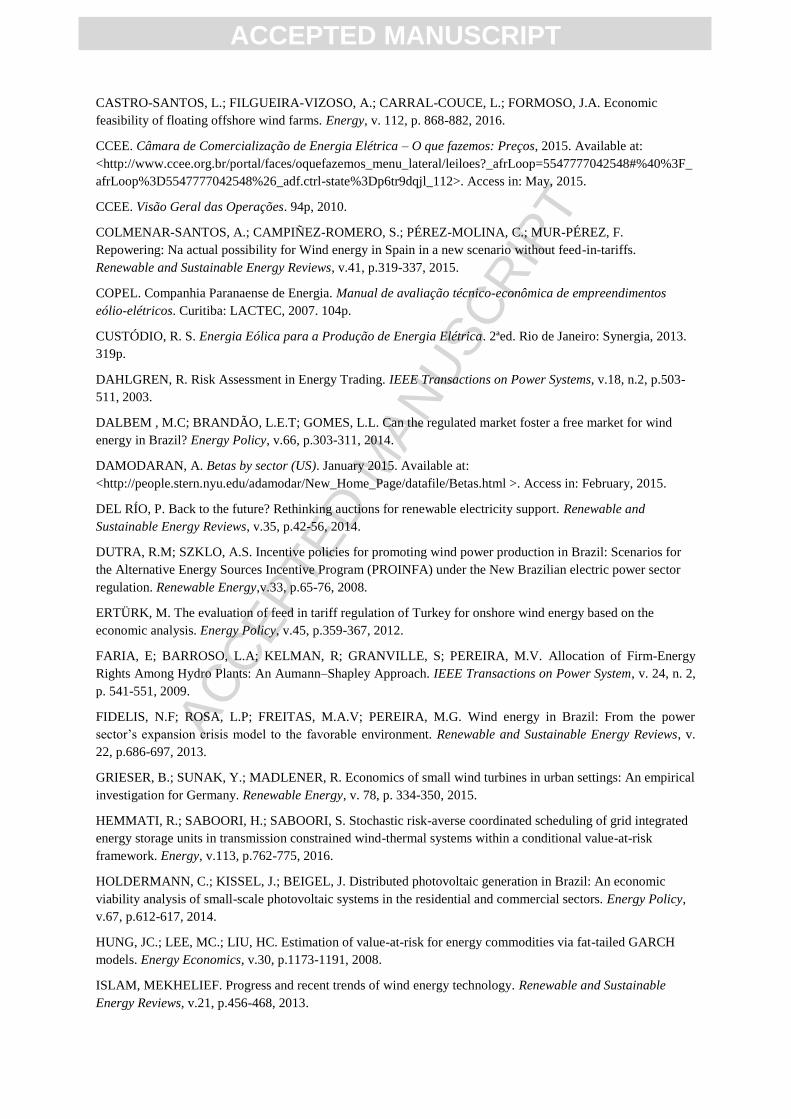
investments in the Brazilian electricity market in Section 4. Figure 2 shows a flowchart with
the steps defined in our framework to perform the wind generation project evaluation.
Figure 2 – Procedures performed in the investment analysis.
We aim to use economic feasibility analysis in order to support decision-making
processes in terms of whether or not a potential investor should invest in a specific project.
The initial step is used to compute the project discount rate, according to the methodology
defined in Section 3.1. Discount rates are used to bring the future cash flows to the current
date. A deterministic analysis is then performed to obtain the net present value (NPV) results
for the project, where the main input variables of the analysis model are known a priori. After
this step, a sensitivity analysis is created to identify input variables that are more sensitive in
the NPV computation.
The next step defines a stochastic analysis where uncertainties in the variables
regarding to electricity production by wind generators are considered. Such analysis is
performed using the MCP and the annual reference value to monetize gains or losses and
quantify dues regarding to exposures of the wind power producer in the STM. With the
ACC
EPTE
D M
ANU
SCR
IPT
ACCEPTED MANUSCRIPT
results obtained through the proposed cash flow simulations, it is possible to perform a risk
management analysis with more accuracy by applying VaR.
Three scenarios are analyzed in this study. The first scenario deals with the
investment in a wind farm without loan support and without the possibility to trade carbon
credits. The second scenario analyzes a situation where there is loan available from BNDES
for the project. Finally, the last scenario evaluates a project that could be part of the clean
development mechanism (CDM) during a 10-year period, where it would be possible to
commercialize carbon credits.
3.1. Calculation of the Discount Rate
Discount rate is used to bring the future cash flows to the current date, in this work
the discount rate of the wind power plant is considered to be equivalent to the weight average
capital cost (WACC), model recommended by the UNFCCC (2012), and in Brazil by
ANEEL (2015a), and adopted in papers such as Erturk (2012), Castro-Santos et al. (2016)
and Aquila et al. (2016).
According to Erturk (2012), the WACC is obtained through the use of Equation 6.
(1 )d eWACC k D k E (6)
Where:
kd represents the cost of debt;
D stands for the weight of debt capital applied in the investment (%);
ke is the cost of equity;
E is weight of equity applied in the investment (%);
is the income tax.
In order to obtain BNDES loan, a final percentage of tax rate is assumed discounting
the inflation rate for the cost of debt. For calculation of the cost of equity, the capital asset
pricing model (CAPM) is employed, adding the Brazil risk premium, similar to the model
ACC
EPTE
D M
ANU
SCR
IPT
ACCEPTED MANUSCRIPT
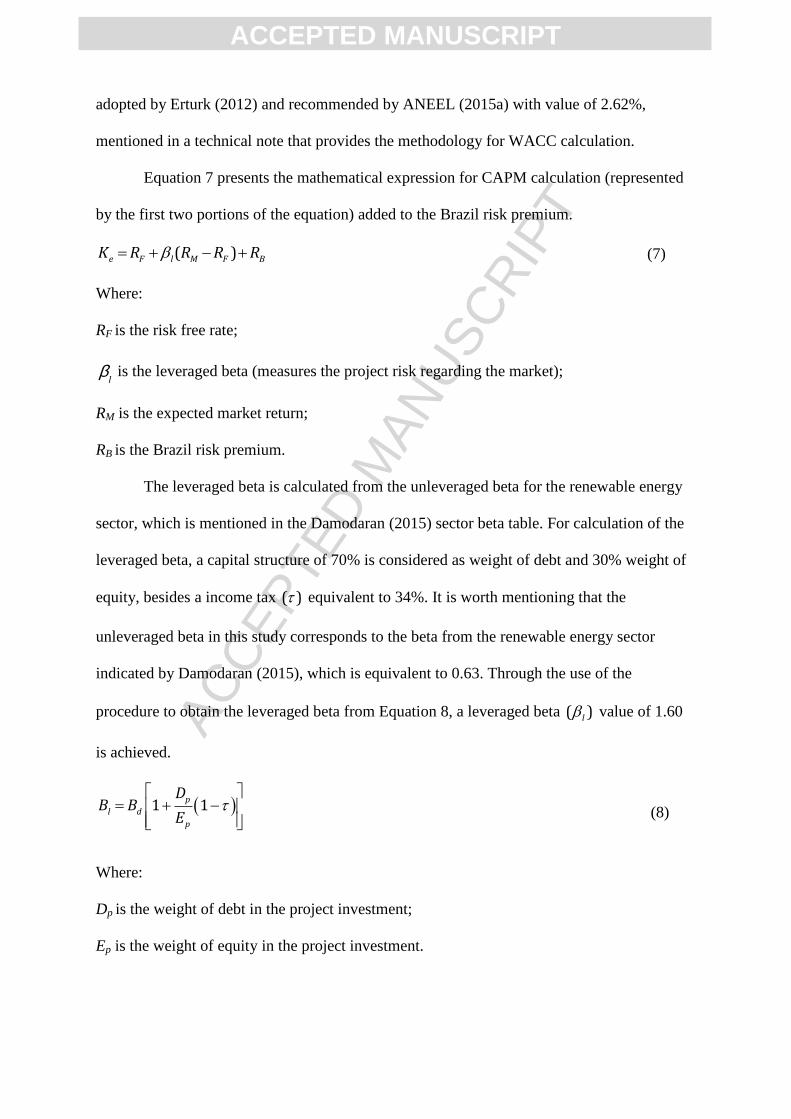
adopted by Erturk (2012) and recommended by ANEEL (2015a) with value of 2.62%,
mentioned in a technical note that provides the methodology for WACC calculation.
Equation 7 presents the mathematical expression for CAPM calculation (represented
by the first two portions of the equation) added to the Brazil risk premium.
( )e F l M F BK R R R R (7)
Where:
RF is the risk free rate;
b
l is the leveraged beta (measures the project risk regarding the market);
RM is the expected market return;
RB is the Brazil risk premium.
The leveraged beta is calculated from the unleveraged beta for the renewable energy
sector, which is mentioned in the Damodaran (2015) sector beta table. For calculation of the
leveraged beta, a capital structure of 70% is considered as weight of debt and 30% weight of
equity, besides a income tax ( ) equivalent to 34%. It is worth mentioning that the
unleveraged beta in this study corresponds to the beta from the renewable energy sector
indicated by Damodaran (2015), which is equivalent to 0.63. Through the use of the
procedure to obtain the leveraged beta from Equation 8, a leveraged beta ( )l value of 1.60
is achieved.
1 1p
l d
p
DB B
E (8)
Where:
Dp is the weight of debt in the project investment;
Ep is the weight of equity in the project investment.
ACC
EPTE
D M
ANU
SCR
IPT
ACCEPTED MANUSCRIPT
Regarding to RF, RM and RB used to calculate CAPM, values of 5.64%, 13.20%, and
7.56% are adopted. These values are indicated in ANEEL (2015a) and ANEEL (2015b) for
WACC calculation regarding to installation of electricity generation. Through the application
of the data indicated in the calculation of leveraged beta, CAPM and WACC, a result for
WACC equivalent to 6.99% per year is obtained.
3.2. Deterministic and Sensitivity Analysis
For the purpose of investment analysis we use cash flows to represent the value of the
project for different conditions. In the deterministic analysis all the information related to the
project is considered to be known. In this case, for a wind farm project selling electricity in
the STM we consider that the electricity production, the electricity prices and every other
variable/parameter are known from the beginning. In such case, NPV calculations are
performed using cash inputs and outputs as indicated in Table 2. The final result of earning
and disbursements obtained in each period are the cash flow liquid balances, which are
discounted by the appropriate rate to reach the NPV result.
Table 2 – Structure of a wind power plant cash flow.
According to Arnold and Yildiz (2015) and Griser et al. (2015), the sensitivity
analysis saves time for application of the MCS, since it makes sense to restrict the number of
input variables, only using those that are more significant to generate results for the
deterministic model. Arnold and Yildiz (2015) still reinforce that within the sensitivity
analysis, one single input parameter is systematically varied within a pre-defined interval of
values. We employ sensitivity analysis in this work in order to define de the most important
variables for the project NPVs.
3.3. Monte Carlo Simulation in the context of investment analysis
Similar to other studies found in the literature (ARNOLD and YILDIZ, 2015;
HOLDERMANN, 2014; PEÑA et al., 2014; SCHMIDT et al., 2013; LI et al., 2013;

ACC
EPTE
D M
ANU
SCR
IPT
ACCEPTED MANUSCRIPT
ERTÜRK, 2012; MARTINS et al., 2013; WALTERS and WALSH, 2011; MONTES et al.,
2011) that apply feasibility analysis to projects related to RES, the decision criterion
employed in this study to perform the investment analysis is the NPV. Brighton and Houston
(2007) state that the main advantage of using NPV is to quantify how much the project will
impact the position of the capital initially invested. On the other hand, the Payback method,
which is commonly used in investment analysis, does not provide any guidance regarding the
investor cash flow.
In order to obtain reliable results for the NPV of wind power energy generation
projects, Montes et al. (2011) emphasize that mathematical techniques such as MCS allows
the analysis of this type of project with proficiency. Instead of considering all input data in a
deterministic manner in the cash flow to obtain the project NPV, the MCS allows the
incorporation of probability distributions. The insertion of probabilities distribution in the
cash flow allows the representation of stochasticity through the use of random input variables
that are more sensitive to NPV results.
The study presented in Jiang et al. (2013) explains that MCS is performed through
numerous executions of different models, using different values for the stochastic parameters.
Values for the stochastic parameters are randomly selected from pre-determined probability
distributions. Several ensembles of input parameters can be obtained through carrying out
many rounds of simulations. By applying MCS it is possible to input more information in the
analysis regarding to projects risk and design a reliable and robust framework for the decision
making process (WILLIAMS, 2007).
The synthesis of all iterations generates a range of possible results (TZIRALIS et al.,
2009). Since an economically attractive project in this work has a NPV > 0, at a certain
discount rate (r), the project feasibility probability is given by Equation 9.

ACC
EPTE
D M
ANU
SCR
IPT
ACCEPTED MANUSCRIPT
0 1
0
,..., ;NPV nP x x r pdf NPV dNPV (9)
In which: PNPV>0 is the accumulated positive NPVs of the project, pdf NPV is the
probability density function of the project NPVs
and xi is a vector associated with the project
random variables.
In the present work, MCS is used to simulate the monthly electricity production for
the wind farm in each month over a 20-year period. MCS also is used to incorporate
uncertainties in the variables that calculate the amount to be paid in the STM and the most
sensitive variables for the NPV.
For the NPV calculation annualized cash flows for the 20-year period, calculated
using the structure shown in Table 2, are brought to the present date using the computed
discount rate.
3.4. VaR for risk management in the project
According to Hung et al. (2008), VaR is one of the most popular approaches to
quantify risk. The use of VaR is employed by managers and financial institutions to get
protection and hedge against market risks. VaR is broadly employed to analyze financial
risks (JORION, 2002; YAMAI e YOSHIBA, 2005; ARTZNER et al., 1999) since it is easily
comprehended, focusing in normal market conditions. In other words, the distribution area
from - ∞ to a minimum W* value, which can also be defined as the distribution percentile,
must sum up to p = 1 – c, with c being one level of confidence, such as 5% for example
(JORION, 1999). Equation 10 illustrates the VaR calculation for general distribution
functions, discrete or continuous, with thick or thin tail.
*
1 ( ) ( *)W
c f w dw P w W p (10)
ACC
EPTE
D M
ANU
SCR
IPT
ACCEPTED MANUSCRIPT
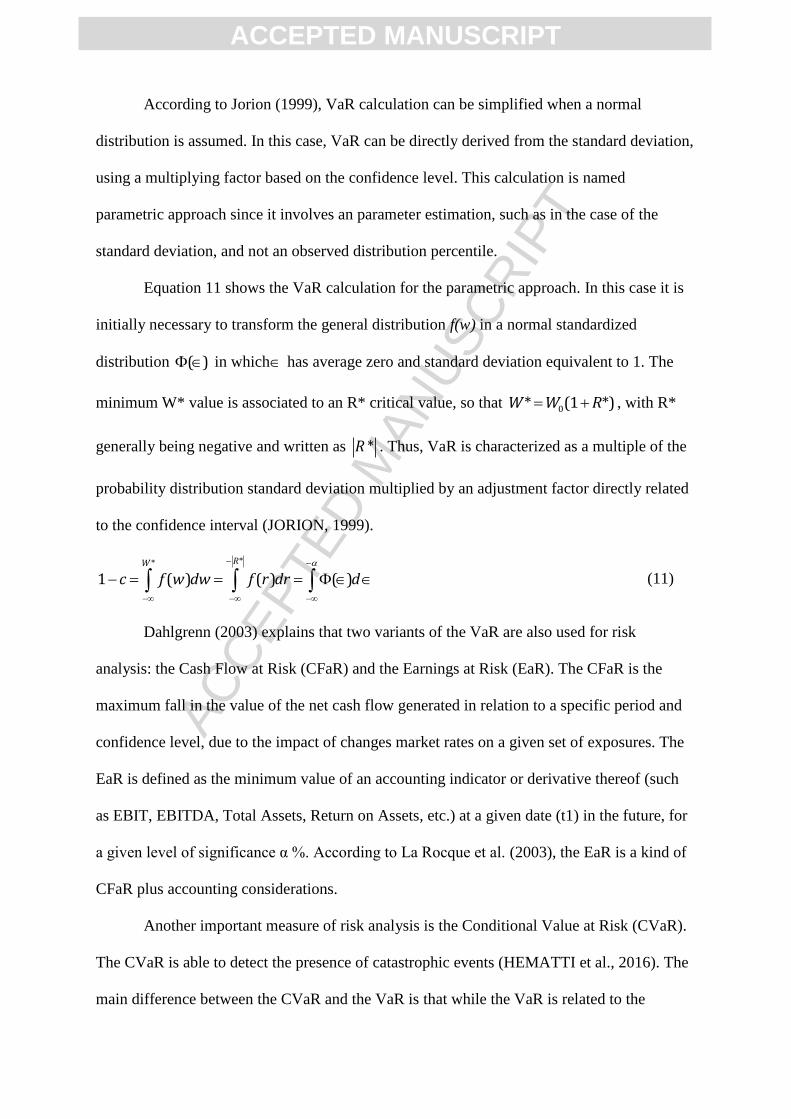
According to Jorion (1999), VaR calculation can be simplified when a normal
distribution is assumed. In this case, VaR can be directly derived from the standard deviation,
using a multiplying factor based on the confidence level. This calculation is named
parametric approach since it involves an parameter estimation, such as in the case of the
standard deviation, and not an observed distribution percentile.
Equation 11 shows the VaR calculation for the parametric approach. In this case it is
initially necessary to transform the general distribution f(w) in a normal standardized
distribution ( ) in which has average zero and standard deviation equivalent to 1. The
minimum W* value is associated to an R* critical value, so that 0* (1 *)W W R , with R*
generally being negative and written as *R . Thus, VaR is characterized as a multiple of the
probability distribution standard deviation multiplied by an adjustment factor directly related
to the confidence interval (JORION, 1999).
**
1 ( ) ( ) ( )
RW
c f w dw f r dr d (11)
Dahlgrenn (2003) explains that two variants of the VaR are also used for risk
analysis: the Cash Flow at Risk (CFaR) and the Earnings at Risk (EaR). The CFaR is the
maximum fall in the value of the net cash flow generated in relation to a specific period and
confidence level, due to the impact of changes market rates on a given set of exposures. The
EaR is defined as the minimum value of an accounting indicator or derivative thereof (such
as EBIT, EBITDA, Total Assets, Return on Assets, etc.) at a given date (t1) in the future, for
a given level of significance α %. According to La Rocque et al. (2003), the EaR is a kind of
CFaR plus accounting considerations.
Another important measure of risk analysis is the Conditional Value at Risk (CVaR).
The CVaR is able to detect the presence of catastrophic events (HEMATTI et al., 2016). The
main difference between the CVaR and the VaR is that while the VaR is related to the

ACC
EPTE
D M
ANU
SCR
IPT
ACCEPTED MANUSCRIPT
probability of excess loss, the CVaR is related to the expectation of excess loss. In addition,
different from CVaR, VaR does not have property as differentiability and convexity, which
makes it difficult to apply mathematical programming problems.
In this paper, we aim to measure the risk in terms of potential loss, considering the
generation settlement of differences that the producer is exposed in the STM. Since VaR is a
risk analysis tool applied in an extensive number of practical cases and well established in the
literature, and that it is not among the objectives of this work to perform analysis using
mathematical programming models to minimize losses, we consider the use of VaR to be
sufficient to perform and accomplish such task.
4. CASE STUDY: WIND FARM INVESTMENT ANALYSIS IN BRAZIL
We consider as a case study a wind farm project to be located on-shore in the state of
Bahia in Brazil (Northeast region of the country). Due to the wind power potential of this
region, there are several existent wind farms operating there and contributing with electricity
production to the Brazilian interconnected power system.
4.1. Data and analysis regarding to the Wind Farm project
The wind farm used in our analysis has 30 [MW] of nominal power, with 15 wind
power generators with 2 [MW] of nominal power each, installed at 80 [m] of height. For the
current study, the following values, extracted from (AMARANTE, 2010), are considered
when calculating the wind power potential energy: ρ = 1.225 [kg/m3]; D = 3.72 [m]; and η =
0.98. Equation 12 shows the function obtained for the cubic regression performed in Aquila
et al. (2016) through the performance of CP from the wind generators using 25 different wind
speeds, presented on Table 1.
Table 1- CP x Wind speed.
Source: Aquila et al. (2016).

ACC
EPTE
D M
ANU
SCR
IPT
ACCEPTED MANUSCRIPT
According to (HAIR JR. et al., 2014), the regression equation must have an adjusted
determination coefficient (R2
adj) above 70% in order to be considered acceptable. Therefore,
since the performed regression shows an adjustment R2
adj = 90.5% it can be considered
adequate.
2 30,08114 0,1771 0,01539 0,00034PC v v v (12)
In addition, the fore mentioned wind farm represents a project hired in a new energy
auction within the circumstances of a contract by quantity, in which the producer assumes
monthly risks to fulfill the generation values established in the contract. Table 3 presents
main information regarding the analysis.
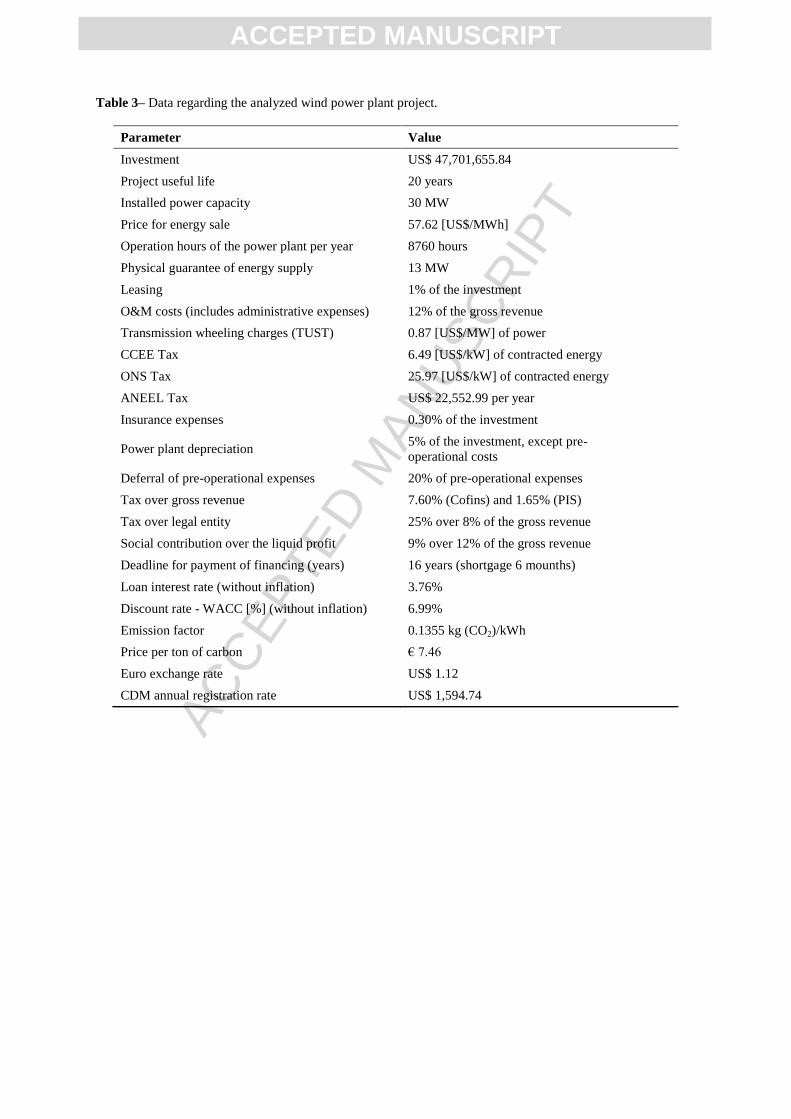
Table 3– Data regarding the analyzed wind power plant project.
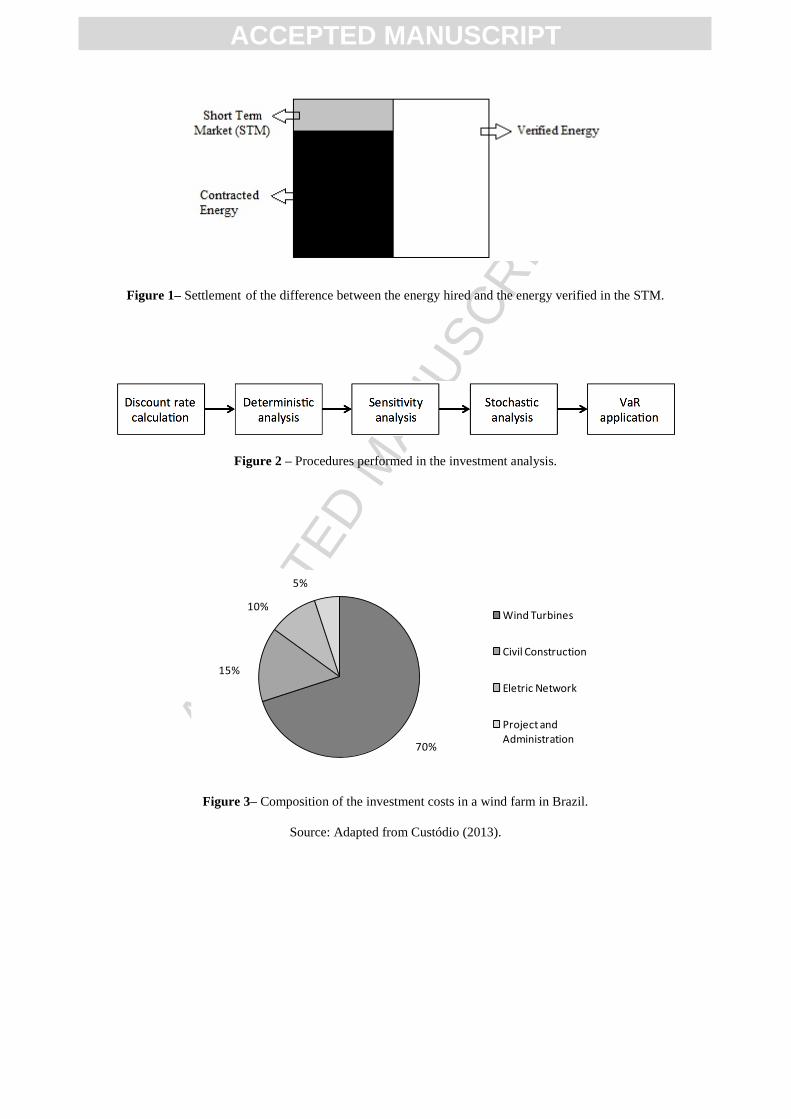
The evaluation of the investment value considers a typical composition of projects for
wind farms in Brazil, indicated by Custódio (2013) and shown in Figure 3. However, for the
investment value, an average of investments from wind farm projects with 30 [MW] of
installed capacity is used (average values for power plants that won the auctions for
alternative sources) of US$ 47,701,655.84 in April of 2015. We consider as the electricity
sale prices the average price value from the same auction of 57.62 [US$/MWh].
Figure 3– Composition of the investment costs in a wind farm in Brazil.
Calculation baselines for annual value data spent with leasing, O&M costs (including
administrative costs), expenses with insurance, power plant depreciation and deferral of pre-
operational expenses, were extracted from the wind power electrical enterprise manual from
COPEL (2007). For calculation of the transmission costs, the transmission wheeling charges
(TUST) paid by power plants connected in the South of Bahia state are considered. In Brazil,
for power plants with installed capacity up to 30 [MW] there is a 50% discount on TUST
values. For estimation of taxes paid to ONS (Brazilian ISO) and CCEE, an annual budget

ACC
EPTE
D M
ANU
SCR
IPT
ACCEPTED MANUSCRIPT
from respective organizations is divided by the total electricity produced in the
interconnected power system. The ANEEL tax is calculated based on the methodology
indicated in ANEEL (2015b).
Regarding the price per ton of carbon, the value corresponds to the average between
12.05.2015 to 12.06.2015, with the emission factor being equivalent to the reference value
determined by (MCT, 2015). BNDES loan conditions for wind power plants and tariffs
regarding tax calculation are equivalent to the current values up to the end of May 2015. In
order to formulate cash flows, the inflation of the taxes from the financing interest is
discounted from the equity cost, from the depreciation and from deferral of the power plant
pre-operational expenses. A tax of 5.6% is also considered to discount the inflation,
corresponding to the inflation expectation considered by ANEEL (2015a).
4.2. Results for the deterministic analysis
As mentioned before we perform a deterministic analysis to obtain the NPV results
for three different scenarios: without loan and sales of carbon credits (Scenario A), with loan
and without sales of carbon credits (Scenario B) and with loan and with sales of carbon
credits (Scenario C). The final earnings and disbursements results in each period are the
liquid balances of the cash flow, which were discounted by the discount rate to reach the
NPV result.
Since there are no inputs or disbursements of cash in the initial date, the NPV
calculation is only performed by discounting the cash flow balances from periods 1 to 20
through a discount rate equivalent to 6.99% per year. Results for the deterministic analysis
are presented in Table 4, in which the projects feasibility can be observed since the NPV
values are positive.
Table 4– Deterministic analysis results.
ACC
EPTE
D M
ANU
SCR
IPT
ACCEPTED MANUSCRIPT
BNDES loan plays an important role in the results of the cash flow analysis for the
wind farm. The entrepreneur almost triples his cash returns when using the loan. In a market
in which the technological costs are uncertain throughout the years, as the sales prices,
financing lines capable of supporting investors are key to provide higher financial security to
RES generation projects.
The project participation in the CDM resulted in earnings for the investor,
contributing to an increase of US$ 730,230.02. This reveals that trade of carbon credits can
increase cash returns for the project investor, however it does not provide significant
increases in the NPV, in the same way as loans.
After deterministic analysis results were obtained, the following step is to formulate a
sensitivity analysis, considering all variables involved in the project, including those related
to the CDM, in order to identify which of them had major impacts on project feasibility.
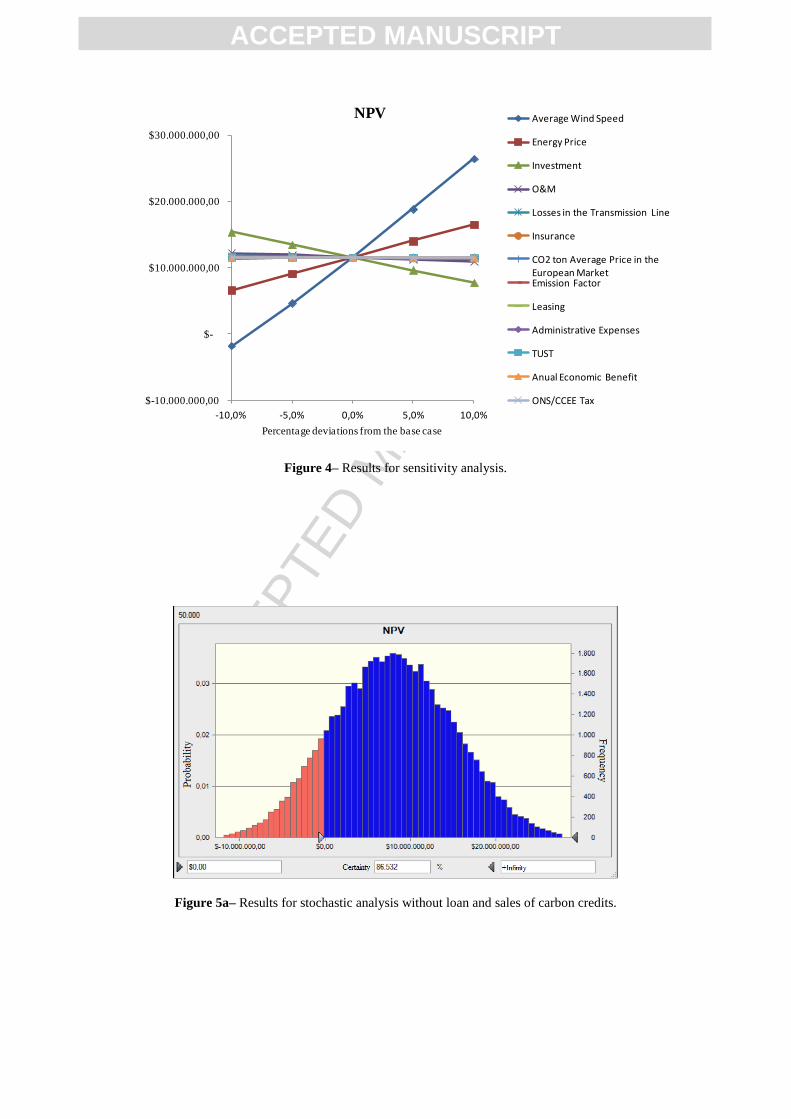
4.3. Sensitivity analysis
In this study, all the relevant cash flow model input variables are changed by -10% to
+10% interval regarding to their base values from the deterministic case. These variations
will cause an impact in the project NPV. Variables that impact more the NPV results are
selected and represented in the stochastic analysis as random variables. Variables with
smaller influence on NPVs are considered further in their base values.
Figure 4– Results for sensitivity analysis.
Figure 4 refers to the sensitivity analysis results. It is possible to notice that the most
significant variables for the wind farm project are: local wind speed, energy prices, and
investment costs. In Section 4.4 uncertainties are added in these parameters through different
probability distributions and we use MCS in order to perform the stochastic analysis and
compute the project NPV. Uncertainties regarding price and amount of the contracted energy
ACC
EPTE
D M
ANU
SCR
IPT
ACCEPTED MANUSCRIPT
will not be incorporated since the regulated environment neutralizes these variables, which is
characterized by energy auctions, decreasing risks and producer uncertainties.
Table 5 shows the probability distributions and their respective parameters for main
variables that we incorporate uncertainties.
Table 5 – Probability distribution adopted for the investment, MCP and Annual Reference Value.
The distribution of MCP values was defined from the software adjustment function
(goodness of fit) in which the simulations were performed (SANCHEZ et al., 2004). For this,
the MCP series from January 2008 to August 2015 were collected and the Gamma
distribution was the best suitable function to represent the data series.
For the Annual Reference Value, since there is only one series for a few years in the
country, a triangular distribution was chosen with the minimum and maximum values being
the smallest and largest values already observed, and the most likely value is set to be the one
related to the year when the analysis was carried out.
Finally, for the investment values, a triangular distribution is also adopted, since
between 2014 and 2015 the number of projects contracted in auctions were not enough to
create a well sized time series. The parameters are based on the investment value of the
projects contracted between the years of 2014 and 2015.
Table 6 separately presents average wind speeds and scale parameter (C) of the
Weibull distribution used to represent the wind speed in each month of the year.
The parameter used for the Weibull distribution form factor (k) is equal to 2.41,
which is equivalent to the smaller value with two decimal places within the 2.4 < k < 3.7
interval indicated by the follow-up report of anemometric measurements from EPE (2013b)
for Bahia state. The smallest possible parameter with two decimal places is chosen because a
smaller form factor (k) results in a more conservative analysis. For the C variable, we use

ACC
EPTE
D M
ANU
SCR
IPT
ACCEPTED MANUSCRIPT
Equation 2 for the parameters choice, with the values of v shown in Table 5, and the values
of gamma ( ) based on Custodio (2013).
Table 6 – Probability distribution used to represent wind speed in each month of the year.
4.4. Stochastic analysis and VaR
After the incorporation of uncertainties in each one of the variables described in
Tables 4 and 5, 50,000 simulations were performed to obtain NPV results for three scenarios
analyzed. The investment analysis and the energy production calculation were structured in
an Excel spreadsheet, and later Crystal Ball software was used to perform the MCS. Then,
through the obtained series of NPVs, parameters are collected and used in the VaR analysis
in order to identify the worst loss expected by the electricity producer in each scenario.
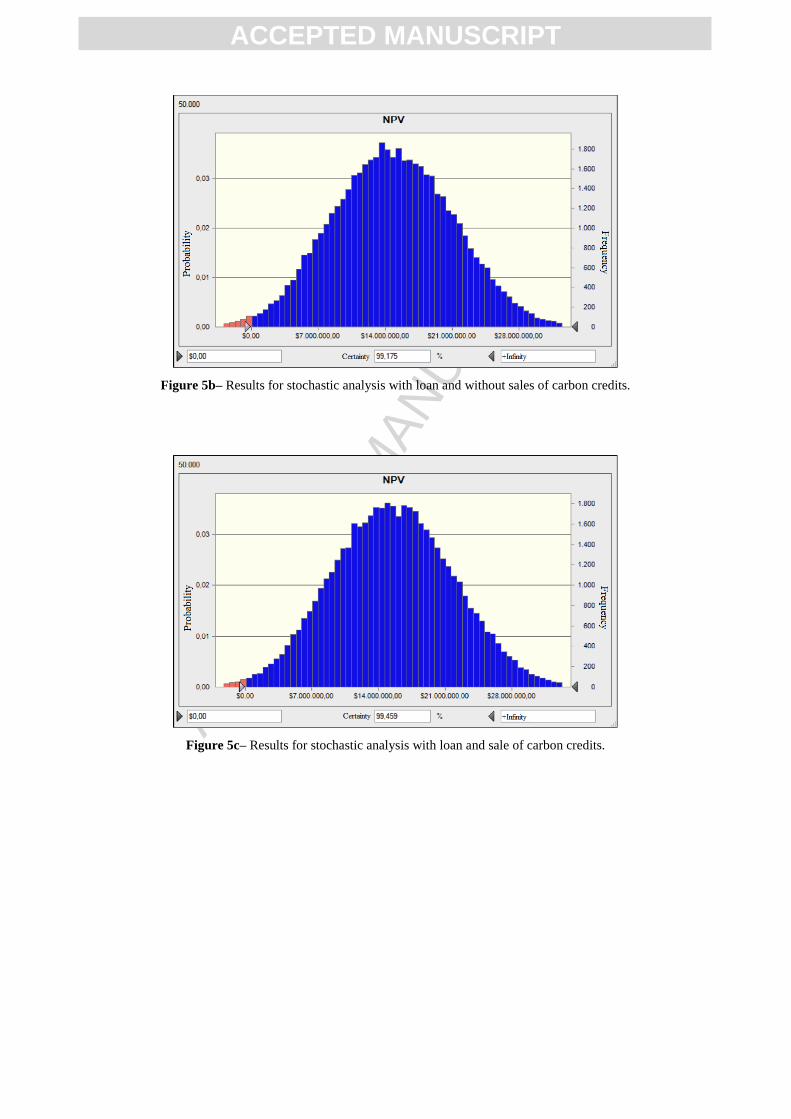
Figures 5a, 5b, and 5c show the results for project feasibility probability in each scenario.
Figure 5a– Results for stochastic analysis without loan and sales of carbon credits.
Figure 5b– Results for stochastic analysis with loan and without sales of carbon credits.
Figure 5c– Results for stochastic analysis with loan and sale of carbon credits.
First, it should be noted that, different of pure deterministic analysis, stochastic
feasibility analysis allows us to identify scenarios and consider in the analysis with NPV
values smaller than zero, indicating economic infeasibility for projects. However, in the three
scenarios analyzed it is possible to notice that the probability of the project being viable is
larger than the opposite case.
Results obtained through the stochastic analysis reinforce the important role of
BNDES loans as a complementary strategy for long-term contracts with a portion of fixed
remuneration, as it occurs with enterprises hired through auctions. Without financing lines
the probability of the project to be feasible would be of 86.53%, while the probability of
feasibility goes up to 99.17% in the scenario that considers financing without trading carbon
credits.
ACC
EPTE
D M
ANU
SCR
IPT
ACCEPTED MANUSCRIPT
Similar to Aquila et al. (2016), the Levene test was performed with significance level
of 5%, as a hypothesis test to verify if the variances between the scenarios analyzed presented
a statistically significant difference. The results of the Levene test are shown in Table 7. The
p-value of less than 0.05 for the comparison of the scenarios A x B and A x C reinforces the
importance of the loans to reduce the risk of the wind power producer. It is still possible to
highlight that the p-value above 0.05 for the Comparison B x C indicate that the possibility of
trading carbon credits does not contribute statistically to risk reduction.
Table 7–Levene’s test results.
In addition, the presence of a loan guarantees a higher average return for the investor,
as it is observed in Table 8. The standard deviation for the returns in all scenarios, including
the scenario that considers participation in the CDM, reveals a dispersion regarding the
average between US$25 to US$28 millions, which indicates volatility and a consequent risk
in relation to the returns of the producer due to exposure in the STM.
With regards to the results of project feasibility certainty, considering participation in
the CDM, it is verified that the feasibility influence goes from 99.17% to 99.46%. Therefore,
there is a significant increase in feasibility certainty, as it occurred with the increase of NPV
observed in the deterministic analysis. However, it is possible to notice that the standard
deviation does not decrease with participation in the CDM, and it is even higher than in that
scenario without participation, which indicates that selling carbon credits is not the most
efficient mechanism to reduce the risks in this market.
In terms of the VaR application, the series of results presented a p-value higher than
0.05 in all cases, which proves the normal adjustment for the distribution curve, for this
reason, the parametric VaR is chosen and calculated using Equation 11. The data shown on
Table 8 reveals that results in scenarios with financing lines reduce the expected worst loss,
ACC
EPTE
D M
ANU
SCR
IPT
ACCEPTED MANUSCRIPT
bringing the result to an expected worst gain. The scenarios where carbon credits sales are
considered reveal an increase in the expected worst gain.
Table 8– Results for expected average return, standard deviation, p-value and VaR.
Another important finding regarding the STM is that the possible settlement of
differences can provide smaller NPV results than those observed in the deterministic analysis.
The presented results are only achievable in a framework that represents the exposure of the
power plant to the STM with the resource of MCS.
Considering the settlement of the differences, the VaR results obtained with the
proposed model is more appropriate for the circumstances in which the wind energy producer
is inserted in Brazilian market. It should also be pointed out that the VaR results reinforce the
importance of the loan for risk reduction, since in scenarios which loans are considered, the
worst-case scenario is characterized by a positive value. The inclusion of carbon credit trades
also contributes to an increase in VaR results for the producer, though not as relevant as in
the scenarios with loans.
From the point of view of renewable energy investors, investment risks are associated
with a possible lack to compete for new technologies with respect to conventional ones, since
they depend on the availability of random natural resource. Thus, policies such as BNDES
loans and long-term auctions, which contribute to increase the chance of project viability, are
fundamental to attracting investments with financial return security. Another point associated
with the investment risk to the investor is potential changes in the legislation that will
eventually modify contract basis, however, this type of risk is difficult to be accounted and is
not considered in this work.
Possible delays in the project initial operational date also create a risk for both: the
investor, who may have already signed electricity selling contracts; and the government, who
may consider the venture to be operating on a wrong date in planning and operational studies.
ACC
EPTE
D M
ANU
SCR
IPT
ACCEPTED MANUSCRIPT
The government is also responsible for evaluating interconnection and operational studies
considering the integration of the project, and its associated effects, into the existing power
infrastructure. As a way to mitigate energy security risks associated with the unavailability of
renewable energy ventures, the government can create actions to encourage the increase of
energy capacity reserves.
5. CONCLUSIONS
A framework for investment analysis of wind power generation under uncertainty
using MCS was presented. In the VaR calculation, the proposed methodology is capable of
incorporating generation uncertainties and the exposure of the producer in the STM. In the
performed deterministic investment analysis, the obtained results indicated an economic
feasibility for the project. Through the stochastic analysis the project shows a high
probability of economic feasibility in the three scenarios, especially when considering the
possibility of BNDES loans.
This verifies that the financial safety of the producer in the regulated environment is
high, even with the producer exposure to the STM, which impact directly in VaR results.
The inclusion of the impact of settlement of differences in investment analysis is important
and difficult to be measured for wind power generation projects in Brazil. The proposed
approach provides a model for calculating VaR considering generation uncertainties which
may be used by potential investors. The model is able to capture the impact of the
uncertainty in wind power and electricity prices in the market and use this information to
identify the worst possible expected return for the producer.
In the scenario that considers participation of the project in the CDM, we conclude
that additional revenues from sales of carbon credits can be an important source of profit for
the producer, but contribute minimally in the reduction of the investment failure risks.
Finally, but not less important, the application of VaR contributed to analyze the worst
ACC
EPTE
D M
ANU
SCR
IPT
ACCEPTED MANUSCRIPT
scenario expected from the producer's point of view. Risk management provided by VaR
indicated that the producer NPV results can reach much smaller values than those observed in
the deterministic analysis, due to uncertainties present in the investment disbursement, as
well as the exposure of the producer in the STM and to MCPs.
ACKNOWLEDGMENTS
The authors would like to acknowledge FAPEMIG, CNPq, and CAPES for financial support and incentives for
this research.
REFERENCES
ABEEÓLICA - Associação brasileira de energia eólica. Boletim de dados – Janeiro 2015, 2015. Available at:
<http://www.portalabeeolica.org.br/index.php/dados.html>. Access in: July, 2015.
AKDAG, S. A.; GULER, O. Calculation of wind energy potential and economic analysis by using Weibull
distribution—a case study from Turkey. Part 1: Weibull parameters. Energy Sources, Part B, v. 4, p.1–8, 2009.
AMARANTE, O. A. C. Atlas Eólico: Minas Gerais. Belo Horizonte: CEMIG, 2010.
ANEEL. Nota Técnica nº 22/2015-SGT/ANEEL, de 29 de janeiro de 2015. Available at:
<http://www.aneel.gov.br/aplicacoes/audiencia/arquivo/2014/023/resultado/nt_22_2015_sgt_custo_de_capital.p
df>. Access in: April, 2015.
ANEEL. Despacho nº16, de 15 de janeiro de 2015. Available at:
<https://duto.aneel.gov.br/concessionarios/taxafiscalizacao/aplicativo/default.asp?flag=2>. Access in: April,
2015.
ANEEL. Submódulo 6: Regras de repasse dos preços de contratos de compra de energia, de 1º de janeiro de
2015. Available at:
<http://www.aneel.gov.br/aplicacoes/audiencia/arquivo/2011/078/documento/submodulo_6_1_-
_limites_de_repasse.pdf >. Access in: November, 2015.
ARNOLD, U.; YILDIZ, Ö. Economic risk analysis of decentralized renewable energy infrastructures e A Monte
Carlo Simulation approach. Renewable Energy, v. 77, p. 227-239, 2015.
ARTZNER, P.; DELBAEN, F.; EBER, J-M; HEATH, D. Coherent measures of risk. Mathematical Finance,
v.9, p.203-228, 1999.
AQUILA, G.; ROCHA, L.C.; ROTELA JUNIOR, P.; PAMPLONA, E.; QUEIROZ, A. R.; PAIVA, A. P. Wind
power generation: An impact analysis of incentive strategies for cleaner energy provision in Brazil, Journal of
Cleaner Production, v. 137, p. 1100-1108, 2016.
AYODELE, T.R.; OGUNJUYIGBE, A.S.O.; AMUSAN, T.O. Wind power utilization assessment and economic
analysis of wind turbines across fifteen locations in the six geographical zones of Nigeria. Journal of Cleaner
Production, v. 129, p. 341-349, 2016.
BLANCO, M.I. The economics of wind energy. Renewable and Sustainable Energy Reviews, v.13, p.1372-
1382, 2009.
BRIGHAM, E.F; HOUSTON, J.F. Fundamentals of Financial Management. 11ed. Florence, KY: Cengage
Learning, 2007.
ACC
EPTE
D M
ANU
SCR
IPT
ACCEPTED MANUSCRIPT
CASTRO-SANTOS, L.; FILGUEIRA-VIZOSO, A.; CARRAL-COUCE, L.; FORMOSO, J.A. Economic
feasibility of floating offshore wind farms. Energy, v. 112, p. 868-882, 2016.
CCEE. Câmara de Comercialização de Energia Elétrica – O que fazemos: Preços, 2015. Available at:
<http://www.ccee.org.br/portal/faces/oquefazemos_menu_lateral/leiloes?_afrLoop=5547777042548#%40%3F_
afrLoop%3D5547777042548%26_adf.ctrl-state%3Dp6tr9dqjl_112>. Access in: May, 2015.
CCEE. Visão Geral das Operações. 94p, 2010.
COLMENAR-SANTOS, A.; CAMPIÑEZ-ROMERO, S.; PÉREZ-MOLINA, C.; MUR-PÉREZ, F.
Repowering: Na actual possibility for Wind energy in Spain in a new scenario without feed-in-tariffs.
Renewable and Sustainable Energy Reviews, v.41, p.319-337, 2015.
COPEL. Companhia Paranaense de Energia. Manual de avaliação técnico-econômica de empreendimentos
eólio-elétricos. Curitiba: LACTEC, 2007. 104p.
CUSTÓDIO, R. S. Energia Eólica para a Produção de Energia Elétrica. 2ªed. Rio de Janeiro: Synergia, 2013.
319p.
DAHLGREN, R. Risk Assessment in Energy Trading. IEEE Transactions on Power Systems, v.18, n.2, p.503-
511, 2003.
DALBEM , M.C; BRANDÃO, L.E.T; GOMES, L.L. Can the regulated market foster a free market for wind
energy in Brazil? Energy Policy, v.66, p.303-311, 2014.
DAMODARAN, A. Betas by sector (US). January 2015. Available at:
<http://people.stern.nyu.edu/adamodar/New_Home_Page/datafile/Betas.html >. Access in: February, 2015.
DEL RÍO, P. Back to the future? Rethinking auctions for renewable electricity support. Renewable and
Sustainable Energy Reviews, v.35, p.42-56, 2014.
DUTRA, R.M; SZKLO, A.S. Incentive policies for promoting wind power production in Brazil: Scenarios for
the Alternative Energy Sources Incentive Program (PROINFA) under the New Brazilian electric power sector
regulation. Renewable Energy,v.33, p.65-76, 2008.
ERTÜRK, M. The evaluation of feed in tariff regulation of Turkey for onshore wind energy based on the
economic analysis. Energy Policy, v.45, p.359-367, 2012.
FARIA, E; BARROSO, L.A; KELMAN, R; GRANVILLE, S; PEREIRA, M.V. Allocation of Firm-Energy
Rights Among Hydro Plants: An Aumann–Shapley Approach. IEEE Transactions on Power System, v. 24, n. 2,
p. 541-551, 2009.
FIDELIS, N.F; ROSA, L.P; FREITAS, M.A.V; PEREIRA, M.G. Wind energy in Brazil: From the power
sector’s expansion crisis model to the favorable environment. Renewable and Sustainable Energy Reviews, v.
22, p.686-697, 2013.
GRIESER, B.; SUNAK, Y.; MADLENER, R. Economics of small wind turbines in urban settings: An empirical
investigation for Germany. Renewable Energy, v. 78, p. 334-350, 2015.
HEMMATI, R.; SABOORI, H.; SABOORI, S. Stochastic risk-averse coordinated scheduling of grid integrated
energy storage units in transmission constrained wind-thermal systems within a conditional value-at-risk
framework. Energy, v.113, p.762-775, 2016.
HOLDERMANN, C.; KISSEL, J.; BEIGEL, J. Distributed photovoltaic generation in Brazil: An economic
viability analysis of small-scale photovoltaic systems in the residential and commercial sectors. Energy Policy,
v.67, p.612-617, 2014.
HUNG, JC.; LEE, MC.; LIU, HC. Estimation of value-at-risk for energy commodities via fat-tailed GARCH
models. Energy Economics, v.30, p.1173-1191, 2008.
ISLAM, MEKHELIEF. Progress and recent trends of wind energy technology. Renewable and Sustainable
Energy Reviews, v.21, p.456-468, 2013.

ACC
EPTE
D M
ANU
SCR
IPT
ACCEPTED MANUSCRIPT
JIANG, Y.; NAN, Z.; YANG, S. Risk assessment of water quality using Monte Carlo simulation and artificial
neural network method. Journal of Environmental Management, v.122, p.130-136, 2013.
JORION, P. Value at Risk – A nova fonte de referência para o controle de risco do Mercado. 2ª Edição. São
Paulo: Bolsa de Mercados e Futuros: 1999. 305p.
JORION, P. How informative are Value at Risk disclosures? The Accounting Review, v.77, n.4, p.911, 2002.
JUÁREZ, A.A; ARAUJO, A.M; ROHATGI, J.S; OLIVEIRA FILHO, O.D.Q. Development of wind power in
Brazil: Political, social and technical issues. Renewable and Sustainable Energy Reviews, v.39, p.828-834,
2014.
JUSTUS, C. G.; HARGRAVES, W. R.; MIKHAIL, A.; GRABER, D. Methods for Estimating Wind Speed
Frequency Distributions. Journal of Applied Meteorology and Climatology, v.17, p.350–353, 1978.
LA ROCQUE, E .C.; WERLANG, S .R.; COELHO, F. Risco de Mercado – Gestão de Risco de Mercado em
Empresas Não - Financeiras. 47p. Documento Preliminar, 2003.
LI, C.-B.; LU, G.-S.; WU, S. The investment risk analysis of wind power project in China. Renewable Energy,
v. 50, p. 481-487, 2013.
MACEIRA, M.E.P; TERRY, L.A; COSTA, F.S; DAMÁZIO, J.M; MELO, A.C.G. Chain of optimization
models for setting the energy dispatch and spot price in the Brazilian system. In: Proceedings of the Power
System Computation Conference – PSCC. 2002. p.24-28.
MASTROPIETRO, P.; BATLE, C.; BARROSO, L.A; RODILLA, P. Electricity auctions in South America:
Towards convergence of system adequacy on RES-E support. Renewable and Sustainable Energy Reviews,
v.40, p.375-385, 2014.
MARTINS, D.E.C; SEIFFERT, M.E.B; DZIEDZIC M. The importance of clean development mechanism for
small hydro power plants. Renewable Energy, v.60, p.643-647, 2013.
MARTINS, F.R; PEREIRA, E.B. Enhancing information for solar and wind energy technology deployment in
Brazil. Energy Policy, v.39, p.4378-4390, 2011.
MINISTÉRIO DE CIÊNCIA E TECNOLOGIA – MCT. Arquivo dos fatores de emissão. Available at:
<http://www.mct.gov.br/index.php/content/view/321144.html>. Access in: March, 2015.
MONTES, G.M; MARTIN, E.P; BAYO, J.A; GARCIA, J.O. The applicability of computer simulation using
Monte Carlo techniques in windfarm profitability analysis. Renewable and Sustainable Energy Reviews, v.15,
p.4746-4755, 2011.
PEÑA, I.; AZEVEDO, I.L; FERREIRA, L.A.F.M. Economic analysis of the profitability of existing wind parks
in Portugal. Energy Economics, v.45, p.353-363, 2014.
PEREIRA, M.G.; CAMACHO, C.F; FREITAS, M.A.V; DA SILVA, N.F. The renewable energy in Brazil:
current status and potential. Renewable and Sustainable Energy Reviews, v.16, p.3786-3802, Apr. 2012.
RAMADAN, H.S. Wind energy farm sizing and resource assessment for optimal energy yield in Sinai
Peninsula, Egypt. Journal of Cleaner Production, In Press, 2017.
REN 21. Global Status Report-Key Findings, 2015. Available at:
<http://www.ren21.net/ren21activities/globalstatusreport.aspx > Access in: April, 2015.
SAFARI, B.; GASORE, J. A statistical investigation of wind characteristics and wind energy potential based on
the Weibull and Rayleigh models in Rwanda. Renewable Energy, v. 35, p. 2874-2880, 2010.
SANCHEZ, D. P.; RODRIGUEZ, I.M.; MUNOZ, W.Z. Crystal Ball Software de Analisis y Simulacion de
Riesgo. Universidad Nacional de Colombia, Bogotá, 2004.
SCHMIDT, J.; LEHECKA, G.; GASS,V.; SCHMID, E. Where the wind blows: Assessing the effect of fixed
and premium based feed-in tariffs on the spatial diversification of wind turbines. Energy Economics, v.40,
p.269-276, 2013.

ACC
EPTE
D M
ANU
SCR
IPT
ACCEPTED MANUSCRIPT
SIGNORINI, G.; ROSS,R.B; PETERSON, H.C. Governance strategies and transaction costs in a renovated
electricity market. Energy Economics, v.52, p.151-159, 2015.
SIMONS, P.J.; CHEUNG, W.M. Development of a quantitative analysis system for greener and economically
sustainable wind farms. Journal of Cleaner Production, v. 133, p. 886-898, 2016.
SILVA, N.F; ROSA, L.P; FREITAS, M.A.V; PEREIRA, M.G. Wind energy in Brazil: From the power sector’s
expansion crisis model to the favorable environment. Renewable and Sustainable Energy Reviews, v.22, p. 686-
697, 2013.
SOLANGI K.H; ISLUM M.R; SAIDUR R.; RAHIM N.A; FAYAZ H. A review on global energy policy.
Renewable and Sustainable Energy Reviews, v. 15, p.2149-2163, Jan.2011.
TZIRALIS, G.; KIRYTOPOULOS, K.; RENTIZELAS, A.; TATSIOPOULOS, I. Holistic investment
assessment: optimization, risk appraisal and decision making. Managerial and Decision Economics, v.30,
p.393-403, 2009.
UNFCCC – UNITED FRAMEWORK CONVENTION ON CLIMATE CHANGE. Guidelines on the
assessment of investment analysis, 2012.
WACHSMANN, U.; TOMALSQUIM, M.T. Wind power in Brazil – transition using German experience.
Renewable Energy, v.28, p.1029-1038, 2003.
WALTERS, R.; WALSH, P. Examining the financial performance of micro-generation wind projects and the
subsidy effects of feed-in tariffs for urban locations in the United Kingdom. Energy Policy, v.39, n.9, p.5167-
5181, 2011.
WILLIAMS, D.G. Scenario simulations do not yield results stochastically consistent with alternative Monte
Carlos results: U.S. nuclear plant decommissioning funding adequacy. Energy Economics, v.29, n.5, p.1101-
113, 2000.
YAMAI, Y.; YOSHIBA, Y. Value at Risk versus expected shortfall: A practical perspective. Journal of
Banking and Finance, v.29, n.4, p.997-1015, 2005.
ACC
EPTE
D M
ANU
SCR
IPT
ACCEPTED MANUSCRIPT
Figure 1– Settlement of the difference between the energy hired and the energy verified in the STM.
Figure 2 – Procedures performed in the investment analysis.
70%
15%
10%
5%
Wind Turbines
Civil Construction
Eletric Network
Project and Administration
Figure 3– Composition of the investment costs in a wind farm in Brazil.
Source: Adapted from Custódio (2013).
ACC
EPTE
D M
ANU
SCR
IPT
ACCEPTED MANUSCRIPT
$-10.000.000,00
$-
$10.000.000,00
$20.000.000,00
$30.000.000,00
-10,0% -5,0% 0,0% 5,0% 10,0%
Percentage deviations from the base case
NPV Average Wind Speed
Energy Price
Investment
O&M
Losses in the Transmission Line
Insurance
CO2 ton Average Price in the European MarketEmission Factor
Leasing
Administrative Expenses
TUST
Anual Economic Benefit
ONS/CCEE Tax
Figure 4– Results for sensitivity analysis.
Figure 5a– Results for stochastic analysis without loan and sales of carbon credits.
ACC
EPTE
D M
ANU
SCR
IPT
ACCEPTED MANUSCRIPT
Figure 5b– Results for stochastic analysis with loan and without sales of carbon credits.
Figure 5c– Results for stochastic analysis with loan and sale of carbon credits.

ACC
EPTE
D M
ANU
SCR
IPT
ACCEPTED MANUSCRIPT
Table 1- CP x Wind speed
CP Wind Speed
0 0
0 1
0.12 2
0.29 3
0.4 4
0.43 5
0.46 6
0.48 7
0.49 8
0.5 9
0.49 10
0.42 11
0.35 12
0.29 13
0.23 14
0.19 15
0.15 16
0.13 17
0.11 18
0.09 19
0.08 20
0.07 21
0.06 22
0.05 23
0.05 24
0.04 25
Source: Aquila et al. (2016)

ACC
EPTE
D M
ANU
SCR
IPT
ACCEPTED MANUSCRIPT
Table 2 – Structure of a wind power plant cash flow.
Gross sale balance and additional balances from liquidation of differences
Balance from CDM
(-) taxes proportional to balance
Liquid balance
(-) sector taxes
(-) leasing
(-) O&M costs
(-) additional costs for liquidation of differences
Gross result
(-) expenses with insurance
(-) general and administrative expenses
(-) depreciation
Results before tax over legal entity / social contribution over the liquid profit and financial expenses
(-) financial expenses
Profit before tax over legal entity / social contribution over the liquid profit
(-) tax over legal entity / social contribution over the liquid profit
Net profit after income tax
(+) depreciation
(-) amortization of financing
(-) investment

ACC
EPTE
D M
ANU
SCR
IPT
ACCEPTED MANUSCRIPT
(+) release of financing
(+) terminal value
Cash flow
ACC
EPTE
D M
ANU
SCR
IPT
ACCEPTED MANUSCRIPT
Table 3– Data regarding the analyzed wind power plant project.
Parameter Value
Investment US$ 47,701,655.84
Project useful life 20 years
Installed power capacity 30 MW
Price for energy sale 57.62 [US$/MWh]
Operation hours of the power plant per year 8760 hours
Physical guarantee of energy supply 13 MW
Leasing 1% of the investment
O&M costs (includes administrative expenses) 12% of the gross revenue
Transmission wheeling charges (TUST) 0.87 [US$/MW] of power
CCEE Tax 6.49 [US$/kW] of contracted energy
ONS Tax 25.97 [US$/kW] of contracted energy
ANEEL Tax US$ 22,552.99 per year
Insurance expenses 0.30% of the investment
Power plant depreciation 5% of the investment, except pre-
operational costs
Deferral of pre-operational expenses 20% of pre-operational expenses
Tax over gross revenue 7.60% (Cofins) and 1.65% (PIS)
Tax over legal entity 25% over 8% of the gross revenue
Social contribution over the liquid profit 9% over 12% of the gross revenue
Deadline for payment of financing (years) 16 years (shortgage 6 mounths)
Loan interest rate (without inflation) 3.76%
Discount rate - WACC [%] (without inflation) 6.99%
Emission factor 0.1355 kg (CO2)/kWh
Price per ton of carbon € 7.46
Euro exchange rate US$ 1.12
CDM annual registration rate US$ 1,594.74

ACC
EPTE
D M
ANU
SCR
IPT
ACCEPTED MANUSCRIPT
Table 4– Deterministic analysis results.
Scenario NPV Results
A US$ 3,886,824.39
B US$ 11,307,280.21
C US$ 12,037,510.23
Table 5 – Probability distribution adopted for the investment, MCP and Annual Reference Value.
Variable Distribution Distribution Parameters
Investment Triangular (32,467,532.47; 47,701,655.8; 61,688,311.69)
MCP Gamma (7.13; 154.99; 0.55)
Annual Reference Value Triangular (25.97; 38.96; 48.70)
Table 6 – Probability distribution used to represent wind speed in each month of the year.
Month Monthly average wind speed Weibull Parameters (c ; k)
January 8.375 (9.44; 2.41)
February 9.158 (10.33; 2.41)
March 9.063 (10.22; 2.41)
April 7.895 (8.90; 2.41)
May 8.640 (9.74; 2.41)
June 9.266 (10.45; 2.41)

ACC
EPTE
D M
ANU
SCR
IPT
ACCEPTED MANUSCRIPT
July 9.881 (11.14; 2.41)
August 10.297 (11.60; 2.41)
September 10.079 (11.36; 2.41)
October 9.761 (11.00; 2.41)
November 7.402 (8.35; 2.41)
December 7.038 (7.94; 2.41)

ACC
EPTE
D M
ANU
SCR
IPT
ACCEPTED MANUSCRIPT
Table 7– Levene’s Test Results.
Scenario Confidence Interval (95% for StDevs) P-value
A x B
A: (6,979,003.14; 7,061,340.89)
0,000
B: (6,319,645.74; 6,396,031.64)
A x C
A: (6,979,003.14; 7,061,340.89)
0,000
C: (6,300,663.95; 6,376,256.21)
B x C
B: (6,319,645.74; 6,396,031.64)
0,574
C: (6,300,663.95; 6,376,256.21)
Table 8– Results for expected average return, standard deviation, p-value and VaR.
Scenario Average Standard
deviation
P-value VaR
A US$ 7,825,270.80 US$ 7,019,913.71 0.13 - $ 3,721,458.73
B US$ 14,862,525.76 US$ 6,357,599.36 0.18 $ 4,405,205.38
C US$ 15,545,541.92 US$ 6,338,223.16 0.12 $ 5,120,092.56
ACC
EPTE
D M
ANU
SCR
IPT
ACCEPTED MANUSCRIPT
HIGHLIGHTS
Settlement of differences in power generation is regarded by the investment analysis.
Stochastic analysis incorporates the generating uncertainty in investment analysis.
The impact of loan and trading of carbon credits in project risk is assessed.
The value at risk is applied to evaluate the worst outcome expected by the producer.
Loan has an important function of to reduce the investments risk in wind farms.