wind integrated compressed air energy storage … · wind integrated compressed air energy storage...
TRANSCRIPT

WIND INTEGRATED COMPRESSED AIR
ENERGY STORAGE IN COLORADO
by
RICHARD DAVID MOUTOUX
BS University of Virginia, 1999
MS University of Virginia, 2004
A thesis submitted to the
Faculty of the Graduate School of the
University of Colorado in partial fulfillment
of the requirements for the degree of
Master of Science
Department of Electrical Engineering
2007

This thesis entitled:
Wind Integrated Compressed Air Energy Storage in Colorado
written by Richard David Moutoux
has been approved for the Department of Electrical Engineering
_______________________________________________
Dr. Frank Barnes, Committee Chair
_______________________________________________
Dr. Michael Hannigan, Committee Member
_______________________________________________
Dr. Fred Glover, Committee Member
Date: _________________
The final copy of this thesis has been examined by the signatories, and we
find that both the content and the form meet acceptable presentation standards
of scholarly work in the above mentioned discipline.

ABSTRACT
Global concerns over climate change and sustainability have led to a
recent worldwide push towards electricity derived from renewable and sustainable
resources. In Colorado, a renewable portfolio standard has led to a huge upsurge
in the development of wind generated electricity. This energy source is by nature
intermittent and, therefore, must be backed up by some type of reliable generator.
Energy storage can be used to make wind a reliable resource that can be depended
on when needed.
Compressed Air Energy Storage (CAES) is a technology used for large-
scale energy storage. Energy is stored by using electricity to compress air in a
large underground cavern, and then is recaptured using a modified natural gas
turbine. Colorado has many locations that may have suitable geology to create a
cavern for CAES. These geological features include salt domes, bedded salt,
aquifers, hard rock mines, and natural gas wells. This thesis investigates some of
these potential CAES locations and determines possible sites for a CAES facility.
An energy storage system will only be built if it makes economic sense.
To do this it must be shown to have a good chance of making a profit, and it must
be the lowest cost option to get the job done. Economic models are developed in
this thesis to determine if a wind integrated CAES facility can create profit by
allowing the wind energy to be sold at peak midday values for reliable energy.
The modeling shows that this should be a profitable venture. A CAES facility in
Colorado makes economic sense and would be an excellent asset for mitigating
the problems associated with the intermittency of wind energy generation.
iii

ACKNOWLEDGEMENTS
This thesis project has provided me with an excellent learning experience
and a unique opportunity to interact with professionals in industry and
government as a graduate student. Few thesis projects have the practical
implications and exposure to the work world that this one has provided for me. I
would like to thank Dr. Frank Barnes for providing me with the opportunity to
work on this project, for serving as my academic and research advisor, and for all
of the stories he has told me. I truly appreciate working for someone with his
perspective.
I would also like to thank Jonah Levine and Gregory Martin for everything
that they have helped me with through these last two years. The three of us have
made an excellent working team, and each of us brings different skills which
seem to compliment the others very well. All of our theses were better due to the
collaboration with each other.
There are many other people I would like to thank, and some I will surely
leave out by accident. Thanks to Dr. Dag Nummedal and CERI for funding this
project, Dr. Carl Koval and the CU Energy Initiative for funding, Dr. Lakshman
Guruswamy, Kevin Doran, and the rest of the CEES at the CU Law School for
assistance, Dr. Ewald Fuchs for his advisement, Kunal Shah for the help he has
provided this semester as these projects transition, and many others. Finally,
thanks to all my family and friends for always sticking by me, supporting me, and
believing that I could finally do a thesis on time.
iv
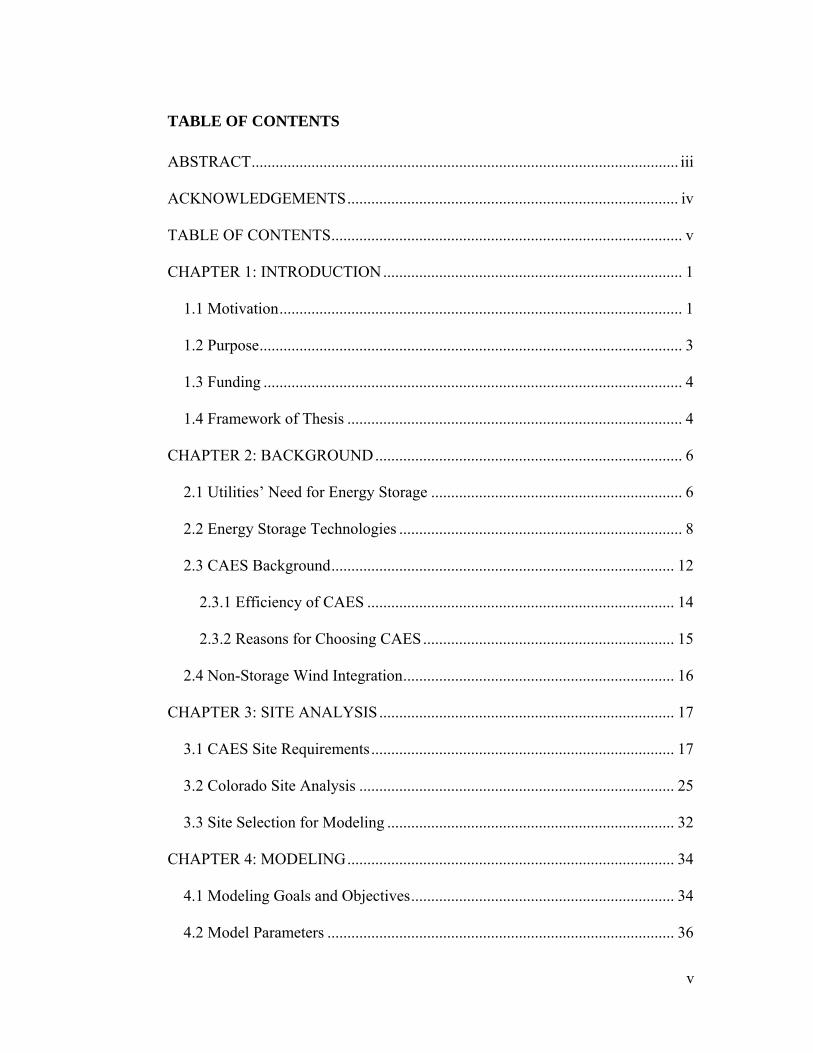
TABLE OF CONTENTS
ABSTRACT........................................................................................................... iii
ACKNOWLEDGEMENTS................................................................................... iv
TABLE OF CONTENTS........................................................................................ v
CHAPTER 1: INTRODUCTION........................................................................... 1
1.1 Motivation..................................................................................................... 1
1.2 Purpose.......................................................................................................... 3
1.3 Funding ......................................................................................................... 4
1.4 Framework of Thesis .................................................................................... 4
CHAPTER 2: BACKGROUND............................................................................. 6
2.1 Utilities’ Need for Energy Storage ............................................................... 6
2.2 Energy Storage Technologies ....................................................................... 8
2.3 CAES Background...................................................................................... 12
2.3.1 Efficiency of CAES ............................................................................. 14
2.3.2 Reasons for Choosing CAES............................................................... 15
2.4 Non-Storage Wind Integration.................................................................... 16
CHAPTER 3: SITE ANALYSIS.......................................................................... 17
3.1 CAES Site Requirements............................................................................ 17
3.2 Colorado Site Analysis ............................................................................... 25
3.3 Site Selection for Modeling ........................................................................ 32
CHAPTER 4: MODELING.................................................................................. 34
4.1 Modeling Goals and Objectives.................................................................. 34
4.2 Model Parameters ....................................................................................... 36
v

4.2.1 Model Inputs ........................................................................................ 36
4.2.2 Model Outputs ..................................................................................... 37
4.3 Data ............................................................................................................. 37
4.4 Model Formulation ..................................................................................... 40
4.5 Modeling Software...................................................................................... 43
4.6 Model Results ............................................................................................. 44
4.6.1 Single site model.................................................................................. 44
4.6.2 Five site model..................................................................................... 46
4.7 Results and Analysis ................................................................................... 48
4.7.1 Sensitivity Analysis ............................................................................. 49
4.7.2 Gas Turbine Comparison ..................................................................... 51
CHAPTER 5: CONCLUSIONS ........................................................................... 54
5.1 Future Work ................................................................................................ 55
REFERENCES ..................................................................................................... 56
vi

CHAPTER 1: INTRODUCTION
Electrical energy storage is a problem engineers and scientists have been
working on for over 100 years. Consumers have been waiting for years for
batteries that will last longer, and utilities have been searching just as long for
affordable large-scale storage that will allow them to run generators at a constant
rate rather than ramping up and down with demand. With the recent increase in
electricity generation from intermittent renewable resources (wind and solar),
these utilities have yet another level of complexity to deal with. This thesis
examines the need for utility-scale energy storage to mitigate intermittent
renewable generation, and then examines Compressed Air Energy Storage
(CAES) as a practical solution to this problem.
1.1 Motivation
In recent years there has been a worldwide push towards deriving
electricity from renewable and sustainable resources. This push comes as a result
of many concerns, including the depletion of fossil fuels, pollution, and climate
1

change. Wind and solar energy have been the primary resources used to capture
renewable energy. While solar photovoltaic panels are excellent for individual
home applications and solar concentrating power plants have been built in some
desert areas, economics have allowed wind turbines to become the primary
method of producing electricity from clean, renewable resources. The cost of
electricity produced from large-scale wind turbines is now in line with the cost of
electricity produced from coal [1].
In addition to the economics, however, the real drive to build wind
turbines is currently coming from government mandates for clean, renewable
energy. In Colorado, voters passed State Amendment 37 in 2004, which calls for
10% of electricity to be derived from clean, renewable resources by 2015 [2].
Utilities have responded to this mandate by building several large wind power
plants on the eastern plains of Colorado, and there are currently 630 MW of wind
turbines operating in Colorado, with another 435 MW under development [3].
This will easily meet the Amendment 37 requirement, several years prior to the
required date. In 2007, the governor signed House Bill 1281, which increases this
requirement to 20% by 2020 [4].
With all of this development of wind energy (and some development of
solar energy), the intermittent nature of wind becomes a significant problem.
Utilities already struggle to meet fluctuating demand when they control the output
of the generators; adding generators that they cannot control adds significant
complexity to this problem. This problem is magnified as the penetration level of
wind energy on the utility system increases. At 10%, for example, it is not nearly
2

as great of a problem as it will be once the utility reaches 20% wind penetration.
There is not an exact break point where a solution must be found, rather, the cost
per MWh to integrate wind energy into the system increases as the penetration
level increases [5].
1.2 Purpose
The main goal of this thesis is to examine the feasibility and practicality of
Compressed Air Energy Storage (CAES) in Colorado. The feasibility question is
addressed through a CAES site analysis. CAES is a mature technology; the issue
is finding a location in Colorado where the geology exists to build a reservoir
capable of holding air at pressures high enough for CAES to work. The
practicality question is more of an economic viability study. A utility would only
build a CAES plant in Colorado if it proved to make economic sense over other
options of mitigating the problems associated with wind intermittency. This
thesis examines this question with some economic models of a wind integrated
CAES plant.
It is important to note that CAES is only one of many energy storage
solutions. Others include pumped hydroelectric energy storage (PHES), many
types of batteries, flywheels, superconducting magnetic energy storage, and
ultracapacitors. It is also important to note that energy storage is only one way to
deal with wind intermittency. Some other techniques include spinning reserves,
power wheeling, natural gas generators, and shutting down the turbines at certain
times. These alternative solutions will be further addressed later in the thesis, but
the reason for mentioning them now is to emphasize the point that for a utility
3

scale energy storage solution such as CAES to be built, it must be technically
feasible, must address the problem for which it will be built to solve, and it also
must be the most economical option, among other energy storage solutions and
alternative non-storage solutions. For this reason the majority of this thesis uses
modeling to determine the economic practicality of a CAES plant in Colorado.
1.3 Funding
Funding for this project came from the state of Colorado via the Colorado
Energy Research Institute (CERI) at the Colorado School of Mines. The grant
provided for a comprehensive study of large-scale energy storage options in the
state of Colorado by the Energy Storage Research Group at the University of
Colorado. This grant provided funding for the projects that led to three master’s
theses on energy storage: this thesis on CAES, a thesis on pumped hydroelectric
energy storage in Colorado (by Mr. Jonah Levine), and a thesis on underground
pumped hydroelectric energy storage (by Mr. Gregory Martin). Results from
these studies were presented at the 2007 Electrical Energy Storage Applications
and Technologies (EESAT) Conference, and were presented to the Colorado State
Legislature via a report submitted to CERI.
Funding for this project also came from the University of Colorado
Energy Initiative grant program.
1.4 Framework of Thesis
The two major portions of this project are the CAES site analysis and the
economic modeling of a wind integrated CAES plant. Chapter 2 gives a
4

background description of CAES and includes a literature review. Chapter 3
details the site analysis portion of the project. Chapter 4 explains the economic
models created for the project. Chapter 5 gives a summary and conclusions from
the project.
5

CHAPTER 2: BACKGROUND
Compressed Air Energy Storage is one of several energy storage options.
This chapter contains a detailed description of CAES, a review of other energy
storage options, as well as non-storage options for wind integration.
2.1 Utilities’ Need for Energy Storage
Utilities may be interested in storing electrical energy for a variety of
reasons. Some of these reasons include power quality, grid stabilization, load
following, and peak shaving. Power quality and grid stabilization are necessary to
keep the voltage and frequency of the grid within the regulated constraints. The
voltage and frequency of the grid can drop for several reasons, such as a large
motor coming on line suddenly, a generator outage, and a large demand for
reactive power. These conditions will only last for a few seconds to possibly a
minute before the grid can stabilize itself; however, low voltage or frequency can
have a devastating effect on certain loads on the system (motors and electronics
among others) and is unacceptable to the customer, so utilities must not allow it to
6

happen. Therefore one application of energy storage for utilities is a high power,
short time (high power, low energy) energy storage need that will help ride
through sags in voltage and frequency.
Another application of energy storage for utilities is load following and
peak shaving. Load following basically means using storage or peaking
generation to match demand, while peak shaving is using storage to reduce the
required generation at the highest demand times during the day. Both are
methods for optimizing the utility system and minimizing fluctuations in
generation. Energy storage can save on capital cost for both generation and
transmission in certain cases.
Load following and peak shaving may considered a large scale application
or a medium scale application. The idea is the same, but the energy storage
technology will be different. In Castle Valley, Utah, for example, a 250 kW, 350
kVa Vanadium Redox flow battery was installed at the end of a line in lieu of a
transmission upgrade because peak shaving allowed the original transmission line
to remain adequate for several more years of growth [6]. This type of flow
battery could be considered a medium power, medium energy storage technology.
When considering system wide load following and peak shaving, however, a high
power, high energy storage solution is needed.
Wind integration falls into all of these energy storage categories. The
intermittent nature of wind energy could cause under- or over-voltage and
frequency problems, so power quality is an issue. Small scale wind farms could
employ medium-level energy storage technologies to balance the intermittency of
7

wind generation. Finally, high power, high energy storage technologies could be
used to balance wind intermittency at the system-wide level when there is a
significant portion of the generation profile coming from wind. The main
difference here is large scale energy storage has been used for load following and
peak shaving, but now the additional problem of generation intermittency is added
to the problem of load fluctuation. This problem is the focus of this thesis.
2.2 Energy Storage Technologies
There are several energy storage technologies available to utilities, and
many are under development. These storage technologies all have different
purposes; some are high power, low energy, and some can provide various
amounts of energy for much longer durations. Some have no startup time
required and can truly provide grid stabilization; others have startup times in the
seconds to minutes timeframe and are much better suited to load following and
peak shaving. For any energy storage application there are usually one or two
technologies that are feasible solutions.
Batteries are probably the first thing someone thinks of when they think of
electricity storage. There are many different types of batteries, including lead-
acid, nickel-cadmium, lithium-ion, sodium-sulfur, zinc-bromine, and vanadium-
redox batteries [7]. Lead-acid batteries are the “status-quo” as they have been
around since the 19th century, but have a low energy density and power density
compared to newer technologies. Nickel-cadmium and nickel-metal hydride
batteries are an option for consumer electronics as well as medium-scale energy
storage. A 40 MW, 10 MWh energy storage system using nickel-cadmium
8

batteries for grid stabilization and backup opened in Fairbanks, Alaska in
September, 2003 [8]. Lithium-ion batteries are also a newer battery technology
with a higher energy density than lead-acid, but lithium-ion batteries are being
developed primarily for electronics and electric or hybrid-electric automobiles.
There are some new battery technologies that are more favorable for
utility-scale energy storage. NGK Insulators of Japan is now developing a 34
MW, 245 MWh sodium-sulfur battery for medium-scale load following and peak
shaving applications with wind integration [9]. Certain flow batteries (vanadium
redox and zinc bromine, for example) can produce those levels of power for
longer durations than sodium-sulfur batteries. There has been significant
development of these technologies in the past few years and utilities are beginning
to install these batteries in several locations throughout the United States.
Flywheels are another energy storage technology that can provide power
quality and voltage regulation, as well as a large amount of power for a short
duration when needed. They are a mechanical energy storage system which
stores energy in the rotating inertia of a mass. This concept has been around for
over 100 years, but commercial development has been slow. Beacon Power in
Massachusetts makes both high power and low power flywheels [10]. The high
power flywheels have a short duration (minutes), but can provide a significant
amount of power. This is the most popular application of flywheels, providing
the ancillary services of grid stabilization and spinning reserves.
Superconducting Magnetic Energy Storage (SMES) and ultracapacitors
are energy storage technologies which provide grid stabilization and voltage and
9

frequency regulation. SMES stores energy as a continuously circulating current
through a superconducting magnetic coil. An ultracapacitor is a very large
electrochemical capacitor that acts just like a conventional capacitor in a circuit,
storing energy due to an applied voltage. These technologies are unique from
other energy storage technologies discussed here because they actually store
electricity rather than converting the electricity to another form of energy and then
storing the energy in that form. They are only capable of providing power for a
few seconds, so these technologies are only used for power quality applications.
Figure 1: Energy storage technology comparison [11]
A comparison of various energy storage technologies is shown in figure 1.
Power is shown on the horizontal axis, and time on the vertical axis. Few
applications can produce high power for several hours, which is what is needed
for system wide wind integration. In fact, there are currently only two
10

technologies that are truly high-energy storage technologies: pumped
hydroelectric energy storage (PHES) and CAES.
PHES is an energy storage system which uses two reservoirs in close
proximity with significant elevation difference. When storing energy, electricity
is used to pump water from the lower reservoir to the upper reservoir. Energy is
then recaptured by running that same water through a turbine back to the lower
reservoir. Water is only lost to evaporation and seepage; there is very little net
water consumption.
PHES is an excellent option for large scale energy storage in certain
geographical locations. It is highly efficient in large scale applications, it does not
require the use of fuel, and it can be designed to be virtually as big as the builder
would like (with certain obvious construction limitations). However, it is very
difficult to site a PHES facility. There is currently nearly 20 GW of installed
PHES capacity in the United States [12], but most of that was built in the 1960’s
or before, when building large dams was a much more common practice.
Additionally, a PHES facility generally needs to be located in mountainous
terrain, therefore many areas in the United States do not have the topography to
build a PHES plant. Water rights would also have to be established in order to
build a PHES plant, despite the fact that it would not be a net user of water
(except for evaporation and seepage). With all of these issues, PHES is still an
excellent energy storage option for system-wide wind integration, but CAES may
turn out to be more acceptable.
11

2.3 CAES Background
Compressed Air Energy Storage is a mature energy storage technology
that has existed for nearly 30 years. There are currently two CAES plants
operating in the world; one in Huntorf, Germany, which open in 1978, and the
other in McIntosh, Alabama, which opened in 1991. These facilities are both
used for peak shaving and load following, but could be used for wind integration
as well. The Huntorf facility is a 290 MW facility, but only has the reservoir
capacity to generate for 2-3 hours per cycle. The McIntosh facility can is a 110
MW facility with a reservoir capacity of 19 million cubic feet, which allows it to
generate for 26 hours per charge [13]. Additional facilities are under
development. A large CAES facility (2700 MW) is planned in Norton, Ohio [14],
but economics have stalled this project for several years. The Iowa Stored Energy
Park is developing a CAES plant, with plans to integrate it with a wind energy
project as well [15].
CAES stores energy by using off-peak electricity to power a motor, which
drives a compressor that compresses air into an underground reservoir. Energy is
recaptured by expanding the compressed air through a high pressure air turbine
(not a gas turbine), then mixing the exhaust from the high pressure turbine with
natural gas, and finally firing the mixture in a low pressure natural gas turbine.
Waste heat from the exit of the low pressure turbine is passed through a heat
exchanger as the air comes out of the reservoir to preheat the compressed air and
improve efficiency. The high pressure air turbine reduces technical risk by
dropping the pressure of the air before mixing it with fuel, and without it the
12

pressure in the cavern would have to be reduced to allow the low pressure gas
turbine to operate reliably [16].
CAES is considered a hybrid generation/storage system because of the use
of natural gas as fuel in the process. However, the natural gas input is much lower
than with a conventional gas turbine. CAES requires approximately 0.7-0.8 kWh
off-peak electricity and 4100-4500 Btu (1.2-1.3 kWh) natural gas to produce one
kWh of dispatchable electricity [16,17]. This compares with a heat rate of
roughly 11,000 Btu/kWh for conventional natural gas turbines. A generic
diagram of how CAES works is shown in figure 2.
Figure 2: Generic diagram of CAES operation [16]
13

2.3.1 Efficiency of CAES
Efficiency calculations for CAES are not a simple round-trip (energy out
divided by energy in) calculation, because of the addition of natural gas to the
process. Round trip efficiency could be calculated in two different ways, and in
this example the midpoints of these ranges of electricity and natural gas input
(0.75 kWh and 4300 Btu) are used. The first method is to assume that all energy
inputs (electricity and natural gas) are the same. Under that assumption, 1 kWh of
electricity requires 0.75 kWh of off-peak electricity plus 4300 Btu (1.26 kWh) of
natural gas, or 2.01 kWh. This gives a total efficiency of 50%. This is a
scientifically accurate way to calculate efficiency; however, equating the chemical
potential energy of natural gas to electrical energy is a bit unfair, because natural
gas (or any energy source used to produce electricity from a thermal cycle) will
always have a very low (20-40%) conversion efficiency.
Another way to calculate the round trip efficiency of CAES is to assume
that the natural gas would otherwise be used to produce electricity, and then
determine how much electricity that natural gas would produce. This allows for
comparison of electrical energy to electrical energy, which is more of an “apples
to apples” comparison. Using the above heat rate of 11,000 Btu/kWh, the gas
turbine would produce 0.39 kWh of electricity. Adding that to the 0.75 kWh of
off-peak electricity, a theoretical total electricity input of 1.14 kWh is required to
produce 1 kWh of dispatchable electricity. This yields an efficiency of 88%.
14

2.3.2 Reasons for Choosing CAES
For a large-scale energy storage solution for wind integration, only PHES
and CAES are reasonable options. Each has distinct advantages and
disadvantages. As stated before, PHES has a good round trip efficiency, does not
use fuel, and can be built on a very large scale, but also is hard to site and has
issues with water rights. In comparison, CAES has a much smaller visible
footprint, does not require water rights or dams, is significantly cheaper, and can
be built in more places (as it does not require mountainous terrain). The major
detractions of CAES in comparison to PHES are the use of natural gas and the
efficiency, though, as stated in the previous section, efficiency is a subjective
measurement with CAES.
It is important to emphasize the cost of CAES. CAES has a very low
capital cost compared to other storage technologies, and even other generation
(non-storage) technologies. The capital cost of CAES is similar to, but a little bit
more expensive than a conventional natural gas turbine. A gas turbine has the
lowest capital cost of any electrical generator, often quoted in the $400 to
$500/kW range [7,16]. A CAES turbine is essentially a natural gas turbine with
the front-end compression part split off and operating separately with an electric
air compressor. The equipment is a bit more expensive due to economies of scale,
and the cost of the reservoir must be accounted for, but most estimates for the
capital cost of CAES are in the $600 to $700/kW range [7,16]. In the modeling
section $600/kW plus $3/kWh for the reservoir is used. Of course, these are cost
estimates, and there is evidence to show that they may be quite low.
15

2.4 Non-Storage Wind Integration
As noted in chapter 1, wind integration does not necessarily require energy
storage. Wind integration requires power quality and grid stabilization services
(not necessarily storage, but something to provide voltage and frequency
regulation during large changes in wind generation output). Wind integration also
requires a backup for when the wind is not blowing. This means that the installed
capacity of wind cannot be counted in a utility’s capacity calculations, because it
may not be available during the heaviest peak demand times. Other generators
must be built for the utility to have this capacity; the wind generation only saves
fuel, it does not save the utility from having to build additional capacity.
Typically the additional capacity will come from natural gas generators.
This is because they have a low capital cost and a short startup time; they can
literally be throttled up in seconds to meet a changing demand or a change in
wind production. Additional capacity may come from other sources, but natural
gas generators are usually used to obtain this extra capacity. Since a CAES
turbine is very similar to a natural gas turbine (in both cost and method of
operation), it is a good fit to provide the additional capacity for wind integration.
The point here is that energy storage will be used for wind integration only
if it makes economic sense. If using a natural gas generator (or other options like
power wheeling) is cheaper than building a CAES plant, then that is what the
utility will do. However, if the arbitrage capability of CAES (or any storage
technology) allows it to be profitable when integrated with wind, then the storage
facility will be built. The modeling section of this thesis focuses on this question.
16

CHAPTER 3: SITE ANALYSIS
This chapter addresses the technical issues with developing a CAES plant
in Colorado. The primary concern is finding a suitable location for a cavern to
hold high pressure air. Additional issues include the proximity to transmission
lines and wind generation. Several potential locations of a CAES plant are
examined, and two locations are chosen to model in chapter 4.
3.1 CAES Site Requirements
The primary requirement to site a CAES plant is geology suitable to create
a cavern to hold air at high pressure. Additional requirements are that the site
must be acceptable for the noise that the CAES turbine will produce and that the
site must have access to an adequate source of natural gas. The noise and natural
gas requirements do limit the site selection process somewhat, but they are
secondary concerns to the main problem: finding suitable geology for a cavern to
hold air at CAES pressures.
17

While not a requirement, it would be beneficial for the site to be located
either near a significant load center or near a significant wind generation source.
This will allow for optimum utilization of transmission lines, and reducing
transmission costs will have a significant impact on the economics of the project.
Locating a CAES plant near the load or near the wind becomes an optimization
problem which will be addressed in chapter 4.
Typical cavern pressures for CAES systems range from around 500 psi
when fully discharged to 1200 psi when fully charged [13]. A 1991 report by
Cohn and Louks [18] states that suitable geological features for building a CAES
plant include salt, rock, and aquifers, and that 85% of the United States contains
one or more of these geologies and could be the location of a CAES plant. Figure
3 shows a map of the United States from Cohn and Louks showing the site
potential for CAES.
18

Figure 3: CAES site potential [18]
While each of these three geological formations has the potential to
accommodate a CAES reservoir, it is very optimistic to believe that such a
reservoir could be built in any of these locations. It is more reasonable to believe
that certain distinct features within these geologic zones may be suitable for a
CAES reservoir. Finding a specific suitable location for a CAES reservoir will
require a much more detailed geological study, but this section introduces some of
the geologic needs and issues.
19

Salt domes are arguably the best option available for a CAES reservoir.
Salt domes can be solution-mined relatively inexpensively, and this creates a very
well-sealed cavern. Salt domes are used for the caverns in both of the existing
CAES plants (in Germany and Alabama). If a salt dome is available, it would be
an excellent option for building a CAES reservoir. However, salt domes are
much less common than bedded salt. Salt beds exist in many places throughout
the country, and are noted in Cohn and Louks [18]. Salt domes are much less
frequent, as they are created when a crack in the layers above a salt bed forms and
the salt pushes up through the crack (because it is lighter). Building a CAES
reservoir in bedded salt is possible, but may be much more difficult and expensive
due to a variety of engineering issues, including the depth of the salt beds and the
possibility that thin layers of different materials may be contained within the salt.
Aquifers are the next option available, and they exist underground nearly
everywhere. A CAES reservoir in an aquifer displaces water with air through a
porous media, so there would not actually be an open cavern underground;
instead, air would displace water in earth (sand, silt, etc.). An interesting benefit
to using an aquifer for a CAES reservoir is that because the air displaces water,
the air will be held at a relatively constant pressure, and the volume of the air
pocket will change, rather than the pressure changing in a constant volume
cavern. This makes the turbine easier to design, as there is not a need to
accommodate the change in pressure from a fully charged cavern to a fully
discharged cavern.
20

The aquifer must have adequate porosity and permeability to move air in
and out at the speeds required for CAES, so this limits the choices. It also must
have an adequate cap rock, which is the impermeable layer above the reservoir
that keeps the air from escaping. This is a difficult geological question to answer,
and requires testing and modeling to determine the location and shape of the cap
rock. Ideally the cap rock would be the shape of an upside-down bowl, so this
limits the use of the aquifer as a CAES reservoir to places with a suitable cap
rock.
The Iowa Stored Energy Project is developing a CAES facility in Iowa,
with the hope of integrating it directly with wind generation. This project is using
an aquifer as the storage reservoir. They had a site selected, but testing showed
that the cap rock was not adequate, so recently they located a new site and tested
the cap rock, determining it to be of adequate shape without cracks [19]. There is
acceptable geology for using aquifers as CAES reservoirs, but it requires testing
to determine the suitability of a site, which adds time, cost, and risk to the project.
The third option for a CAES reservoir is a hard rock mine. This is an
excellent option in Colorado, due to the large number of abandoned mines
throughout the state, but has problems as well. The types of rock mined and the
fracture lines make many of these mines unsuitable to hold high pressure air, even
though they are significantly deep. The mountains of Colorado are heavily
fractured, and these fracture lines run at all angles to the surface, so it is likely that
most mines would have a fracture line leading directly to the surface that would
be exposed by high pressure air. There might not be a total loss of pressure, but
21

the leakage could be enough that the system becomes inefficient and no longer
cost effective.
The biggest problem with this leakage issue is that it is very hard to test a
mine without pressurizing it to 1200 psi. A low pressure test would not likely
expose any cracks, and a high pressure test may show leakage when there is not
any due to the first few cycles moving some things around even though it is
sealed. Additionally, a high pressure test would be very expensive, almost not
worthwhile due to the high cost. If the mine is determined to leak, it can be
treated, but this is an expensive process. A detailed geological survey is probably
the best way to determine the feasibility of an abandoned mine for a CAES
reservoir, but a survey will not guarantee the suitability of a mine [20].
In Norton, Ohio, a 2700 MW CAES plant has been in various stages of
development for the past several years [14]. The reservoir is a very large
abandoned limestone mine. Studies have shown that this mine will likely hold air
at CAES pressures, so it can be done. However, this mine has several advantages
over mines in Colorado. First, in this part of Ohio the fractures in the rock are
mostly parallel to the earth’s surface, so the likelihood of a fracture going directly
to the surface is much lower. Second, the mine is very deep, so there is more
earth to stop airflow. Third, the mine is a limestone mine, which has very low
permeability and few fractures, and it can essentially be thought of as a very solid
rock, whereas much of the rock in Colorado is more permeable and fractured.
This said, using a mine in Colorado as a CAES reservoir is a possibility,
though it may end up being expensive and financially risky. There are many
22

abandoned mines throughout the state, so this is a resource to pursue. In this
study we have identified an abandoned gold and silver mine near Georgetown,
Colorado as a possible location for a CAES system.
Another possibility for a CAES reservoir not previously mentioned is
using old natural gas wells. This would be similar to using an aquifer as a CAES
reservoir, but would be deeper and could hold air at higher pressures if needed.
This has the added benefit of possibly storing natural gas on site, which would
allow the owner to insulate themselves from fluctuations in natural gas prices.
This idea is studied in detail, with a series of reservoir simulations in the Green
River basin in Wyoming, in Neumiller [21].
The Wattenberg field of the Denver basin is the 7th largest natural gas field
in the United States [22]. It is located in Boulder, Adams, and Weld counties just
north of Denver. There are thousands of gas wells in this area, and some of them
are retired, making them possible locations for a CAES reservoir. This location is
near the major load center of the state (Denver and the Front Range), which
makes this an attractive option to pursue for a CAES facility. Figure 4 shows a
map of the Wattenberg field.
23

Figure 4: Map of the Wattenberg natural gas field [22]
Based on previous examples, CAES will work in salt domes, and places
could be found where CAES will work in aquifers. Additionally, it is likely that
certain mines will be suitable for CAES reservoirs. Other options where CAES
24

may work include bedded salt and abandoned gas wells. However, significant
geological study and technical risk are associated with all of these reservoir
possibilities, with the exception of salt domes. It is likely that the technical risks
could be mitigated if found to be a problem, but this adds time and cost to the
project. This is something that any CAES developer must consider in the
economic analysis.
3.2 Colorado Site Analysis
There are many potential locations for a CAES reservoir in Colorado. All
of the geological formations mentioned in the previous section exist in various
places throughout the state. One consideration when selecting a site is the
proximity of the site to wind generation, major load centers (Denver, but also
smaller cities), and the proximity to major transmission lines. Transmission is
very expensive, and if a CAES project required a significant transmission
upgrade, the economics would probably not work out unless that transmission
upgrade was required regardless of the CAES plant.
Proximity to wind generation would allow transmission lines coming from
wind sites on the eastern plains to be utilized to a greater extent. Without storage
or firming, transmission lines coming from wind plants are only utilized at the
capacity factor of the wind site (often in the 30-35% range). With storage
allowing the wind/storage combination to act as a baseload generator (or even a
load following generator) this transmission utilization could be significantly
increased, which could save the utility some money. This would only be the case
if the storage is located in proximity to the wind generation.
25

Conversely, if the storage is located near the load center, then the
transmission lines with low utilization (peaking generation lines) will be short,
which could also save the utility money. It becomes an optimization problem,
with the utility trying to keep the transmission system utilized as much as
possible. The utility should be able to discern from its system-wide transmission
models whether the storage best utilizes transmission if it is located in proximity
to the wind or to the load. Either way, transmission is required, so the location of
transmission lines near a CAES location is an important part of the site selection.
Because of these wind, load, and transmission requirements, the NREL
Wind Resource Map of Colorado [23] is used as the background map to locate
each potential location. These maps show the wind resource, the major cities, and
the transmission lines in the state. With the potential CAES locations noted on
the maps, all of the considerations for CAES site location are seen in one place.
There is a very large salt dome in the Paradox Basin in Montrose County,
Colorado [24]. This location lies in Southwest Colorado, far from both a good
wind resource and a load center. This is not a particularly good location for a
CAES plant from that perspective, but is a very large salt dome and could be used
to create an extremely large CAES reservoir. Since salt domes are the most
proven geology for a CAES reservoir, this is an important location to consider
despite the distance from a load center and the wind resources on the eastern
plains. Figure 5 marks the Paradox Basin in Southwest Colorado on the NREL
wind resource map.
26

Figure 5: Paradox Basin (red circle) and the Colorado wind resource map
While salt domes are the more reliable, proven geologic formation for a
CAES cavern, bedded salt may be a possibility as well. The Eastern Plains of
Colorado sit near the edge of two Geological formations containing bedded salt.
The Permian Basin Complex covers much of the panhandles of Texas and
Oklahoma, but extents into the southeastern corner of Colorado. The Northern
Nebraska Basin extends into the northeastern corner of Colorado [25]. If a CAES
cavern can be developed in bedded salt in one of these formations, it would be an
excellent location for a CAES plant due to the proximity to wind generation in
those areas of the state. Figure 6 shows a map of bedded salt formations in the
United States. It should be noted that while this map points out salt domes in
Texas, Louisiana, and Alabama, there are many smaller salt domes in other places
27

around the country. It is interesting to note that the CAES plant in McIntosh,
Alabama is located in the Gulf Coast Basin domal salt, as shown in figure 6.
Figure 6: Major salt formations in the United States [25]
Figure 7 shows the locations of these salt formations overlaid upon the
Colorado wind resource map. These formations are near the best wind resources
in the state, so if a utility determines through modeling that the best place for
energy storage is near the wind generation, these would be locations to pursue for
a CAES plant. These two areas of the state are where wind development is
already occurring, with the Peetz Table and Spring Canyon wind developments
near the Northern Nebraska Basin, and the Colorado Green wind development
near the Permian Basin.
28

Figure 7: Potential CAES locations using bedded salt reservoirs
The next option for a CAES reservoir is in an aquifer. As stated in the
previous section, an aquifer can be a suitable location for CAES provided that an
adequate cap rock (impermeable layer) is found. There are aquifers throughout
the state of Colorado. Focusing only on the Front Range and Eastern Plains (due
to the proximity to wind generation and load centers), the aquifers available
include the Denver Basin (Dawson, Denver, Arapahoe, and Laramie-Fox Hills
Aquifers), the Dakota-Cheyenne Aquifer, and the High Plains (Ogallala) Aquifer
[26]. Any of these locations likely has many suitable cap rocks for CAES, though
the geological resources would have to be spent to find a viable cap rock. For this
study a suitable aquifer location will be chosen based on the desired proximity to
wind, load, and transmission.
29

Another option in Colorado is abandoned hard rock mines. These are
plentiful throughout the state, but using a mine as a CAES reservoir adds
significant financial risk due the possibility of leakage that takes significant time
and money to correct. Mines are literally all over the mountainous areas, but for
this project a mine near Georgetown, Colorado was examined in great detail.
Clear Creek Power, LLC, is developing a wind generation site in the mountains
above Georgetown. The turbines will be located on a ridge at more than 11,000
feet above sea level. Directly below the wind site is the Capital Prize Mine, a
large abandoned gold and silver mine which is owned by CCP. The location of
this site is noted in figure 8.
Figure 8: Potential CAES site in an abandoned mine near Georgetown, CO
30

While there are question marks about the fractures and leakage in the
mine, the Georgetown site has several advantages that make it a very interesting
site for further study. First and foremost, the developer is very interested in
CAES and willing to take on the risk of a unique project. Second, the wind
development is already underway and power purchase agreements are under
negotiation. Third, the developer owns the mine and most of the land where the
turbines will go. Finally, the site has a major 230 kV transmission line running
directly adjacent to the property, so transmission is available, and Denver is fairly
close by (about 60 miles east). These factors combine to make this a very
interesting site to study, despite the risk of leakage in the mine.
Finally, natural gas wells are examined as an option for a CAES reservoir.
As discussed in the previous section, the Wattenberg gas field north of Denver is
one of the largest gas fields in the country, and makes an excellent location to
explore CAES in a depleted gas well, due to the proximity to Denver (as well as
transmission lines and some peaking natural gas plants). Adding in the possibility
of storing natural gas on site to insulate from spikes in gas prices, the Wattenberg
field is an excellent place to study the feasibility of this type of CAES system.
Figure 9 shows the location of the Wattenberg gas field on the Colorado wind
resource map.
31
Figure 9: Location of potential CAES site in depleted gas well
3.3 Site Selection for Modeling
In the modeling section in chapter 4 of this thesis, two models are created
for the economic analysis of CAES. The first model uses a single wind site
integrated with a CAES plant, and the second model uses multiple wind sites
integrated with a single CAES plant. While the specific locations of the CAES
site are not of particular importance to the model, sites are chosen for both models
to increase the reality of the examples. For the single wind site model, the CAES
plant is modeled after the Georgetown hard rock mine site shown in figure 8. For
the multiple wind site model, the CAES plant is modeled after the bedded salt
location shown in figure 7. For this example, the salt bed in the northeast corner
32

of the state (part of the Northern Nebraska Basin) is the location selected for the
CAES plant.
33

CHAPTER 4: MODELING
This chapter provides a detailed description of the modeling aspects of this
project. Two financial models are developed to determine the economic viability
of a CAES plant in Colorado. The modeling techniques are detailed and the
results of the models are demonstrated.
4.1 Modeling Goals and Objectives
The goal of the economic modeling in this project is to create a
methodology using simulation and optimization software to estimate the
profitability of a wind integrated CAES plant in Colorado. Models are built using
this methodology and data obtained from various sources, but the real strength of
the project is the modeling methodology. A utility manager could plug their own
data into this model and come up with a quick assessment of the profitability of a
storage system that they are considering building.
In order for an energy storage system to be built, it needs to make
financial sense to the utility. If the storage system makes enough money from
34

absorbing power when costs are low and selling power when costs are high to
offset the capital cost of the system, it will be built. This is the basic assumption
of the financial modeling. In reality, there are additional financial benefits to
storage besides buying low and selling high (generally referred to as arbitrage),
such ancillary services as spinning reserves, capacity, black start, and voltage and
frequency regulation.
Additionally, while the arbitrage modeling will determine how quickly the
CAES plant pays back its capital cost, it is important to note that when additional
capacity is needed on the system, this capacity cannot obtained from building
more wind generation. Capacity is the amount of fixed, reliable generation that
exists on the system that can be turned on during peak demand times. Wind
energy does not count towards capacity due to the uncontrolled variation in the
output (actually wind generators do get a small percentage of their nameplate
output as a capacity credit due to some statistical analysis of their output
likelihood). But with an increase in wind generation and load, increased capacity
would need to be built. This would likely come in the form of natural gas
turbines if it did not come from storage. While gas turbines have a lower capital
cost than CAES, it is not much lower. Therefore most of the capital cost for a
CAES plant would be spent on natural gas turbines anyway if the CAES plant
were not built.
The reason that the modeling in this thesis looks at wind arbitrage only is
that it can be modeled using only the CAES facility and the wind output.
Modeling the rest of the variables would require a system-wide model. This
35
would be a very interesting model to build, and is discussed in the future work
section, but this would require access to much more proprietary information about
a utility system than will be made available. So looking at an isolated CAES
plant with wind generation connected to determine the potential profitability is the
best place to start this type of analysis, and that is what is done here.
4.2 Model Parameters
Like any model, this CAES economic model takes in sets of data, as well
as some input parameters, constants, and constraints, and then produces an output.
This section explains those parameters.
4.2.1 Model Inputs
The two main inputs to the model are wind data and the hourly price of
energy. The models both use one year of wind data, though any amount of time
could be modeled, and hourly wind data is used. The changing cost of energy is
also hourly, so this is correlated to the wind speeds. Additional inputs include the
nameplate capacity of the wind generation, the nameplate capacity of the CAES
system, and the size of the CAES reservoir. Also, several constants are used,
including the cost of natural gas, the charging ratio and heat rate of a CAES plant,
and the CO2 production from CAES operation. All of these inputs are used to
simulate the operational profile of a wind integrated CAES plant, and to keep
track of the statistics (running time, gas usage, etc.) of that plant.
36

4.2.2 Model Outputs
The outputs of the model are two energy prices and the net added revenue
from the CAES system over wind generation alone. The model takes the above
inputs and optimizes the operational profile of the simulated CAES plant in order
to maximize the revenue from the combined wind/CAES system. This
maximization in obtained by adjusting two decision variables: the price of energy
below which wind energy will be stored, and the price of energy above which
energy will be sold from the storage. This gives three operations for the CAES
plant: it is either storing wind energy (at low prices), sitting idle while any wind
energy generated is sold directly (at medium prices), or selling from the storage in
addition to directly selling the wind energy that is generated (at high prices). The
two break points that separate these price regions and the net revenue from the
system are the model outputs.
4.3 Data
Wind data for these models was obtained from two different sources. For
the single site model, the Clear Creek Power project near Georgetown, Colorado
is modeled. CCP provided one year’s worth of wind data from the on-site
anemometer. The data spans from July 2005 to June 2006. This data was taken at
20 meters, but near the end of the data collection period a 50 meter tower was
installed. With side-by-side 20 meter and 50 meter data a strong correlation could
be seen to the empirical wind speed height scaling formula discussed in Manwell
[27] (discussed in the next section). So the 20 meter data was used and scaled
using this formula to the project hub height of 50 meters.
37

The multiple site model simulates several wind sites on the eastern plains
of Colorado integrated with one CAES facility in northeastern Colorado. Wind
data for this model is obtained from the University of North Dakota Energy and
Environmental Resource Center’s wind database [28]. This database is a
compilation of wind data obtained from various public studies around the country.
This database holds over 40 data sets from Colorado, but to be useful the data
must overlap exactly in time. It turned out there were eleven data sets that
spanned the entire year of 1997, so that data was used for the model. Of the
eleven data sets, the best five were chosen to model five dispersed wind
generation sites integrated by one CAES plant. This will allow for the effect of
spatial diversity to be seen in the model results, compared to the single site model.
Energy cost data turned out to be a much more difficult thing to find than
wind data. Colorado is a regulated energy market, so open market hourly energy
price data does not exist. In deregulated markets this data does exist, but utilities
seem unwilling to share it. For these models, cost data was extrapolated from a
general knowledge of cost fluctuation and a load curve that shows when the peaks
occur. While extrapolating data is never a good idea, it is important to note a few
things about this. First, the strength of this model is the methodology, not
necessarily the exact results. This model will be much more valuable in the hands
of a utility manager, who could input their own real cost data. Second, energy
prices fluctuate rapidly for many reasons, so future prices might not have much
correlation to past prices anyway. Finally, a quick glance at the cost data tells the
reader the approximate difference between peak and off-peak prices, which is a
38

quick check of the price data. Table 1 shows the cost data used in these models.
There is roughly a $0.05 to $0.07 per kWh differential between the peak and off-
peak prices, depending on the exact hour, which is a good approximation, based
on the research conducted.
Table 1: Hourly price data used in model
Wind/CAES dispatchable rates 12:00 AM $0.037 12:00 PM $0.086
1:00 $0.034 1:00 $0.088 2:00 $0.033 2:00 $0.103 3:00 $0.032 3:00 $0.106 4:00 $0.043 4:00 $0.109 5:00 $0.043 5:00 $0.105 6:00 $0.054 6:00 $0.104 7:00 $0.061 7:00 $0.092 8:00 $0.068 8:00 $0.083 9:00 $0.071 9:00 $0.083 10:00 $0.077 10:00 $0.072 11:00 $0.082 11:00 $0.062
Wind non-dispatchable flat rate All times $0.035
The remainder of the data gathering includes the various parameters and
constraints that model uses. The nameplate capacity of the wind turbines, the
nameplate capacity of the CAES system modeled, and the size of the storage
reservoir are determined for each model and noted in that section. The constants
include a CAES charging ratio of 1.25 kWh out per kWh in and a CAES heat rate
of 4300 Btu/kWh [16,17]. They also include a natural gas CO2 production rate of
0.000117 lbs CO2 / Btu natural gas and a natural gas rate of $6.00/MMBtu. The
natural gas price and the size of the reservoir will be the subject of a sensitivity
analysis.
39

4.4 Model Formulation
The first step in the model is to convert wind speed into power production.
Using the technique from Manwell [27], a rated power is chosen for the wind
turbine, and it corresponds to a rated wind speed. Cut-in and cut-out wind speeds
are also chosen, and these wind speeds yield the four regions that are noted in
figure 10.
Figure 10: Wind turbine power curve
For these models, the following wind speeds were used: 5 m/s cut-in, 13
m/s rated, and 25 m/s cut-out. These are typical numbers for large wind turbines.
In the single site model, 750 kW turbines are used, so that is the rated power. For
the multiple site model, 2 MW turbines are chosen. So the power output is 0 in
region I (below 5 m/s), 0 in region IV (above 25 m/s), and the rated power in
region III (from 13 to 25 m/s). In region II, the power is given by the following
equation:
40

3***21* VACpP ρ=
In the above equation, P is the power output in region II, Cp is the
coefficient of power (the percentage of power in the wind that is captured, an
efficiency type of number), ρ is the air density, A is the swept area of the wind
turbine blades, and V3 is the cube of the wind velocity. Once power is calculated,
it is multiplied by the number of turbines at each site, and, for the multiple site
model, the power at each site is summed to get the total wind power to integrate
with the CAES plant.
The next step is to develop a series of if-then statements that simulate the
operational profile of the wind/CAES system. The two decision variables, as
mentioned above, are the cost at which energy is stored when the current price is
lower than this price, and the cost at which energy is sold from storage when
prices are above that price. This creates three operational regions from the CAES
plant: storing: idle, and selling.
Several if-then statements are needed to implement a number of
constraints. If the storage reservoir is full, energy cannot be stored; it must be
sold as it is generated even if the price is very low. Conversely, a similar
constraint is required to keep the system from selling from the storage reservoir if
it is empty. The natural gas used is tabulated and the carbon dioxide produced is
calculated. The price of the natural gas is subtracted from the revenue. The
hourly prices from table 1 are used for each day of the year, without seasonal
fluctuation. This may not be the most accurate part of the model, but the most
important part of the pricing scheme is not the absolute price, but the difference
41

between on-peak and off-peak pricing, and this stays more constant throughout
the year.
Once the operational profile is developed, it must be optimized. The
optimization software changes the two decision variables and then recalculates the
revenue for each trial. After a large number of trials the software arrives at the
optimum prices above which to sell and below which to store in order to
maximize the net revenue from installing storage. This maximized revenue is
then compared to the baseline revenue, which is calculated by simply selling all of
the wind energy at the non-dispatchable flat rate. The difference is the gain the
storage provides. This is compared to the capital cost of storage. The annual
revenue gain from storage is divided by the capital cost, and this percentage is
noted, along with the inverse, which is the simple payback period in years.
The simple payback period is used in these calculations because it is more
objective than payback periods that include interest, discount rate, and so forth.
In economics, interest rates of 5-6% are often used, but large energy projects are
very difficult to finance and will command a higher interest rate, which
completely changes the calculations. With a simple (interest not included)
payback period, the reader can determine for themselves what the interest rate,
discount rate, and future increases in energy prices will be. The actual payback
period is expected to be longer because of all these factors, but the simple
payback period takes some of the subjectivity out of these economic calculations,
and allows for a more fair comparison between models.
42

4.5 Modeling Software
The software package Crystal Ball and OptQuest [29] is used for the
optimization of the economic model. It is an add-on to Microsoft Excel which
allows for simulation and optimization produced by Decisioneering, Inc. Crystal
Ball is used for simulation: it allows the user to enter a distribution of uncertainty
into a cell, rather than a fixed value. The simulation then runs a trial where all of
the distributions in the model receive random values, and the results are
calculated. The user specifies the number of trials to run, and the software
calculates statistics on the results.
OptQuest is the optimization portion of Decisioneering’s software
package. OptQuest allows the user to define decision variables and objective
functions to maximize or minimize. It can be used in conjunction with the
simulation that Crystal Ball allows. The software selects values and calculates the
result of the objective function. Then the software selects new values for the
decision variables and recalculates the objective function. The selection of the
decision variable values is somewhat random, but has some intelligence built into
it. After the specified number of trials has been run, the solution should be the
optimal solution. The software shows how recently a solution that beat the
previous optimal solution was found, and if a new optimal solution has not been
found for a long time, then the solution is likely the optimal solution.
OptQuest works with the simulations of the distributions from Crystal
Ball. It can maximize the mean, standard deviation, or other statistics from the
Crystal Ball results. It can also work deterministically, using no distributions
43

from Crystal Ball. This is how it is used in this project. The wind data is real
data, so there is no need to add uncertainty to that data. The cost data is
extrapolated, and perhaps applying a distribution with some uncertainty would
make the model more accurate. Trials were run with a distribution added to each
hourly price. These trials produced very similar results to the deterministic trials.
This is likely because the uncertainly added tends to cancel itself out without
having much effect on the results. The deterministic model runs much faster, so it
is used in the analysis because nothing was gained from adding the probability
distributions through Crystal Ball.
4.6 Model Results
Two models were developed for this project. The first model, called the
single site model, looks at a CAES plant using an abandoned mine, integrated
with a single wind site near Georgetown, Colorado. The second model, called the
multiple site model or the five site model, looks at a CAES plant in northeastern
Colorado using a salt cavern build in bedded salt, integrated with five wind sites
on the eastern plains.
4.6.1 Single site model
The single site model is a replication of the wind/CAES system that Clear
Creek Power, LLC is developing near Georgetown, Colorado. The CCP
development calls for 73 750 kW wind turbines, or a rated capacity of 55 MW. In
the model this is balanced with a 50 MW CAES turbine. Different turbine sizes
were experimented with, and the conclusion of that experimentation was that
44

having a CAES turbine with a rated capacity near, but not above the rated
capacity of the wind turbines made the most sense from a modeling standpoint
and from a logistical standpoint as well.
The cavern is sized to hold 525 MWh of energy when fully charged. This
is based on the size of the cavern (3.5 million cubic feet) and the statistics from
the Alabama CAES plant, which has a 19 million cubic foot cavern and holds
approximately 2860 MWh when fully charged. To say that the cavern holds this
much energy is probably a misnomer, a better description would be that the
cavern size allows it to hold enough air to produce 525 MWh of electricity from a
CAES turbine.
The capital cost of the CAES system is estimated at $700/kW installed
[7,16]. There is no price assumed for developing the cavern, since it is already
there. This may not be a good assumption, because the cavern may require
significant work to make it suitable to hold high pressure air, but the model will
account for this by assuming the top end of the quoted price range for CAES
($600 to $700/kW is the quoted price range).
Using these parameters, the wind data provided by CCP, and the pricing
data, the model is created and optimized. Table 2 shows a summary of the model
inputs for the single site model.
45

Table 2: Inputs for single site model
Installed wind capacity 55 MW CAES turbine rated power 50 MW Energy capacity of cavern 525 MWh
CAES charging ratio 1.25 CAES heat rate 4300 Btu/kWh Natural gas cost $6.00/MMBtu CO2 production 0.000117 lbs/Btu gas
Capital cost $700/kW
The results of the optimization are shown in table 3. The annual net
revenue increase from selling dispatchable energy at merchant rates (over selling
wind energy at the flat wind rate) is $6.85 million. Using the $700/kW installed
cost of CAES, the capital cost is calculated at $35 million, giving a simple
payback period (without interest) of 5.1 years.
Table 3: Results from single site model
Maximum price to store $0.0823 Minimum price to sell $0.0880
Annual wind/CAES revenue $11,827,000 Annual wind only revenue $4,977,000
CAES value added $6,850,000 CAES capital cost $35,000,000
Annual revenue / capital cost 0.1957 Simple payback period ~5.1 years
4.6.2 Five site model
The five site model utilizes five wind sites on the eastern plains and a salt
bed in northeastern Colorado for a CAES cavern. This model is a simulation of
the potential wind growth in eastern Colorado and how a CAES facility in eastern
Colorado could help mitigate wind intermittency. This model also highlights the
issue of spatial diversity. With several wind sites, the times when all run at rated
46

power or all are not producing power are fewer. That means that the same
amount of storage could go further for wind integration. The wind sites and the
location of the storage facility are shown in figure 11. The wind sites are marked
with red diamonds, and the CAES location is marked with a red circle.
Figure 11: Wind sites and CAES location for five site model
The sizes of the wind generation and CAES for this model are as follows:
200 MW of wind turbines (100 2 MW turbines) at each wind site, and 1000 MW
of CAES turbines. The CAES reservoir will be capable of holding enough air to
generate 10,000 MWh of energy from one full discharge of the cavern, but the
sensitivity analysis will analyze this. The capital cost will remain at $700/kW,
but added on to this cost is a $3 per kWh charge for building the cavern [7]. This
47
will allow the model to be optimized for the best cavern size in the sensitivity
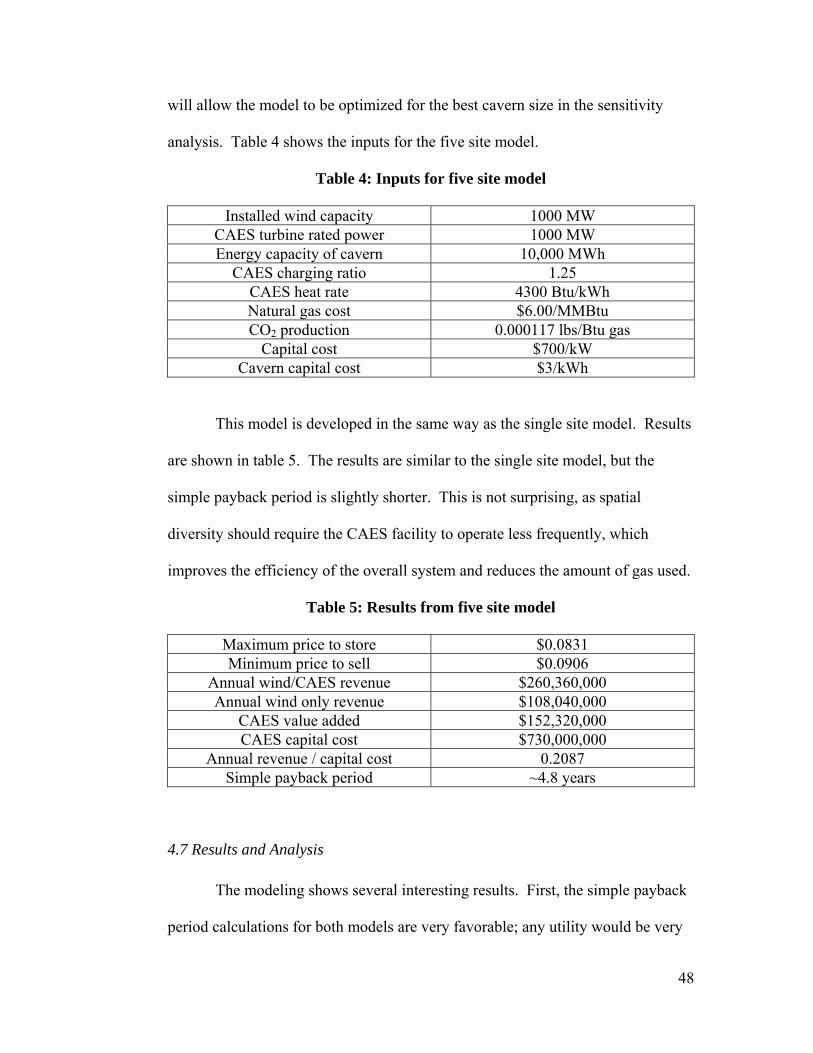
analysis. Table 4 shows the inputs for the five site model.
Table 4: Inputs for five site model
Installed wind capacity 1000 MW CAES turbine rated power 1000 MW Energy capacity of cavern 10,000 MWh
CAES charging ratio 1.25 CAES heat rate 4300 Btu/kWh Natural gas cost $6.00/MMBtu CO2 production 0.000117 lbs/Btu gas
Capital cost $700/kW Cavern capital cost $3/kWh
This model is developed in the same way as the single site model. Results
are shown in table 5. The results are similar to the single site model, but the
simple payback period is slightly shorter. This is not surprising, as spatial
diversity should require the CAES facility to operate less frequently, which
improves the efficiency of the overall system and reduces the amount of gas used.
Table 5: Results from five site model
Maximum price to store $0.0831 Minimum price to sell $0.0906
Annual wind/CAES revenue $260,360,000 Annual wind only revenue $108,040,000
CAES value added $152,320,000 CAES capital cost $730,000,000
Annual revenue / capital cost 0.2087 Simple payback period ~4.8 years
4.7 Results and Analysis
The modeling shows several interesting results. First, the simple payback
period calculations for both models are very favorable; any utility would be very
48

interested in a project that pays back this quickly. When real data is inserted these
numbers may not come out as favorable, but they will likely be in acceptable
ranges for a utility to consider. The usage of a flat rate at which non-firm wind is
sold regardless of when it is produced may also add to the favorability of the
numbers, but that is generally how wind is sold (on a fixed rate contract in the
neighborhood of 3.5 cents per kWh), so this is a reasonable assumption. It is also
important to remember that this model does not include any value for ancillary
services that the CAES plant would provide, nor does it account for the capital
cost of a conventional natural gas plant to back up wind generation without
storage.
4.7.1 Sensitivity Analysis
A sensitivity analysis was performed on the modeling results for the five
site model. The sensitivity analysis examines three input parameters; the size of
the cavern, the price of natural gas, and the flat wind rate. The analysis of the size
of the cavern is actually an optimization; the model will be run several times,
accounting for the increased cost of a large cavern, and the best cavern size will
be the best payback period. The sensitivity analysis for the natural gas prices is
performed because natural gas prices change frequently, and understanding how
the results change with changing gas prices is an important part of the analysis.
The sensitivity analysis on the flat wind rate is an easy way to investigate the
sensitivity of the results to the hourly pricing scheme. Table 6 shows the
sensitivity analysis for the cavern size.
49

Table 6: Sensitivity analysis for cavern size
Cavern size Cavern cost Annual revenue Simple Payback 1,000 MWh $703,000,000 $118,700,000 5.92 years 3,000 MWh $709,000,000 $138,870,000 5.10 years 10,000 MWh $730,000,000 $152,320,000 4.79 years 30,000 MWh $790,000,000 $153,350,000 5.15 years 100,000 MWh $1,000,000,000 $152,990,000 6.54 years
The sensitivity analysis on the cavern size shows that the 10,000 MWh
cavern is the one to use. Below that level, the cavern is too small and significant
revenue is lost due to the cavern filling when prices are still low and emptying
when prices are still high. Above that level, there is not significant revenue gain,
but the cost of the cavern goes up significantly, which makes the net profit lower.
Table 7 shows the sensitivity analysis for the price of natural gas. The rate
used in the original model is $6.00/MMBtu. The sensitivity analysis examines
higher and lower rates. It is expected that revenue will be significantly affected
by natural gas prices. It is important to note, however, that while rising natural
gas prices cut into the profit of the wind/CAES integrated system, the alternative
will usually be conventional gas turbines, which will be affected even more by
rising gas prices, as they use more gas. The sensitivity analysis shows that while
gas prices do have a significant effect, there is still a good profit margin when gas
reaches $12/MMBtu.
Table 7: Sensitivity analysis for natural gas prices
Natural gas price Annual revenue Simple payback $4.00/MMBtu $169,190,000 4.31 years $6.00/MMBtu $152,320,000 4.79 years $8.00/MMBtu $138,160,000 5.28 years $10.00/MMBtu $124,400,000 5.87 years $12.00/MMBtu $115,030,000 6.35 years
50

The sensitivity analysis for the changing flat rate of wind energy is shown
in table 8. This is an easy way to look at how the hourly energy cost data affects
the results, because the real means for the wind/CAES system to make money
over the wind only scenario is the difference between the high price hours and the
wind flat rate, not the difference between the high price hours and the low price
hours. The results of this sensitivity analysis show that the profit is significantly
affected by raising the wind flat rate, as expected, but that even with a 2¢/kWh
raise in the wind flat rate (an increase of over 50%), the system is still profitable
(with a simple payback of eight years instead of five).
Table 8: Sensitivity analysis for wind flat rate
Wind flat rate Annual revenue Simple payback 3.5¢/kWh $152,320,000 4.79 years 4.0¢/kWh $136,890,000 5.33 years 4.5¢/kWh $121,450,000 6.01 years 5.0¢/kWh $106,020,000 6.89 years 5.5¢/kWh $90,580,000 8.06 years
4.7.2 Gas Turbine Comparison
While this thesis looks at an isolated wind/CAES system, this section
makes a comparison of this wind/CAES system to a system of wind turbines
backed up by natural gas generators. This requires three key assumptions. First,
the wind/CAES system stores wind energy when energy prices are low. The
wind/gas system does not do this; it must sell all of this energy when it is
produced despite the low prices. The assumption is made that this energy is sold
at the wind flat rate, which is reasonable because this energy is generally being
51

produced when energy prices are low (near the wind flat rate), and because this
energy is not firm (the model is not trying to produce firm energy at those hours).
The second key assumption is that the gas turbines operate on the exact same
schedule as the CAES turbines would; this may not be exactly how the utility
would dispatch the system, but it gives an apples to apples comparison. The final
assumption is the capital cost of gas turbines, which is assumed to be $450/kW
[7,16].
Table 9: Comparison of wind/CAES to wind with natural gas backup
Wind/CAES Wind/gas Original gross revenue $310,430,000 $310,430,000
Additional wind revenue $54,440,000 New gross revenue $310,430,000 $364,870,000 Natural gas used 8,345,000 MMBtu 21,349,000 MMBtu
Gas price ($6/MMBtu) $50,070,000 $128,090,000 Net Revenue $260,360,000 $236,780,000
Capital cost (/kWh) $730 $450 Capital cost $730,000,000 $450,000,000
Revenue difference $23,580,000 Capital difference $230,000,000 Simple payback 9.75 years (no cost of CO2)
Cost of CO2 $20/ton CO2 production 976,410,000 lbs 2,497,800,000 lbs
CO2 cost $9,760,000 $24,980,000 Net revenue w/CO2 cost $250,600,000 $211,800,000
Revenue difference $38,800,000 Capital difference $230,000,000 Simple payback 5.92 years (with CO2 at $20/ton)
Table 9 shows the comparison of a wind/CAES system to wind turbines
using natural gas generators as backup. The gross revenue from the wind/CAES
system (revenue without the cost of the natural gas taken out) is used as a
baseline. The additional revenue from selling off-peak wind energy instead of
storing it is added to the wind/gas revenue. The gas usage is then calculated and
52

the price of that natural gas (at $6/MMBtu) is subtracted to get the net revenue.
This yields the new net revenue for the wind/CAES system and for the wind/gas
system. The difference in these revenues is then compared to the difference in the
capital costs between the two systems, and a simple payback period of 9.75 years
is calculated for the difference in capital cost between building a CAES plant and
building gas turbines.
The second part of table 9 repeats the payback period calculations while
accounting for the potential future cost of CO2. CAES uses much less CO2 than
gas turbines, so while the revenue for the wind/CAES plant will drop, the revenue
for the wind/gas system will drop more. A cost of $20/ton for CO2 is used. When
accounting for the cost of carbon, the payback period for the additional cost of
building a wind/CAES system in lieu of a wind/gas system drops to 5.9 years.
Table 10: Wind/CAES vs. wind/gas with high gas prices
Wind/CAES Wind/gas New gross revenue $310,430,000 $364,870,000
Gas price ($10/MMBtu) $83,450,000 $213,480,000 CO2 cost $9,760,000 $24,980,000
Net revenue $217,220,000 $126,410,000 Revenue difference $90,810,000 Capital difference $230,000,000 Simple payback 2.53 years (with CO2 at $20/ton)
Table 10 shows the sensitivity of the wind/CAES vs. wind/gas comparison
to the price of natural gas. This model shows that the wind/CAES option is much
more profitable at high gas prices. The payback period for the higher cost of
building a CAES plant is only 2.5 years when valuing carbon at $20/ton and gas
prices at $10/MMBtu. In this case a CAES plant is a very profitable choice.
53

CHAPTER 5: CONCLUSIONS
This study shows that Compressed Air Energy Storage is a viable solution
for energy storage needs in Colorado. With wind generation developing in the
state at a very rapid rate, energy storage may become necessary, or at least
profitable, in the near future. CAES is both technically feasible and financially
competitive to provide energy storage in Colorado.
The site analysis portion of the project examined the potential for locating
a CAES plant in Colorado. There are many acceptable geological formations for
a CAES reservoir in the state, including salt domes, bedded salt, aquifers,
abandoned mines, and depleted gas wells. Some of these formations are better
suited for a CAES reservoir than others, and some may add time, money, and risk
to a project. Additionally, some are in better suited locations for an energy
storage system than others. The end conclusion is that CAES reservoirs exist in
many useful places in Colorado, but many of them will require significant study
and financial risk because these types of reservoirs have never been built for
CAES before.
54

The modeling portion of the project shows that CAES makes financial
sense in Colorado. While the financial numbers should not be considered exact,
they show an adequate profit margin that a developer could make money even if
the real numbers come in significantly lower than this model. However, this
model should be used by a developer with real cost data before determining
whether or not to build a CAES plant. The strength of this project lies in the
optimization methodology in the model.
5.1 Future Work
There are several directions that this project could go from here. A more
accurate geological study is needed of any potential CAES reservoir. This would
likely not be conducted until there is a developer interested in building a CAES
plant and they have a site picked out. The analysis is too specific and too
expensive to do before there is real interest in a project.
Another interesting future effort would be to try to model an entire energy
system, rather than just one storage facility integrated with a few wind sites. This
would be difficult, as much of this information is considered proprietary to the
utility. It would allow the consideration of many more factors, including true
balancing of wind with peaking generation, ancillary services, and transmission.
This would be a much better way to analyze a storage facility than simply
determining if such a facility can make money using arbitrage.
55
REFERENCES
[1] American Wind Energy Association. 2007.
http://www.awea.org/pubs/factsheets/Cost2001.PDF
[2] Colorado Legislative Council. 2004.
http://www.state.co.us/gov_dir/leg_dir/lcsstaff/2004/ballot/2004Bluebookf
orInternet.PDF
[3] American Wind Energy Association. 2007.
http://www.awea.org/projects/colorado.html
[4] Colorado State Legislature. 2007.
http://www.leg.state.co.us/Clics/Clics2007A/csl.nsf/fsbillcont3/C9B0B62
160D242CA87257251007C4F7A?Open&file=1281_enr.pdf
[5] EnerNex Corporation. Wind Integration Study for the Public Service
Company of Colorado. May 2006.
[6] Lathrop, S. Vanadium Redox Battery Update – Castle Valley, Utah. ESA
Conference. 2006.
[7] EPRI and U.S. Department of Energy. 2003. EPRI-DOE Handbook of
Energy Storage for Transmission and Distribution Applications. 1001834.
[8] McDowell, J. Golden Valley Electric Association – Battery Energy
Storage System Update. ESA Conference. 2006.
[9] Tamakoshi, T. and K. Asano. NaS Battery Applications for “Prompt”
Reserves and Suppression of Power Fluctuations. ESA Conference.
2006.
56

[10] Lazarewicz, M. and C. Lyons. Flywheel Based Frequency Regulation
Demonstration Projects. ESA Conference. 2006.
[11] Electricity Storage Association. 2006.
http://electricitystorage.org/tech/technologies_comparisons_ratings.htm
[12] Energy Information Administration. 2006.
http://www.eia.doe.gov/emeu/aer/pdf/pages/sec8_8.pdf
[13] Nakhamkin, M. et al. 1991. AEC 110 MW CAES Plant – Status of
Project. Proceedings of the American Power Conference. 1991 p. 743-
749.
[14] CAES Development Company, LLC. 2001.
http://www.caes.net/nortpres.html.
[15] Iowa Stored Energy Park. 2007. http://www.isepa.com/.
[16] Ridge Energy Storage & Grid Services L.P. 2005. The Economic Impact
of CAES on Wind in Texas, Oklahoma, and New Mexico.
[17] Denholm, P. 2006. Improving the Technical, Environmental, and Social
Performance of Wind Energy Systems Using Biomass-Based Energy
Storage. Science Direct Renewable Energy 31 (2006) 1355-1370.
[18] Cohn, A. et al. 1991. Applications of air saturation to integrated coal
gasification/CAES power plants. ASME 91-JPGC-GT-2.
[19] Holst, K. Iowa Stored Energy Park – Update. EESAT Conference. 2007.
[20] Michael McGill, Electricity and Air Storage Enterprises, LLC. March
2007. Personal communication.
57

[21] Neumiller, J. 2006. Reservoir Simulation of Combined Wind Energy and
Compressed Air Energy Storage in Different Geologic Settings. Master’s
Thesis, Colorado School of Mines.
[22] Colorado Geological Survey. 2002.
http://geosurvey.state.co.us/Default.aspx?tabid=365
[23] U.S. Department of Energy, Office of Energy Efficiency and Renewable
Energy. http://www.eere.energy.gov/windandhydro/windpoweringameric
a/wind_maps.asp.
[24] Bureau of Reclamation. http://www.usbr.gov/dataweb/html/paradox.html.
[25] DeVries, K. et. al. 2005. Cavern Roof Stability for Natural Gas Storage
in Bedded Salt. Topical Report RSI-1829 DE-FG26-02NT41651.
[26] Ground Water Atlas of Colorado, R. Topper, K.L. Spray, W.H. Bellis, J.L.
Hamilton, P.E. Barkmann, Colorado Geological Survey, Division of
Minerals and Geology, Department of Natural Resources, Special
Publication 53, Denver, Colorado. 2003.
[27] Manwell, J., J. McGowan, and A. Rodgres. 2002. Wind Energy
Explained. J. J. Wiley and Sons. 978-0471499725.
[28] University of North Dakota Energy and Environmental Resource Center.
http://www.undeerc.org/wind/winddb/COwindsites.asp
[29] Decisioneering, Inc. 2007. http://www.crystalball.com/.
58