wind energy update - federal reserve bank of chicago/media/others/events/2007/... · ·...
TRANSCRIPT

Wind Energy UpdateWind Energy Update
Larry Flowers Larry Flowers National Renewable Energy Laboratory National Renewable Energy Laboratory
November 2007November 2007


Capacity & Cost TrendsCapacity & Cost Trends
Increased Turbine Size - R&D Advances - Manufacturing Improvements
0
2000
4000
6000
8000
10000
12000
1980 1985 1990 1995 2000 20050
102030405060708090
100
Cap
acity
(MW
)
Cos
t of E
nerg
y (c
ents
/kW
h*)
Cost of Energy and Cumulative Domestic Capacity
*Year 2000 dollars
Increased Turbine Size - R&D Advances - Manufacturing Improvements
0
2000
4000
6000
8000
10000
12000
1980 1985 1990 1995 2000 20050
102030405060708090
100
Cap
acity
(MW
)
Cos
t of E
nerg
y (c
ents
/kW
h*)
Cost of Energy and Cumulative Domestic Capacity
*Year 2000 dollars

People Want Renewable Energy!People Want Renewable Energy!
05000
10000150002000025000300003500040000450005000055000600006500070000750008000085000
19821983198419851986198719881989199019911992199319941995199619971998199920002001200220032004200520062007
Cap
acity
(MW
)
United States Europe Rest of World
1. Germany: 21283 MW2. Spain: 13400 MW3. United States: 12925 MW4. India: 7000 MW5. Denmark: 3134 MW
Source: WindPower Monthly
World total October 2007: 81957 MW
Total Installed Wind CapacityTotal Installed Wind Capacity

U.S. Leads World in Annual Wind U.S. Leads World in Annual Wind Capacity Additions; Third in Cumulative CapacityCapacity Additions; Third in Cumulative Capacity

U.S Lagging Other Countries for U.S Lagging Other Countries for Wind As a Percentage of Electricity ConsumptionWind As a Percentage of Electricity Consumption

Installed Wind Capacities Installed Wind Capacities (‘99 (‘99 –– Sept 07)Sept 07)

Drivers for Wind PowerDrivers for Wind Power
• Declining Wind Costs• Fuel Price Uncertainty• Federal and State
Policies• Economic Development• Public Support• Green Power• Energy Security• Carbon Risk

Wind Cost of EnergyWind Cost of Energy
0
2
4
6
8
10
12
14
1990 1995 2000 2005 2010 2015 2020
CO
E (¢
/kW
h [c
onst
ant 2
006
$])
Low wind speed sites
High windspeed sites
Depreciated CoalDepreciated Wind
New Coal Power Competitive Price Band
2007: New Wind
Natural Gas (fuel only)
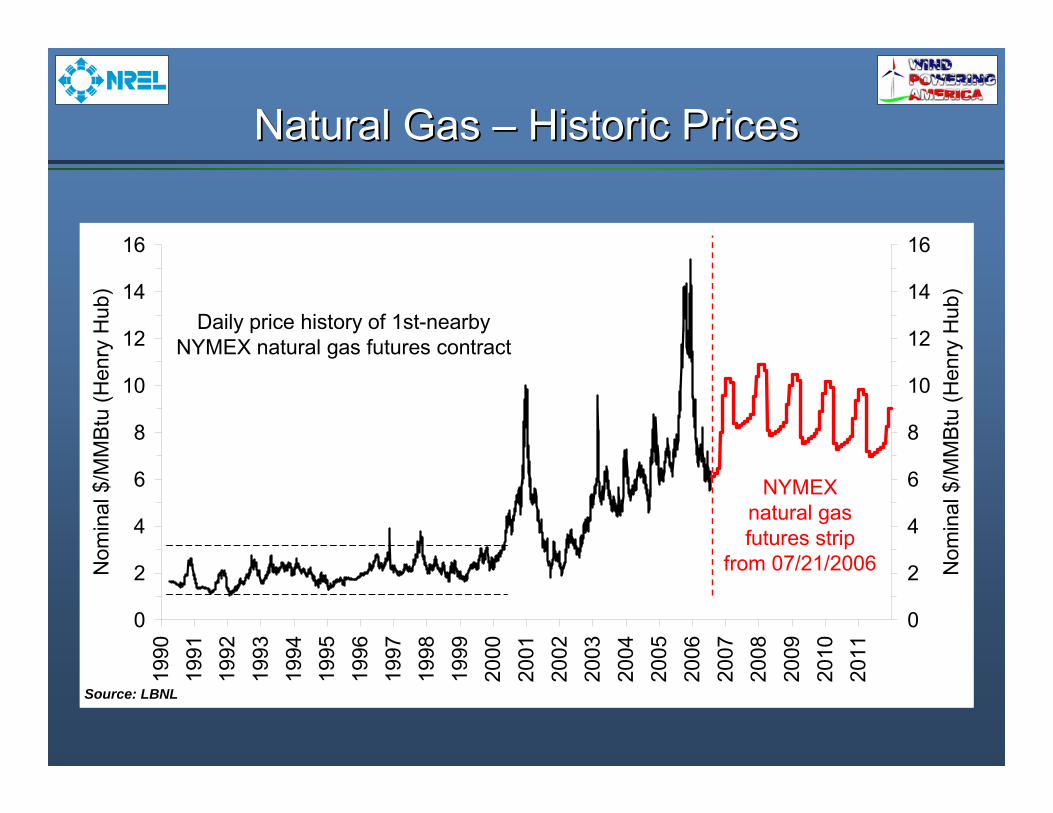
Natural Gas Natural Gas –– Historic PricesHistoric Prices
0
2
4
6
8
10
12
14
16
1990
1991
1992
1993
1994
1995
1996
1997
1998
1999
2000
2001
2002
2003
2004
2005
2006
2007
2008
2009
2010
2011
Nom
inal
$/M
MB
tu (H
enry
Hub
)
0
2
4
6
8
10
12
14
16
Nom
inal
$/M
MB
tu (H
enry
Hub
)
Source: LBNL
NYMEXnatural gas futures strip
from 07/21/2006
Daily price history of 1st-nearbyNYMEX natural gas futures contract

Historical Coal PricesHistorical Coal Prices
Source: EIA

Nationally, Wind Has Been Competitive Nationally, Wind Has Been Competitive with Wholesale Power Prices in Recent Yearswith Wholesale Power Prices in Recent Years

In 2006, Wind Projects Built Since 1997 Were In 2006, Wind Projects Built Since 1997 Were Competitive with Wholesale Power Prices in Most RegionsCompetitive with Wholesale Power Prices in Most Regions

Renewables Portfolio StandardsRenewables Portfolio Standards
☼ Minimum solar or customer-sited RE requirement* Increased credit for solar or customer-sited RE
¹PA: 8% Tier I / 10% Tier II (includes non-renewables); SWH is a Tier II resource
DSIRE: www.dsireusa.org September 2007
☼ PA: 18%¹ by 2020
☼ NJ: 22.5% by 2021
CT: 23% by 2020
MA: 4% by 2009 +1% annual increase
WI: requirement varies by utility; 10% by 2015 goal
IA: 105 MW
MN: 25% by 2025(Xcel: 30% by 2020)
TX: 5,880 MW by 2015
☼ AZ: 15% by 2025
CA: 20% by 2010
☼ *NV: 20% by 2015
ME: 30% by 200010% by 2017 - new RE
HI: 20% by 2020
RI: 16% by 2020
☼ CO: 20% by 2020 (IOUs)*10% by 2020 (co-ops & large munis)
☼ DC: 11% by 2022
☼ NY: 24% by 2013
MT: 15% by 2015
IL: 25% by 2025
VT: RE meets load growth by 2012*WA: 15% by 2020
☼ MD: 9.5% in 2022
☼ NH: 23.8% in 2025
OR: 25% by 2025 (large utilities)5% - 10% by 2025 (smaller utilities)
*VA: 12% by 2022
MO: 11% by 2020
☼ *DE: 20% by 2019
☼ NM: 20% by 2020 (IOUs)10% by 2020 (co-ops)
☼ NC: 12.5% by 2021 (IOUs)10% by 2018 (co-ops & munis)
ND: 10% by 2015
State Goal
State RPS
Solar water heating eligible

Wind Energy InvestorsWind Energy Investors

Windy Rural Areas Need Windy Rural Areas Need Economic DevelopmentEconomic Development

Economic Development ImpactsEconomic Development Impacts
• Land Lease Payments: 2-3% of gross revenue $2500-4000/MW/year
• Local property tax revenue: ranges widely -$300K-1700K/yr per 100MW
• 100-200 jobs/100MW during construction
• 6-10 permanent O&M jobs per 100 MW
• Local construction and service industry: concrete, towers usually done locally

Case Study: Texas Case Study: Texas
Utilities and wind companies invested $1B in 2001 to build 912 MW of new wind power, resulting in:
• 2,500 quality jobs with a payroll of $75M
• $13.3M in tax revenues for schools and counties
• $2.5M in 2002 royalty income to landowners
• Another 2,900 indirect jobs as a result of the multiplier effect
• $4.6M increase in Pecos County property tax revenue in 2002

Case Study: MinnesotaCase Study: Minnesota
107-MW Minnesota wind project
• $500,000/yr in lease payments to farmers
• $611,000 in property taxes in 2000 = 13% of total county taxes
• 31 long-term local jobs and $909,000 in income from O&M (includes multiplier effect)

Case Study: IowaCase Study: Iowa
240-MW Iowa wind project
• $640,000/yr in lease payments to farmers ($2,000/turbine/yr)
• $2M/yr in property taxes• $5.5M/yr in O&M income• 40 long-term O&M jobs• 200 short-term
construction jobs• Doesn’t include multiplier
effect

Case Study: New MexicoCase Study: New Mexico
• 204-MW wind project built in 2003 in DeBaca and Quay counties for PNM
• 150 construction jobs• 12 permanent jobs and
$550,000/yr in salaries for operation and maintenance
• $550,000/year in lease payments to landowners
• $450,000/year in payments in lieu of taxes to county and school districts
• Over $40M in economic benefits for area over 25 years
Source: PNM, New Mexico Wind Energy Center Quick Facts, 2003.
Photo: PNM
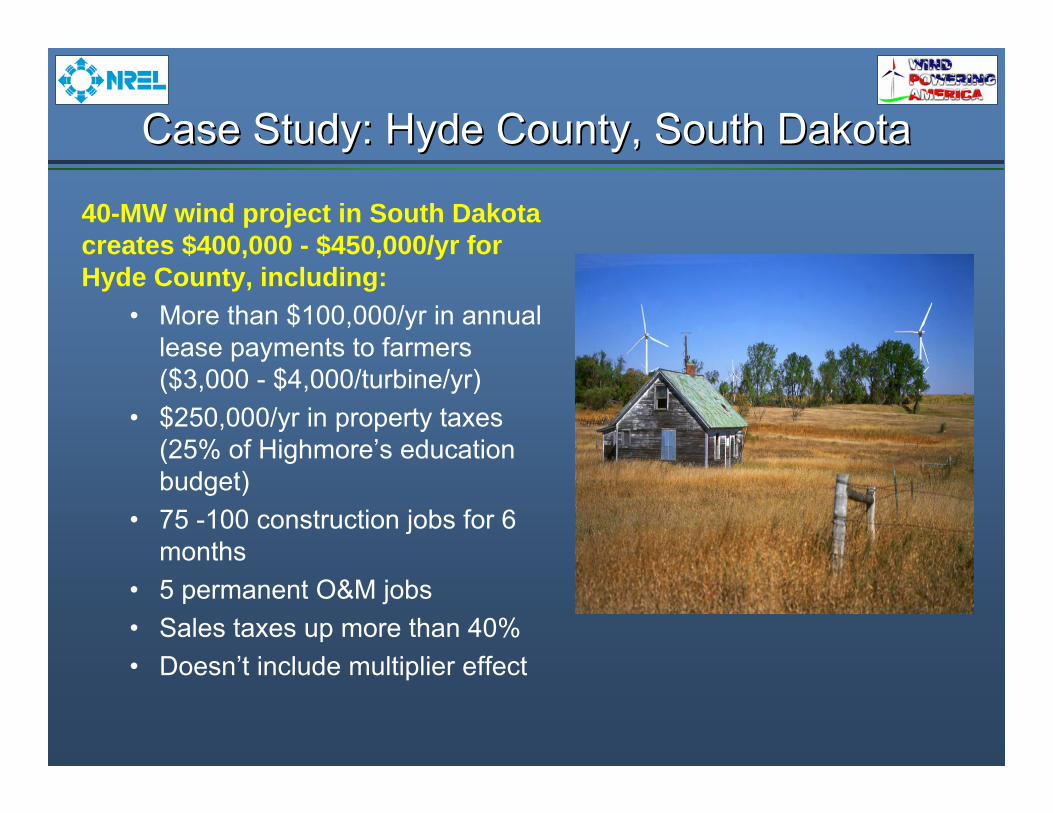
Case Study: Hyde County, South DakotaCase Study: Hyde County, South Dakota
40-MW wind project in South Dakota creates $400,000 - $450,000/yr for Hyde County, including:
• More than $100,000/yr in annual lease payments to farmers ($3,000 - $4,000/turbine/yr)
• $250,000/yr in property taxes (25% of Highmore’s education budget)
• 75 -100 construction jobs for 6 months
• 5 permanent O&M jobs• Sales taxes up more than 40%• Doesn’t include multiplier effect

Case Study: Prowers County, ColoradoCase Study: Prowers County, Colorado
“Converting the wind into a much-needed commodity while providing good jobs, the Colorado Green Wind Farm is a boost to our local economy and tax base.”
John Stulp, county commissioner, Prowers County, Colorado
• 162-MW Colorado Green Wind Farm (108 turbines)
• $200M+ investment
• 400 construction workers
• 14-20 full-time jobs
• Land lease payments $3000-$6000 per turbine
• Prowers County 2002 assessed value $94M; 2004 assessed value +33% (+$32M)
• Local district will receive 12 mil tax reduction
• Piggyback model

Colorado – Economic Impacts from 1000 MW of new wind development
Payments to Landowners: • $2.7 million/yearLocal Property Tax Revenue:• $11 million/yearConstruction Phase:• 1405 new OH construction jobs• $188.5 M to local economiesOperational Phase:• 223 new long-term jobs• $21.2 M/yr to local economies
Construction Phase:• 1225 new jobs• $130.2 M to local
economiesOperational Phase:• 181 local jobs• $20.1 M/yr to local
economies
Wind energy’s economic “ripple effect”
Construction Phase = 1-2 yearsOperational Phase = 20+ years
Total economic benefit = $1.14 billion
New local jobs during construction = 2630
New local long-term jobs= 404
Direct Impacts Indirect & Induced Impacts
Totals (construction + 20yrs)

• Minnesota farmer cooperative (Minwind)
• FLIP structure
• Farmer-owned small wind
• Farmer-owned commercial-scale
Local Ownership ModelsLocal Ownership Models
© L. Kennedy

Economic Impacts of Economic Impacts of Alternative GenerationAlternative Generation
Economic impacts of wind vs. coal in Colorado (construction + 20 yrs of operation)
$-
$100
$200
$300
$400
$500
$600
$700
$800
Wind (607 MW) Coal (250 MW fromPRB)
Coal (40% in-state)
Dol
lars
in M
illio
ns
Landowner revenue
Property taxes
Coal mining & transportOperations
Construction
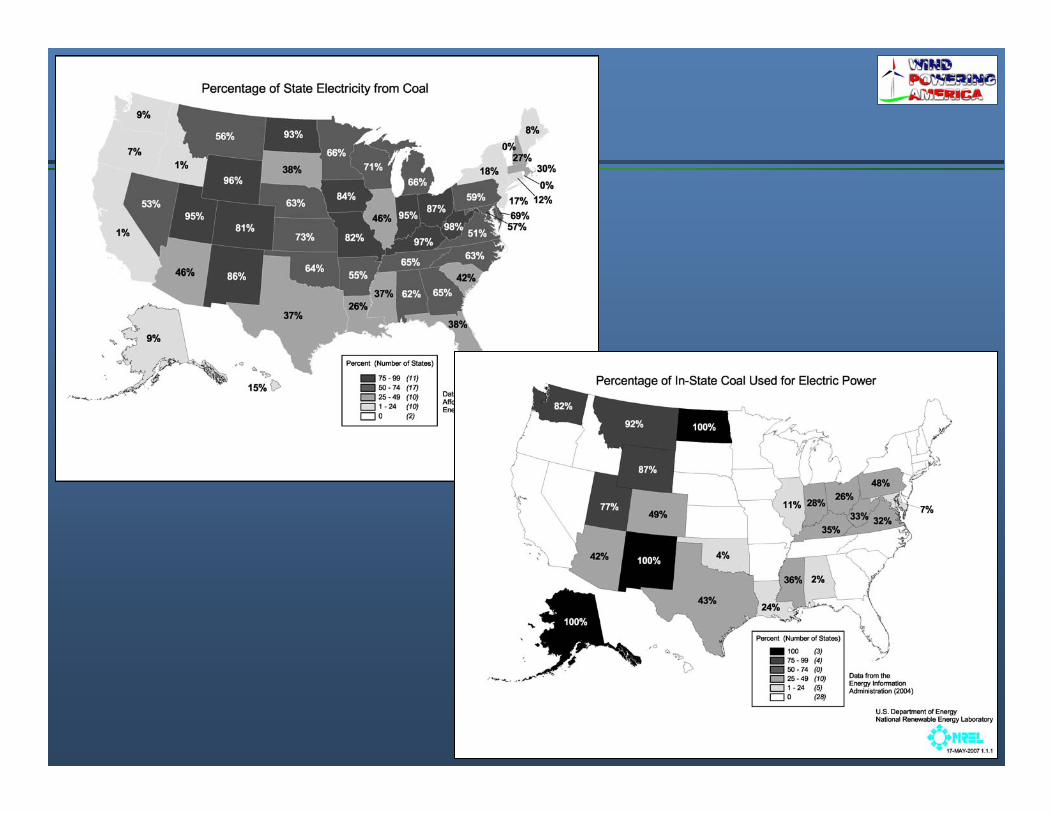
Colorado uses mostly out-of-state coal. But even with in-state coal…

Environmental BenefitsEnvironmental Benefits
• No SOx or NOx• No particulates• No mercury• No CO2• No water
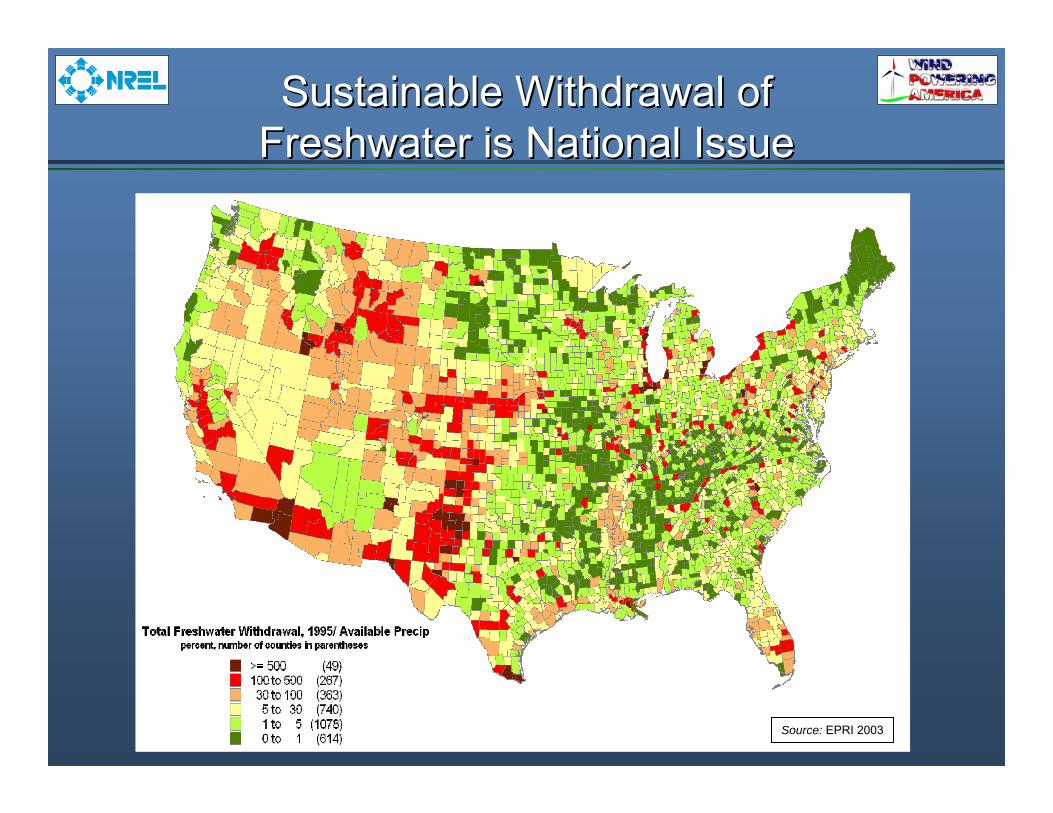
Sustainable Withdrawal of Sustainable Withdrawal of Freshwater is National IssueFreshwater is National Issue
Source: EPRI 2003

Source: NOAA
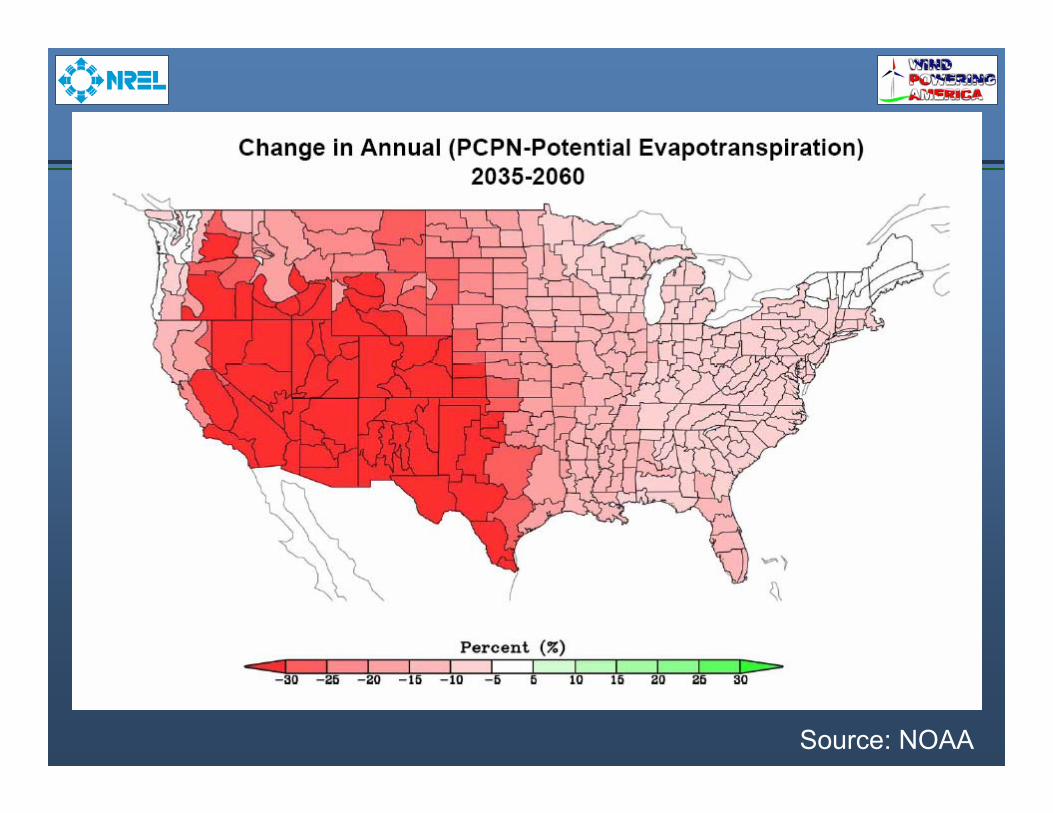
Source: NOAA

EnergyEnergy--Water NexusWater Nexus

Key Issues for Wind Power Key Issues for Wind Power
• Policy Uncertainty• Siting and Permitting: avian,
noise, visual, federal land • Transmission: FERC rules,
access, new lines
• Operational impacts: intermittency, ancillary services, allocation of costs
• Accounting for non-monetary value: green power, no fuel price risk, reduced emissions

State of the Union Address“…We will invest more in … revolutionary and…wind
technologies”
Advanced Energy Initiative“Areas with good wind resources have the potential to supply up to 20% of the electricity consumption of the United States.”
A New VisionA New VisionFor Wind Energy in the U.S.For Wind Energy in the U.S.

20% Wind20% Wind--Electricity VisionElectricity Vision
Wind energy will provide 20% of U.S. electricity needs by 2030, securing
America’s leadership in reliable, clean energy technology. As an inexhaustible and
affordable domestic resource, wind strengthens our energy security, improves
the quality of the air we breathe, slows climate change, and revitalizes rural
communities.


- 200 400 600 800 1,0000
20
40
60
80
100
120
140
Quantity Available, GW
Leve
lized
Cos
t of E
nerg
y, $
/MW
h
Onshore
Class 6
Class 4
Class 7
Class 5
Class 3
Offshore
Class 6
Class 4
Class 7
Class 5
Class 3
10% Available 10% Available TransmissionTransmission
2010 Costs w/ PTC, $1,600/MW-mile, w/o Integration costs

What does 20% Wind look like?What does 20% Wind look like?
Source: AWEA 20% Vision
0
50
100
150
200
250
300
350
400
450
500
2000 2006 2012 2018 2024 2030
Cum
ulat
ive
Inst
alle
d C
apac
ity (G
W)
0
2
4
6
8
10
12
14
16
18
Ann
ual I
nsta
lled
Cap
acity
(GW
)
Cumulative Capacity (left scale)
Annual Capacity (right scale)


Economic Impacts to Kansasfrom 7158 MW of new wind development by 2030
Direct Impacts
Payments to Landowners: • $20.8 million/yearLocal Property Tax Revenue:• $19 million/yearConstruction Phase:• 11,133 new construction jobs• $1.35B to local economiesOperational Phase:• 1805 new long-term jobs• $152M/yr to local economies
Indirect Impacts
Construction Phase:• 5,000 new jobs• $424M to local economiesOperational Phase:• 438 local jobs• $43 M/yr to local economies
Induced Impacts
Construction Phase:• 6,223 new jobs• $559 M to local economiesOperational Phase:• 850 local jobs• $76 M/yr to local economies
Wind energy’s economic “ripple effect”
Construction Phase = 1-2 yearsOperational Phase = 20+ years
Totals (construction + 20 yrs)Total economic benefit to Kansas = $7.8 billionNew local jobs during construction = over 23,000New long-term jobs for Kansans = over 3,000


20% Wind Vision Employment20% Wind Vision Employment
-
20,000
40,000
60,000
80,000
100,000
120,000
140,000
160,000
180,000
200,000
2007
2009
2011
2013
2015
2017
2019
2021
2023
2025
2027
2029
Jobs
OperationsConstructionManufacturing

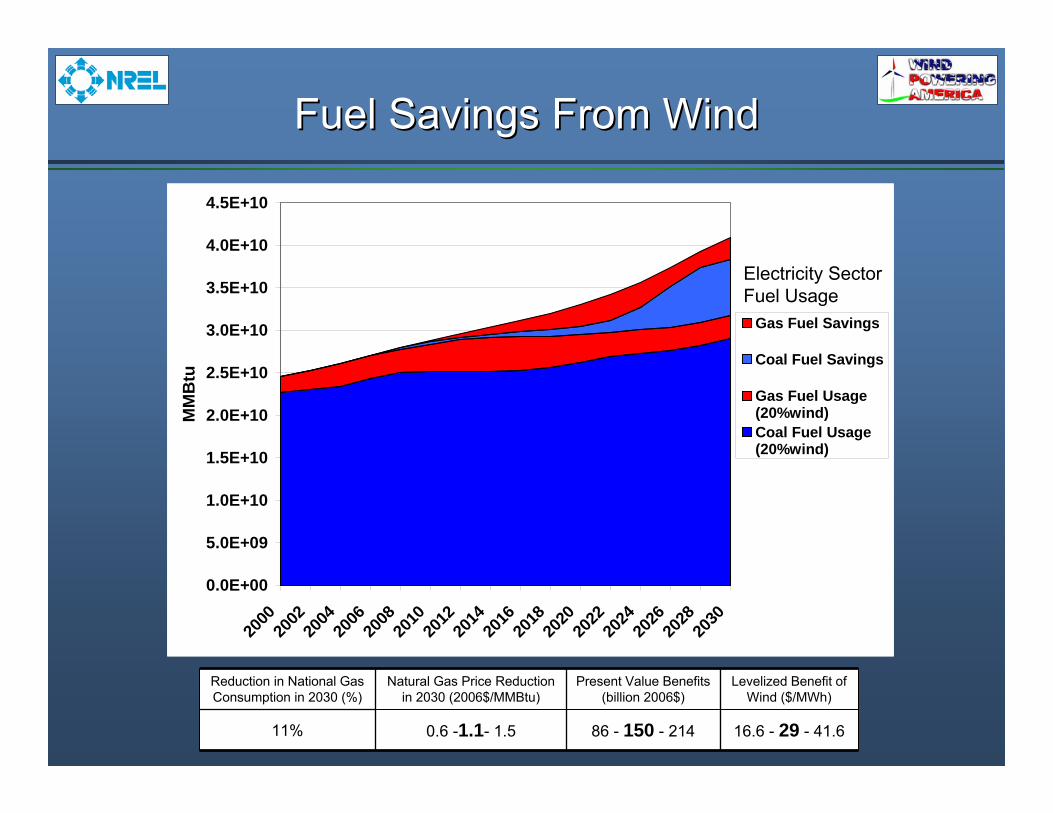
Fuel Savings From WindFuel Savings From Wind
0.0E+00
5.0E+09
1.0E+10
1.5E+10
2.0E+10
2.5E+10
3.0E+10
3.5E+10
4.0E+10
4.5E+10
2000
2002
2004
2006
2008
2010
2012
2014
2016
2018
2020
2022
2024
2026
2028
2030
MM
Btu
Gas Fuel Savings
Coal Fuel Savings
Gas Fuel Usage(20%wind)Coal Fuel Usage(20%wind)
Reduction in National GasConsumption in 2030 (%)
Natural Gas Price Reduction in 2030 (2006$/MMBtu)
Present Value Benefits(billion 2006$)
Levelized Benefit of Wind ($/MWh)
11% 0.6 -1.1- 1.5 86 - 150 - 214 16.6 - 29 - 41.6
Electricity Sector Fuel Usage

Cumulative Carbon SavingsCumulative Carbon Savings
0
500
1000
1500
2000
2500
2000 2005 2010 2015 2020 2025 2030
MM
TCE
$ 9.7/MWh - $ 28.2/MWh$ 50 - $1454,182 MMTCE
Levelized Benefit of Wind($/MWh-wind)
Present Value Benefits(billion 2006$)
CumulativeCarbon Savings
(2007-2050, MMTCE)

Incremental Cost of 20% WindVision
$0.5/month$0.6/MWh$8.6/MWh$43 billionVisionScenario
Impact on AverageHousehold Customer
($/month)**
Average IncrementalLevelized Rate Impact
($/MWh-Total)*
Average IncrementalLevelized Cost of Wind
($/MWh-Wind)*
Present ValueDirect Costs
(billion 2006$)*
* 7% real discount rate is used, as per OMB guidance; the time period of analysis is 2007-2050, with WinDSmodeling used through 2030, and extrapolations used for 2030-2050.** Assumes 11,000 kWh/year average consumption
$0
$500
$1,000
$1,500
$2,000
$2,500
$3,000
20% Wind No Wind
Bill
ion
2006
$Wind O&M
Wind Capital
Transmission
Fuel
Conventional O&M
Conventional Capital

Results: Results: CostsCosts and Benefitsand Benefits• Incremental direct cost to society • Reductions in emissions of
greenhouse gases and other atmospheric pollutants
• Reductions in water consumption• Jobs created and other economic
benefits• Reductions in natural gas use and
price pressure
$43 billion
825 M tons (2030)
$98 billion
8% total electric17% in 2030
140,000 direct$450 billion total
11%$150 billion

Major Market Distortion: External Costs Major Market Distortion: External Costs of Fossil Fuels not Reflected in Pricingof Fossil Fuels not Reflected in Pricing
(The PTCs are a bargain)(The PTCs are a bargain)

“With public sentiment nothing can fail; without it, nothing can succeed.”
- A. Lincoln

ConclusionsConclusions
• 20% wind energy penetration is possible• 20% penetration is not going to happen under business
as usual scenario• Policy choices will have a large impact on assessing the
timing and rate of achieving a 20% goal• Key Issues: market transformation, transmission, project
diversity, technology development, policy, public acceptance
• 20% Vision action plan: December 2007
Source: AWEA 20% Vision

Humanity’s Top Ten Humanity’s Top Ten Problems for next 50 yearsProblems for next 50 years
1. Energy
2. Water
3. Food
4. Environment
5. Poverty
6. Terrorism & War
7. Disease
8. Education
9. Democracy
10.Population
2003: 6.3 Billion people
2050: 9-10 Billion peopleSource: Nobel laureate, Richard Smalley

Carpe Ventem
www.windpoweringamerica.gov