wind energy - status and current issues · plus network losses + _ wind energy:- current status...
TRANSCRIPT
Lecture for the Engineers Australia, Southern Highlands Group23 March 2006Hugh OuthredCentre for Energy and Environmental MarketsThe University of New South Wales
Wind Energy - status and current issues
2Wind energy:- current status & issues March 2006
Outline� Why the interest in wind energy?� Trends in wind farm installations� Wind energy as intermittent generation� Planning issues� Network-related issues � Power variability issues
– Forecasting; spot & derivative markets
� Commercial viability of wind farms in the NEM
3Wind energy:- current status & issues March 2006
4Wind energy:- current status & issues March 2006
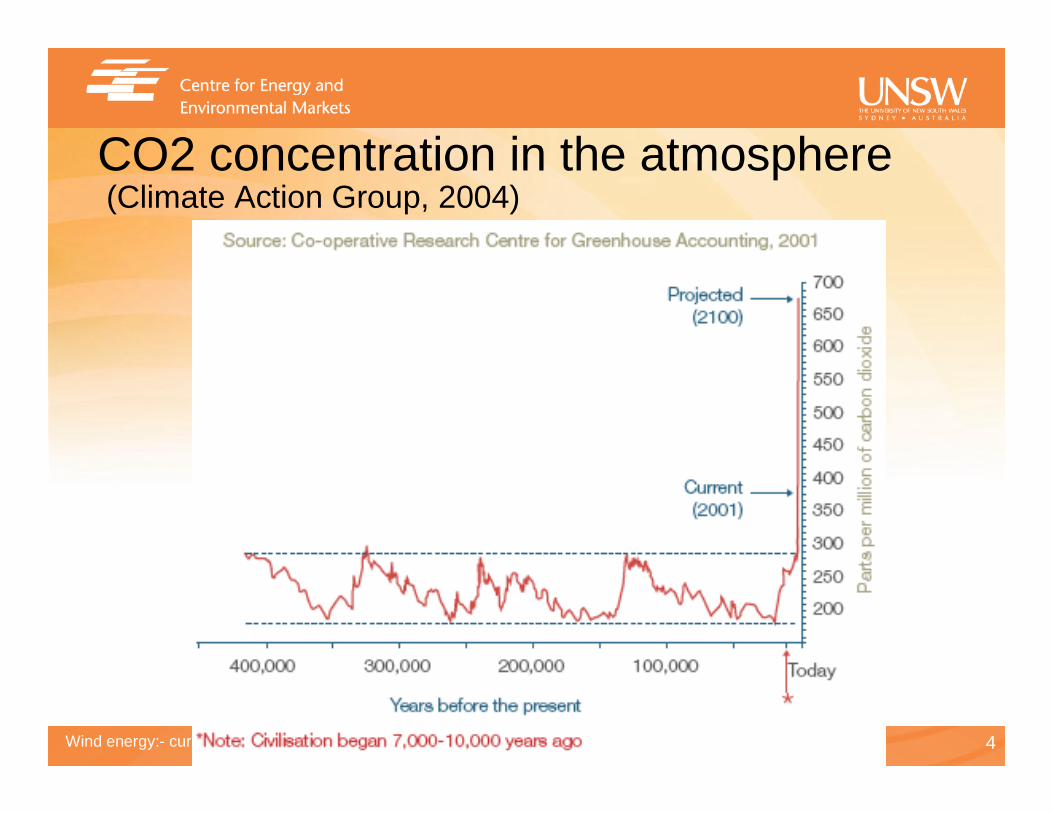
CO2 concentration in the atmosphere(Climate Action Group, 2004)
5Wind energy:- current status & issues March 2006
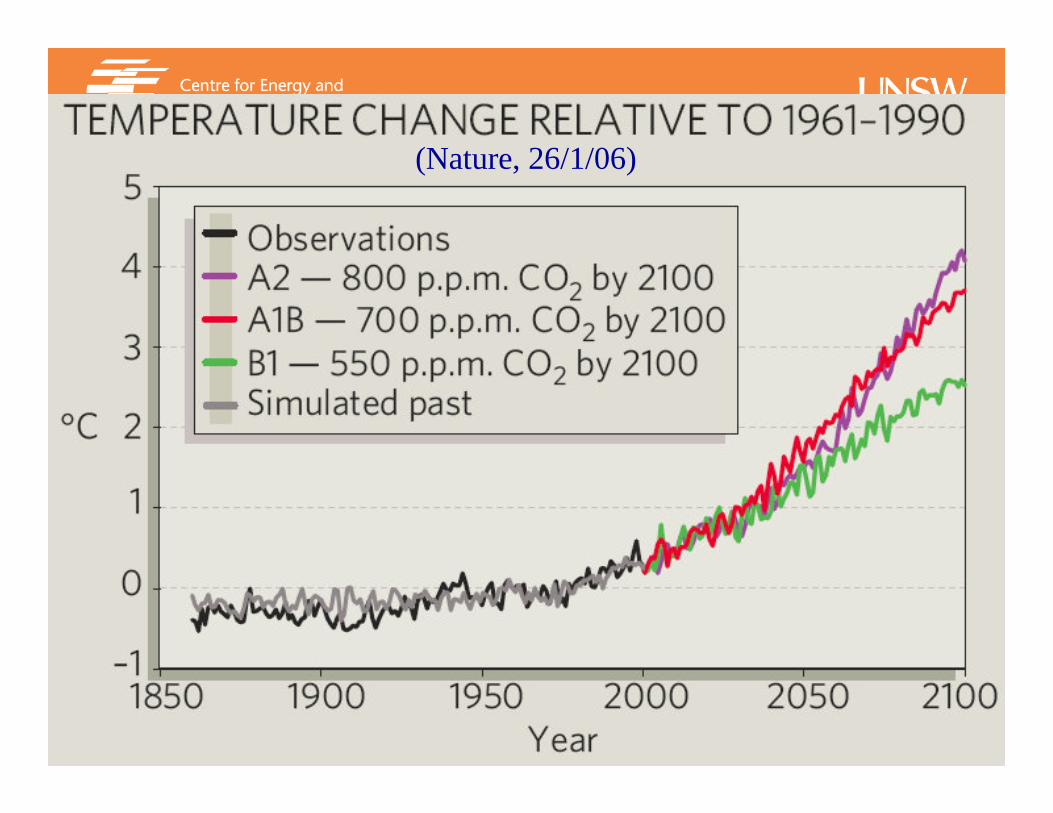
(Nature, 26/1/06)
6Wind energy:- current status & issues March 2006
Expected climate change impacts on Australia (Senate Environment Committee, 2000)
� Australia probably “very negatively affected”:– Large size, long coastline, soil salinity, exposure
to cyclones & El Nino/La Nina cycle, economic dependence on agriculture & tourism
� Likely changes in next 50 years:– Higher temperatures, more frequent extreme
weather events, reduced available water resources, reduced area of arable land, reduced crop & livestock yield & quality, severe damage to coral reefs
7Wind energy:- current status & issues March 2006
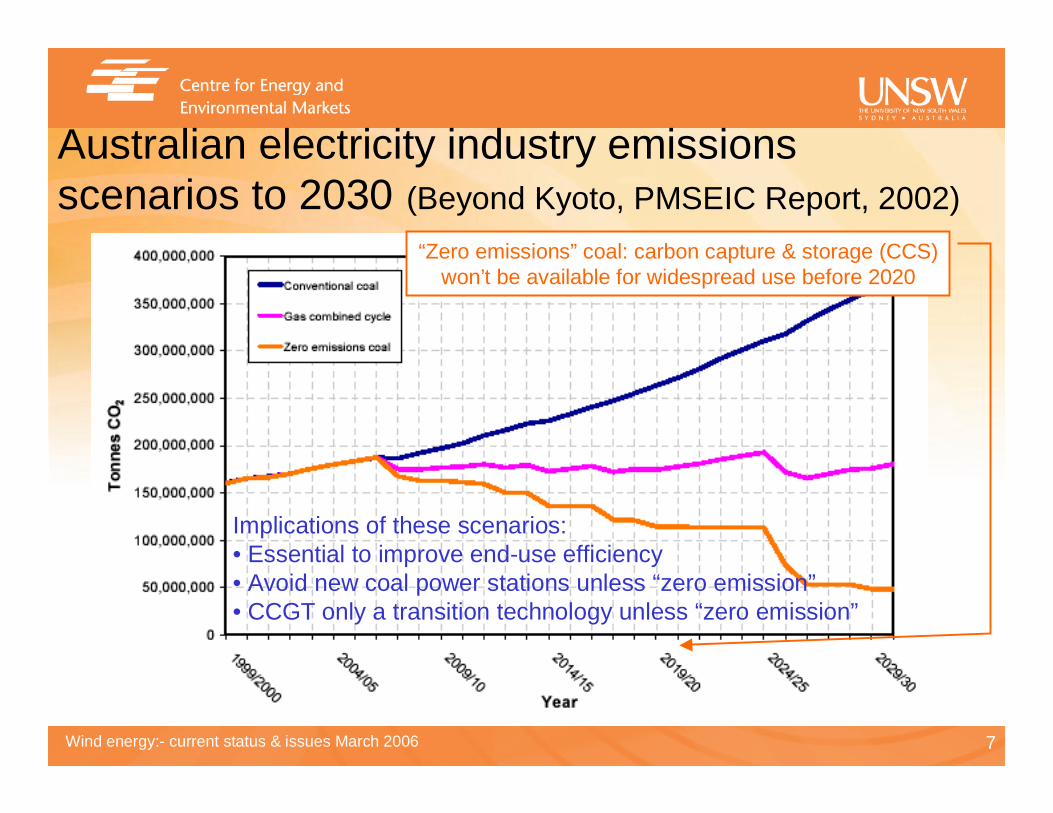
Australian electricity industry emissions scenarios to 2030 (Beyond Kyoto, PMSEIC Report, 2002)
Implications of these scenarios:• Essential to improve end-use efficiency• Avoid new coal power stations unless “zero emission”• CCGT only a transition technology unless “zero emission”
“Zero emissions” coal: carbon capture & storage (CCS)won’t be available for widespread use before 2020
8Wind energy:- current status & issues March 2006
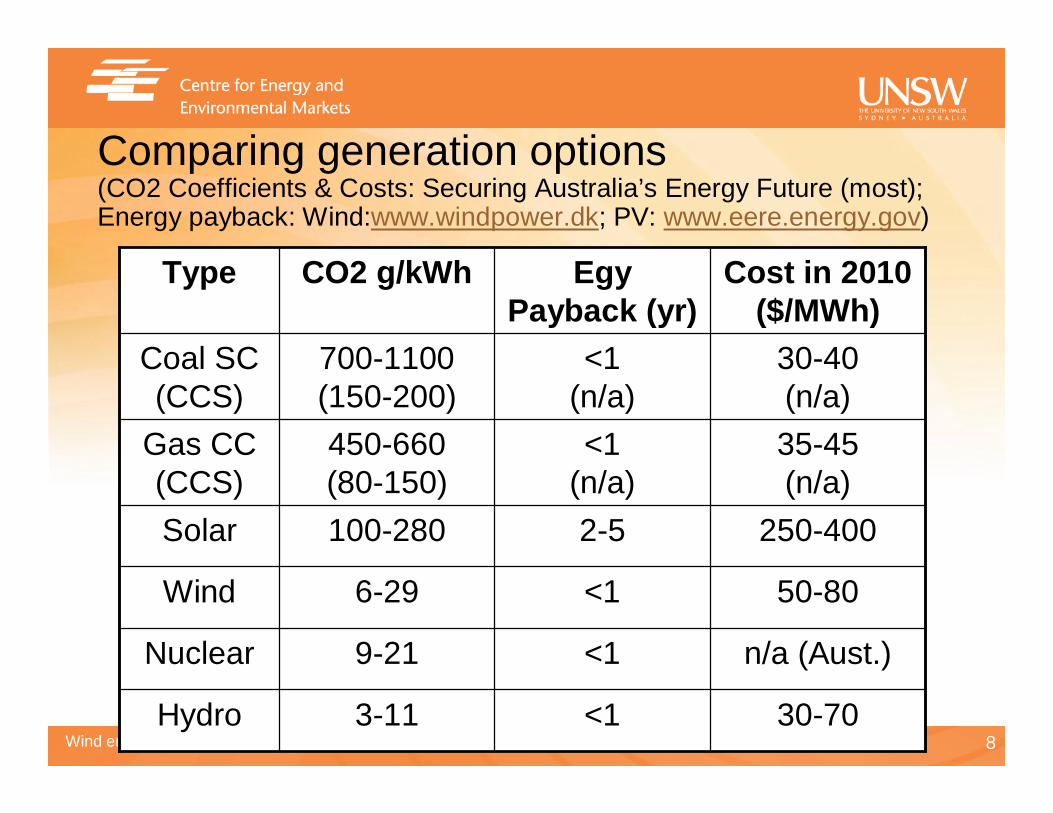
Comparing generation options(CO2 Coefficients & Costs: Securing Australia’s Energy Future (most); Energy payback: Wind:www.windpower.dk; PV: www.eere.energy.gov)
<1
<1
<1
2-5
<1(n/a)
<1(n/a)
Egy Payback (yr)
3-11
9-21
6-29
100-280
450-660(80-150)
700-1100 (150-200)
CO2 g/kWh
30-70Hydro
n/a (Aust.)Nuclear
50-80Wind
250-400Solar
35-45(n/a)
Gas CC (CCS)
30-40(n/a)
Coal SC (CCS)
Cost in 2010 ($/MWh)
Type

9Wind energy:- current status & issues March 2006
(World Wind Assoc, 2006)
Global installed wind capacity (MW)
10Wind energy:- current status & issues March 2006
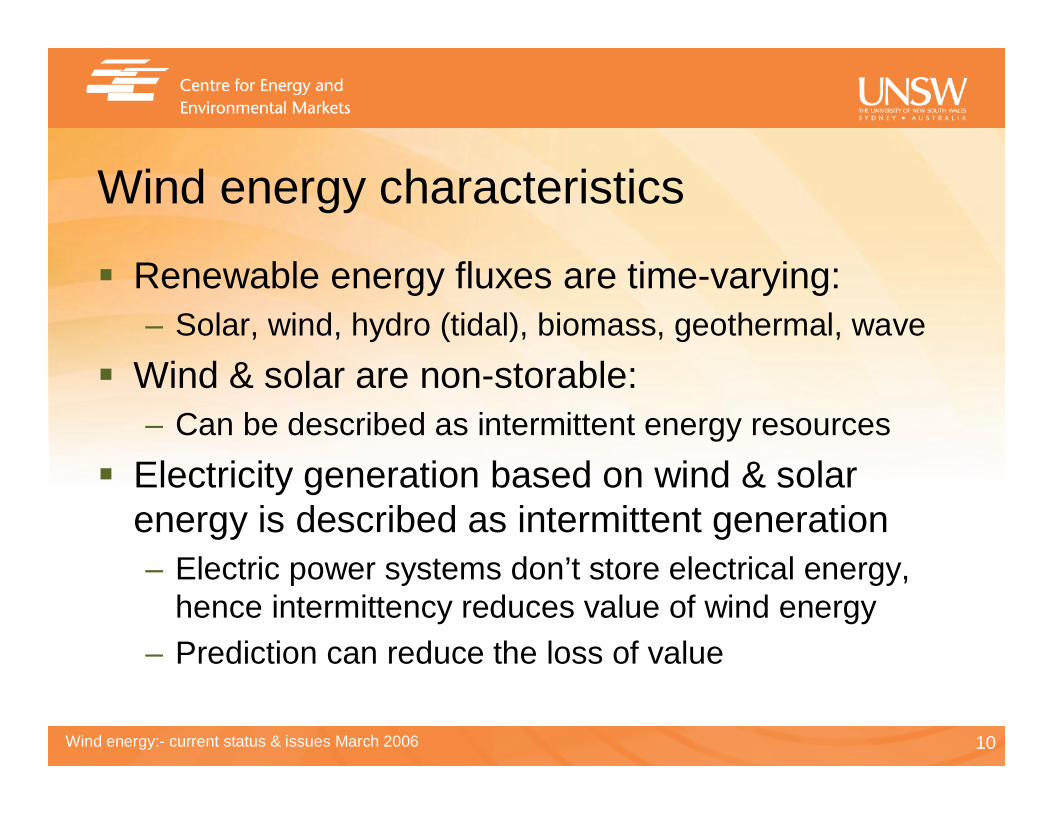
Wind energy characteristics
� Renewable energy fluxes are time-varying:– Solar, wind, hydro (tidal), biomass, geothermal, wave
� Wind & solar are non-storable:– Can be described as intermittent energy resources
� Electricity generation based on wind & solar energy is described as intermittent generation– Electric power systems don’t store electrical energy,
hence intermittency reduces value of wind energy– Prediction can reduce the loss of value
11Wind energy:- current status & issues March 2006
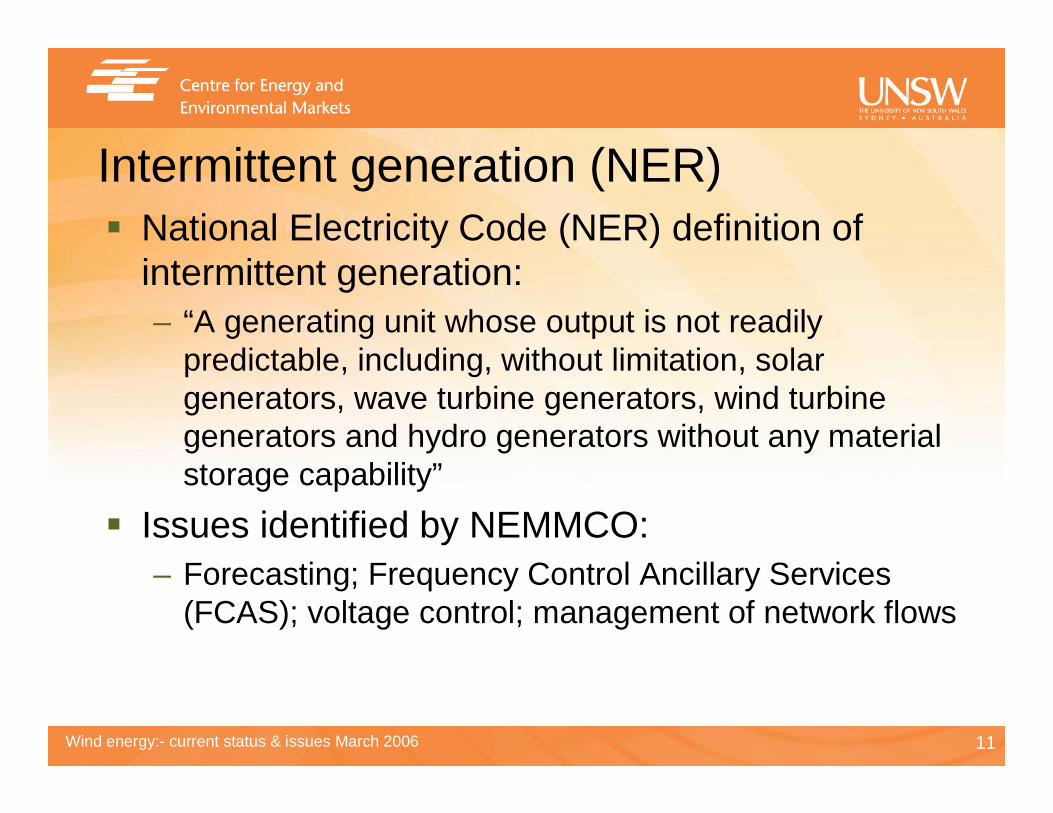
Intermittent generation (NER)� National Electricity Code (NER) definition of
intermittent generation:– “A generating unit whose output is not readily
predictable, including, without limitation, solar generators, wave turbine generators, wind turbine generators and hydro generators without any material storage capability”
� Issues identified by NEMMCO:– Forecasting; Frequency Control Ancillary Services
(FCAS); voltage control; management of network flows
12Wind energy:- current status & issues March 2006
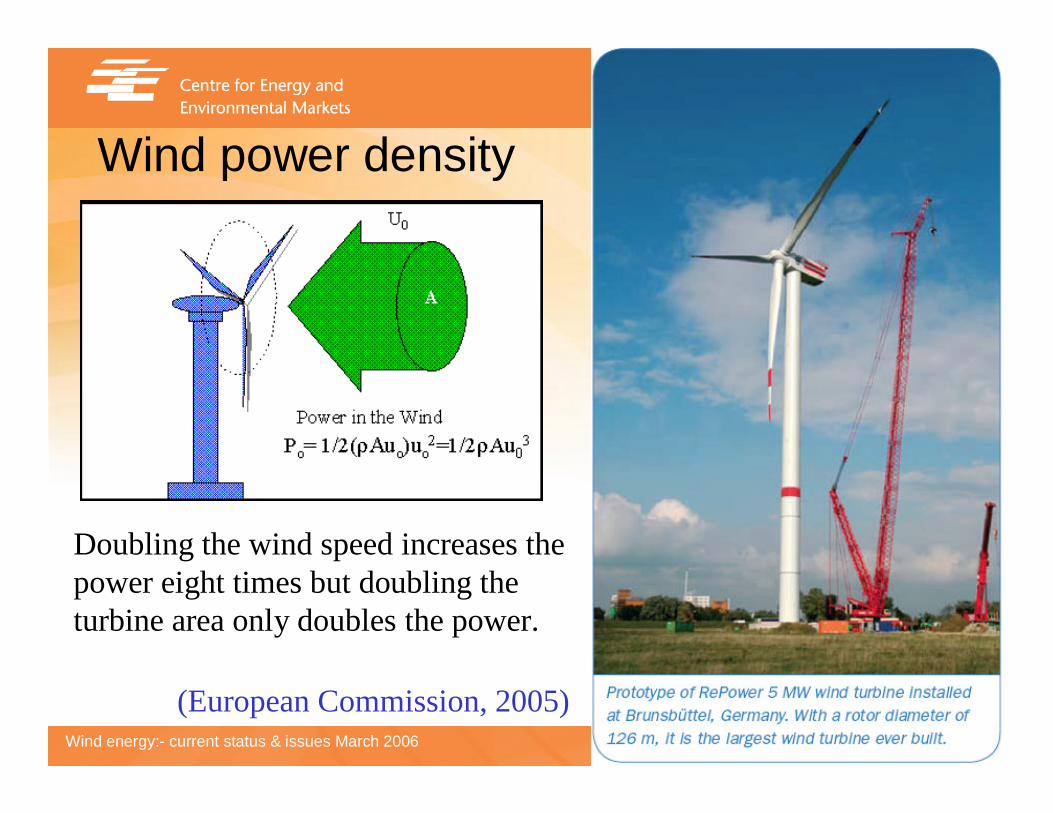
Wind power density
Doubling the wind speed increases the power eight times but doubling the turbine area only doubles the power.
(European Commission, 2005)
13Wind energy:- current status & issues March 2006
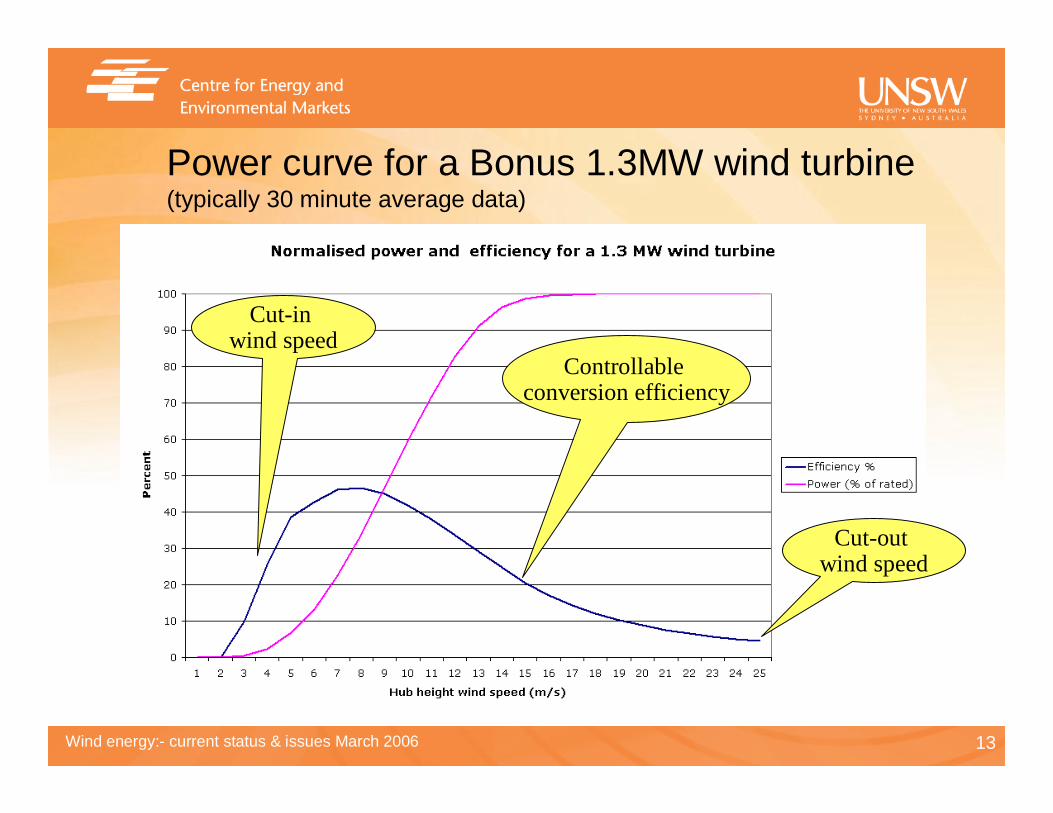
Power curve for a Bonus 1.3MW wind turbine(typically 30 minute average data)
Controllableconversion efficiency
Cut-out wind speed
Cut-in wind speed
14Wind energy:- current status & issues March 2006
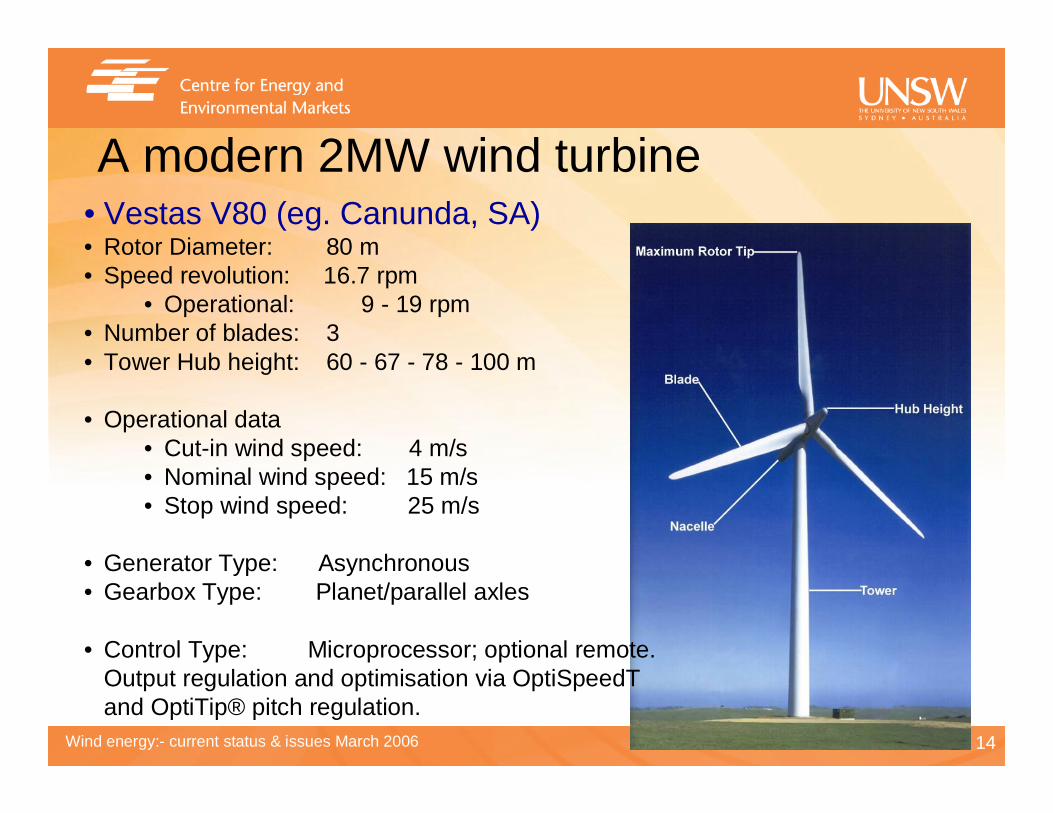
A modern 2MW wind turbine• Vestas V80 (eg. Canunda, SA)• Rotor Diameter: 80 m• Speed revolution: 16.7 rpm
• Operational: 9 - 19 rpm• Number of blades: 3• Tower Hub height: 60 - 67 - 78 - 100 m
• Operational data • Cut-in wind speed: 4 m/s• Nominal wind speed: 15 m/s• Stop wind speed: 25 m/s
• Generator Type: Asynchronous• Gearbox Type: Planet/parallel axles
• Control Type: Microprocessor; optional remote.Output regulation and optimisation via OptiSpeedT and OptiTip® pitch regulation.
15Wind energy:- current status & issues March 2006
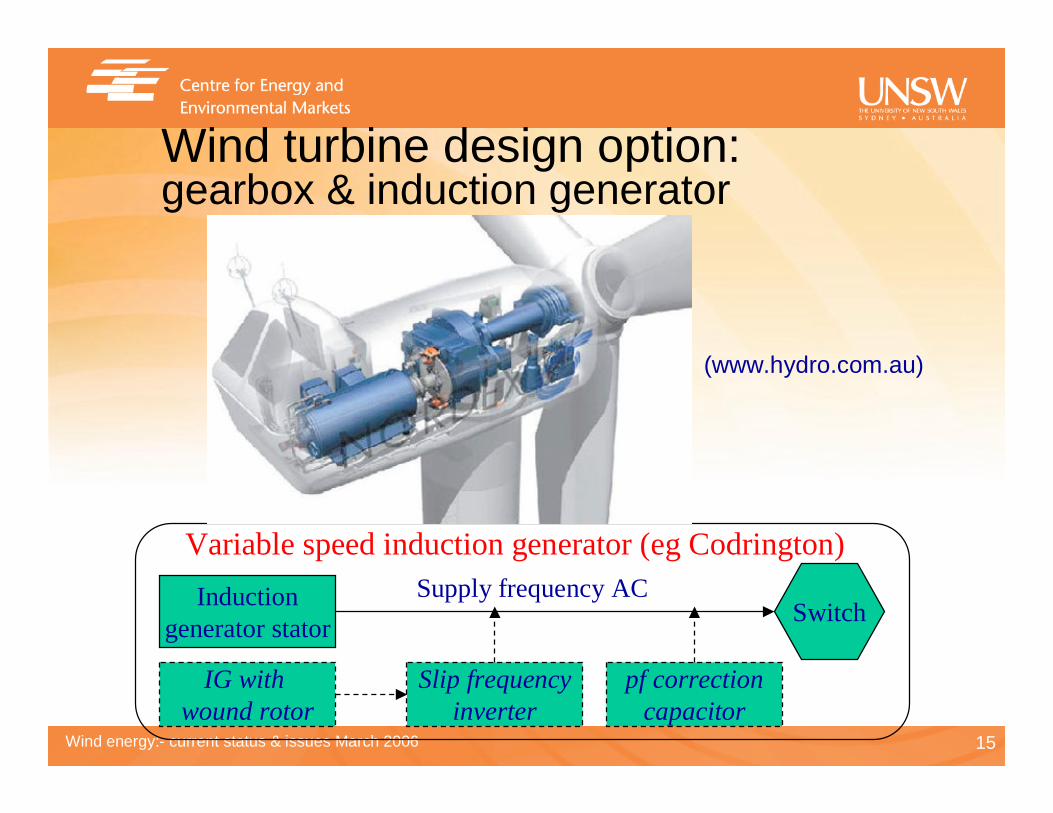
Wind turbine design option: gearbox & induction generator
SwitchInduction
generator stator
Supply frequency AC
Variable speed induction generator (eg Codrington)
IG with wound rotor
Slip frequencyinverter
pf correctioncapacitor
(www.hydro.com.au)

16Wind energy:- current status & issues March 2006
Wind turbine design option: direct-drive variable speed alternator
Inverter SwitchRectifierAlternator
variablefrequency AC
supplyfrequency AC
DC
Variable speed alternator & inverter (eg Albany)
Load bank
(www.enercon.de)
17Wind energy:- current status & issues March 2006
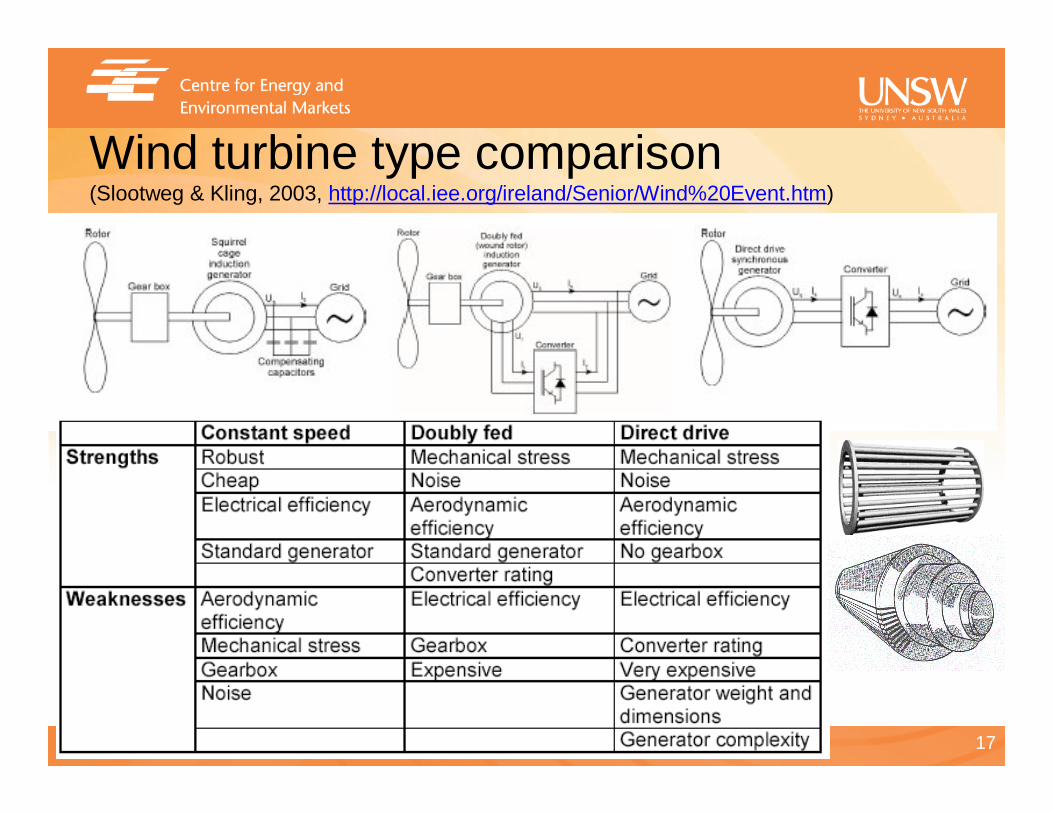
Wind turbine type comparison(Slootweg & Kling, 2003, http://local.iee.org/ireland/Senior/Wind%20Event.htm)
18Wind energy:- current status & issues March 2006
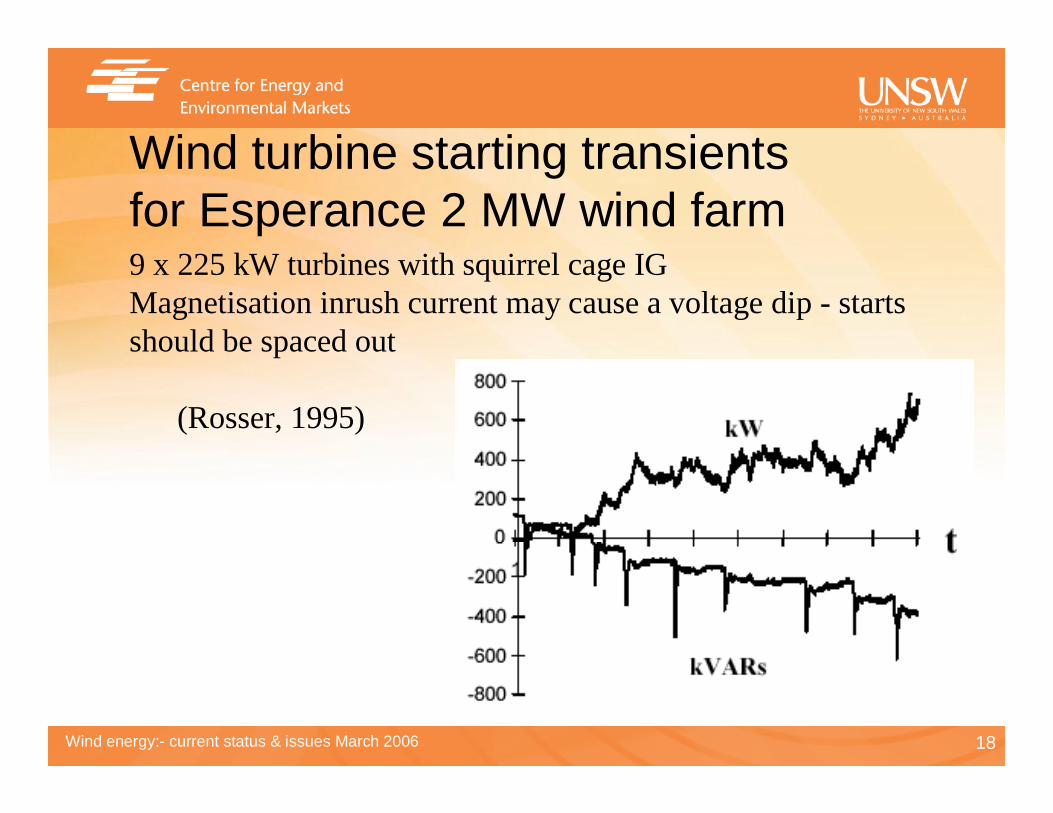
Wind turbine starting transients for Esperance 2 MW wind farm 9 x 225 kW turbines with squirrel cage IGMagnetisation inrush current may cause a voltage dip - starts should be spaced out
(Rosser, 1995)

19Wind energy:- current status & issues March 2006(European Commission, 2005)
20Wind energy:- current status & issues March 2006
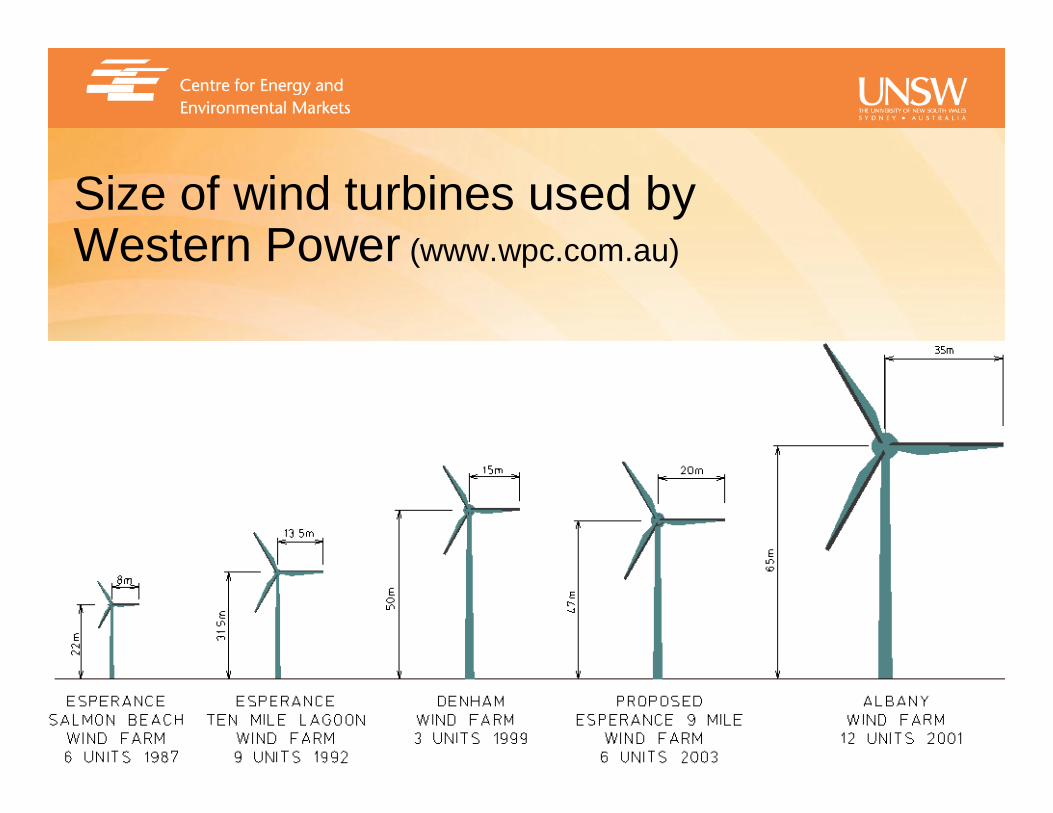
Size of wind turbines used by Western Power (www.wpc.com.au)
21Wind energy:- current status & issues March 2006
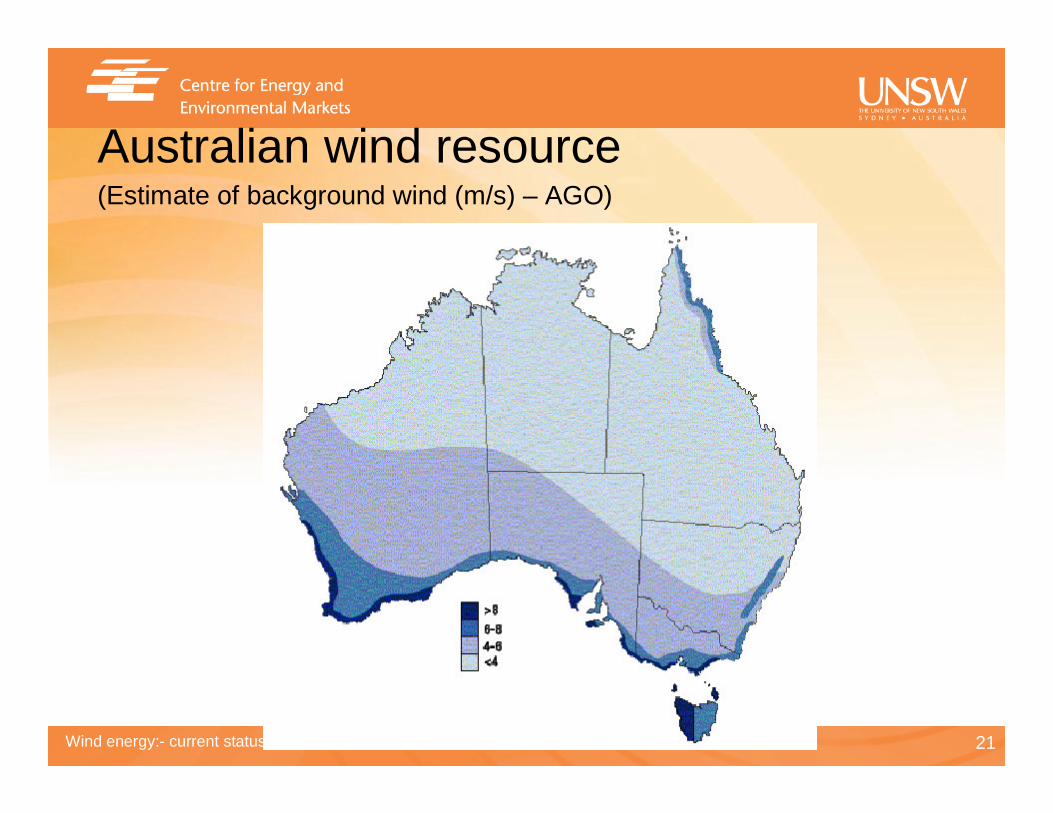
Australian wind resource(Estimate of background wind (m/s) – AGO)

22Wind energy:- current status & issues March 2006
SEDA NSW Wind atlas(www.seda.nsw.gov.au)
23Wind energy:- current status & issues March 2006
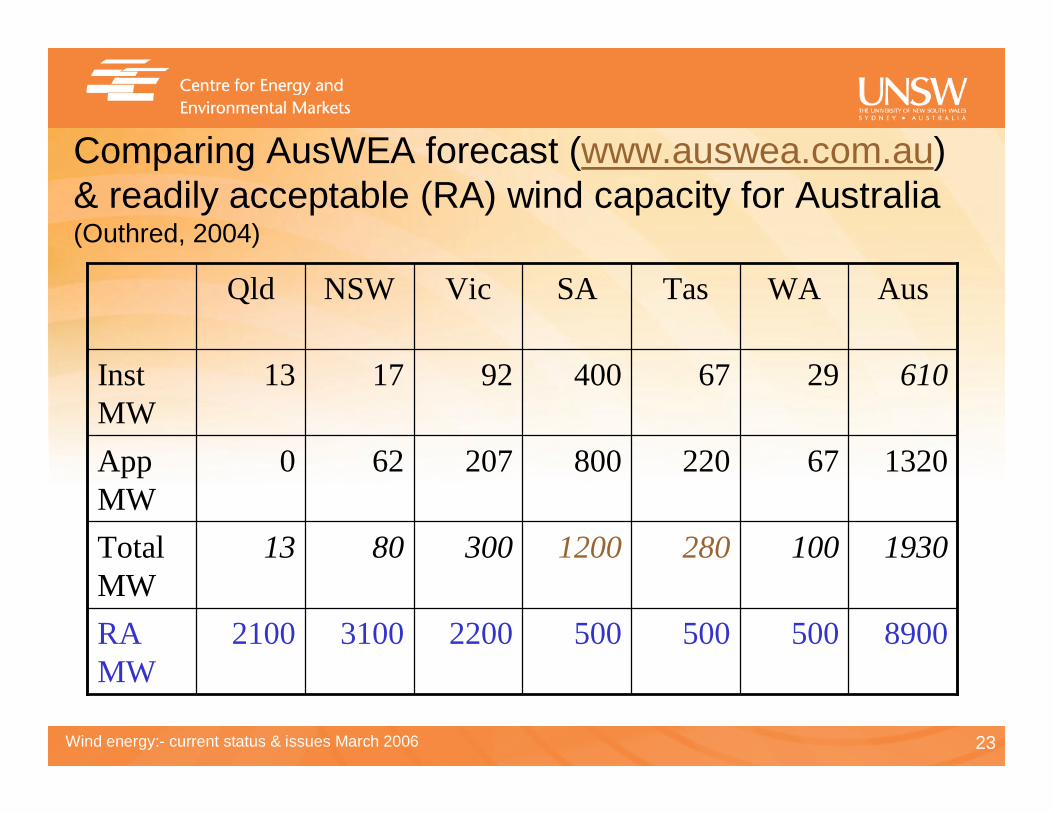
Comparing AusWEA forecast (www.auswea.com.au) & readily acceptable (RA) wind capacity for Australia(Outhred, 2004)
8900500500500220031002100RA MW
193010028012003008013Total MW
132067220800207620App MW
6102967400921713Inst MW
AusWATasSAVicNSWQld

24Wind energy:- current status & issues March 2006
Australian wind farm planning
� AusWEA best practice guidelines:– www.auswea.com.au
� State handbooks & planning protocols:– NSW (SEDA); Victoria (SEAV):� Project-based, some variations between states
� Stages in the process (AusWEA):– Site selection; feasibility; detailed assessment,
development application; construction; operation; decommissioning
25Wind energy:- current status & issues March 2006
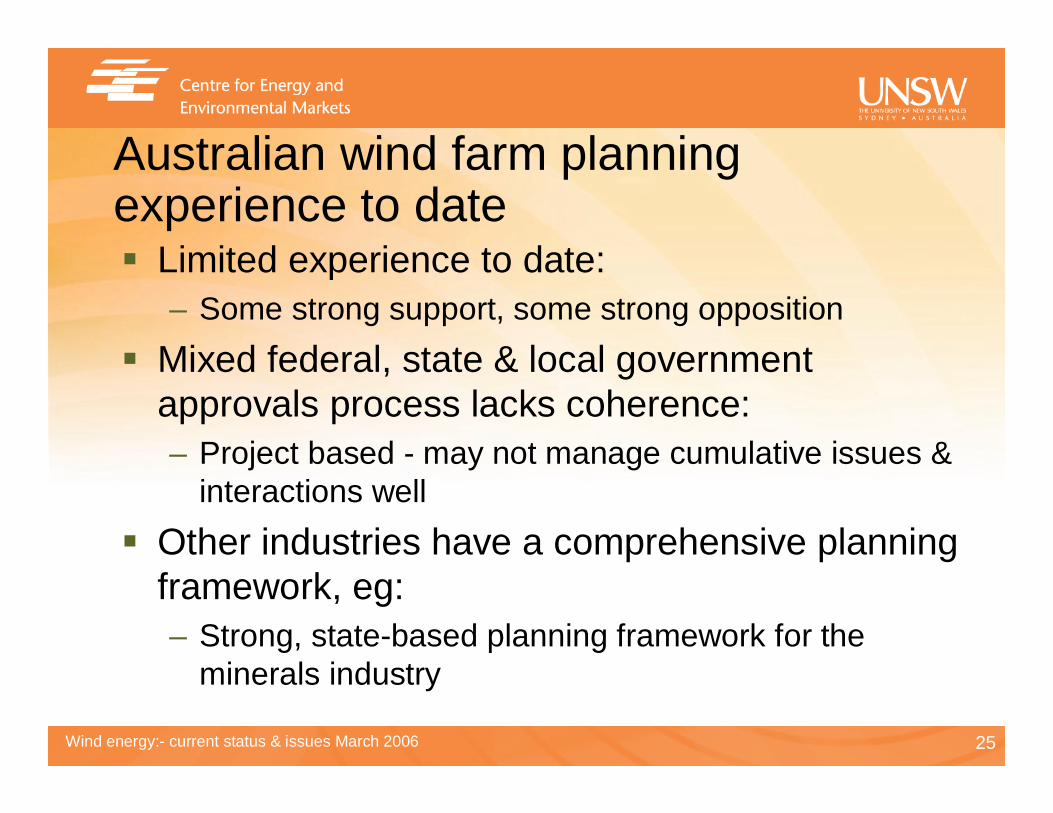
Australian wind farm planning experience to date� Limited experience to date:
– Some strong support, some strong opposition
� Mixed federal, state & local government approvals process lacks coherence:– Project based - may not manage cumulative issues &
interactions well
� Other industries have a comprehensive planning framework, eg:– Strong, state-based planning framework for the
minerals industry
26Wind energy:- current status & issues March 2006
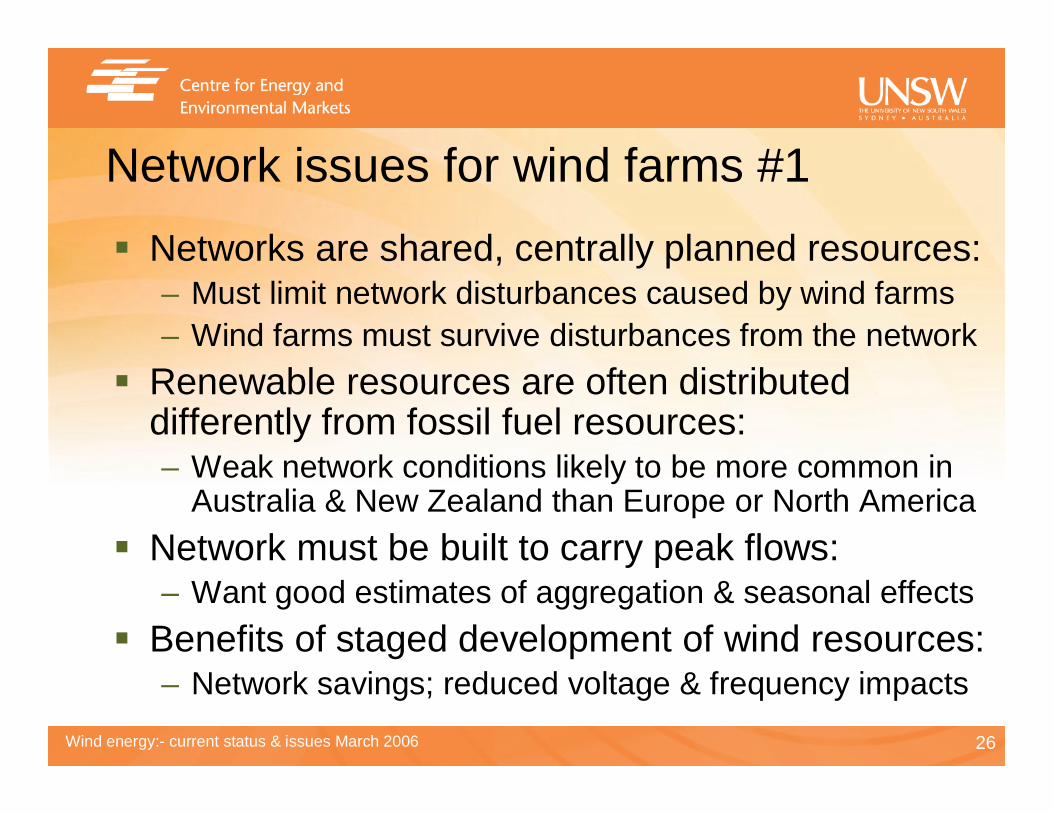
Network issues for wind farms #1
� Networks are shared, centrally planned resources:– Must limit network disturbances caused by wind farms– Wind farms must survive disturbances from the network
� Renewable resources are often distributed differently from fossil fuel resources:– Weak network conditions likely to be more common in
Australia & New Zealand than Europe or North America
� Network must be built to carry peak flows:– Want good estimates of aggregation & seasonal effects
� Benefits of staged development of wind resources:– Network savings; reduced voltage & frequency impacts
27Wind energy:- current status & issues March 2006
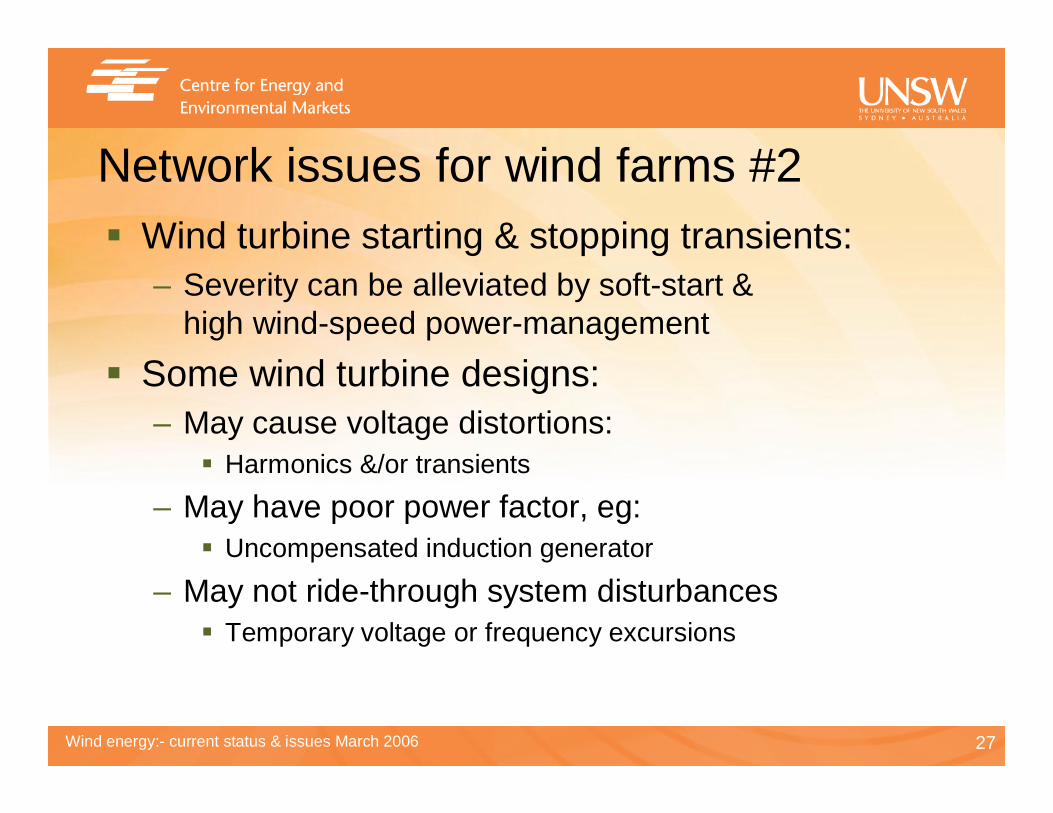
Network issues for wind farms #2� Wind turbine starting & stopping transients:
– Severity can be alleviated by soft-start & high wind-speed power-management
� Some wind turbine designs:– May cause voltage distortions:� Harmonics &/or transients
– May have poor power factor, eg:� Uncompensated induction generator
– May not ride-through system disturbances� Temporary voltage or frequency excursions
28Wind energy:- current status & issues March 2006
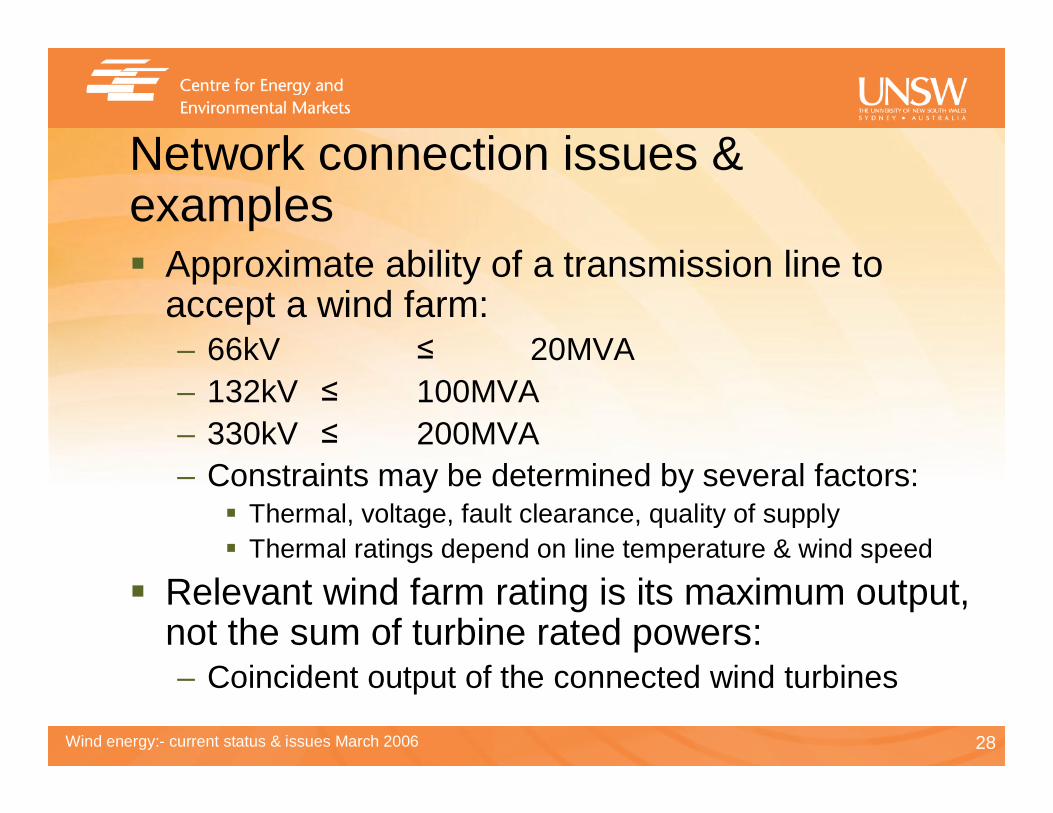
Network connection issues & examples� Approximate ability of a transmission line to
accept a wind farm:– 66kV ≤ 20MVA– 132kV ≤ 100MVA– 330kV ≤ 200MVA– Constraints may be determined by several factors:� Thermal, voltage, fault clearance, quality of supply� Thermal ratings depend on line temperature & wind speed
� Relevant wind farm rating is its maximum output, not the sum of turbine rated powers:– Coincident output of the connected wind turbines
29Wind energy:- current status & issues March 2006
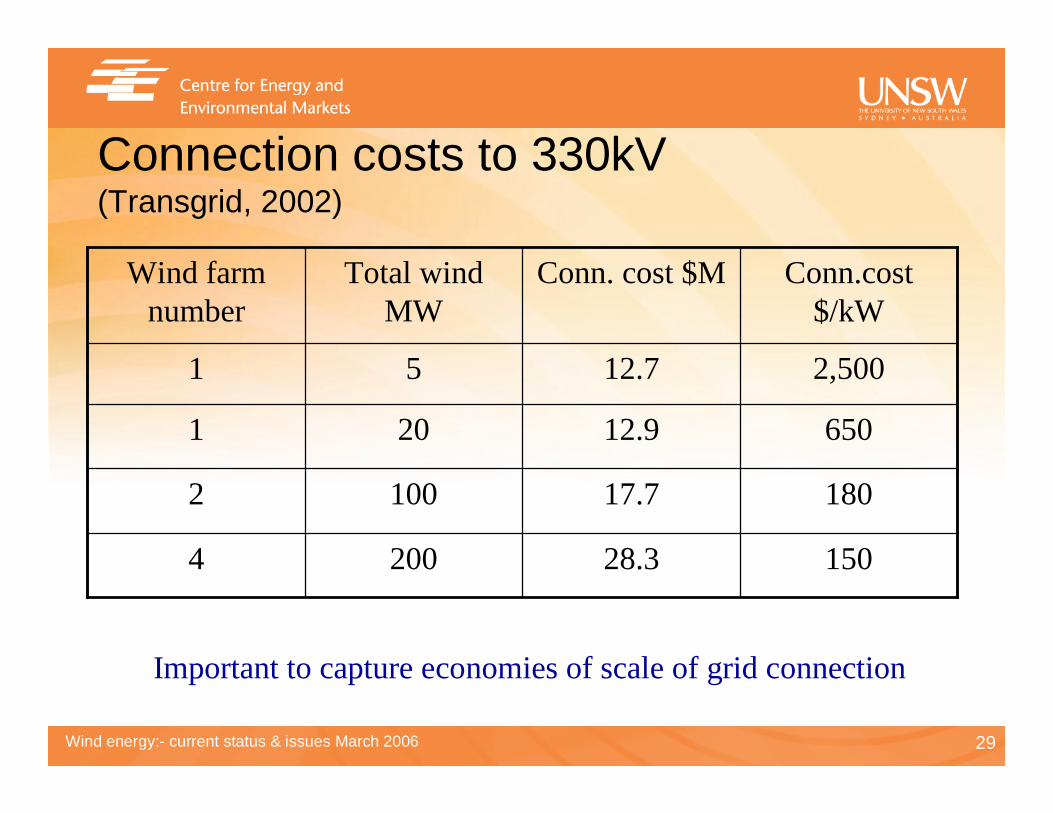
Connection costs to 330kV(Transgrid, 2002)
15028.32004
18017.71002
65012.9201
2,50012.751
Conn.cost$/kW
Conn. cost $MTotal wind MW
Wind farm number
Important to capture economies of scale of grid connection

30Wind energy:- current status & issues March 2006
Wind resource & network issues in South Australia
Map: ESIPC, 2002
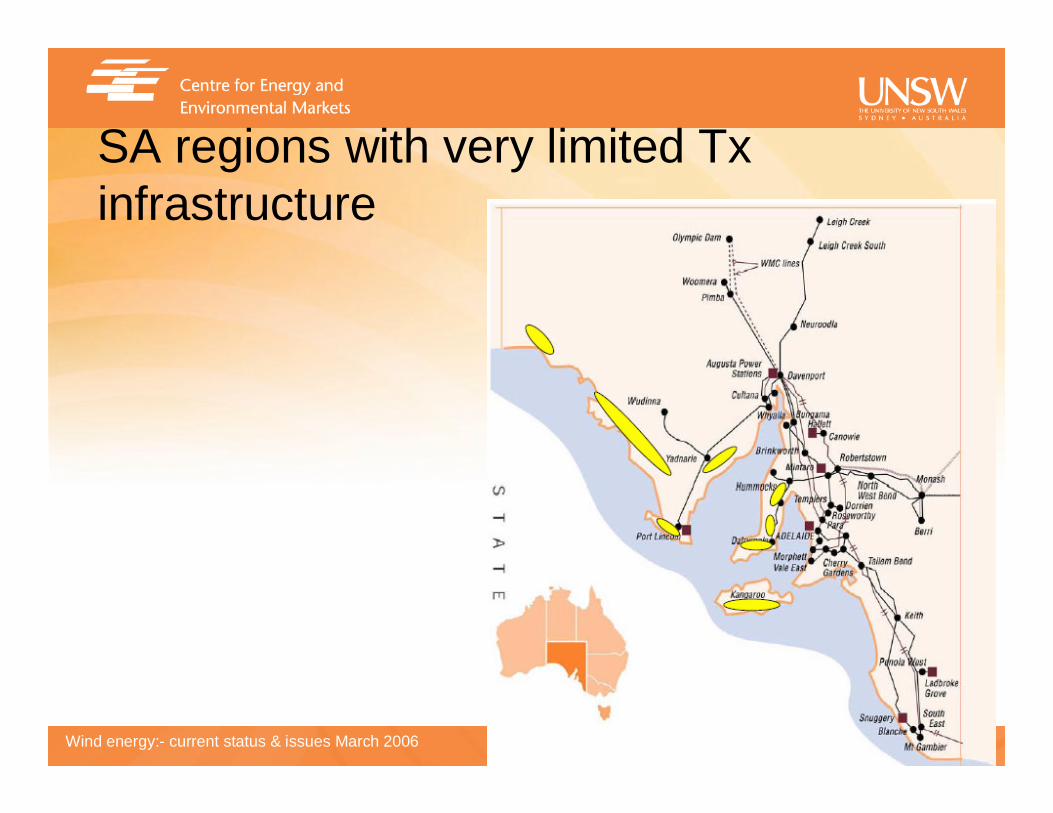
Good wind resources along entire coastline including:
• Eyre Peninsula• Yorke Peninsula• Fleurieu Peninsula• Kangaroo Island• South-East
Sites available for up to 2000MW

31Wind energy:- current status & issues March 2006
SA regions with existing Tx infrastructure
� Opportunities to interconnect large wind farms but potential impacts on existing generation and interconnection capability
32Wind energy:- current status & issues March 2006
SA regions with very limited Tx infrastructure
33Wind energy:- current status & issues March 2006
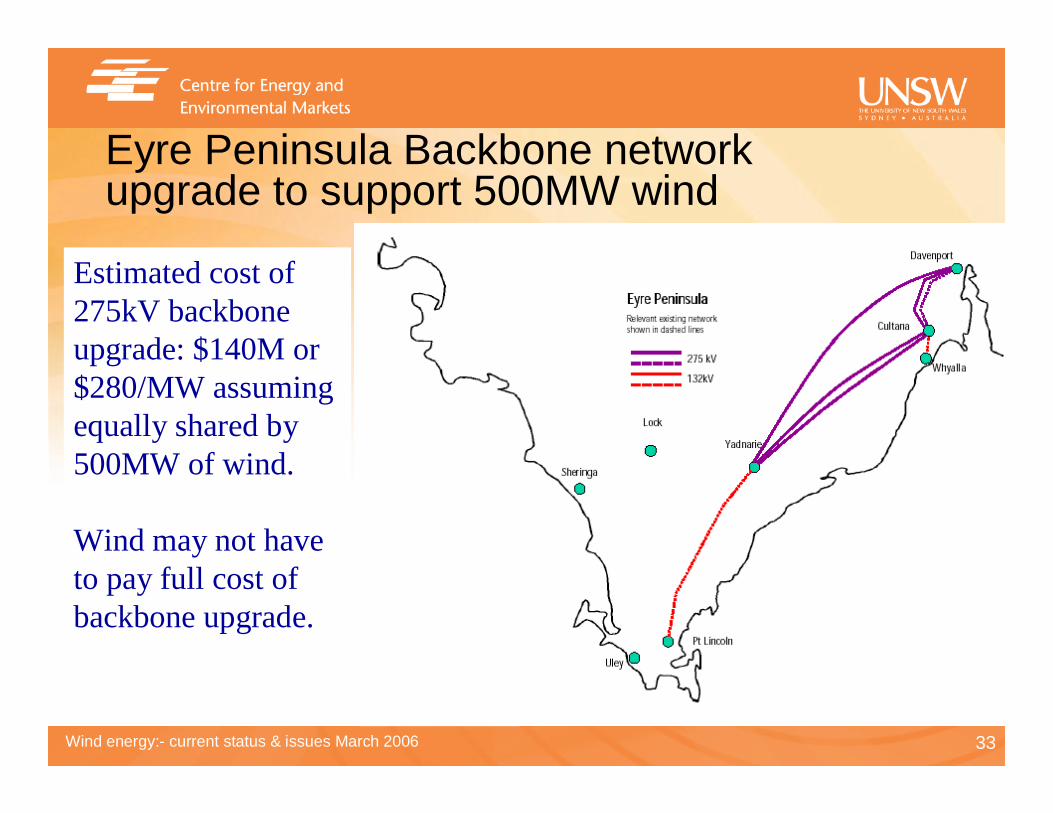
Eyre Peninsula Backbone network upgrade to support 500MW wind
(Meritec, 2002)
Estimated cost of 275kV backbone upgrade: $140M or $280/MW assuming equally shared by 500MW of wind.
Wind may not have to pay full cost of backbone upgrade.
34Wind energy:- current status & issues March 2006
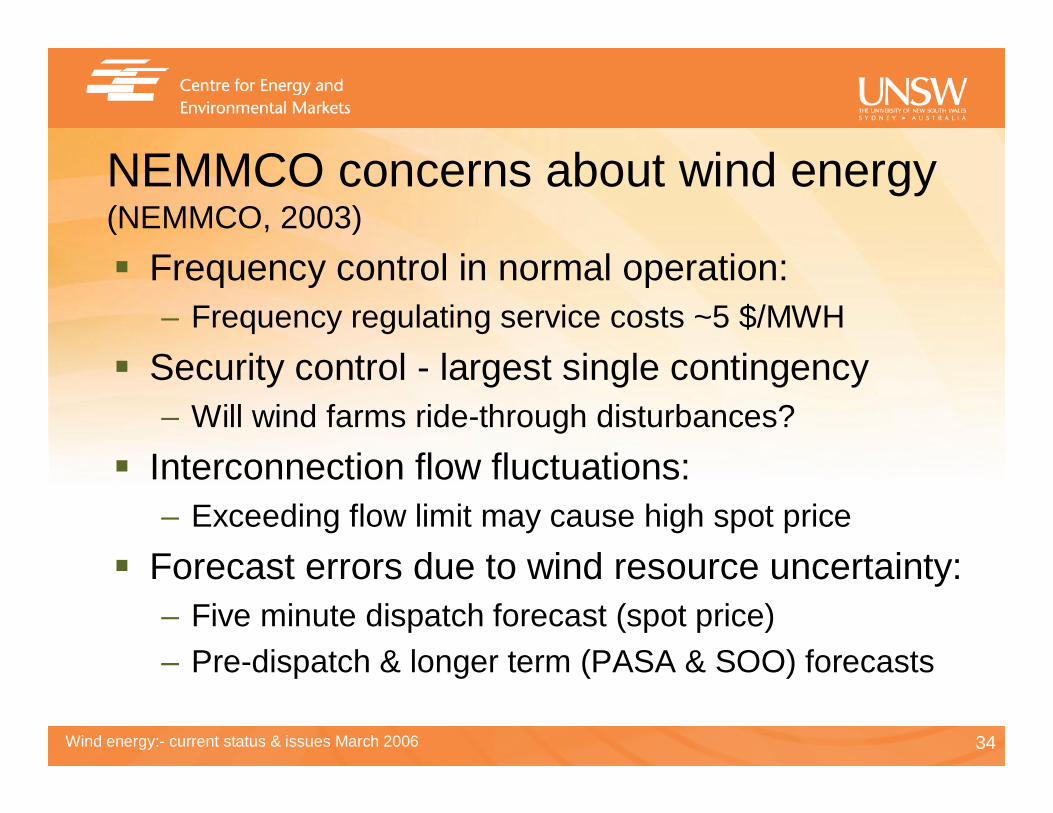
NEMMCO concerns about wind energy (NEMMCO, 2003)
� Frequency control in normal operation:– Frequency regulating service costs ~5 $/MWH
� Security control - largest single contingency– Will wind farms ride-through disturbances?
� Interconnection flow fluctuations:– Exceeding flow limit may cause high spot price
� Forecast errors due to wind resource uncertainty:– Five minute dispatch forecast (spot price)– Pre-dispatch & longer term (PASA & SOO) forecasts
35Wind energy:- current status & issues March 2006
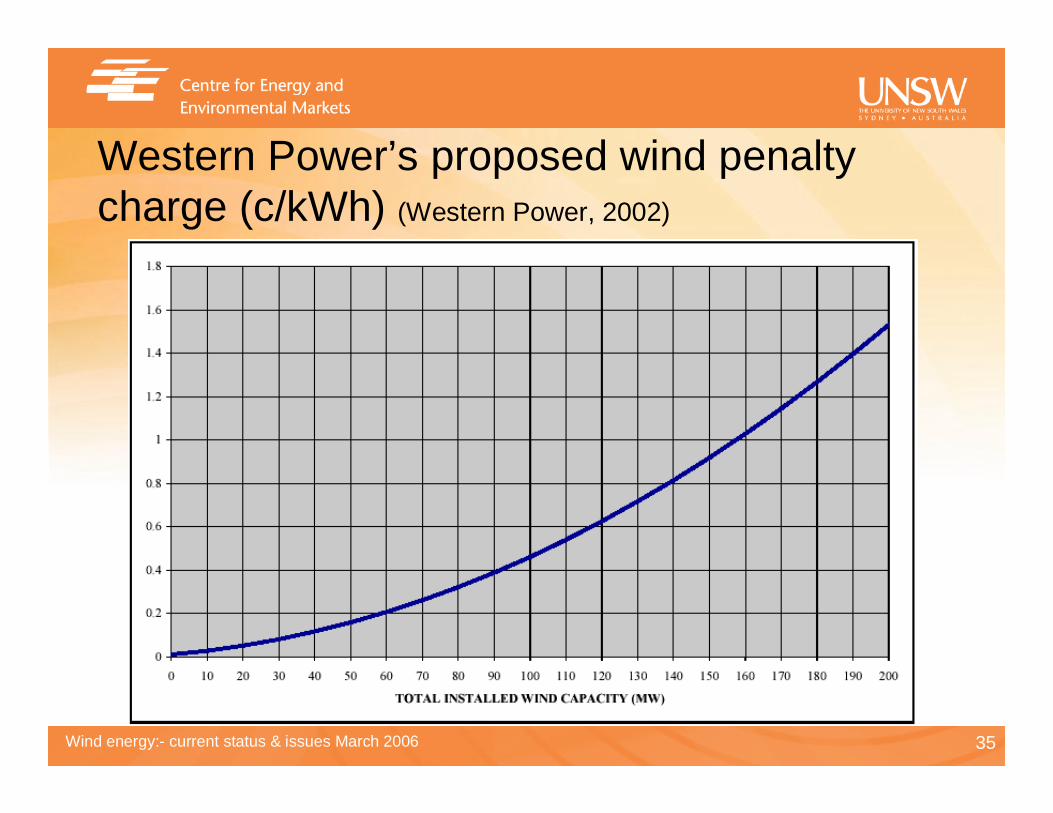
Western Power’s proposed wind penalty charge (c/kWh) (Western Power, 2002)
36Wind energy:- current status & issues March 2006
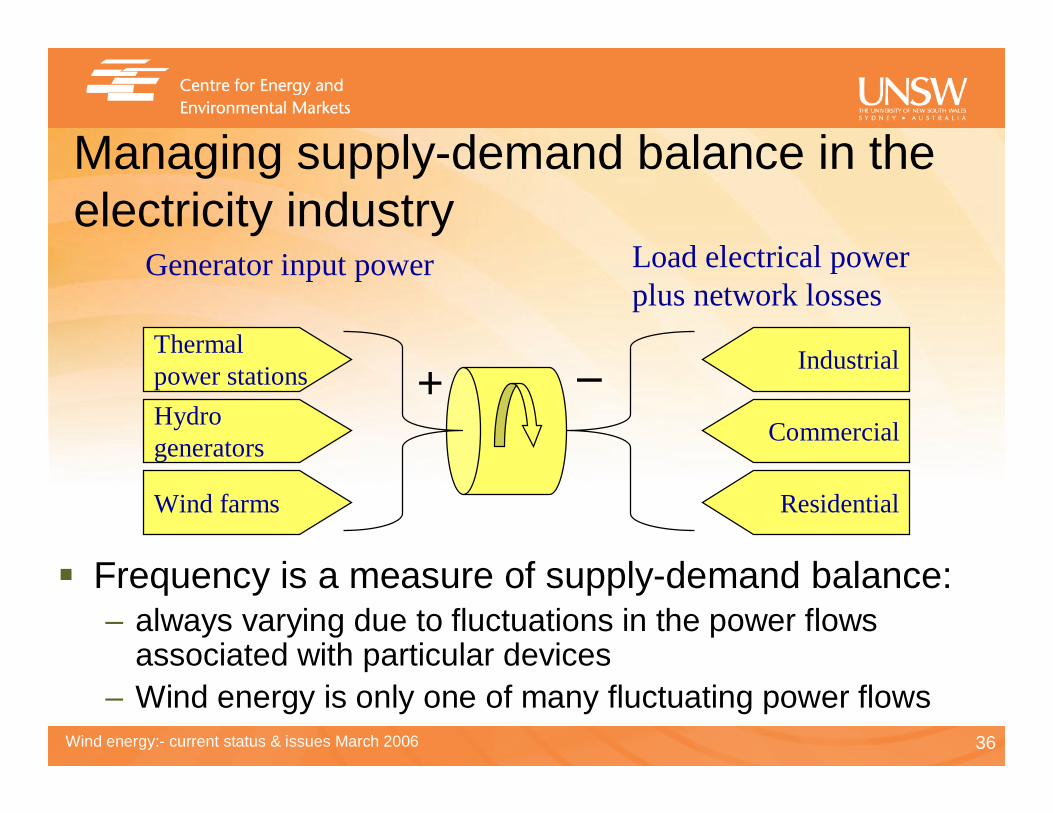
Managing supply-demand balance in the electricity industry
� Frequency is a measure of supply-demand balance:– always varying due to fluctuations in the power flows
associated with particular devices– Wind energy is only one of many fluctuating power flows
Thermalpower stations
Wind farms
Hydrogenerators
Industrial
Commercial
Residential
Generator input power Load electrical powerplus network losses
+ _
37Wind energy:- current status & issues March 2006
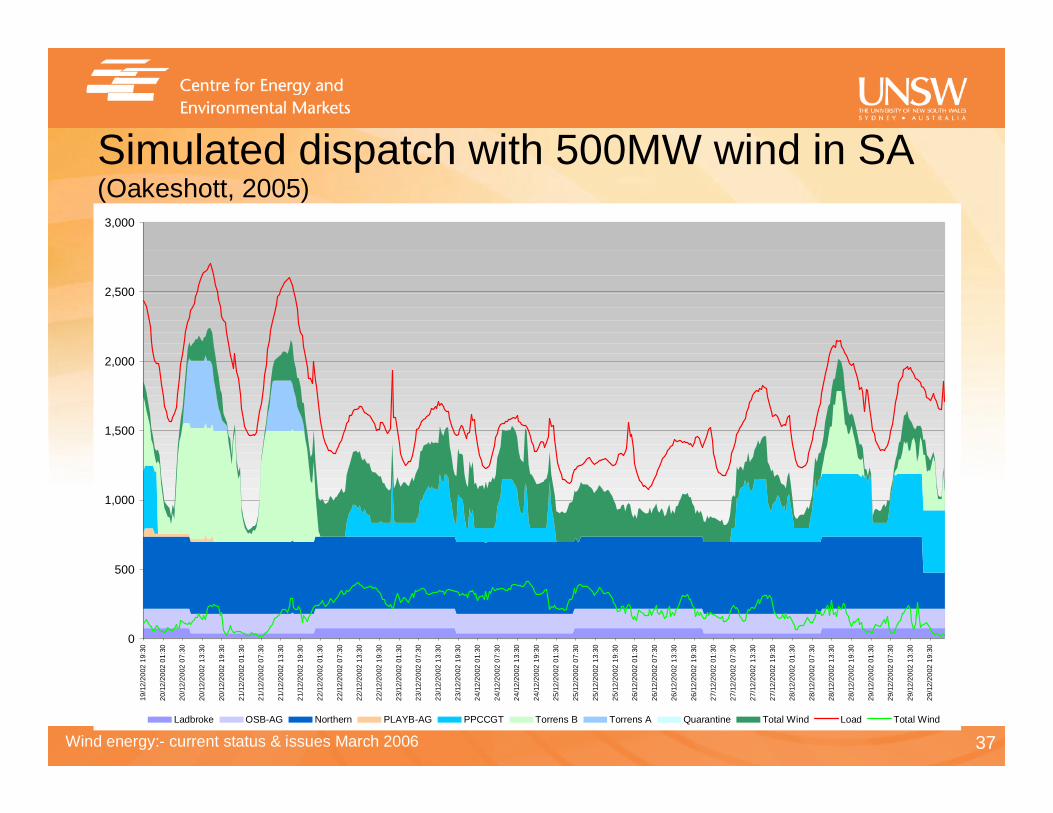
Simulated dispatch with 500MW wind in SA(Oakeshott, 2005)
0
500
1,000
1,500
2,000
2,500
3,000
19/1
2/20
02 1
9:30
20/1
2/20
02 0
1:30
20/1
2/20
02 0
7:30
20/1
2/20
02 1
3:30
20/1
2/20
02 1
9:30
21/1
2/20
02 0
1:30
21/1
2/20
02 0
7:30
21/1
2/20
02 1
3:30
21/1
2/20
02 1
9:30
22/1
2/20
02 0
1:30
22/1
2/20
02 0
7:30
22/1
2/20
02 1
3:30
22/1
2/20
02 1
9:30
23/1
2/20
02 0
1:30
23/1
2/20
02 0
7:30
23/1
2/20
02 1
3:30
23/1
2/20
02 1
9:30
24/1
2/20
02 0
1:30
24/1
2/20
02 0
7:30
24/1
2/20
02 1
3:30
24/1
2/20
02 1
9:30
25/1
2/20
02 0
1:30
25/1
2/20
02 0
7:30
25/1
2/20
02 1
3:30
25/1
2/20
02 1
9:30
26/1
2/20
02 0
1:30
26/1
2/20
02 0
7:30
26/1
2/20
02 1
3:30
26/1
2/20
02 1
9:30
27/1
2/20
02 0
1:30
27/1
2/20
02 0
7:30
27/1
2/20
02 1
3:30
27/1
2/20
02 1
9:30
28/1
2/20
02 0
1:30
28/1
2/20
02 0
7:30
28/1
2/20
02 1
3:30
28/1
2/20
02 1
9:30
29/1
2/20
02 0
1:30
29/1
2/20
02 0
7:30
29/1
2/20
02 1
3:30
29/1
2/20
02 1
9:30
Ladbroke OSB-AG Northern PLAYB-AG PPCCGT Torrens B Torrens A Quarantine Total Wind Load Total Wind
38Wind energy:- current status & issues March 2006
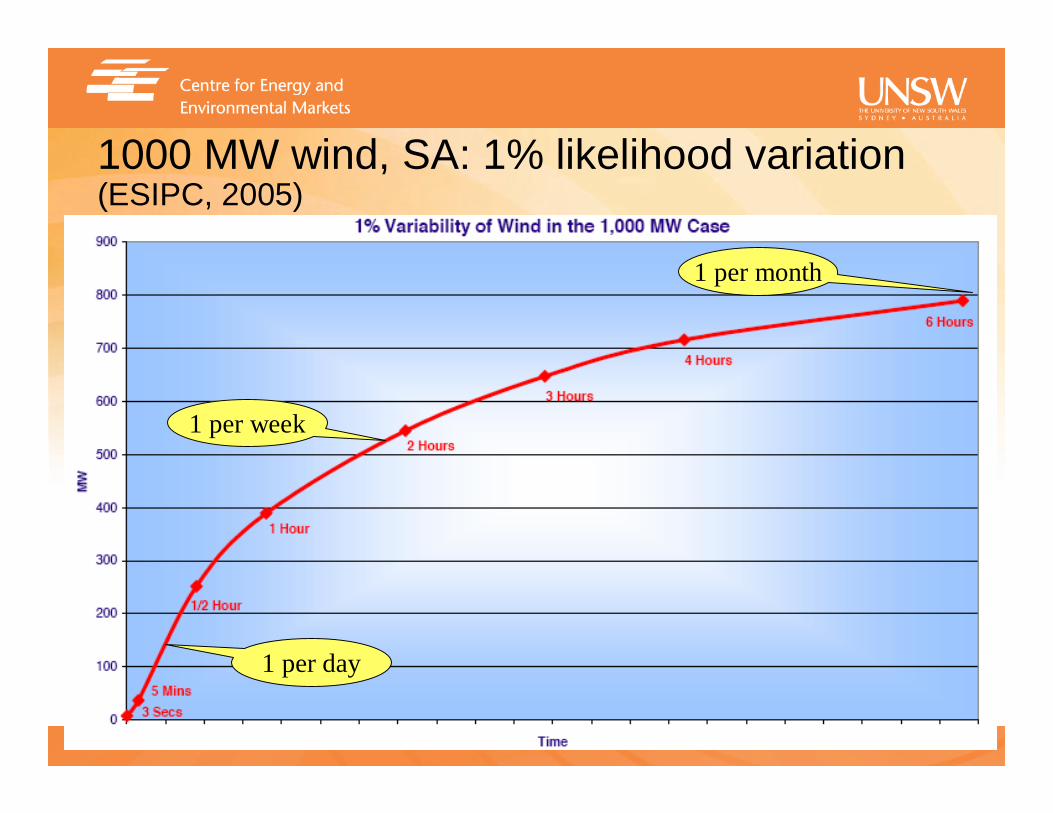
1000 MW wind, SA: 1% likelihood variation (ESIPC, 2005)
1 per day
1 per week
1 per month
39Wind energy:- current status & issues March 2006
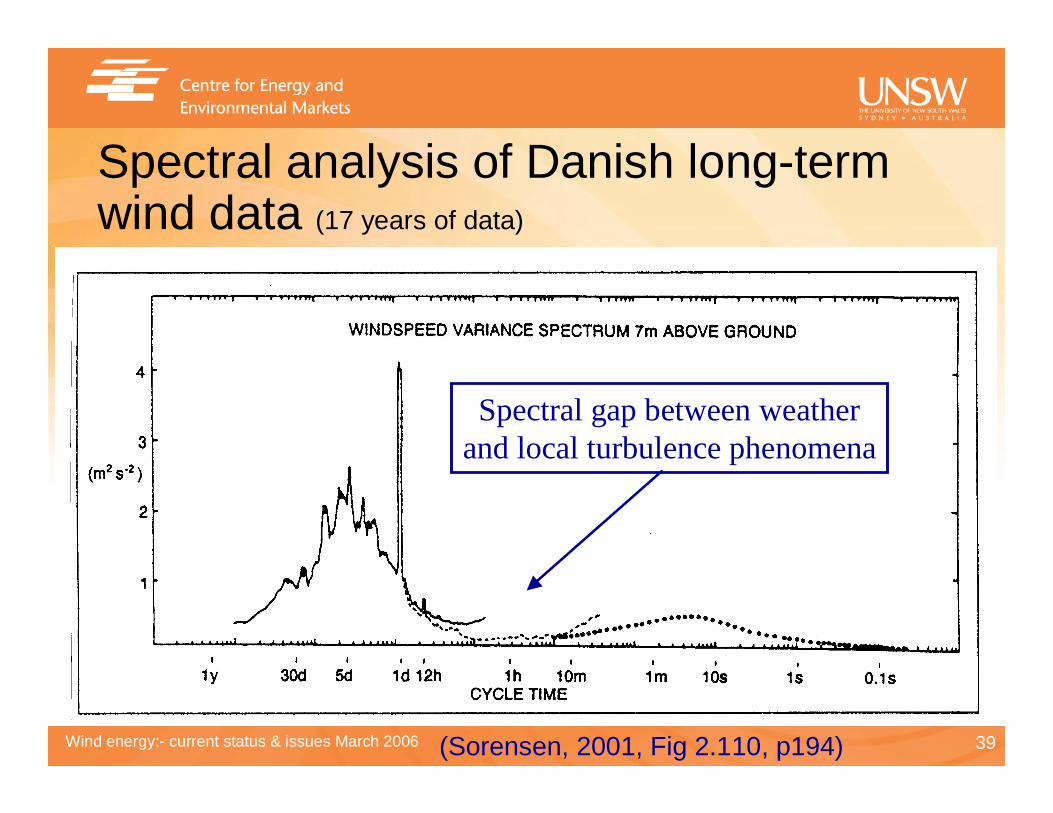
Spectral analysis of Danish long-term wind data (17 years of data)
Spectral gap between weatherand local turbulence phenomena
(Sorensen, 2001, Fig 2.110, p194)
40Wind energy:- current status & issues March 2006
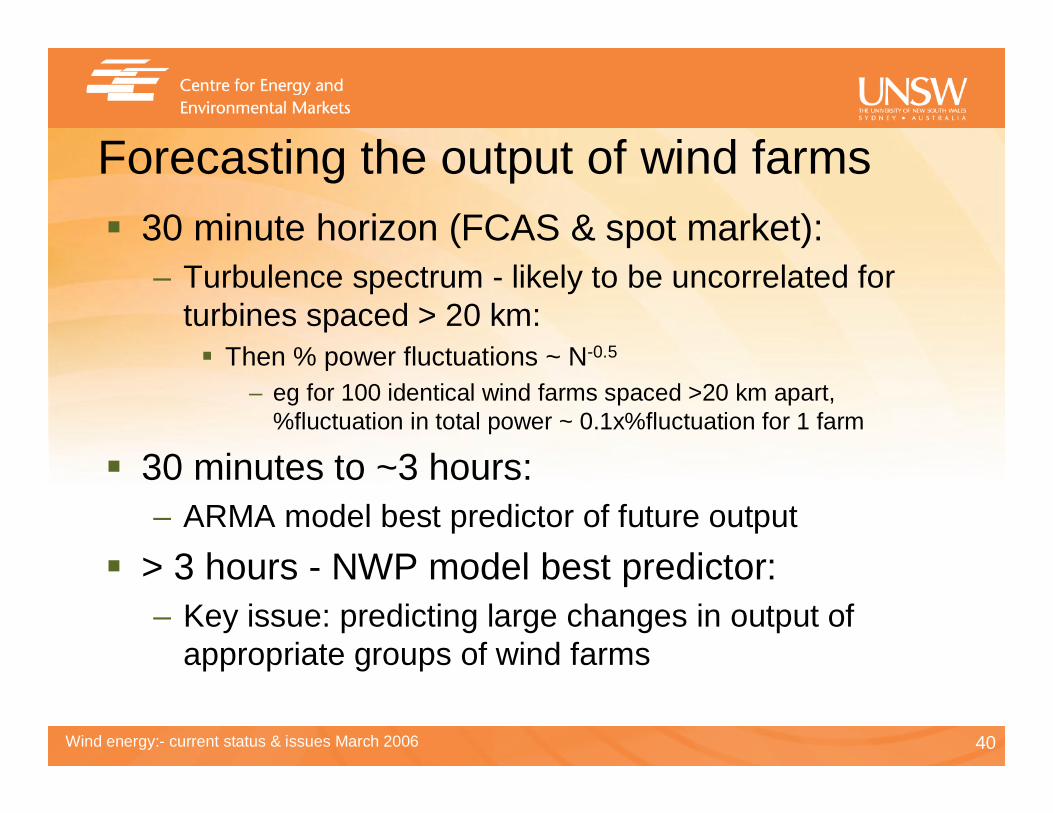
Forecasting the output of wind farms� 30 minute horizon (FCAS & spot market):
– Turbulence spectrum - likely to be uncorrelated for turbines spaced > 20 km:� Then % power fluctuations ~ N-0.5
– eg for 100 identical wind farms spaced >20 km apart, %fluctuation in total power ~ 0.1x%fluctuation for 1 farm
� 30 minutes to ~3 hours:– ARMA model best predictor of future output
� > 3 hours - NWP model best predictor:– Key issue: predicting large changes in output of
appropriate groups of wind farms
41Wind energy:- current status & issues March 2006
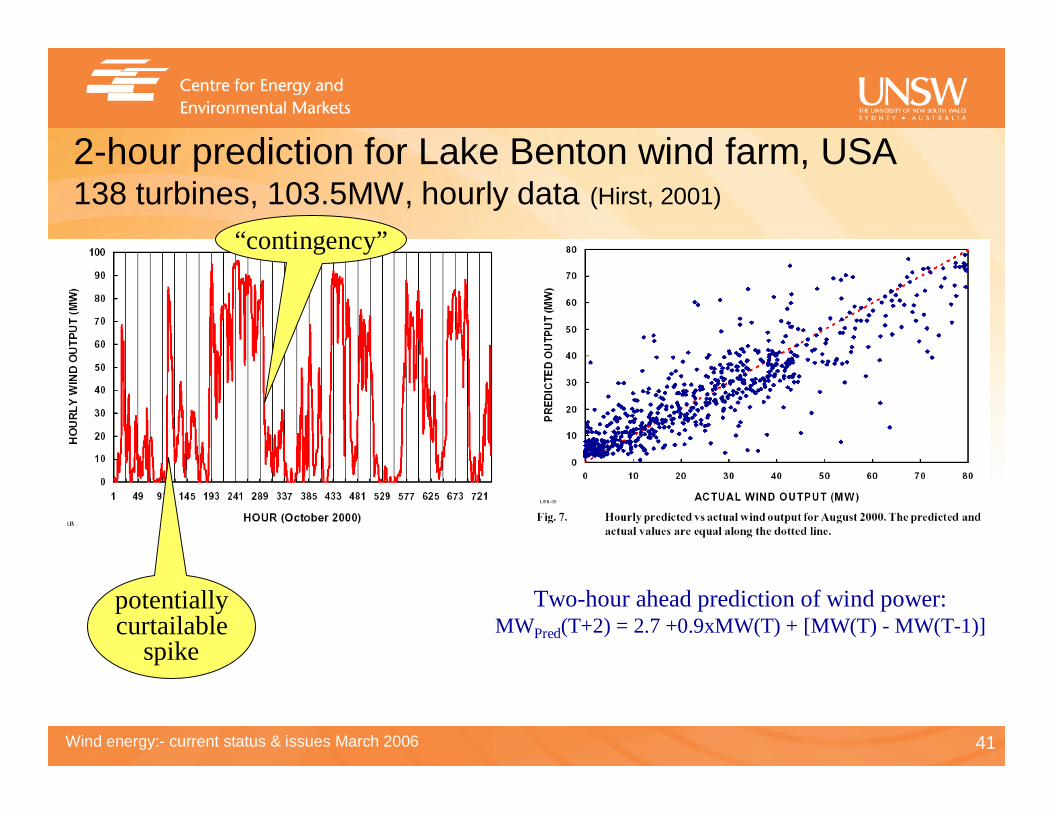
2-hour prediction for Lake Benton wind farm, USA138 turbines, 103.5MW, hourly data (Hirst, 2001)
Two-hour ahead prediction of wind power:MWPred(T+2) = 2.7 +0.9xMW(T) + [MW(T) - MW(T-1)]
potentiallycurtailable
spike
“contingency”
42Wind energy:- current status & issues March 2006
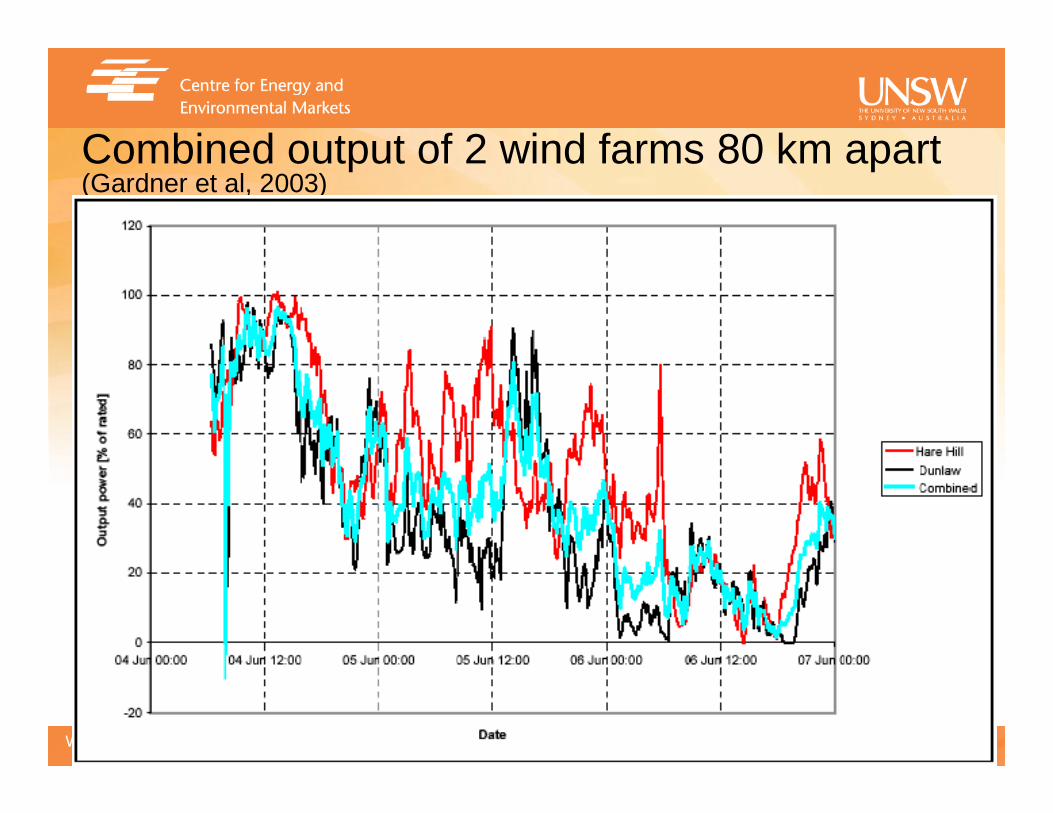
Combined output of 2 wind farms 80 km apart (Gardner et al, 2003)
43Wind energy:- current status & issues March 2006
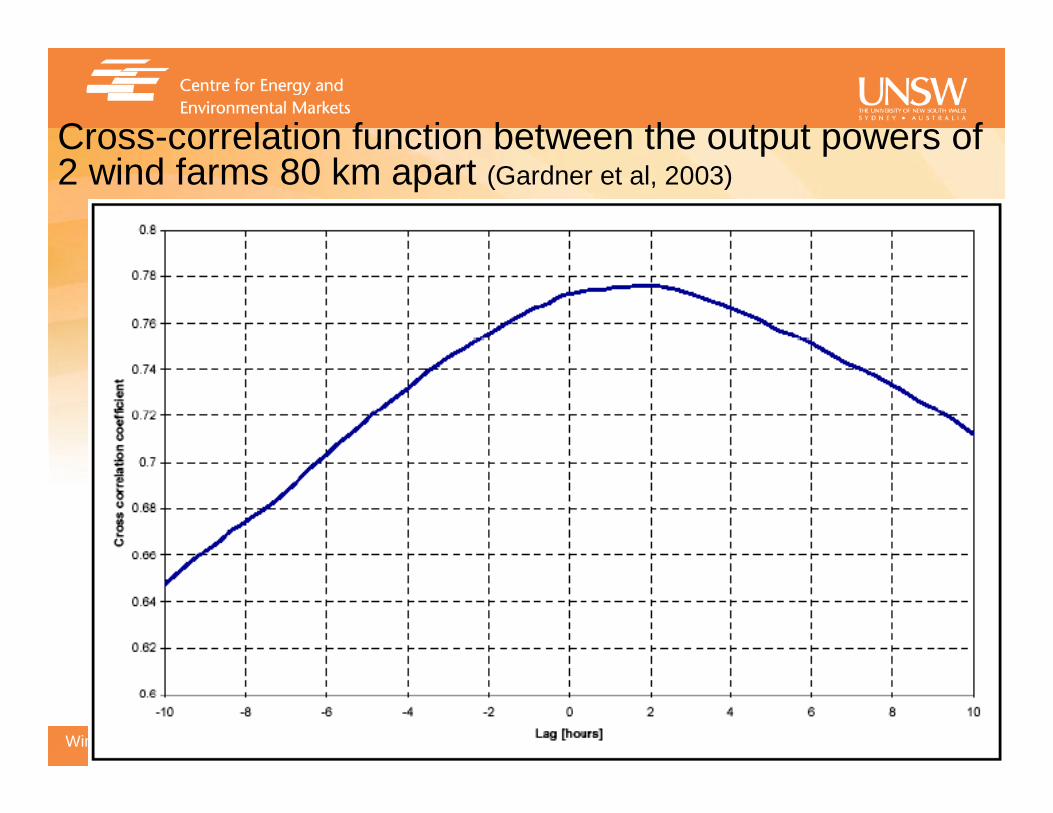
Cross-correlation function between the output powers of 2 wind farms 80 km apart (Gardner et al, 2003)

44Wind energy:- current status & issues March 2006
Cross-correlations between measured power outputs of German wind farms
(Giebel (2000) Riso National Lab, Denmark)
45Wind energy:- current status & issues March 2006
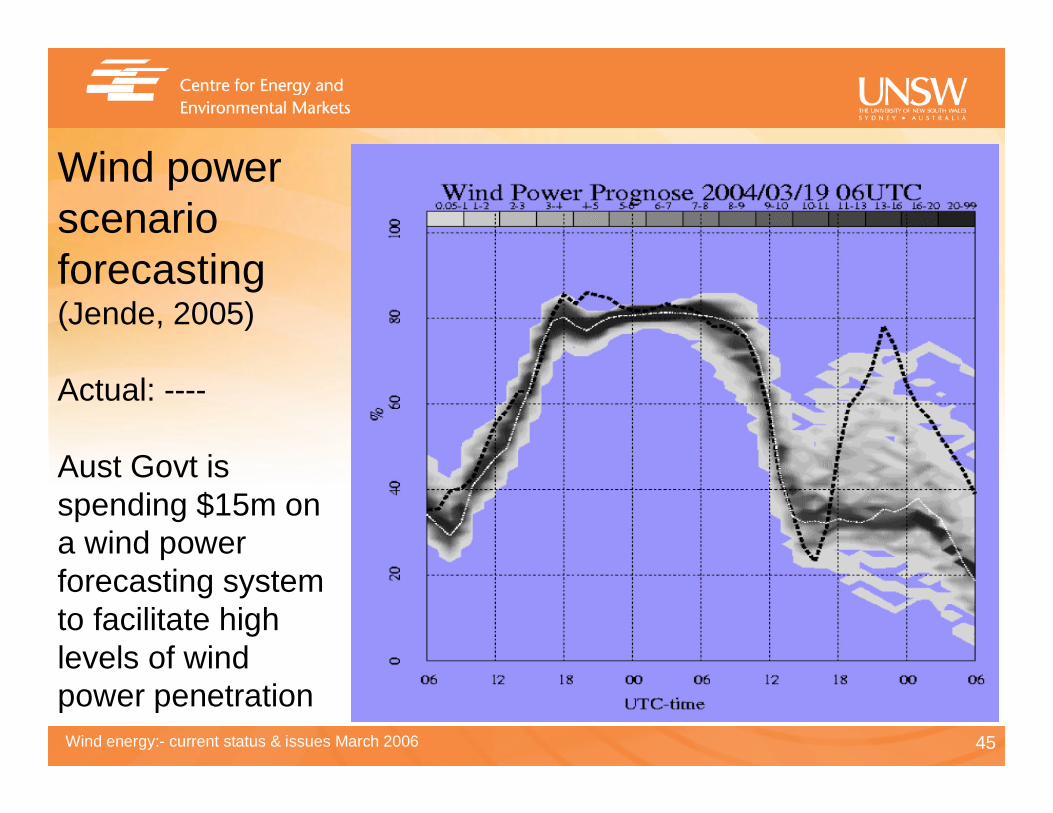
Wind power scenario forecasting(Jende, 2005)
Actual: ----
Aust Govt is spending $15m ona wind power forecasting system to facilitate high levels of wind power penetration

46Wind energy:- current status & issues March 2006
CSIRO WindscapeTM model (www.clw.csiro.au/products/windenergy)
Windscape derives location-specific wind forecasts from a Numerical Weather Prediction model
(Steggle et al, CSIRO, March 2002)

47Wind energy:- current status & issues March 2006
• Windscape predictions of annual mean wind speed at 65 m, showing nested model results
• More rapid changes in colour probably imply higher local turbulence
(Steggle et al, CSIRO, March 2002)
48Wind energy:- current status & issues March 2006
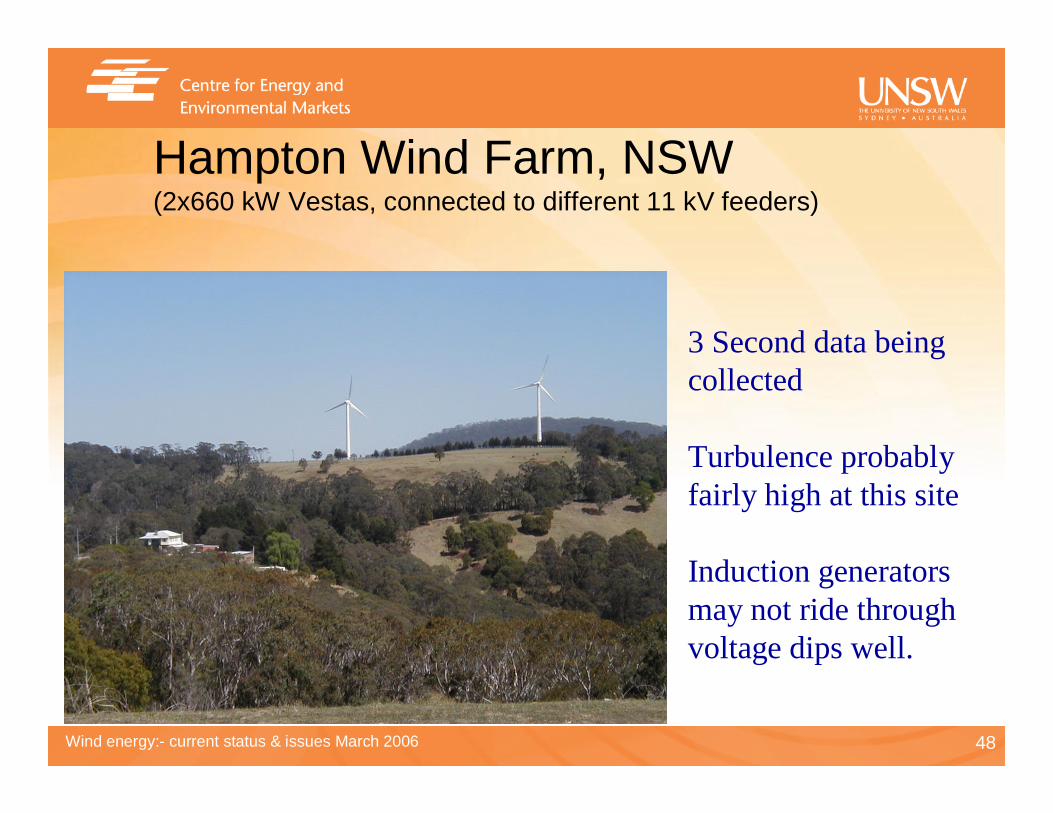
Hampton Wind Farm, NSW (2x660 kW Vestas, connected to different 11 kV feeders)
3 Second data being collected
Turbulence probably fairly high at this site
Induction generatorsmay not ride throughvoltage dips well.
49Wind energy:- current status & issues March 2006
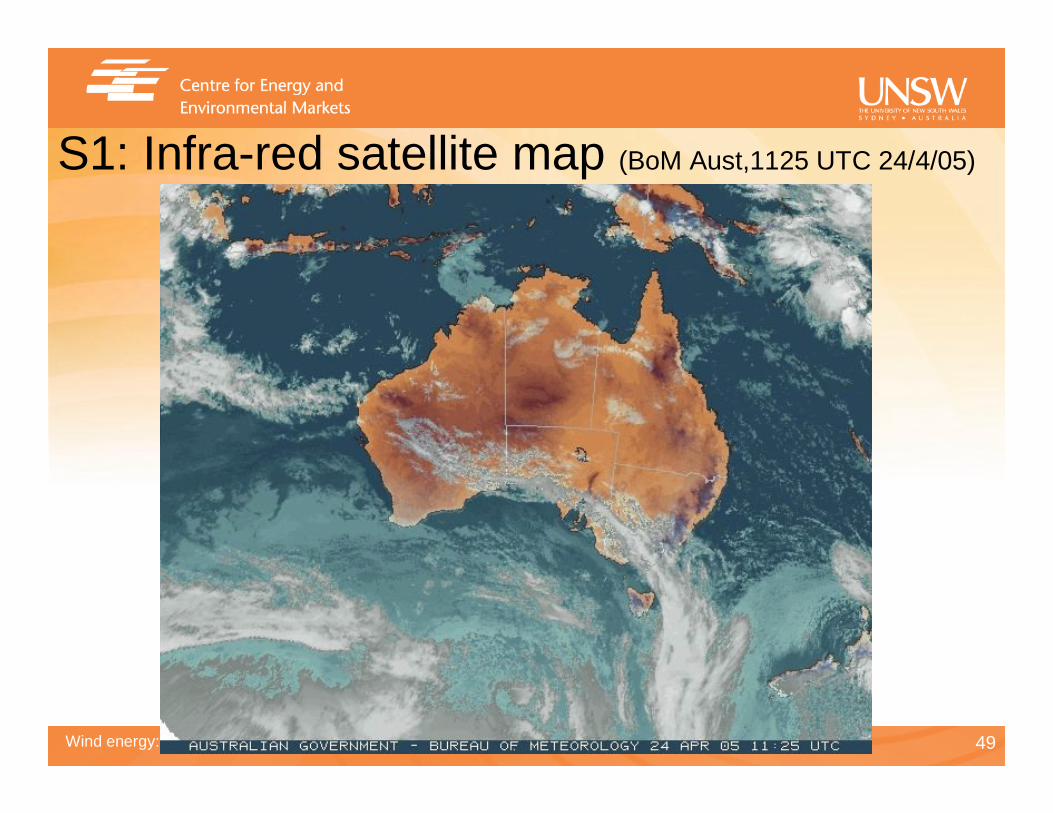
S1: Infra-red satellite map (BoM Aust,1125 UTC 24/4/05)
50Wind energy:- current status & issues March 2006
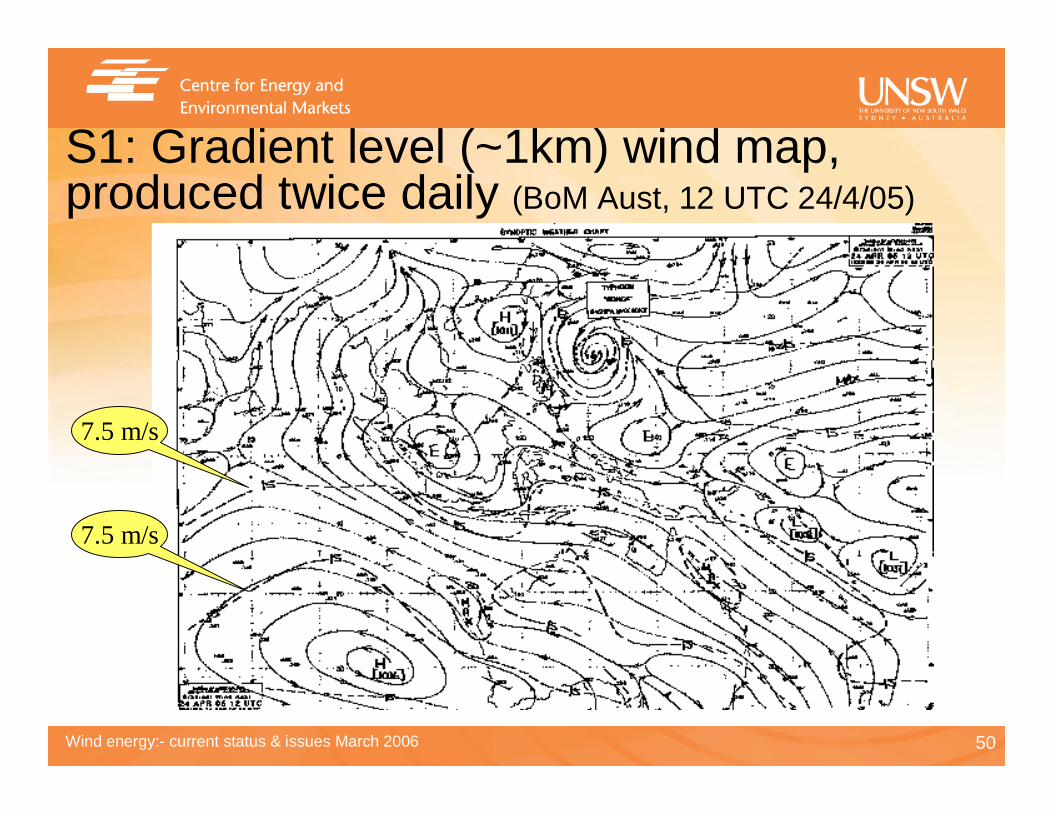
S1: Gradient level (~1km) wind map,produced twice daily (BoM Aust, 12 UTC 24/4/05)
7.5 m/s
7.5 m/s
51Wind energy:- current status & issues March 2006
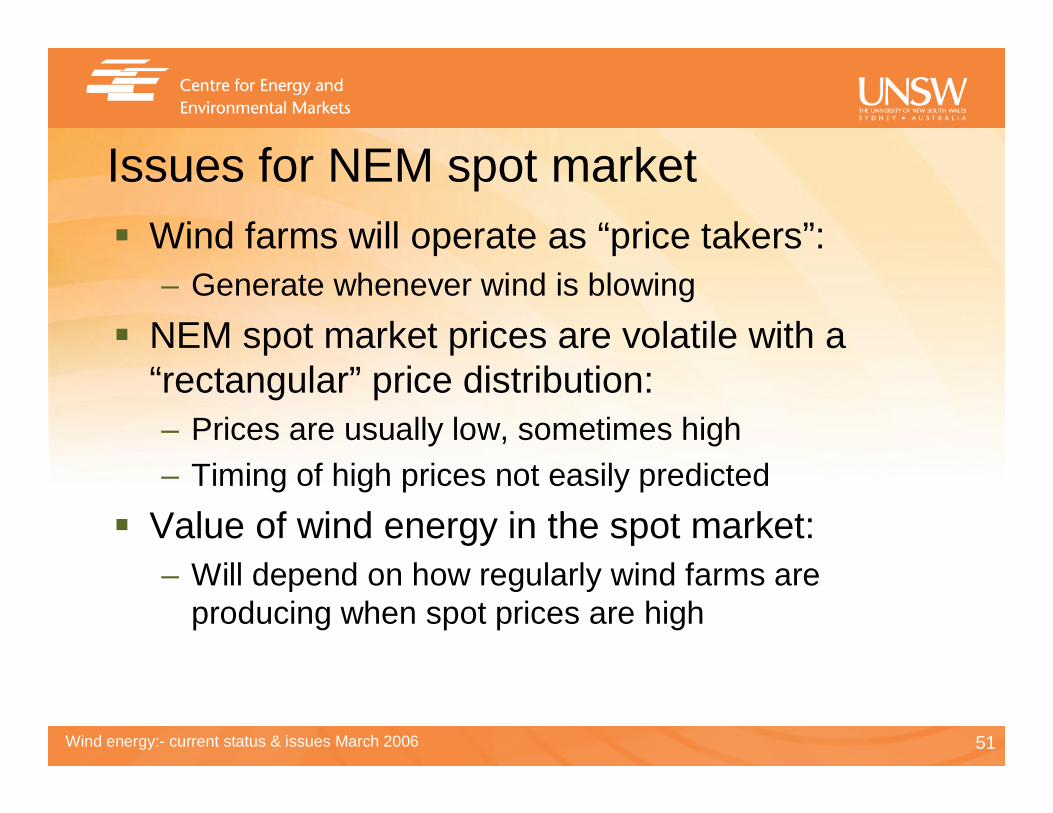
Issues for NEM spot market� Wind farms will operate as “price takers”:
– Generate whenever wind is blowing
� NEM spot market prices are volatile with a “rectangular” price distribution:– Prices are usually low, sometimes high– Timing of high prices not easily predicted
� Value of wind energy in the spot market:– Will depend on how regularly wind farms are
producing when spot prices are high
52Wind energy:- current status & issues March 2006
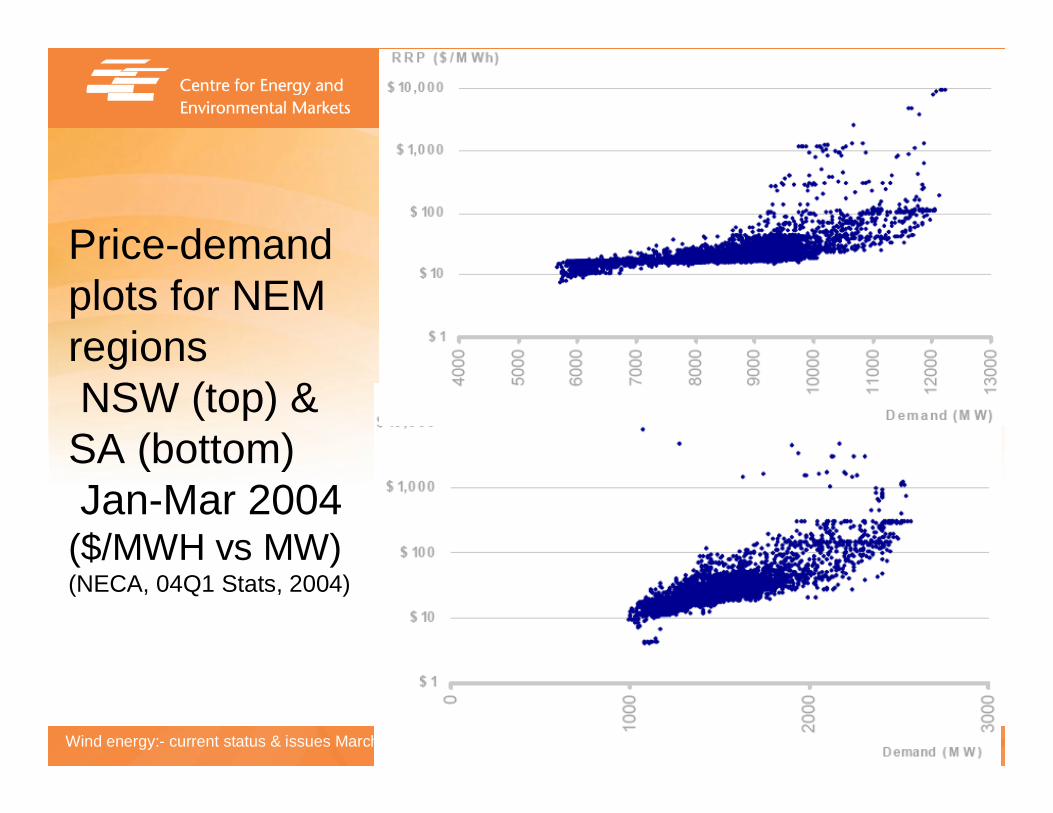
Price-demand plots for NEMregionsNSW (top) & SA (bottom)Jan-Mar 2004
($/MWH vs MW)(NECA, 04Q1 Stats, 2004)

53Wind energy:- current status & issues March 2006
Smoothed NEM Regional Ref Prices (RRPs) since market inception (NECA, 04Q4 Stats, 2005)

54Wind energy:- current status & issues March 2006
Annual average RRP flat contract prices (NECA, 04Q4 Stats, 2005)
55Wind energy:- current status & issues March 2006
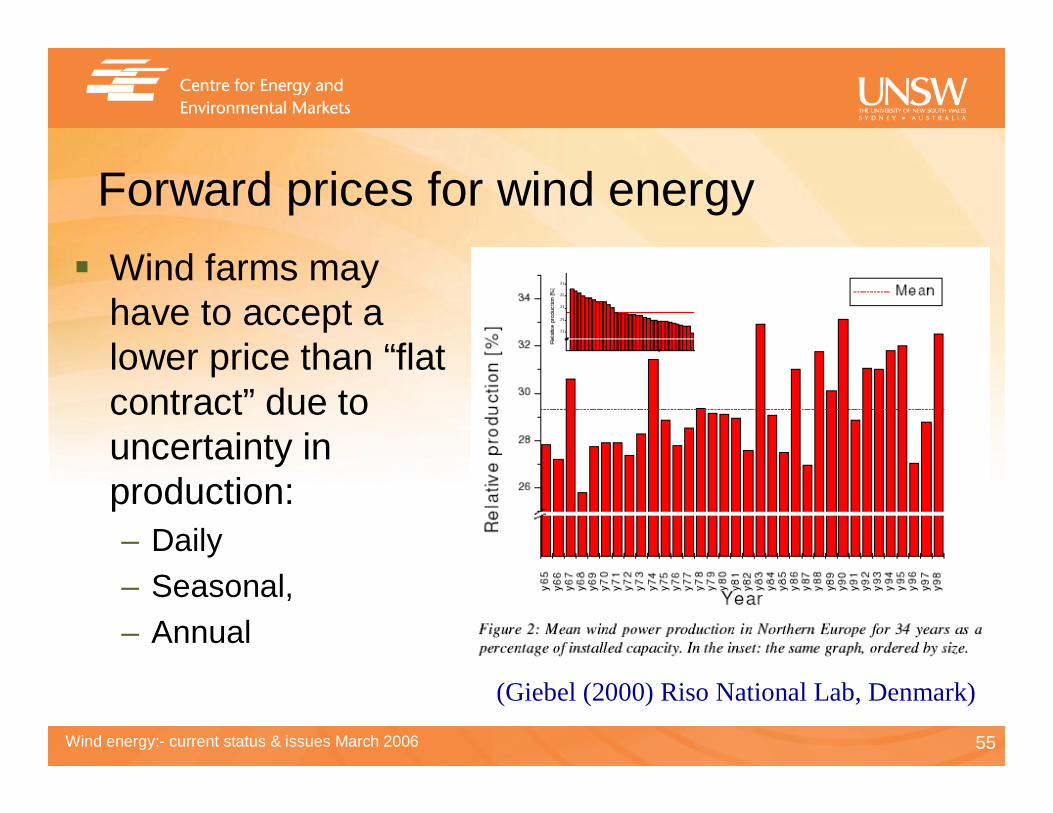
Forward prices for wind energy
� Wind farms may have to accept a lower price than “flat contract” due to uncertainty in production: – Daily– Seasonal, – Annual
(Giebel (2000) Riso National Lab, Denmark)
56Wind energy:- current status & issues March 2006
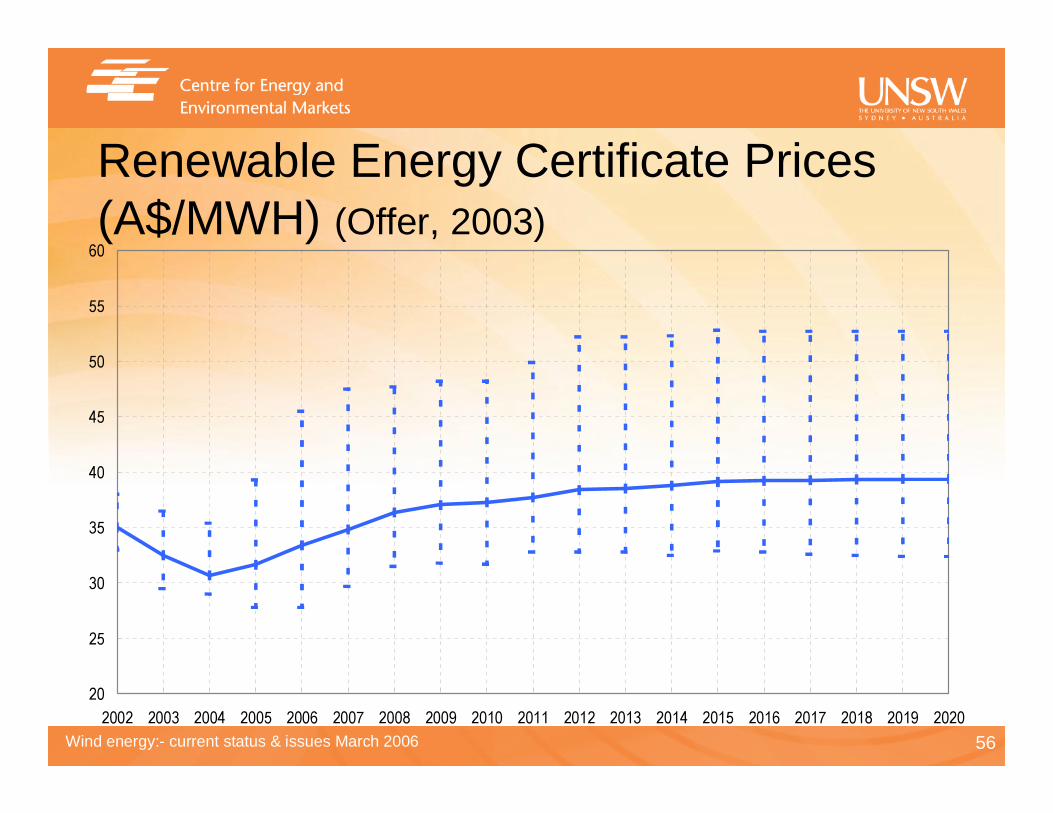
Renewable Energy Certificate Prices (A$/MWH) (Offer, 2003)
20
25
30
35
40
45
50
55
60
2002 2003 2004 2005 2006 2007 2008 2009 2010 2011 2012 2013 2014 2015 2016 2017 2018 2019 2020

57Wind energy:- current status & issues March 2006
Wind farms marginal at $70/MWH(PWC, 2002)

58Wind energy:- current status & issues March 2006
Conclusions� Intermittent generation:
– Brings new challenges for electricity industry restructuring (technical, market design, regulation)
� Wind energy:– The first significant form of “intermittent generation”– Network connection issues:� often distributed differently to traditional resources
– Planning issues - visual & bird impacts:� Regional, rather than project specific
– Forecasting & system security issues– Usually not cost-competitive on electricity price alone