wind and water power program wind energy cost, performance and
TRANSCRIPT

Energy Efficiency & Renewable Energy eere.energy.gov
1
Program Name or Ancillary Text eere.energy.gov
WIND AND WATER POWER PROGRAM
1
Wind Energy Cost, Performance and Pricing Trends: Past & Future
Ryan Wiser Lawrence Berkeley
National Laboratory
2013 National Summit on RPS
November 6, 2013

WIND AND WATER POWER PROGRAM
2
• 13.1 GW of wind added in 2012, more than 90% higher than 2011
• $25 billion invested in wind power project additions
• Cumulative wind power capacity up by 28%, bringing total to 60 GW
Wind Power Additions Hit a New Record in 2012, in Part Driven By the Then-Planned Expiration of Federal Tax Incentives
0
5
10
15
20
25
30
35
40
45
50
55
60
65
70
0
1
2
3
4
5
6
7
8
9
10
11
12
13
14
19
98
19
99
20
00
20
01
20
02
20
03
20
04
20
05
20
06
20
07
20
08
20
09
20
10
20
11
20
12
Annual U.S. Capacity (left scale)
Cumulative U.S. Capacity (right scale)
Cu
mu
lati
ve
Ca
pa
cit
y (
GW
)
An
nu
al
Ca
pa
cit
y (
GW
)

WIND AND WATER POWER PROGRAM
3
Wind Power Was the Largest Source of U.S. Generating Capacity Additions in 2012
• Wind was, for the first time, the largest resource added in terms of gross capacity, despite persistently low natural gas prices
0%
10%
20%
30%
40%
50%
0
20
40
60
80
100
2000 2001 2002 2003 2004 2005 2006 2007 2008 2009 2010 2011 2012
To
tal A
nnual
Cap
acity A
dd
itio
ns (G
W)
Wind Other Renewable Gas
Coal Other Non-Renewable Wind (% of Total)
Win
d C
apac
ity
Ad
dit
ion
s(%
of T
ota
l An
nu
al C
apac
ity
Ad
dit
ion
s)

WIND AND WATER POWER PROGRAM
4
• Past deployment substantially impacted by wind
technology improvement, and impacts on:
Cost trends
Performance trends
Pricing trends
• Future deployment may be impacted to an even
greater degree, given policy uncertainty at
Federal and State levels
• Presentation focused on past and near-term
trends, limited to land-based wind

WIND AND WATER POWER PROGRAM
5
Past Trends: Cost

WIND AND WATER POWER PROGRAM
6
Wind Turbine Prices Remain Well Below the Levels Seen Several Years Ago
0
200
400
600
800
1,000
1,200
1,400
1,600
1,800
2,000
2,200
Jan-9
7
Jan-9
8
Jan-9
9
Jan-0
0
Jan-0
1
Jan-0
2
Jan-0
3
Jan-0
4
Jan-0
5
Jan-0
6
Jan-0
7
Jan-0
8
Jan-0
9
Jan-1
0
Jan-1
1
Jan-1
2
Jan-1
3
Announcement Date
U.S. Orders <5 MW
U.S. Orders from 5 - 100 MW
U.S. Orders >100 MW
Vestas Global Average
Polynomial Trend Line for Orders
Turb
ine T
ransa
ctio
n P
rice
(2012$
/kW
)
Recently reported global
average prices
Figure depicts reported transaction prices from 102 U.S. wind turbine orders totaling 27 GW
Escalation in turbine prices from 2003 through 2008: rising
commodity prices; increased labor costs; improved
manufacturer profitability; turbine up-scaling

WIND AND WATER POWER PROGRAM
7
Reported Installed Project Costs Continue to Trend Lower
0
1,000
2,000
3,000
4,000
5,000
6,000
19
82
19
83
19
84
19
85
19
86
19
87
19
88
19
89
19
90
19
91
19
92
19
93
19
94
19
95
19
96
19
97
19
98
19
99
20
00
20
01
20
02
20
03
20
04
20
05
20
06
20
07
20
08
20
09
20
10
20
11
20
12
Inst
all
ed
Pro
ject
Co
st (
20
12
$/k
W)
Commercial Operation Date
Individual Project Cost (689 projects totaling 49,414 MW)
Capacity-Weighted Average Project Cost
Whereas turbine prices peaked in 2008/2009, project-level installed costs peaked in
2009/2010, reflecting the normal passage of time between when a turbine supply
agreement is signed and when those turbines are actually installed
2012 average:
$1,940/kW,
down $200/kW
from 2011;
down $300/kW
from peak

WIND AND WATER POWER PROGRAM
8
Some Regional Differences in Average Wind Power Project Costs Are Apparent
Different permitting/development costs may play a role at both ends of spectrum: it’s easier/cheaper to build in the US interior and harder/more expensive along the coasts
0
500
1,000
1,500
2,000
2,500
3,000
3,500
4,000
4,500
Interior42 projects3,827 MW
Northeast29 projects1,101 MW
Great Lakes21 projects1,529 MW
West25 projects2,938 MW
Southeast1 project19 MW
Inst
alle
d P
roje
ct C
ost
(2
01
2 $
/kW
)
Capacity-Weighted Average Project Cost
Individual Project Cost
Capacity-Weighted Average Cost, Total U.S.
Sample includes projects built in 2012
WIND AND WATER POWER PROGRAM
9
Past Trends: Performance

WIND AND WATER POWER PROGRAM
10
Regional Variations in Capacity Factor Reflect the Strength of the Wind Resource
0%
10%
20%
30%
40%
50%
60%
Southeast4 projects308 MW
Northeast6 projects289 MW
West37 projects2,452 MW
Great Lakes15 projects2,077 MW
Interior48 projects5,430 MW
Generation-Weighted Average (by region)
Generation-Weighted Average (total U.S.)
Individual Project (by region)
20
12
Ca
pa
city
Fa
cto
r
Sample includes 110 projects built in 2010 or 2011 and totaling 10.6 GW

WIND AND WATER POWER PROGRAM
Average Hub Height and Rotor Diameter Have Increased Dramatically: Would Expect Capacity Factor Increases to Follow
• Two periods of rapid scaling: 1998-2006 and 2009-present
• 2007-2008 mostly stagnant, as OEMs focused on meeting demand
0.0
0.2
0.4
0.6
0.8
1.0
1.2
1.4
1.6
1.8
2.0
0
10
20
30
40
50
60
70
80
90
100
1998-99 2000-01 2002-03 2004-05 2006 2007 2008 2009 2010 2011 2012
Commercial Operation Year
Average Nameplate Capacity (right scale)
Average Rotor Diameter (left scale)
Average Tower Height (left scale)
Mete
rs
MW
11

WIND AND WATER POWER PROGRAM
As Dominant Turbine OEM in the US, GE Provides a Useful Example of the Evolution of Turbine Design
2.60
m2/kW
3.10
m2/kW
3.30
m2/kW
4.85
m2/kW
4.85
m2/kW
2002 2010 2012- (standard) 2012- (lower wind speed) 12

WIND AND WATER POWER PROGRAM
However, Trends in Sample-Wide Capacity Factors Were Impacted by Curtailment and Inter-Year Wind Resource Variability…
The wind resource index is compiled from NextEra Energy Resources reports. The pre-2007 portion of the index is adjusted to
approximate the conversion from wind speed to generation (this adjustment is unnecessary starting in 2007). 13
0.00
0.15
0.30
0.45
0.60
0.75
0.90
1.05
1.20
0%
5%
10%
15%
20%
25%
30%
35%
40%
200010
591
200130
943
200273
2,682
200384
3,128
2004106
4,500
2005129
5,142
2006153
7,967
2007196
9,951
2008240
14,926
2009339
23,617
2010452
33,381
2011516
38,561
2012446
42,844
Lon
g-Term
Win
d R
eso
urce
Ind
ex
Sam
ple
-Wid
e C
apac
ity
Fact
or
Capacity Factor Based on Estimated Generation (if no curtailment in subset of regions)
Capacity Factor Based on Actual Generation (with curtailment)
Wind Resource Index (right scale)
# MW:
# Projects:Year:

WIND AND WATER POWER PROGRAM
And… Despite Turbine Scaling that Should Boost Capacity Factors, Project Build-Out in Lower-Quality Wind Resource Areas Has Pushed the Other Way
14
275
305
335
365
395
425
75
80
85
90
95
100
1998-99 2000-01 2002-03 2004-05 2006 2007 2008 2009 2010 2011 2012
Commercial Operation Date
Average 80m Wind Resource Quality Among Built Projects (left scale)
Average Specific Power Among Built Projects (right scale)
Ind
ex
of
Win
d R
eso
urc
e Q
ua
lity
at
80
m (
19
98
-99
=1
00
)
Sp
eci
fic
Po
we
r (W
/m^
2 )

WIND AND WATER POWER PROGRAM
15
Past Trends: Wind Power Price

WIND AND WATER POWER PROGRAM
16
Sample of Wind Power Prices
• Berkeley Lab collects data on historical wind power sales prices, and long-term PPA prices
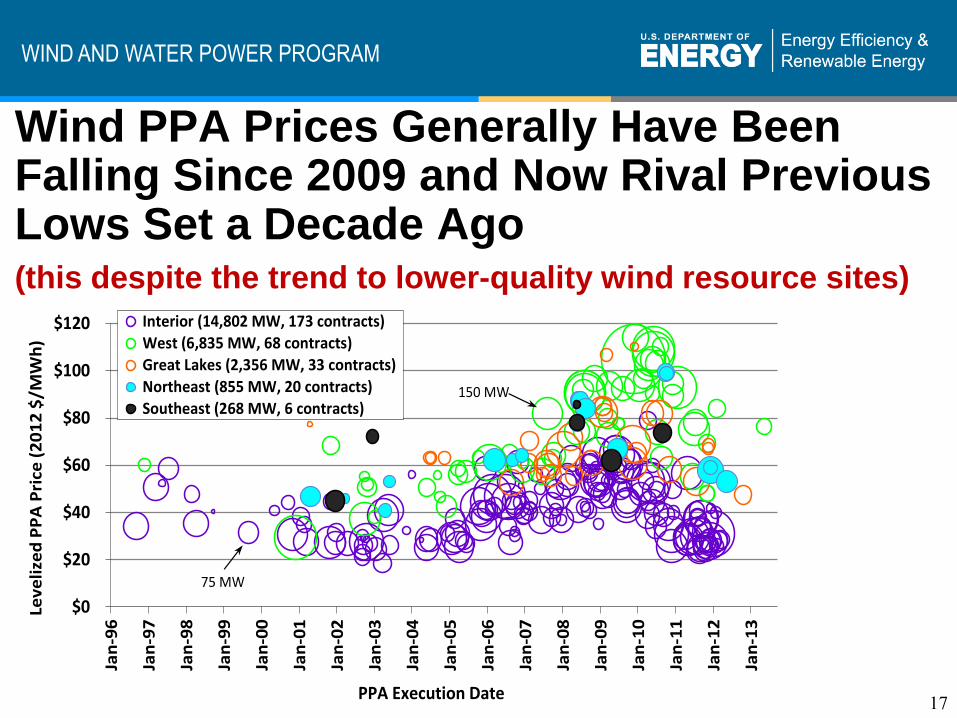
• PPA sample includes 302 contracts from projects built from 1998-2012, totaling 24,626 MW (42% of all wind capacity added in that period, and 70% of all capacity added that is sold under bundled PPAs)
• Prices reflect the bundled price of electricity and RECs as sold by the project owner under a power purchase agreement
– Dataset excludes merchant plants and projects that sell renewable energy certificates (RECs) separately
– Prices reflect receipt of state and federal incentives (e.g., the PTC or Treasury grant), as well as various local policy and market influences; as a result, prices do not reflect wind energy generation costs
WIND AND WATER POWER PROGRAM
Wind PPA Prices Generally Have Been Falling Since 2009 and Now Rival Previous Lows Set a Decade Ago
(this despite the trend to lower-quality wind resource sites)
17
$0
$20
$40
$60
$80
$100
$120
Jan
-96
Jan
-97
Jan
-98
Jan
-99
Jan
-00
Jan
-01
Jan
-02
Jan
-03
Jan
-04
Jan
-05
Jan
-06
Jan
-07
Jan
-08
Jan
-09
Jan
-10
Jan
-11
Jan
-12
Jan
-13
PPA Execution Date
Interior (14,802 MW, 173 contracts)
West (6,835 MW, 68 contracts)
Great Lakes (2,356 MW, 33 contracts)
Northeast (855 MW, 20 contracts)
Southeast (268 MW, 6 contracts)
Lev
eli
zed
PP
A P
rice
(2
01
2 $
/MW
h)
75 MW
150 MW

WIND AND WATER POWER PROGRAM
A Smoother Look at the Time Trend Shows Steep Recent Decline in Pricing; Especially Low Pricing in Interior Region
18
$0
$10
$20
$30
$40
$50
$60
$70
$80
$90
$100
1996-9910
553
2000-0117
1,249
2002-0324
1,382
2004-0530
2,190
200630
2,311
200726
1,781
200839
3,465
200947
3,982
201040
3,999
201134
3,533
20128
630
Ave
rag
e L
eve
lize
d P
PA
Pri
ce (
Re
al
20
12
$/M
Wh
)
Nationwide Interior
Great Lakes West
Northeast
PPA Year:Contracts:
MW:
WIND AND WATER POWER PROGRAM
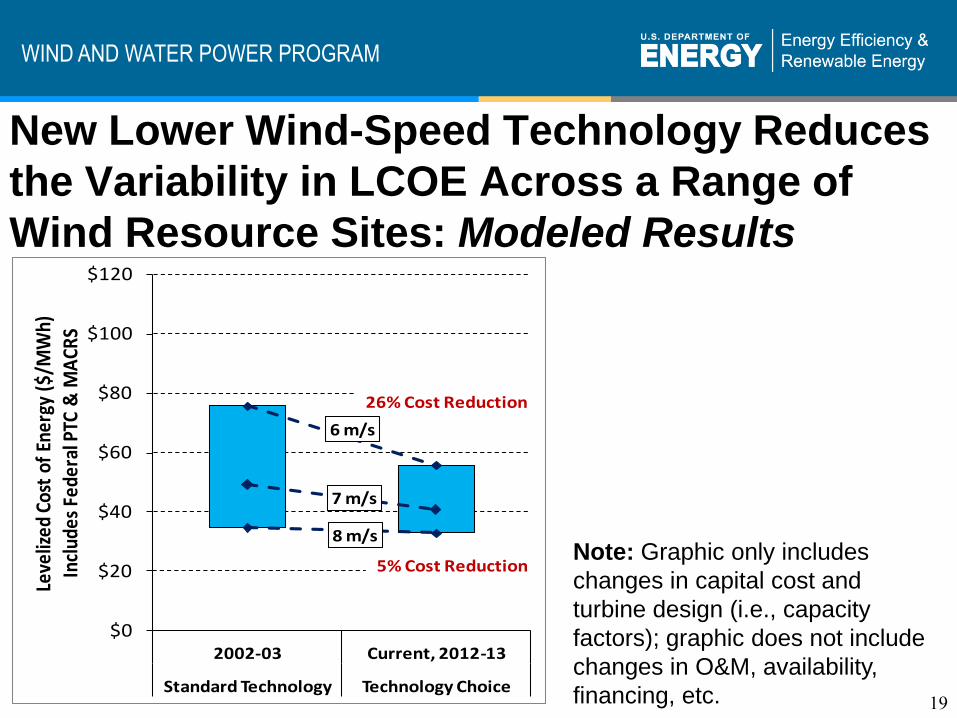
New Lower Wind-Speed Technology Reduces
the Variability in LCOE Across a Range of
Wind Resource Sites: Modeled Results
8 m/s
7 m/s
6 m/s
$0
$20
$40
$60
$80
$100
$120
2002-03 Current, 2012-13
Standard Technology Technology Choice
Leve
lized
Cos
t of
Ene
rgy
($/M
Wh)
Incl
udes
Fed
eral
PTC
& M
ACR
S
26% Cost Reduction
5% Cost Reduction
19
Note: Graphic only includes
changes in capital cost and
turbine design (i.e., capacity
factors); graphic does not include
changes in O&M, availability,
financing, etc.

WIND AND WATER POWER PROGRAM
Available Land Area Exceeding LCOE
Thresholds Has Increased: Modeled Results
2002-03:Standard Technology
0
500,000
1,000,000
1,500,000
2,000,000
2,500,000
3,000,000
$30 $40 $50 $60 $70 $80 $90
Ava
ilab
le L
and
Are
a (k
m2)
Levelized Cost of Energy ($/MWh)
2012-13:Lowest CostTech Choice
w/: PTC/MACRS
w/o: PTC/MACRS $57 $67 $77 $89 $99 $110 $121
Percentage Increase Since 2002-2003:
< $35/MWh w/ PTC & MACRS: 42%
< $55/MWh w/ PTC & MACRS: 48%
< $75/MWh w/ PTC & MACRS: 25%
20

WIND AND WATER POWER PROGRAM
21
Current and Future Trends

WIND AND WATER POWER PROGRAM
22
Areas of Continued Wind Power Technology Advancement
Land-based wind technology is relatively mature,
but continued advancement opportunities include:
• Plant-level design and management to maximize production
• Advanced control systems for turbines and plants to increase
energy production, reduce loads
• Improved numerical methods for understanding wind resource
• Blade innovations to increase performance, reduce loads & noise
• Multiple drivetrain technologies, with increase reliability
• Enhanced reliability & robustness among all components & systems
• Continued turbine scaling, especially low to mid wind speed sites

WIND AND WATER POWER PROGRAM
Most Projections for Land-Based Wind
Plant LCOE Anticipate Further Reductions
Note: Projections included here were derived from a variety of methods including
learning curves, expert elicitation, and engineering-based models 23

WIND AND WATER POWER PROGRAM
Focusing on Projects Installed from 2009-2012 (to control for resource quality) and on Capacity Factor in First Six Months of 2013 (to include 2012 installations) Shows Technology Evolution
24
Specific Power < 260 = recent, lower wind-speed models such as GE 1.6 MW / 100m rotor;
Siemens 2.3/108; Vestas 1.8/100; Nordex 2.4/117; Specific Power < 220 = GE 1.6/100
Note: Very small
sample size exists
for some of these
categories

WIND AND WATER POWER PROGRAM
25
Recent PPA Trends Suggest Further Price Reductions (and capacity factor increases) • Xcel (SPS; 700 MW proposed to regulator):
• 5700 MW of bids < $30/MWh w/ RECs [RECs value <$2.5/MWh]
• Mammoth -- 199 MW, OK, 57.1% CF: $22/MWh energy only
• Palo Duro -- 249 MW, TX, 54.1% CF: $23/MWh energy only
• Roosevelt -- 250 MW, NM, 48.4% CF: $23/MWh energy only
• Xcel (CO, MN; 1200 MW total): $25-35/MWh
"It works out to a very good levelized cost for our customers," Xcel CEO Fowke
said. "These prices are so compelling, the energy [cost] associated with it is
less than you can do locking in a 20-year gas strip.” Xcel expects the wind
projects to save its customers about $800 million in fuel costs over 20 years.
• AEP-PSO (OK; 600 MW): 50.6% expected capacity factor
• OPPD (NE; 400 MW): 50% expected capacity factor

WIND AND WATER POWER PROGRAM
26
Though Low Wholesale Electricity Prices Have Challenged the Relative Economics of Wind Power in Recent Years…
0
10
20
30
40
50
60
70
80
90
100
Interior28 projects2,969 MW
Great Lakes4 projects219 MW
Northeast3 projects210 MW
West7 projects766 MW
Total US42 projects4,163 MW
Average 2012 Wholesale Power Price Range
Individual Project Levelized Wind PPA Price
Generation-Weighted Average Levelized Wind PPA Price
Wind project sample includes projects with PPAs signed in 2011 or 2012
2012
$/M
Wh
Wind PPA prices are most competitive with wholesale prices in the Interior
region (where PPAs signed in 2011/2012 generally ranged from $20-40/MWh)

WIND AND WATER POWER PROGRAM
Uncertainties in Future Natural Gas Prices Are Substantial, and Upwards Trajectory in Prices Is Anticipated
Source: LBNL compilation of forecasts and data from the Energy Information Administration
3
4
5
6
7
8
9
10
11
19
97
19
99
20
01
20
03
20
05
20
07
20
09
20
11
20
13
20
15
20
17
20
19
20
21
20
23
20
25
20
27
20
29
20
31
20
33
20
35
20
37
20
39
Nat
ura
l Gas
Pri
ce D
eliv
ere
d t
o E
lect
rici
ty
Ge
ne
rato
rs (
20
12
$/M
MB
tu)
1998-2001
2008
2009 2010
2012
2011
2013(Ref)
2002
2005
2006-07
2004
2003
Actual
2013(High)
2013(Low)
Actual versus AEO Projections
27

WIND AND WATER POWER PROGRAM
Recent Wind PPAs Can Compete on a Long-Term Basis, and Many Very Recent PPAs Can Compete in Short Term; PTC Plays a Key Role in this Competitiveness
Note: Wind is modeled as “fuel saver” – i.e., assumed to offset only fuel costs of gas generation (no credit for capacity value, etc.)
*Fuel cost projections are translated from $/MMBtu into $/MWh terms using average heat rates implied in the NEMS modeling output
0
20
40
60
80
100
120
140
19
99
20
01
20
03
20
05
200
7
20
09
20
11
20
13
20
15
20
17
20
19
202
1
20
23
20
25
20
27
20
29
20
31
20
33
203
5
20
37
20
39
20
41
20
43
20
45
No
min
al $
/MW
h
Range of recent EIA gas scenarios* AEO11 reference gas AEO12 reference gas AEO13 reference gas Historical gas Wind PPA sample Wind PPA sample (no PTC)
+$23/MWh if no PTC
Wind PPA sample includes only those signed in 2011 or 2012: 38 PPAs totaling 3,876 MW
28
Many current PPAs in Interior

WIND AND WATER POWER PROGRAM
29
Conclusions

WIND AND WATER POWER PROGRAM
30
Current Low Prices for Wind Energy Can Compete with Only the Operating Cost of Natural Gas Plants in Some Areas, and May Support Higher Growth in the Future, but Other Pricing Headwinds Include…
• Lack of clarity about fate of federal tax incentives
• Continued low natural gas and wholesale electricity prices
• Growing competition from solar in some regions

WIND AND WATER POWER PROGRAM
31
Regional Definitions Based on Combination of Geography and Wind Resource
Interior
GreatLakes
West
Southeast
Northeast