william z. bernstein using a stochastic analytic · william z. bernstein ... ous levels based on...
TRANSCRIPT
Devarajan RamanujanSchool of Mechanical Engineering,
Purdue University,
West Lafayette, IN 47907
e-mail: [email protected]
William Z. BernsteinSchool of Mechanical Engineering,
Purdue University,
West Lafayette, IN 47907
Jun-Ki ChoiDepartment of Mechanical and
Aerospace Engineering,
University of Dayton,
Dayton, OH 45469
Mikko KohoDepartment of Production Engineering,
Tampere University of Technology,
Tampere FI-33720, Finland
Fu ZhaoSchool of Mechanical Engineering,
Purdue University,
West Lafayette, IN 47909
Karthik RamaniSchool of Mechanical Engineering,
Purdue University,
West Lafayette, IN 47907
Prioritizing Design forEnvironment StrategiesUsing a Stochastic AnalyticHierarchy ProcessThis paper describes a framework for applying design for environment (DfE) within anindustry setting. Our aim is to couple implicit design knowledge such as redesign/processconstraints with quantitative measures of environmental performance to enable informeddecision making. We do so by integrating life cycle assessment (LCA) and multicriteriadecision analysis (MCDA). Specifically, the analytic hierarchy process (AHP) is used forprioritizing various levels of DfE strategies. The AHP network is formulated so as toimprove the environmental performance of a product while considering business-relatedperformance. Moreover, in a realistic industry setting, the onus of decision making oftenrests with a group, rather than an individual decision maker (DM). While conducting in-dependent evaluations, experts often do not perfectly agree and no individual expert canbe considered representative of the ground truth. Hence, we integrate a stochastic simu-lation module within the MCDA for assessing the variability in preferences among DMs.This variability in judgments is used as a metric for quantifying judgment reliability. Asensitivity analysis is also incorporated to explore the dependence of decisions on specificinput preferences. Finally, the paper discusses the results of applying the proposedframework in a real-world case. [DOI: 10.1115/1.4025701]
Keywords: design for environment, analytic hierarchy process, stochastic simulation
1 Introduction
DfE involves the systematic evaluation of design performancewith respect to environmental, health, and safety objectivesover the entire product life cycle. Establishing appropriate DfEstrategies is critical for improving the environmental aspects of aproduct [1]. The process of establishing such strategies requiressimultaneous consideration of environmental as well as businessconcerns using the concept of MCDA for selecting relevant DfEstrategies [2]. However, product designers often lack access toreliable data regarding the environmental impacts of products andprocesses, which are essential for making decisions involvingcomplex trade-offs between competing objectives [3]. Althoughdata gathered for life cycle impact assessment offers one way tobridge this knowledge gap, problems are often compounded byunfamiliarity with environmental issues among product develop-ment personnel. Arguably so, the process of product design,development and management, usually incorporates environmen-tal considerations as a regulation/compliance issue which leads toa failure in proactively adopting DfE practices. In order to instill aproactive approach among designers, an MCDA frameworkshould be based on quantitative measurements of a product’s envi-ronmental performance obtained from a validated sustainabilityassessment tool.
On a coarse scale, tools that assess the environmentalsustainability of a product or process can be categorized into vari-ous levels based on the nature of assessment, i.e., (a) qualitative/quantitative, (b) on temporal/spatial scales, and (c) on theirintegration of environmental, economic and social systems. From
a systems perspective, an ecologically sustainable society isdefined as that state (condition) of society in which nature is notsubject to systematically increasing (a) concentrations of substan-ces extracted from the Earth’s crust, (b) concentrations of substan-ces produced by the society, (c) degradation by physical means,and (d) society needs [4]. However, in regards to product design,the system boundaries for assessing a product’s environmentalsustainability must be objectively defined and are usually muchsmaller in scope.
A few earlier studies [5,6] have reviewed approaches for envi-ronmentally sustainable product design. Masui [7] developed theQFD for environment by incorporating environmental aspects intoquality function deployment (QFD) to handle environmental andtraditional product quality requirements simultaneously. Brezetand Hemel [8] developed the life cycle design strategy wheelmethod and considered the impacts of a product or service acrossdifferent levels: product component, product structure, and prod-uct system. Keoleian et al. [9] suggest a method to identifyall design requirements in the form of a matrix that allows thedesigner to decide so-called must requirements and want require-ments. However, these studies do not incorporate quantitativemodels in the product development process. Also, checklist typedesign guidelines may overwhelm product designers. Therehave been some frameworks that have proposed solving designproblems with mathematical modeling [10–12]. However, thesetechniques have not been extended to specifically address theenvironmental aspects of product design. For doing so, the keyenvironmental design drivers of a product must be identifiedquantitatively and correlated with corresponding traditionaldesign drivers (i.e., from a bottom-line perspective). Some usefulapproaches have been studied in reference to the mentionedframework in related domains. Thurston and Srinivasan [13] pres-ent a framework for employing mathematical decision modeling
Contributed by the Design Theory and Methodology Committee of ASME forpublication in the JOURNAL OF MECHANICAL DESIGN. Manuscript received February 18,2012; final manuscript received October 8, 2013; published online April 28, 2014.Assoc. Editor: Jonathan Cagan.
Journal of Mechanical Design JULY 2014, Vol. 136 / 071002-1Copyright VC 2014 by ASME
Downloaded From: http://mechanicaldesign.asmedigitalcollection.asme.org/ on 08/29/2014 Terms of Use: http://asme.org/terms

via a constrained optimization approach as applicable to greenengineering. Michalek et al. [14] propose a methodology to solvemulti-objective formulations involved in marketing, manufactur-ing, and engineering design decisions with concurrent engineeringstrategies. Skerlos and Zhao [15] apply optimization algorithmsfor assessing the economics of metalworking fluids recycling.However, in most of these studies quantitative LCA studies arenot conducted for identifying environmental hotspots (problemareas) within a product system. The widespread use of easy-to-use, computer-based commercial LCA packages makes it possiblefor DfE practitioners to analyze the environmental impacts of aproduct without necessarily having an in-depth understanding ofLCA methodologies [16].
Most of the applications of decision analysis in conjunctionwith LCA have been confined to the weighting of inventory dataissues [17–22]. Few papers, discuss the integration of LCA andMCDA either for ranking alternative processes or for prioritizingstrategies that enable environmentally sustainable product design(ESPD) [23–27]. This is primarily due to the fact that LCA hasbeen developed without an explicit link to a specific decisionanalysis framework. Weil et al. [28] and Xiong et al. [29] addressintegrating MCDA within the LCA framework while consideringuncertainties in the input data, for robust selection among givenalternatives. The focus of these papers is not on facilitating deci-sions in regards to environmentally sustainable product design.Moreover, the expressed preferences in these MCDAs are implic-itly assumed to be deterministic as scenarios with independentevaluations by a group of experts are not accounted for. Huanget al. [30] discuss a framework for material selection in environ-mentally conscious design using an MCDA similar to the TOPSISmethod. They also consider uncertainties in inventory data aswell as a judgment criterion using an entropy based approach. Areview in regards to the applications of different MCDA methodstowards environmental decision making can be found in Ref. [31].Methods for addressing uncertainty related to product design arediscussed in Refs. [32–34], but issues related to ESPD are notconsidered. Duncan et al. [35] extensively discusses modelinguncertainties for environmentally benign decision making usingthe information gap decision theory (IGDT). Uncertainties in lifecycle inventory and those that arise in the process of applyingIGDT for design decision making are considered. Whenever mul-tiple decision makers are involved, additional analyses regardingthe combined consistency of the group’s evaluations and the rela-tive importance of the each specific judgment is required [36].Additionally, conducting a sensitivity analysis on the alternativesmay help the decision makers refine their judgments.
In this paper, a framework for integrating LCA with a sto-chastic MCDA is illustrated in order to facilitate rational de-cision making with regards to aiding ESPD. Sometimes, adeterministic single score may mislead the designer, especiallywhen competing DfE criteria have similar scores as indicatedin the author’s previous study [37]. Therefore, uncertainty andsensitivity analyses are incorporated through a Monte Carlosimulation (MCS) within the decision making process to pro-vide a spread of feasible decision criteria. Although differentcompanies have different strategies and criteria, a generalframework will allow companies to systematically prioritizeDfE strategies enabling more robust decisions for ESPD. Theremainder of this paper proceeds as follows. Section 2describes the proposed methodology, including an LCA mod-ule, a DfE module, and an MCDA module with uncertaintyanalysis. Section 3 describes the process of applying the pro-posed framework to a real world case study. This case studyinvolves prioritizing DfE strategies for the redesign of a sur-face drilling rig within leading mining equipment manufac-turer based in Finland. Section 4 summarizes the results anddiscusses the statistical testing methods necessary for makingstatistically sound decisions with the resulting stochastic data.Section 5 concludes the paper and sets the direction forfuture research.
2 Methodology
The general framework for eliciting expert preferences and pri-oritizing corresponding DfE strategies using the AHP from anindividual DM has been presented in the author’s previous work[37]. The proposed framework involves conducting an LCA of aproduct to identify environmental hotspots throughout the prod-uct’s entire life cycle. The results from the LCA provide informa-tion about the most significant life cycle stages in terms ofspecific environmental impacts. Then, various levels of DfE strat-egies involved in the specific life cycle stage are prioritized usingan AHP to assist the designer in identifying the relative impor-tance of environmental and business-related performances withinthat product. The current paper aims at extending the earlierframework by (1) including the case of independent evaluationsby multiple DMs (2) incorporating uncertainty and statistical test-ing methods in the prior methodology to aid better decision mak-ing. Uncertainties resulting from DM’s preferences in the AHPare characterized using Bootstrap re-sampling. (3) And finally,this paper validates the overall methodology by applying it withina real-world industry setting.
The process diagram of the general framework used for priori-tizing DfE strategies is shown in Fig. 1. First, the LCA moduleidentifies the environmental impact of the specified product sys-tem. There are various types of LCA: traditional SETAC LCA ora process based LCA [38], economic I/O (input/output) basedLCA [39,40], and a hybrid LCA [41]. Each LCA has a scope thatdefines the system boundaries. SETAC LCA provides the mostaccurate result in the finest level within limited system boundarieswhile an economic I/O based LCA provides the most comprehen-sive result on an aggregated economic sector level perspective. Ahybrid LCA combines these two types to mitigate the weaknessesof each methodology. Since the proposed framework is intendedfor application in a business setting, there are severe constraintson available resources and time which require the set systemboundaries to be relatively fine. Therefore, a SETAC LCA is pre-ferred. Also, the use of existing life cycle inventory databasesgreatly simplifies the life cycle inventory analysis.
Fig. 1 Schematic diagram of the proposed framework forintegrating an sAHP based MCDA with a traditional LCA
071002-2 / Vol. 136, JULY 2014 Transactions of the ASME
Downloaded From: http://mechanicaldesign.asmedigitalcollection.asme.org/ on 08/29/2014 Terms of Use: http://asme.org/terms

Although life cycle inventory analysis provides insight regard-ing the environmental hotspots of the product system, it cannot beapplied directly to judge the environmental performance of aproduct system due to the lack of specific judgment criteria.Therefore, life cycle impact assessment is conducted to convertthe inventory results to normalized environmental impact results.Once the inventory parameters are classified into impact catego-ries, the relative contribution of each inventory parameter to agiven impact category is quantified using a characterization factor[42]. The next step in the methodology is life cycle interpretationwhere key issues such as the activities, processes, materials, com-ponents, and life cycle stages are identified [43]. Each life cyclestage has a set of associated DfE strategies each contain varioussub-criteria for improving the environmental aspect of a productsystem as shown in Fig. 2. Within a DfE module, the DMs analyzethe LCA results to determine how the corresponding sub-criteriashould be prioritized. The AHP is used in this study for prioritiz-ing DfE strategies. AHP, developed by [44], is a flexible MCDAtool for complex problems where both qualitative and quantitativeaspects are considered. It helps the analyst organize the criticalaspects of a problem into a hierarchical structure similar to a fam-ily tree. Key elements in traditional AHP are shown in the follow-ing equations. Equation (1) calculates the consistency index (CI)between decision criteria and provides a confidence level of thedecisions provided by the subjective experts and Eq. (2) calculatesits consistency ratio (CR). Equation (3) calculates the globalweight of each sub-criteria and Eq. (4) captures the global priorityscore which provides a deterministic, single value of the relativeimportance of each DfE strategy.
C:I ¼ ðWmax � NÞ=ðN � 1Þ (1)
C:R ¼ C:I=R:IN (2)
GWj ¼ LWi � LWj (3)
GPSk ¼XðGWj � RSj;kÞ (4)
People lacking experience in the fundamentals of AHP mightencounter difficulties when directly inputting ambiguous judg-ments into the preference matrix. Questionnaires provide amore systematic approach for constructing the AHP matrix. Struc-turing a questionnaire includes defining the main elements of the
hierarchy at each level and eliciting their importance through spe-cific questions. It is important to avoid possible misunderstandingswith the respondent, as the phrasing of the questions and record-ing of the answers could influence the final result. The perceiveddirection of the objectives (i.e., positive or negative) plays animportant role within the design of the questionnaire. All theobjectives on a common level should share a common perceiveddirection. For example, objectives such as improved use ofrecycled material for the raw material criteria and enhanced sup-plier relationship need to have a positive direction with respect tothe external driver. In this study, the following items are includedalong with the questionnaire: a cover letter expressing the purposeof the survey, brief instructions for filling out the survey, a graphi-cal representation of the decision hierarchy and a copy of thereport on the LCA of the product. The main contents of the surveycontain comparison-based questions regarding each criterion ineach level of the decision hierarchy. Subjective data from thequestionnaires is used for the construction of pair-wise compari-son matrices and then eigenvalue problems are solved to providethe CI and CR of each pair-wise comparison for each criterion.
Although a traditional AHP can be a useful tool, it requiresDMs to translate ambiguous judgments into a deterministic prefer-ence values for estimating pairwise comparisons of objectives anddecision alternatives. The accuracy of the comparisons of all pairsof criteria and the resulting decision alternatives may be signifi-cantly influenced by the information available to the DMs, theirunderstanding of the problem under consideration, as well as theirprevious perceptions [45]. These issues are especially a concernwhen dealing with a complex, global issue such as DfE. Miscon-ceptions based on media outlets and specific design experiencescan greatly affect decisions within sustainable product develop-ment [46]. Moreover, design decisions within an organization aretaken by a group of DMs. It is reasonable to assume that each DMin a group has a different value scheme that may significantlydeviate from the value scheme held by another DM in the group.This assumption is especially true when considering decisiongroups for DfE which are usually formed from people belongingto diverse work groups i.e. product designers, financial managers,environmental engineers, suppliers etc. By adopting a determinis-tic weighting scheme in the AHP, any resulting uncertainties orvaluable information about individual preferences of the teamcannot be analyzed. Therefore, for robust decision making, theAHP should incorporate means for statistical testing or signifi-cance comparison among alternatives. The priority ranking ofalternatives resulting from the AHP should also be analyzed forvariation with respect to uncertain input data.
As constructing a closed-form analytic model to represent out-put uncertainties as an explicit function of input uncertaintiesentails significant complexities previous research has approachedthis problem by incorporating methods such as probabilisticjudgments, interval analysis and fuzzy theory within the AHP.The methods described above aid DMs in reaching a statisticallysignificant conclusion regarding their decisions. However, theabove methods are limited by the fact that they need a large sam-ple size of decision weights and consequently DMs. An additionalproblem when dealing with purely probabilistic judgments is thefact that the small sample size of input data prevents accurateparameterization of this data by a statistical distribution [47]. Themodified analytic hierarchy process (MAHP) developed byRef. [48] tries to address the above issues and also considers man-agement related factors in decision making. The MAHP makesuse of a MCS through random sampling of an estimated statisticaldistribution of input preferences. Uncertainties associated with themodel are propagated through the decision making framework. Itshould be noted that an MCS based approach can be consideredthe most effective quantification method for uncertainties and var-iability among the tools available for environmental system analy-sis [49]. However, the MAHP is limited by the fact that it forcesthe DMs to parameterize decision weights using a triangular dis-tribution. Although the assumption of a triangular distribution forFig. 2 List of DfE strategies in a typical product life cycle [8]
Journal of Mechanical Design JULY 2014, Vol. 136 / 071002-3
Downloaded From: http://mechanicaldesign.asmedigitalcollection.asme.org/ on 08/29/2014 Terms of Use: http://asme.org/terms
decision weights works well when they converge to a uniquemodal value, this assumption may not be valid in cases wherethey are uniformly distributed across a range or multimodal. Theprocess of surveying a small sample of DMs can be considered aspolling a subset of expert DMs from the available population.Using a triangular parameterization prevents DMs from makinginferences about the population as a whole. To overcome theabove limitations, the proposed MCDA framework incorporates astochastic analytic hierarchy process (sAHP) that uses Bootstrapre-sampled decision weights. Bootstrap re-sampling is applied inthis case as it (1) is nonparametric in nature (i.e., it does notassume that the data is representative of a specific statistical distri-bution) and (2) allows for measuring the variability of input databy independent and identically distributed (i.i.d) sampling. Also,the resulting bootstrap distribution is centered on the expectedvalue of the true distribution and thus, the performed sAHP analy-sis will be centered on an AHP analysis conducted by averagingindividual preferences.
In a sAHP, instead of deterministic preference values of a tradi-tional AHP, an (i.i.d) sample ðbijðmÞÞ is drawn from a set of pref-erence values. The expected value of these preference values (bij)from all the parameters are plugged into a pair-wise comparisonmatrix, producing a possible prioritization of the alternativesunder consideration. Repeated calculations (“N” times) produce adistribution of the predicted output values reflecting combinedparameter uncertainties. Thus, this process is akin to performing aMCS with bootstrap re-sampling. It should be noted that uncer-tainties in the LCA can influence the results of the sAHP. Eventhough our proposed framework does not explicitly modeluncertainties in LCA, a highly uncertain LCA will cause a largevariance in priority weights which will, in turn, result in overlap-ping preference values.
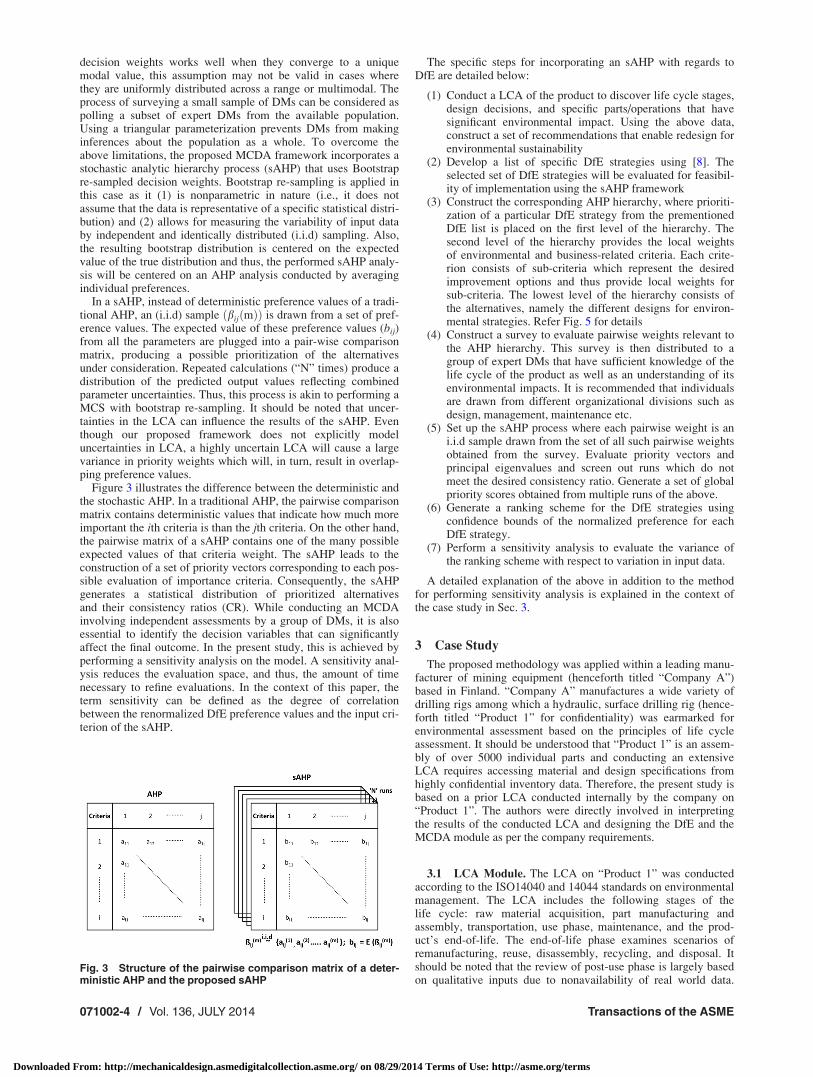
Figure 3 illustrates the difference between the deterministic andthe stochastic AHP. In a traditional AHP, the pairwise comparisonmatrix contains deterministic values that indicate how much moreimportant the ith criteria is than the jth criteria. On the other hand,the pairwise matrix of a sAHP contains one of the many possibleexpected values of that criteria weight. The sAHP leads to theconstruction of a set of priority vectors corresponding to each pos-sible evaluation of importance criteria. Consequently, the sAHPgenerates a statistical distribution of prioritized alternativesand their consistency ratios (CR). While conducting an MCDAinvolving independent assessments by a group of DMs, it is alsoessential to identify the decision variables that can significantlyaffect the final outcome. In the present study, this is achieved byperforming a sensitivity analysis on the model. A sensitivity anal-ysis reduces the evaluation space, and thus, the amount of timenecessary to refine evaluations. In the context of this paper, theterm sensitivity can be defined as the degree of correlationbetween the renormalized DfE preference values and the input cri-terion of the sAHP.
The specific steps for incorporating an sAHP with regards toDfE are detailed below:
(1) Conduct a LCA of the product to discover life cycle stages,design decisions, and specific parts/operations that havesignificant environmental impact. Using the above data,construct a set of recommendations that enable redesign forenvironmental sustainability
(2) Develop a list of specific DfE strategies using [8]. Theselected set of DfE strategies will be evaluated for feasibil-ity of implementation using the sAHP framework
(3) Construct the corresponding AHP hierarchy, where prioriti-zation of a particular DfE strategy from the prementionedDfE list is placed on the first level of the hierarchy. Thesecond level of the hierarchy provides the local weightsof environmental and business-related criteria. Each crite-rion consists of sub-criteria which represent the desiredimprovement options and thus provide local weights forsub-criteria. The lowest level of the hierarchy consists ofthe alternatives, namely the different designs for environ-mental strategies. Refer Fig. 5 for details
(4) Construct a survey to evaluate pairwise weights relevant tothe AHP hierarchy. This survey is then distributed to agroup of expert DMs that have sufficient knowledge of thelife cycle of the product as well as an understanding of itsenvironmental impacts. It is recommended that individualsare drawn from different organizational divisions such asdesign, management, maintenance etc.
(5) Set up the sAHP process where each pairwise weight is ani.i.d sample drawn from the set of all such pairwise weightsobtained from the survey. Evaluate priority vectors andprincipal eigenvalues and screen out runs which do notmeet the desired consistency ratio. Generate a set of globalpriority scores obtained from multiple runs of the above.
(6) Generate a ranking scheme for the DfE strategies usingconfidence bounds of the normalized preference for eachDfE strategy.
(7) Perform a sensitivity analysis to evaluate the variance ofthe ranking scheme with respect to variation in input data.
A detailed explanation of the above in addition to the methodfor performing sensitivity analysis is explained in the context ofthe case study in Sec. 3.
3 Case Study
The proposed methodology was applied within a leading manu-facturer of mining equipment (henceforth titled “Company A”)based in Finland. “Company A” manufactures a wide variety ofdrilling rigs among which a hydraulic, surface drilling rig (hence-forth titled “Product 1” for confidentiality) was earmarked forenvironmental assessment based on the principles of life cycleassessment. It should be understood that “Product 1” is an assem-bly of over 5000 individual parts and conducting an extensiveLCA requires accessing material and design specifications fromhighly confidential inventory data. Therefore, the present study isbased on a prior LCA conducted internally by the company on“Product 1”. The authors were directly involved in interpretingthe results of the conducted LCA and designing the DfE and theMCDA module as per the company requirements.
3.1 LCA Module. The LCA on “Product 1” was conductedaccording to the ISO14040 and 14044 standards on environmentalmanagement. The LCA includes the following stages of thelife cycle: raw material acquisition, part manufacturing andassembly, transportation, use phase, maintenance, and the prod-uct’s end-of-life. The end-of-life phase examines scenarios ofremanufacturing, reuse, disassembly, recycling, and disposal. Itshould be noted that the review of post-use phase is largely basedon qualitative inputs due to nonavailability of real world data.
Fig. 3 Structure of the pairwise comparison matrix of a deter-ministic AHP and the proposed sAHP
071002-4 / Vol. 136, JULY 2014 Transactions of the ASME
Downloaded From: http://mechanicaldesign.asmedigitalcollection.asme.org/ on 08/29/2014 Terms of Use: http://asme.org/terms

Listed below are the definitions of the conducted life cycleassessment.
(1) Goal and Scope: The LCA in the present case is an explora-tory study of the life cycle resource consumptions andemissions of “Product 1”. The primary goal of the LCA isto develop and implement practical guidelines that mini-mize impacts resulting from the production processes aswell as the product itself. The intention is to use thismethod to identify business-related risks and strategiesfrom an environmental point-of-view to aid future purchas-ing decisions and incorporate recommended design changesor improvements. The short term goal is to improve the lifecycle resource efficiency of “Product 1” and to implementcleaner, less expensive, and smarter solutions in the busi-ness process. This involves discovering the factors of envi-ronmental impact which are not only the most significantbut also exhibit economically feasible redesign opportuni-ties. The long term goal is to gain useful information forfuture product planning to make all products moreeco-friendly. A special point of interest within the LCA isevaluating the feasibility of a selective take back programand a systematic disassembly scheme.
(2) Functional Unit: The functional unit is defined as the pro-duction, use and disposal of one drill rig which fulfills thefunctional requirements set to its life time service andwhich is constructed with inputs (material and energy) of aslow environmental impact as possible. Expected servicelife is taken into account. The product’s lifetime under nor-mal conditions of utilization and maintenance is expectedto be 25 yr.
(3) Reference Flow: The reference flow of this LCA study isthe manufacture of one “Product 1” drill rig containingmainly steel and hydraulic parts.
(4) Impact Categories Selected and LCIA Methodology: Theused impact categories are climate change, acidification,eutrophication, toxic effects on humans and ecosystems,ozone formation, depletion of fossil fuels, and minerals.The used LCA methodology is comprehensive and followsstandards of LCA using the EcoInvent database for inven-tory analysis [50] and the EI99 scheme provided bySimaProTM[51]
(5) Allocation Procedures/Boundaries in Relation to Other LifeCycles: Allocation is avoided by splitting the process inspecific separate processes. The manufacturing processdoes not include any clear co-processes or co-products
(6) Intended Audiences: The LCA of “Product 1” is to be usedfor internal purposes.
(7) Report Generation: The report of the LCA follows therequirements of ISO 14048 LCA data documentation for-mat. The documented report contains LCA data, tables, andfigures.
3.2 LCA Results. The results of the conducted life cycleassessment revealed the following significant details:
(1) The most significant life cycle phase from an environmen-tal perspective is maintenance and use. Close to 95% of thelife cycle impact of “Product 1” is due to high diesel fuelconsumption and resulting emissions. Figure 4 outlines thenormalized LCA result outlining the impact contribution ofthis stage.
(2) Oil consumption along with maintenance of change rodsand crowns also contribute toward significant use phaseimpacts.
(3) There is a strong potential for reducing end-of-life environ-mental impacts by pursuing strategies related to substitutionwith recyclable materials and elimination of toxicmaterials.
(4) Planning for disassembly is a key criterion for enablingbetter management of the end of life of “Product 1”. Thisprocess should be coupled with consumer awarenessprograms.
(5) Design for durability can greatly aid in reducing use phaseimpact by reducing the frequency of oil and part changes.
(6) Reducing material flow and waste at the assembly plantcould lead to significant savings.
Based on the results of the LCA the following specific recom-mendations were made in order to reduce the life cycle impact of“Product 1”:
(1) Reduce use phase oil consumption.(2) Reduce the percentage of Nickel and Chromium in the steel
mixture of “Product 1”.
Fig. 4 Figure outlining the significance of use and maintenance phase in the LCAof “Product 1”
Journal of Mechanical Design JULY 2014, Vol. 136 / 071002-5
Downloaded From: http://mechanicaldesign.asmedigitalcollection.asme.org/ on 08/29/2014 Terms of Use: http://asme.org/terms

(3) Increase part reliability to minimize the number of partreplacements over the lifetime of the product.
(4) Incorporate a recycling program for minimizing the end-of-life impacts of the product.
(5) Reduce consumption of drilling consumables.(6) Reduce part count of the product one through design for
manufacturing strategies.(7) Reduce assembly phase consumables in the plant, including
electricity and water.(8) Reduce use phase noise pollution.
Although the above recommendations would greatly help inreducing the life cycle impact of “Product 1”, the feasibility ofimplementing these strategies or their effect on the business per-formance of the company were not analyzed within the life cycleassessment.
3.3 DfE and MCDM Module. Figure 5 illustrates the overallhierarchy structure of MCDA conducted within “Company A”. Inthis case, the AHP hierarchy is constructed as per the proceduredetailed in the methodology section. For this case study, the list ofDfE strategies is chosen from an exhaustive list compiled byRef. [8] as shown in Fig. 2. However, conducting an AHP basedon the entire set of strategies is time and resource intensive (n DfEstrategies with m assessment criteria will require n2m/2 evalua-tions). Thus a pre-assessment of DfE strategies is performed fornarrowing the selection before incorporating them within the AHPhierarchy. Within this case study, product managers from thecompany ranked the criteria as per their relevance to the projectand its applicability. Two product managers of “Product 1” inde-pendently ranked the DfE criterion on a Likert scale ranging fromvery important (9), to least important (1). The top eight DfE crite-ria were chosen for detailed analysis based on the sAHP. It shouldbe noted that the number of DfE strategies selected for final evalu-ation is a function of available project resources (time, applicabil-ity of the DfE strategies in the context of the product, relevance ofDfE strategies to company goals, etc.) and the outcome of therankings. Although the pre-assessment of DfE strategies reducesthe scope of the final evaluation, strategies that are of most inter-est to the company with regards to feasibility of implementationpass through the pre-assessment stage. If these strategies do notcorrespond to specific recommendations made after the LCA, thecompany can choose to re-evaluate their selection methodology atthe pre-assessment stage and re-select better candidate strategies.
After performing the DfE pre-assessment module, a pair-wisecomparison survey was set to fifteen personnel involved in lifecycle planning and environmental assessment for “Product 1”. Ofthese, ten complete responses were returned. Each survey wasaccompanied with supporting documents as detailed in the meth-odology section. The survey template was designed on MicrosoftExcel
VR
for ease of distribution and data extraction. The respond-ents were required to allocate pair-wise weights within the surveybased on the LCA results and their inherent knowledge about thefeasibility of the design process. These sets of ten unique pair-wise weights for a specific comparison factor were used for datare-sampling through the sAHP. For conducting the sAHP, acustom simulation tool was created using Visual Basic for appli-cations in Microsoft Excel
VR
.
4 Results
Figure 6 illustrates an example of the results of the simulation(n¼ 1500) run of the sAHP. A frequency distribution of thenormalized preference of the DfE strategy ensure efficient distri-bution is plotted on the left and the overall consistency ratio of thesAHP is plotted on the right. Each bar on the plot of the overallconsistency ratio is analogous to the likelihood of having a givenconsistency ratio. The spread of the overall consistency ratio’s isbetween 0.035 and 0.07, which is well below the acceptable scoreof 0.1 as defined by Saaty. The variance of the normalized prefer-ence values represents the variability in the input preferenceweights combined with the errors resulting from bootstrapre-sampling. Similar results can also be obtained for all the otherDfE strategies. Figure 6 also visualizes all the DfE strategies plot-ted on the same scale by smoothing the resulting histograms usinga normal kernel density estimate. The kernel density estimate is aprobability density estimate of the sample, based on a normalkernel function evaluated at 100 equally spaced points that coverthe range of the data. As all the DfE preferences are plotted on anormalized scale, the magnitude of the expected value of eachDfE distribution gives a measure of its overall preference. Forexample, from Fig. 6 it is evident that minimize consumption andefficient distribution are the most and least preferred DfE strat-egies, respectively.
Figure 7 compares the results of the sAHP with the preferencevalues obtained by conducting a deterministic AHP by averagingthe pairwise comparisons provided by the ten DMs. As seen, themean value of normalized preferences in the sAHP is
Fig. 5 Structure of the overall AHP network used for prioritization of DfE strategies
071002-6 / Vol. 136, JULY 2014 Transactions of the ASME
Downloaded From: http://mechanicaldesign.asmedigitalcollection.asme.org/ on 08/29/2014 Terms of Use: http://asme.org/terms
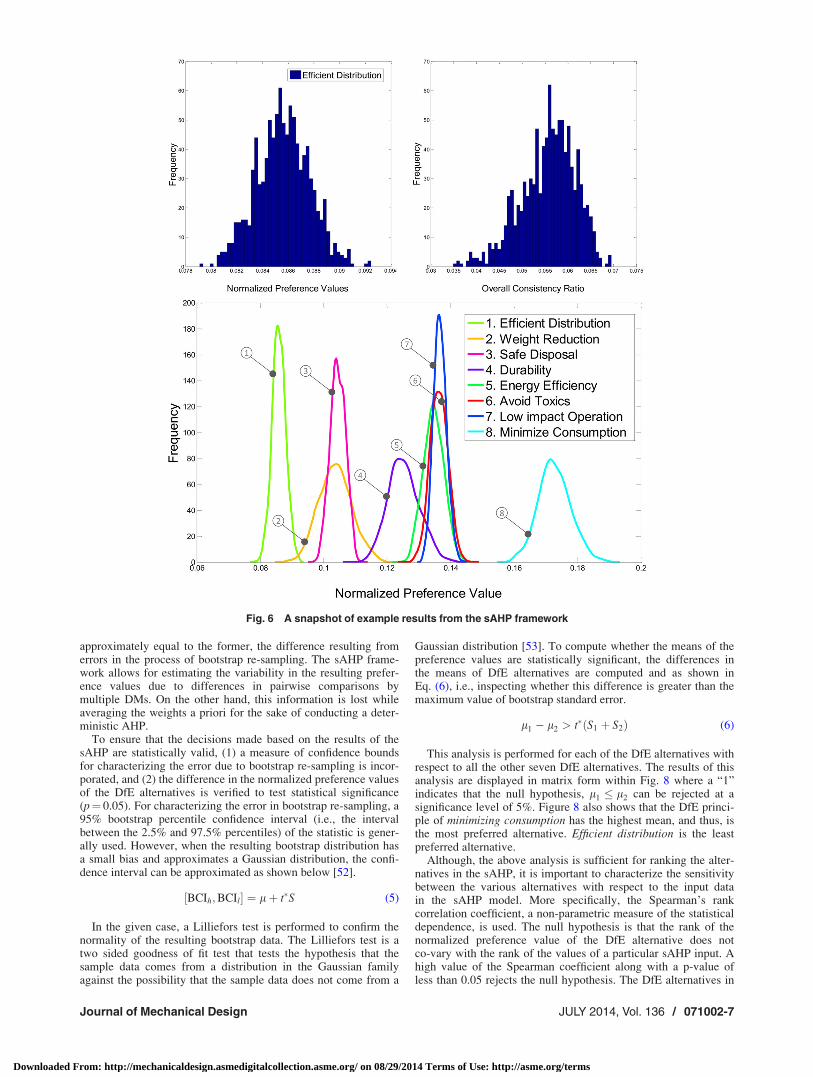
approximately equal to the former, the difference resulting fromerrors in the process of bootstrap re-sampling. The sAHP frame-work allows for estimating the variability in the resulting prefer-ence values due to differences in pairwise comparisons bymultiple DMs. On the other hand, this information is lost whileaveraging the weights a priori for the sake of conducting a deter-ministic AHP.
To ensure that the decisions made based on the results of thesAHP are statistically valid, (1) a measure of confidence boundsfor characterizing the error due to bootstrap re-sampling is incor-porated, and (2) the difference in the normalized preference valuesof the DfE alternatives is verified to test statistical significance(p¼ 0.05). For characterizing the error in bootstrap re-sampling, a95% bootstrap percentile confidence interval (i.e., the intervalbetween the 2.5% and 97.5% percentiles) of the statistic is gener-ally used. However, when the resulting bootstrap distribution hasa small bias and approximates a Gaussian distribution, the confi-dence interval can be approximated as shown below [52].
½BCIh;BCIl� ¼ lþ t�S (5)
In the given case, a Lilliefors test is performed to confirm thenormality of the resulting bootstrap data. The Lilliefors test is atwo sided goodness of fit test that tests the hypothesis that thesample data comes from a distribution in the Gaussian familyagainst the possibility that the sample data does not come from a
Gaussian distribution [53]. To compute whether the means of thepreference values are statistically significant, the differences inthe means of DfE alternatives are computed and as shown inEq. (6), i.e., inspecting whether this difference is greater than themaximum value of bootstrap standard error.
l1 � l2 > t�ðS1 þ S2Þ (6)
This analysis is performed for each of the DfE alternatives withrespect to all the other seven DfE alternatives. The results of thisanalysis are displayed in matrix form within Fig. 8 where a “1”indicates that the null hypothesis, l1 � l2 can be rejected at asignificance level of 5%. Figure 8 also shows that the DfE princi-ple of minimizing consumption has the highest mean, and thus, isthe most preferred alternative. Efficient distribution is the leastpreferred alternative.
Although, the above analysis is sufficient for ranking the alter-natives in the sAHP, it is important to characterize the sensitivitybetween the various alternatives with respect to the input datain the sAHP model. More specifically, the Spearman’s rankcorrelation coefficient, a non-parametric measure of the statisticaldependence, is used. The null hypothesis is that the rank of thenormalized preference value of the DfE alternative does notco-vary with the rank of the values of a particular sAHP input. Ahigh value of the Spearman coefficient along with a p-value ofless than 0.05 rejects the null hypothesis. The DfE alternatives in
Fig. 6 A snapshot of example results from the sAHP framework
Journal of Mechanical Design JULY 2014, Vol. 136 / 071002-7
Downloaded From: http://mechanicaldesign.asmedigitalcollection.asme.org/ on 08/29/2014 Terms of Use: http://asme.org/terms
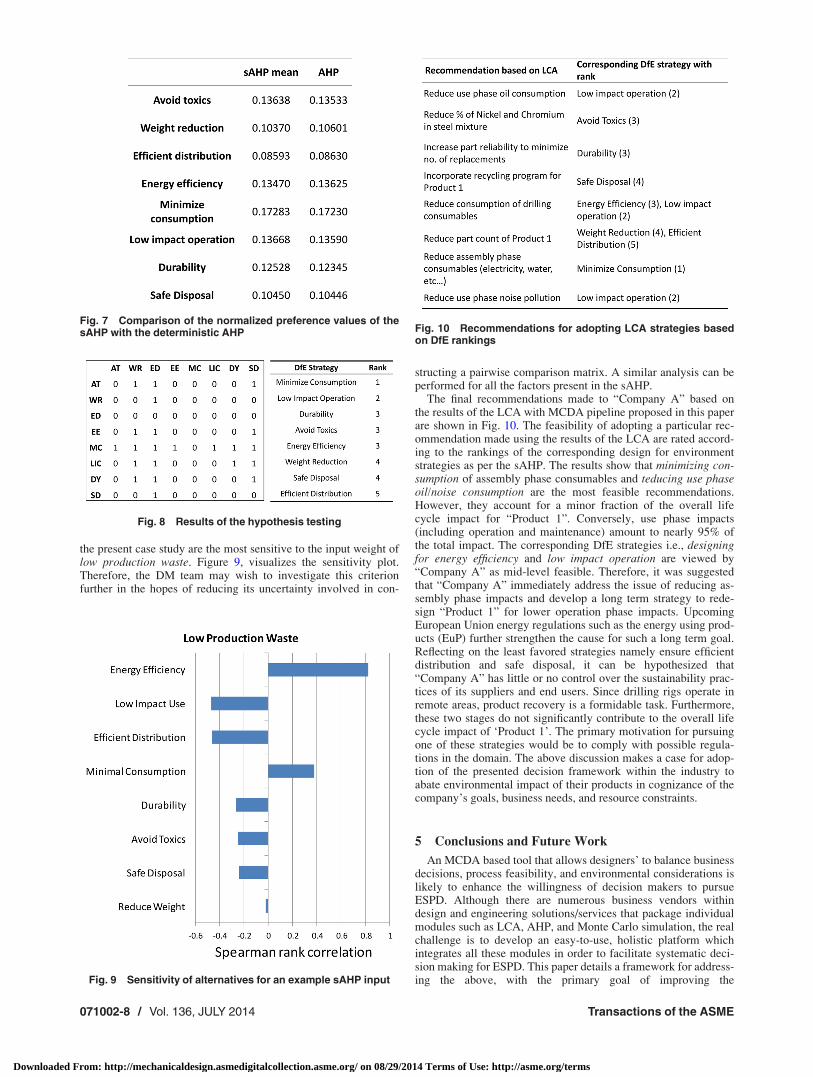
the present case study are the most sensitive to the input weight oflow production waste. Figure 9, visualizes the sensitivity plot.Therefore, the DM team may wish to investigate this criterionfurther in the hopes of reducing its uncertainty involved in con-
structing a pairwise comparison matrix. A similar analysis can beperformed for all the factors present in the sAHP.
The final recommendations made to “Company A” based onthe results of the LCA with MCDA pipeline proposed in this paperare shown in Fig. 10. The feasibility of adopting a particular rec-ommendation made using the results of the LCA are rated accord-ing to the rankings of the corresponding design for environmentstrategies as per the sAHP. The results show that minimizing con-sumption of assembly phase consumables and teducing use phaseoil/noise consumption are the most feasible recommendations.However, they account for a minor fraction of the overall lifecycle impact for “Product 1”. Conversely, use phase impacts(including operation and maintenance) amount to nearly 95% ofthe total impact. The corresponding DfE strategies i.e., designingfor energy efficiency and low impact operation are viewed by“Company A” as mid-level feasible. Therefore, it was suggestedthat “Company A” immediately address the issue of reducing as-sembly phase impacts and develop a long term strategy to rede-sign “Product 1” for lower operation phase impacts. UpcomingEuropean Union energy regulations such as the energy using prod-ucts (EuP) further strengthen the cause for such a long term goal.Reflecting on the least favored strategies namely ensure efficientdistribution and safe disposal, it can be hypothesized that“Company A” has little or no control over the sustainability prac-tices of its suppliers and end users. Since drilling rigs operate inremote areas, product recovery is a formidable task. Furthermore,these two stages do not significantly contribute to the overall lifecycle impact of ‘Product 1’. The primary motivation for pursuingone of these strategies would be to comply with possible regula-tions in the domain. The above discussion makes a case for adop-tion of the presented decision framework within the industry toabate environmental impact of their products in cognizance of thecompany’s goals, business needs, and resource constraints.
5 Conclusions and Future Work
An MCDA based tool that allows designers’ to balance businessdecisions, process feasibility, and environmental considerations islikely to enhance the willingness of decision makers to pursueESPD. Although there are numerous business vendors withindesign and engineering solutions/services that package individualmodules such as LCA, AHP, and Monte Carlo simulation, the realchallenge is to develop an easy-to-use, holistic platform whichintegrates all these modules in order to facilitate systematic deci-sion making for ESPD. This paper details a framework for address-ing the above, with the primary goal of improving the
Fig. 7 Comparison of the normalized preference values of thesAHP with the deterministic AHP
Fig. 8 Results of the hypothesis testing
Fig. 9 Sensitivity of alternatives for an example sAHP input
Fig. 10 Recommendations for adopting LCA strategies basedon DfE rankings
071002-8 / Vol. 136, JULY 2014 Transactions of the ASME
Downloaded From: http://mechanicaldesign.asmedigitalcollection.asme.org/ on 08/29/2014 Terms of Use: http://asme.org/terms

environmental aspect of the product through DfE whilst integratingbusiness and feasibility parameters. The proposed framework inte-grates the qualitative and quantitative aspects of decision makingby correlating LCA with an AHP based stochastic analysis. It is aqualitative method in the sense that it utilizes subjective data col-lected from experts through a developed questionnaire. At thesame time, it is a quantitative method since it calculates the globalpriority scores (GPS) and estimates the eigenvalue/eigenvectorsfor each decision criteria which are based on a LCA of the product.Furthermore, the process for solving eigenvalues and eigenvectorsof each pairwise comparison matrix evaluates that the data pro-vided by the design team is logically consistent, facilitating arational decision making process. One of the major contributionsof this paper is the integration of an uncertainty analysis modulewithin this integrated framework through the use of a stochasticAHP with bootstrap re-sampling. Additionally, statistical signifi-cance testing and a sensitivity analysis enable decision makers intaking robust decisions as well as refining the accuracy of theanalysis.
Methods for designing the questionnaire, constructing the pair-wise comparison matrix, and calculating GPS are also illustratedin order to understand the proposed methodology. Finally, theimplementation of the methodology within “Company A” verifiesits ease of applicability in a real-world industry setting.
Although an integrated framework that incorporates environ-mental and business considerations was presented, it should beunderstood that the method only identifies management levelstrategies to support ESPD. Decisions that support ESPD activ-ities need to consider product information from both a companylevel as well as the product component level perspective. Futureresearch will focus on extending this framework so as to translatethe presented DfE strategies to the product component level withthe goal of generating specific redesign instructions.
6 Supporting Information
For the sake of brevity, supporting information, including theoriginal dataset from the ten surveys and the Microsoft Excel
VR
basedsurvey, is not comprehensively described in the paper. Interestedreaders can download this content from the following webpage.1
Acknowledgment
The authors appreciate the insight provided by Ritabrata Duttafrom the Department of Statistics at Purdue University. Theauthors are grateful for the financial support provided by theNational Science Foundation under Grants EEC 0935074 andCMMI 1100619. The contents of this manuscript do not necessar-ily reflect the views or opinions of either of these agencies.
Nomenclature
BCIh ¼ upper bound of the bootstrap confidence intervalBCIl ¼ lower bound of the bootstrap confidence interval
C.I ¼ Saaty’s consistency indexC.R ¼ consistency ratio of the pair-wise comparison matrix
GPSk ¼ global priority score of kth DfE strategyGWj ¼ global weight of jth criteria
i ¼ type of criteria i 2 1; 2; :::; Ij ¼ type of sub-criteria j 2 1; 2; :::; Jk ¼ type of DfE strategy k 2 1; 2; :::;K
LWi ¼ local weight of ith criteriaLWj ¼ local weight of jth criteria
N ¼ number of activities/size of the pair-wise comparisonmatrix
R.IN ¼ random consistency index for the pair-wise comparisonmatrix of size N
RSj,k ¼ rating of kth DfE strategy with respect to jth sub-criteria
S ¼ sootstrap standard errort* ¼ critical value of the t(n� 1) distribution at a p value of
0.05l ¼ expected value of the bootstrap distribution
Wmax ¼ max eigenvalue of the pair-wise comparison matrix ofsize N
References[1] Hundal, M., 2001, Integration of Eco-Design Into the Business: Mechanical
Life Cycle Handbook, Marcel Dekker, New York.[2] Fiksel, J. R., 1996, Design for Environment: Creating Eco-Efficient Products
and Processes, McGraw-Hill, New York.[3] Hundal, M. S., 1993, “Rules and Models for Low Cost Design,” Proceedings of
the ASME Design for Manufacturability Conference, pp. 50–63.[4] Robert, K.-H., Schmidt-Bleek, B., de Larderel, J. A., Basile, G., Jansen, J.,
Kuehr, R., Thomas, P. P., Suzuki, M., Hawken, P., and Wackernagel, M., 2002,“Strategic Sustainable Development Selection, Design, and Synergies ofApplied Tools,” J. Cleaner Prod., 10(3), pp. 197–214.
[5] Petrick, I. J., and Echols, A. E., 2004, “Technology Roadmapping in Review: ATool for Making Sustainable New Product Development Decisions,” Technol.Forecast. Soc. Change, 71(1–2), pp. 81–100.
[6] Byggeth, S., and Hochschorner, E., 2006, “Handling Trade-Offs in EcodesignTools for Sustainable Product Development and Procurement,” J. CleanerProd., 14(15–16), pp. 1420–1430.
[7] Masui, K., 2000, “New Method Developed for Design for Environment (DfE),”ECP Newsletter, No. 15.
[8] Brezet, H., and van Hemel, C., 2001, “Ecodesign: Promising Approach to Sus-tainable Production and Consumption,” Grid Arendal UNEP (press releaseMonday 28 April 1997). Available at: http://www.grida.no/news/press/1711.aspx
[9] Keoleian, G. A., Menerey, D., and Curran, M. A., 1993, “Life Cycle DesignGuidance Manual,” Vol. EPA600/R-92/226, EPA, Cincinnati, OH.
[10] Nelson, II, S. A., Parkinson, M. B., and Papalambros, P. Y., 2001, “MulticriteriaOptimization in Product Platform Design,” ASME J. Mech. Des., 123(2), pp.199–204.
[11] Cooper, A. B., Georgiopoulos, P., Kim, H. M., and Papalambros, P. Y., 2006,“Analytical Target Setting: An Enterprise Context in Optimal Product Design,”ASME J. Mech. Des., 128(1), pp. 4–13.
[12] Chung, C. C.-W., Choi, J.-K., Ramani, K., and Patwardhan, H., 2005, “ProductNode Architecture: A Systematic Approach to Provide Structured Flexibility inDistributed Product Development,” Concurr. Eng. Res. Appl., 13(3), pp.219–232.
[13] Thurston, D. L., and Srinivasan, S., 2003, “Constrained Optimization for GreenEngineering Decision-Making,” Environ. Sci. Technol., 37(23), pp. 5389–5397.
[14] Michalek, J. J., Ceryan, O., Papalambros, P. Y., and Koren, Y., 2006,“Balancing Marketing and Manufacturing Objectives in Product Line Design,”ASME J. Mech. Des., 128(6), pp. 1196–1204.
[15] Skerlos, S. J., and Zhao, F., 2003, “Economic Considerations in the Implemen-tation of Microfiltration for Metalworking Fluid Biological Control,” J. Manuf.Syst., 22(3), pp. 202–219.
[16] Curran, M. A., 2004, “The Status of Life-Cycle Assessment as an Environmen-tal Management Tool,” Environ. Prog., 23(4), pp. 277–283.
[17] Weber, M., and Borcherding, K., 1993, “Behavioral Influences on Weight Judg-ments in Multiattribute Decision Making,” Eur. J. Oper. Res., 67(1), pp. 1–12.
[18] Guin�ee, J. B., and Heijungs, R., 2000, Life Cycle Assessment, John Wiley andSons, Inc., New York.
[19] Werner, F., and Scholz, R., 2002, “Ambiguities in Decision-Oriented LifeCycle Inventories the Role of Mental Models,” Int. J. Life Cycle Assess., 7, pp.330–338.
[20] Rogers, K., and Seager, T. P., 2009, “Environmental Decision-Making UsingLife Cycle Impact Assessment and Stochastic Multiattribute Decision Analysis:A Case Study on Alternative Transportation Fuels,” Environ. Sci. Technol.,43(6), pp. 1718–1723.
[21] Liu, K., 2007, “Evaluating Environmental Sustainability: An Integration ofMultiple-Criteria Decision-Making and Fuzzy Logic,” Environ. Manage.(N.Y.), 39, pp. 721–736.
[22] Dorini, G., Kapelan, Z., and Azapagic, A., 2011, “Managing Uncertainty inMultiple-Criteria Decision Making Related to Sustainability Assessment,”Clean Technol. Environ. Policy, 13, pp. 133–139.
[23] Eagan, P., and Weinberg, L., 1999, “Application of Analytic Hierarchy ProcessTechniques to Streamlined Life-Cycle Analysis of Two Anodizing Processes,”Environ. Sci. Technol., 33(9), pp. 1495–1500.
[24] Papalexandrou, M., Pilavachi, P., and Chatzimouratidis, A., 2008, “Evaluationof Liquid Bio-Fuels Using the Analytic Hierarchy Process,” Process Saf. Envi-ron. Prot., 86(5), pp. 360–374.
[25] Mohamadabadi, H. S., Tichkowsky, G., and Kumar, A., 2009, “Development ofa Multi-Criteria Assessment Model for Ranking of Renewable and Non-Renewable Transportation Fuel Vehicles,” Energy, 34(1), pp. 112–125.
[26] Hermann, B., Kroeze, C., and Jawjit, W., 2007, “Assessing Environmental Per-formance by Combining Life Cycle Assessment, Multi-Criteria Analysis andEnvironmental Performance Indicators,” J. Cleaner Prod., 15(18), pp.1787–1796.
[27] Khan, F., Sadiq, R., and Veitch, B., 2004, “Life Cycle Index (LInX): A NewIndexing Procedure for Process and Product Design and Decision-Making,”J. Cleaner Prod., 12(1), pp. 59–76.1http://goo.gl/C4HIE
Journal of Mechanical Design JULY 2014, Vol. 136 / 071002-9
Downloaded From: http://mechanicaldesign.asmedigitalcollection.asme.org/ on 08/29/2014 Terms of Use: http://asme.org/terms

[28] Weil, M., Jeske, U., Dombrowski, K., and Buchwald, A., 2007, “SustainableDesign of Geopolymers—Evaluation of Raw Materials by the Integration ofEconomic and Environmental Aspects in the Early Phases of MaterialDevelopment,” Advances in Life Cycle Engineering for Sustainable Manu-facturing Businesses, S. Takata and Y. Umeda, eds., Springer, London, pp.279–283.
[29] Xiong, Y., Lau, K., Zhou, X., and Schoenung, J. M., 2008, “A Streamlined LifeCycle Assessment on the Fabrication of WCCO Cermets,” J. Cleaner Prod.,16(10), pp. 1118–1126.
[30] Huang, H., Liu, Z., Zhang, L., and Sutherland, J., 2009, “Materials Selec-tion for Environmentally Conscious Design Via a Proposed Life CycleEnvironmental Performance Index,” Int. J. Adv. Manuf. Technol., 44, pp.1073–1082.
[31] Kiker, G. A., Bridges, T. S., Varghese, A., Seager, T. P., and Linkov, I., 2005,“Application of Multicriteria Decision Analysis in Environmental DecisionMaking,” Integr. Environ. Assess. Manage., 1(2), pp. 95–108.
[32] Chan, K.-Y., Skerlos, S., and Papalambros, P. Y., 2006, “Monotonicity andActive Set Strategies in Probabilistic Design Optimization,” ASME J. Mech.Des., 128(4), pp. 893–900.
[33] MacDonald, E. F., Gonzalez, R., and Papalambros, P. Y., 2009, “PreferenceInconsistency in Multidisciplinary Design Decision Making,” ASME J. Mech.Des., 131(3), p. 031009.
[34] DeLaurentis, D. A., and Mavris, D. N., 2000, “Uncertainty Modeling andManagement in Multidisciplinary Analysis and Synthesis,” AIAA AerospaceSciences Meeting, Paper No. AIAA-2000–422.
[35] Duncan, S. J., Bras, B., and Paredis, C. J., 2008, “An Approach to RobustDecision Making Under Severe Uncertainty in Life Cycle Design,” Int. J. Sus-tainable Energy, 1(1), pp. 45–59.
[36] Keeney, R. L., 1982, “Feature Article Decision Analysis: An Overview,” Oper.Res., 30(5), pp. 803–838.
[37] Choi, J. K., Nies, L. F., and Ramani, K., 2008, “A Framework for the Integra-tion of Environmental and Business Aspects Toward Sustainable ProductDevelopment,” J. Eng. Design, 19(5), pp. 431–446.
[38] Consoli, F., Allen, D., Bounstead, I., Fava, J., Franklin, W., Jensen, A. A., deOude, N., Parirish, R., Perriman, R., Postlethwaite, D., Quay, B., Seguin, J., andVigon, B., 1993, Guidelines for Life-Cycle assessment: A Code of Practice, So-ciety of Environmental Toxicology and Chemistry, (SETAC), Pensacola, FL.
[39] Miller, R. E., and Blair, P. D., 1985, Input-Output Analysis: Foundations andExtensions, Cambridge University Press, New York.
[40] Lave, L. B., Cobas-Flores, E., Hendrickson, C. T., and McMichael, F. C., 1995,“Using Input-Output Analysis to Estimate Economy-Wide Discharges,” Envi-ron. Sci. Technol., 29(9), pp. 420A–426A.
[41] Bullard, C. W., Penner, P. S., and Pilati, D. A., 1978, “Net Energy Analysis:Handbook for Combining Process and Input-Output Analysis,” Resour. Energy,1(3), pp. 267–313.
[42] Graedel, T. E., and Allenby, B., 2002, Industrial Ecology, Prentice-Hall, Engle-wood Cliffs, NY.
[43] Baumman, H., and Tillman, A., 2004, The Hitch Hikers Guide to LCA: AnOrientation in Life Cycle Assessment Methodology and Application, Studentlit-teratur, Lund, Sweden.
[44] Saaty, T., 1980, The Analytic Hierarchy Process, McGraw-Hill, New York.[45] Alting, L., 1995, “Environmental Assessment of Industrial Products,” CIRP
Ann., pp. 533–534.[46] Bernstein, W. Z., Ramanujan, D., Devanathan, S., Zhao, F., Sutherland, J., and
Ramani, K., 2010, “Function Impact Matrix for Sustainable ConceptGeneration: A Designer’s Perspective,” ASME Conference Proceedings, Vol.2010(44144), pp. 377–383.
[47] Potvin, C., and Roff, D. A., 1993, “Distribution-Free and Robust StatisticalMethods: Viable Alternatives to Parametric Statistics?,” Ecology, 74(6), pp.1997–1998.
[48] Banuelas, R., and Antony, J., 2004, “Modified Analytic Hierarchy Process toIncorporate Uncertainty and Managerial Aspects,” Int. J. Prod. Res., 42(18), pp.3851–3872.
[49] Levary, R. R., and Wan, K., 1998, “A Simulation Approach for HandlingUncertainty in the Analytic Hierarchy Process,” Eur. J. Oper. Res., 106(1), pp.116–122.
[50] Ecoinvent, 2006, “Ecoinvent Life Cycle Inventory Data.[51] Goedkoop, M., Oele, M., de Schryver, A., Vieira, M., 2008, SimaPro Database
Manual Methods Library, PR�e Consultants, The Netherlands.[52] Hesterberg, T., Moore, D. S., Monaghan, S., Clipson, A., and Epstein, R., 2005, Boot-
strap Methods and Permutation Tests, W. H. Freeman and Company, New York.[53] Lilliefors, H. W., 1967, “On the Kolmogorov-Smirnov Test for Normality
With Mean and Variance Unknown,” J. Am. Stat. Assoc., 62(318), pp.399–402.
071002-10 / Vol. 136, JULY 2014 Transactions of the ASME
Downloaded From: http://mechanicaldesign.asmedigitalcollection.asme.org/ on 08/29/2014 Terms of Use: http://asme.org/terms