regions bernstein
TRANSCRIPT
Sanford Bernstein2007 Strategic Decisions Conference
May 30, 2007
FORWARD LOOKING STATEMENTThe information contained in this presentation may include forward looking statements which reflect Regions' current views with respect to future events and financial performance. The Private Securities Litigation Reform Act of 1995 ("the Act") provides a safe-harbor for forward-looking statements which are identified as such and are accompanied by the identification of important factors that could cause actual results to differ materially from the forward-looking statements. For these statements, we, together with our subsidiaries, unless the context implies otherwise, claim the protection afforded by the safe harbor in the Act. Forward-looking statements are not based on historical information, but rather are related to future operations, strategies, financial results, or other developments. Forward-looking statements are based on management's expectations as well as certain assumptions and estimates made by, and information available to, management at the time the statements are made. Those statements are based on general assumptions and are subject to various risks, uncertainties, and other factors that may cause actual results to differ materially from the views, beliefs, and projections expressed in such statements. These risks, uncertainties and other factors include, but are not limited to, those described below:
● Regions' ability to achieve the earnings expectations related to businesses that have been acquired, or that may be acquired in the future, including its merger with AmSouth Bancorporation ("AmSouth"), which in turn depends on a variety of factors, including:○ Regions' ability to achieve the anticipated cost savings and revenue enhancements with respect to the acquired operations, or lower than expected revenues from
continuing operations;○ the assimilation of the acquired operations to Regions' corporate culture, including the ability to instill appropriate credit practices and efficient approaches to the acquired
operations;○ the continued growth of the markets that the acquired entities serve, consistent with recent historical experience;○ difficulties related to the integration of the businesses, including integration of information systems and retention of key personnel.
● Regions' ability to expand into new markets and to maintain profit margins in the face of competitive pressures.● Regions' ability to keep pace with technological changes.● Regions' ability to develop competitive new products and services in a timely manner and the acceptance of such products and services by Regions' customers and potential
customers.● Regions' ability to effectively manage interest rate risk, market risk, credit risk and operational risk.● Regions' ability to manage fluctuations in the value of assets and liabilities and off-balance sheet exposure so as to maintain sufficient capital and liquidity to support Regions'
business.● The cost and other effects of material contingencies, including litigation contingencies.● Further easing of restrictions on participants in the financial services industry, such as banks, securities brokers and dealers, investment companies and finance companies,
may increase competitive pressures.● Possible changes in interest rates may increase funding costs and reduce earning asset yields, thus reducing margins.● Possible changes in general economic and business conditions in the United States in general and in the communities Regions serves in particular may lead to a
deterioration in credit quality, thereby increasing provisioning costs, or a reduced demand for credit, thereby reducing earning assets.● The occurrence of natural disasters or the threat or occurrence of war or acts of terrorism and the existence or exacerbation of general geopolitical instability and uncertainty.● Possible changes in trade, monetary and fiscal policies, laws, and regulations, and other activities of governments, agencies, and similar organizations, including changes in
accounting standards, may have an adverse effect on business.● Possible changes in consumer and business spending and saving habits could affect Regions' ability to increase assets and to attract deposits.
The words "believe," "expect," "anticipate," "project," and similar expressions signify forward looking statements. Readers are cautioned not to place undue reliance on any forward looking statements made by or on behalf of Regions. Any such statement speaks only as of the date the statement was made. Regions undertakes no obligation to update or revise any forward looking statements.
Company ProfileCompany Profile
Integration Update
2007 Initiatives
Financial Performance
Brand Promise
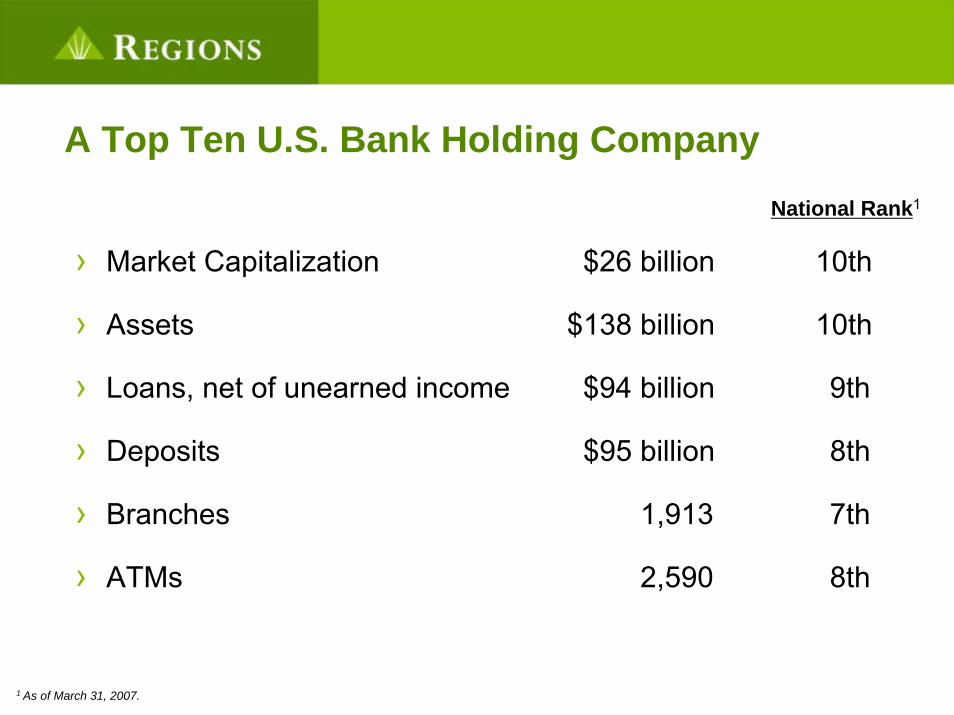
A Top Ten U.S. Bank Holding Company
› Market Capitalization $26 billion 10th
› Assets $138 billion 10th
› Loans, net of unearned income $94 billion 9th
› Deposits $95 billion 8th
› Branches 1,913 7th
› ATMs 2,590 8th
National Rank1
1 As of March 31, 2007.
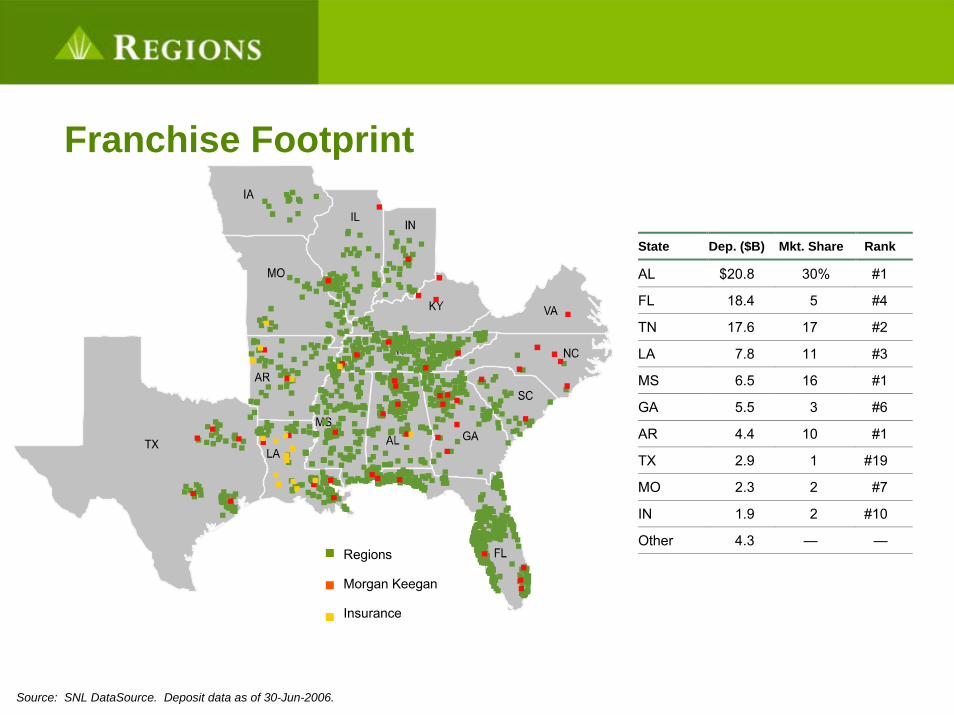
Franchise Footprint
State Dep. ($B) Mkt. Share Rank
Source: SNL DataSource. Deposit data as of 30-Jun-2006.
AL $20.8 30% #1
FL 18.4 5 #4
TN 17.6 17 #2
LA 7.8 11 #3
MS 6.5 16 #1
GA 5.5 3 #6
AR 4.4 10 #1
TX 2.9 1 #19
MO 2.3 2 #7
IN 1.9 2 #10
Other 4.3 — —
Regions
Morgan Keegan
Insurance
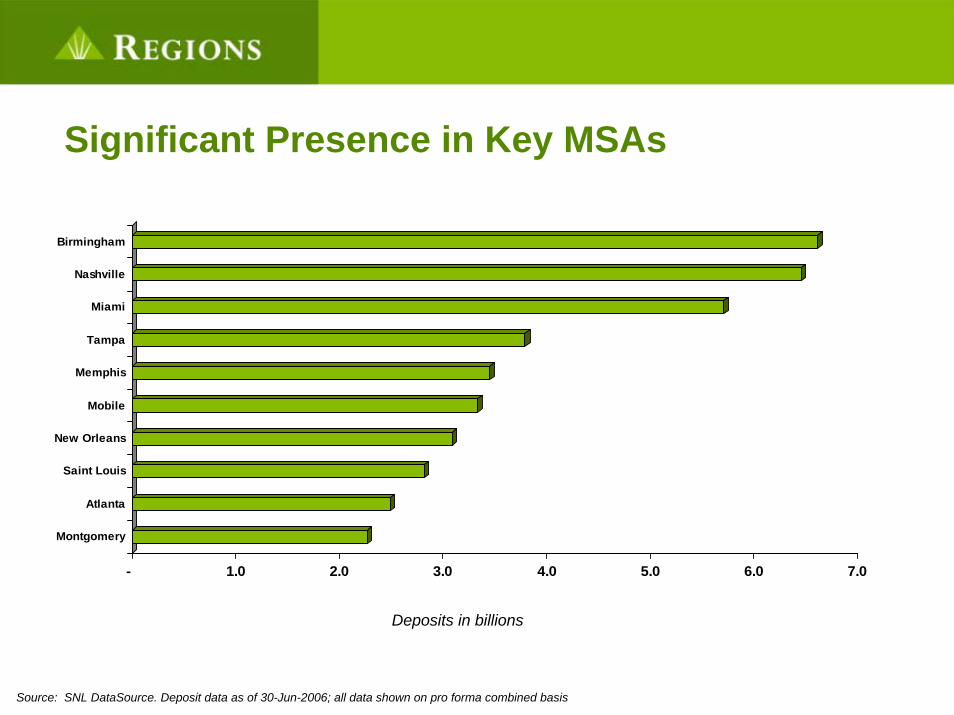
Significant Presence in Key MSAs
- 1.0 2.0 3.0 4.0 5.0 6.0 7.0
Montgomery
Atlanta
Saint Louis
New Orleans
Mobile
Memphis
Tampa
Miami
Nashville
Birmingham
Deposits in billions
Source: SNL DataSource. Deposit data as of 30-Jun-2006; all data shown on pro forma combined basis
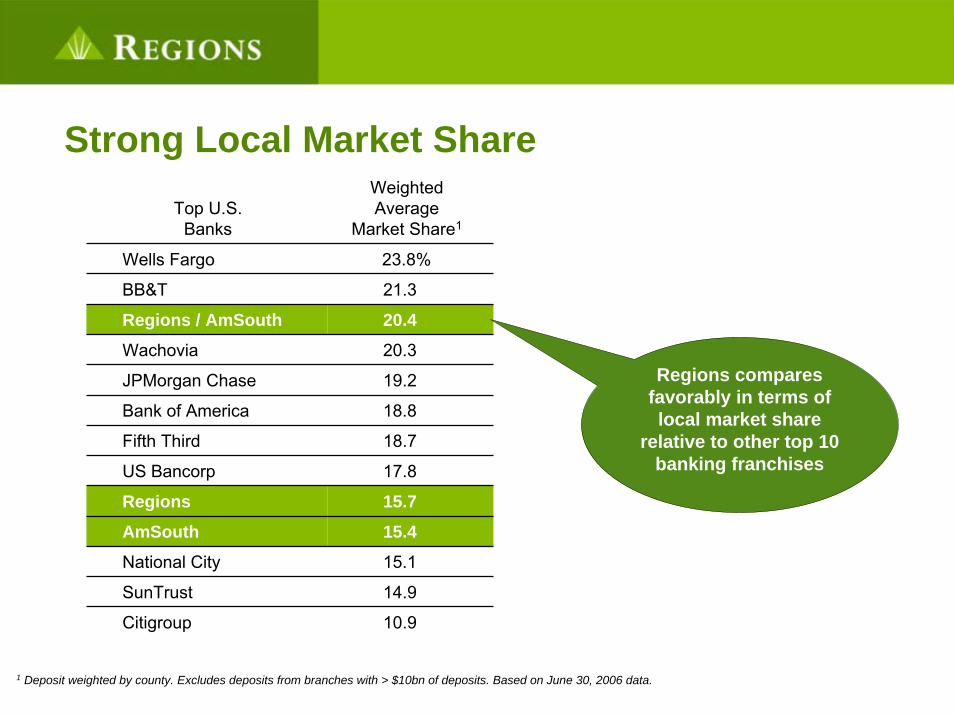
Strong Local Market ShareTop U.S.
Banks
Weighted Average
Market Share1
Wells Fargo 23.8%
BB&T 21.3
Regions / AmSouth 20.4
Wachovia 20.3
JPMorgan Chase 19.2
Bank of America 18.8
Fifth Third 18.7
US Bancorp 17.8
Regions 15.7
AmSouth 15.4
National City 15.1
SunTrust 14.9
Citigroup 10.9
Regions comparesfavorably in terms of local market share
relative to other top 10 banking franchises
1 Deposit weighted by county. Excludes deposits from branches with > $10bn of deposits. Based on June 30, 2006 data.
Company Profile
Integration UpdateIntegration Update
2007 Initiatives
Financial Performance
Brand Promise
Key Integration Accomplishments
› Announced Organizational Decisions
› Identified Major Systems and Started Conversions
› Completed Divestitures
› Began Executing Branch Consolidation Plans
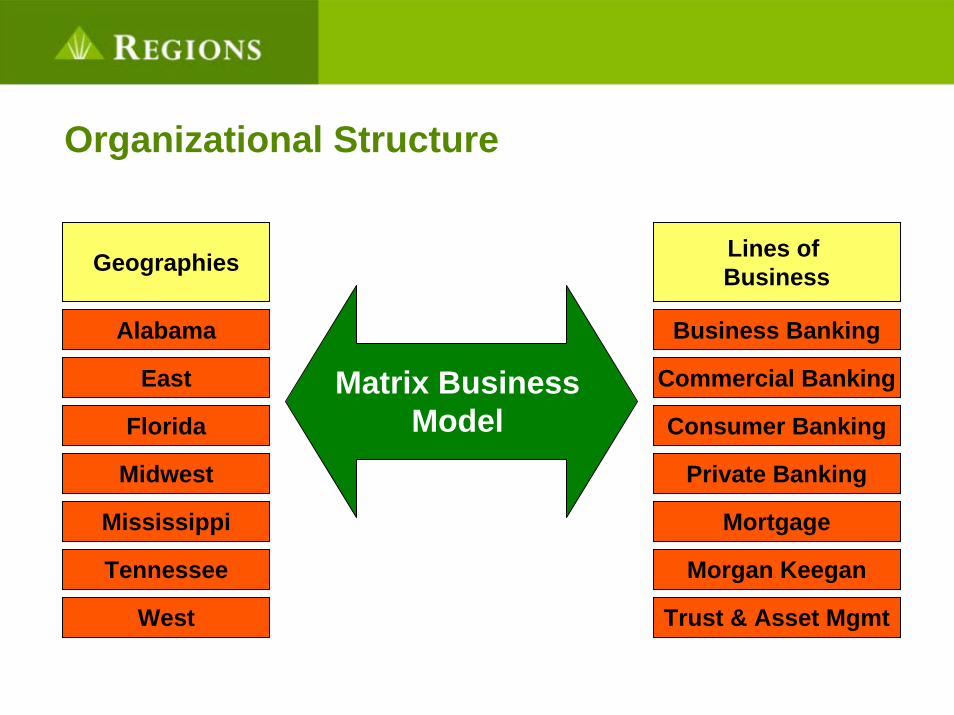
Organizational Structure
Geographies Lines of Business
Alabama
Midwest
East
Florida
West
Tennessee
Mississippi
Morgan Keegan
Matrix Business Model
Private Banking
Trust & Asset Mgmt
Mortgage
Consumer Banking
Commercial Banking
Business Banking
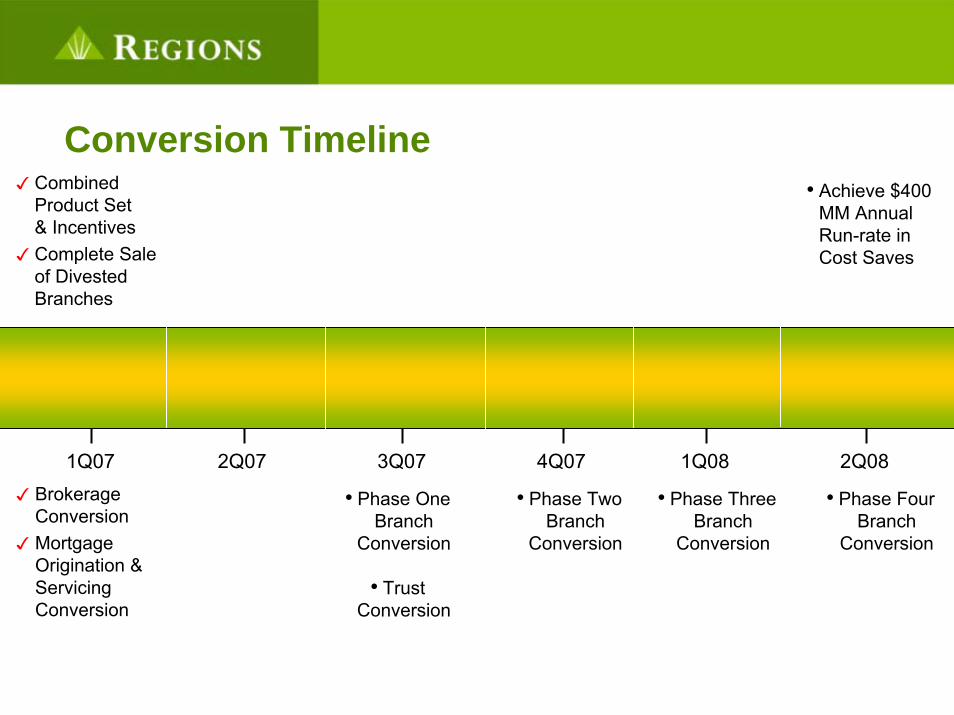
Conversion Timeline✓ Combined
Product Set & Incentives
✓ Complete Sale of Divested Branches
1Q07 2Q07 3Q07 4Q07 1Q08 2Q08✓ Brokerage
Conversion✓ Mortgage
Origination & Servicing Conversion
• Phase One Branch
Conversion
• Trust Conversion
• Phase Three Branch
Conversion
• Phase Four Branch
Conversion
• Achieve $400 MM Annual Run-rate in Cost Saves
• Phase Two Branch
Conversion
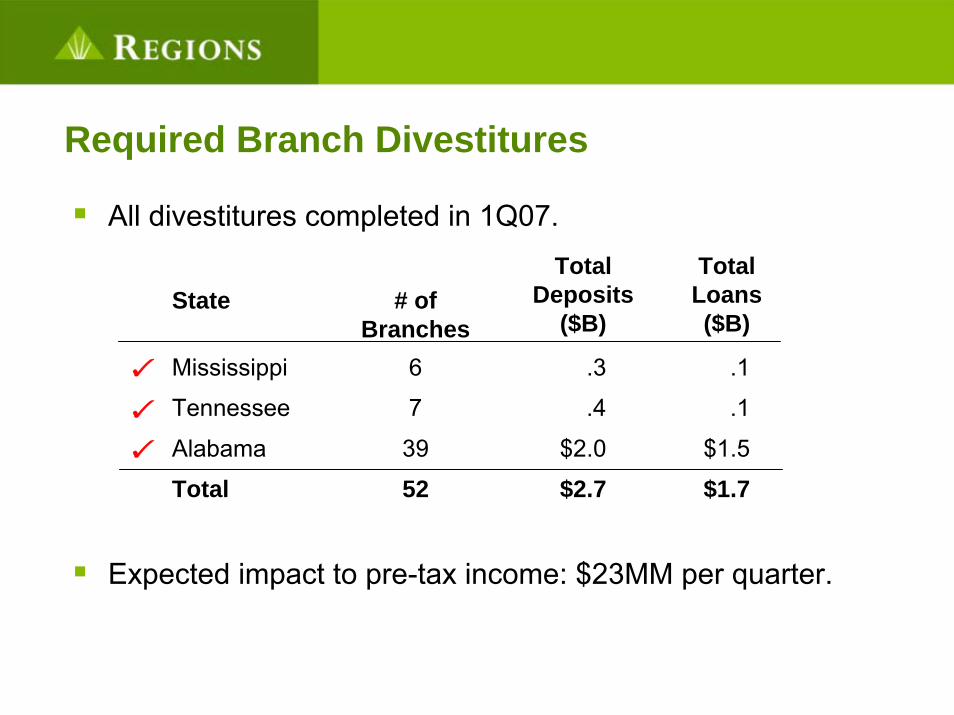
Required Branch Divestitures
All divestitures completed in 1Q07.
Expected impact to pre-tax income: $23MM per quarter.
State # of Branches
Total Deposits
($B)
Total Loans ($B)
Mississippi 6 .3 .1
Tennessee 7 .4 .1
Alabama 39 $2.0 $1.5
Total 52 $2.7 $1.7
✓✓✓
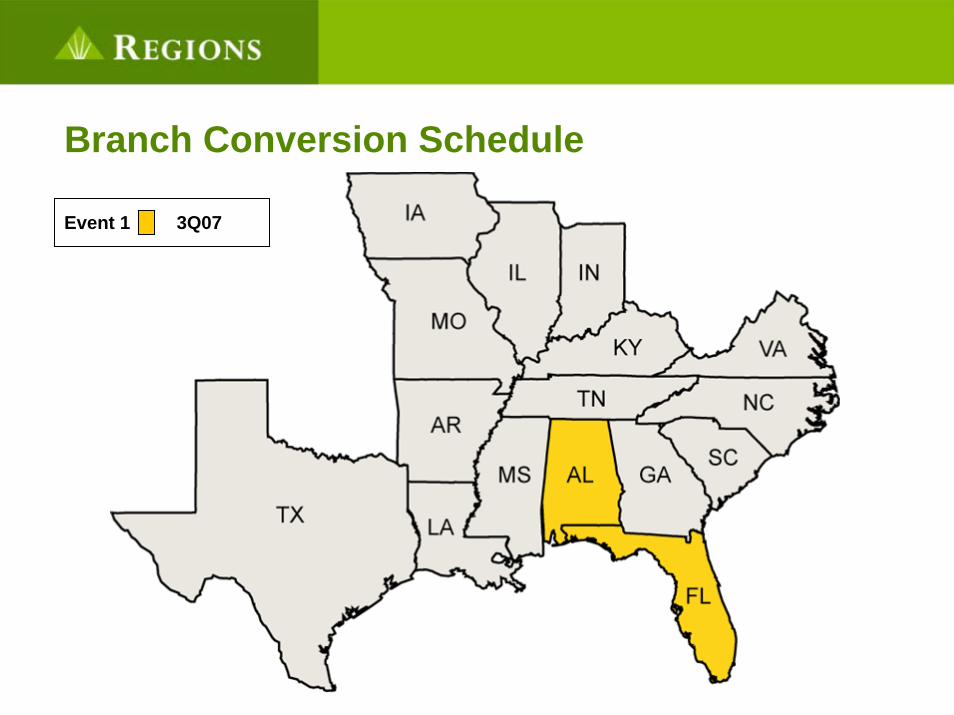
Branch Conversion Schedule
Event 1 3Q07
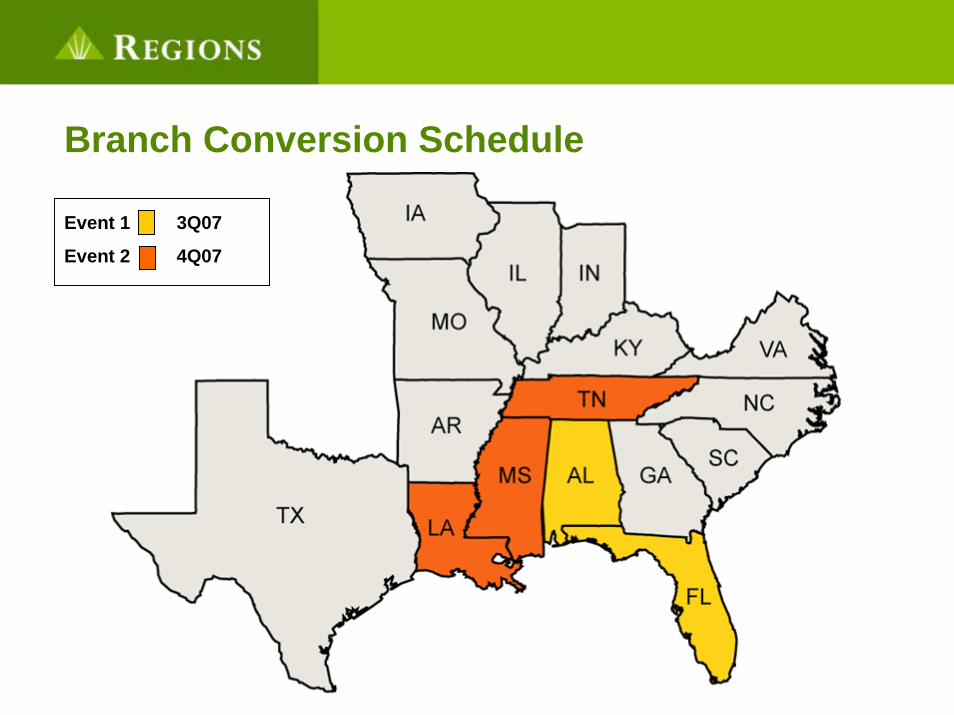
Branch Conversion Schedule
Event 1 3Q07
Event 2 4Q07

Branch Conversion Schedule
Event 1 3Q07
Event 2 4Q07
Event 3 1Q08
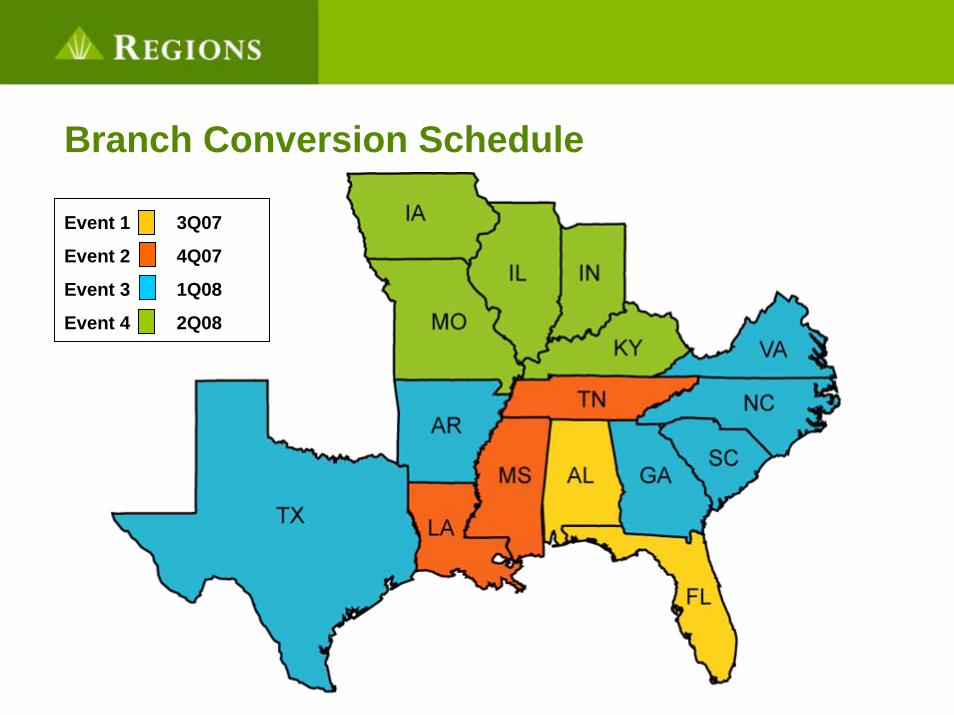
Branch Conversion Schedule
Event 1 3Q07
Event 2 4Q07
Event 3 1Q08
Event 4 2Q08
Measuring the Customer Experience
› Measurement Plans› Gallup Organization, Greenwich Organization
and Customer Surveys
› Trend Identification› Tracking over 100 operational metrics
› Effective Communications› Flashpoint Process
Company Profile
Integration Update
2007 Initiatives2007 Initiatives
Financial Performance
Brand Promise
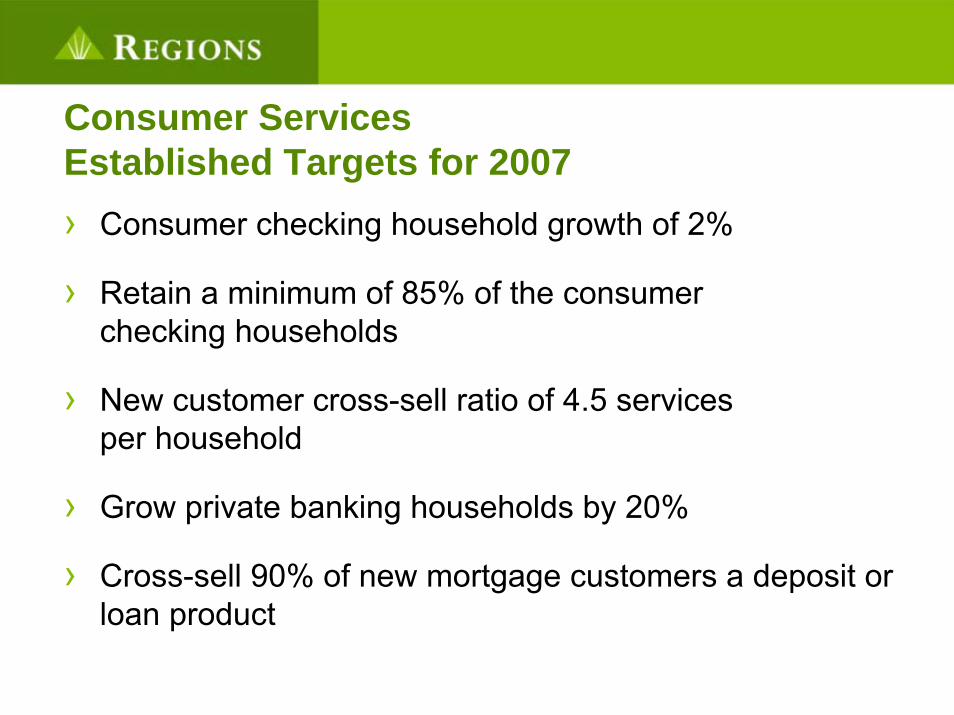
Consumer ServicesEstablished Targets for 2007 › Consumer checking household growth of 2%
› Retain a minimum of 85% of the consumer checking households
› New customer cross-sell ratio of 4.5 services per household
› Grow private banking households by 20%
› Cross-sell 90% of new mortgage customers a deposit or loan product
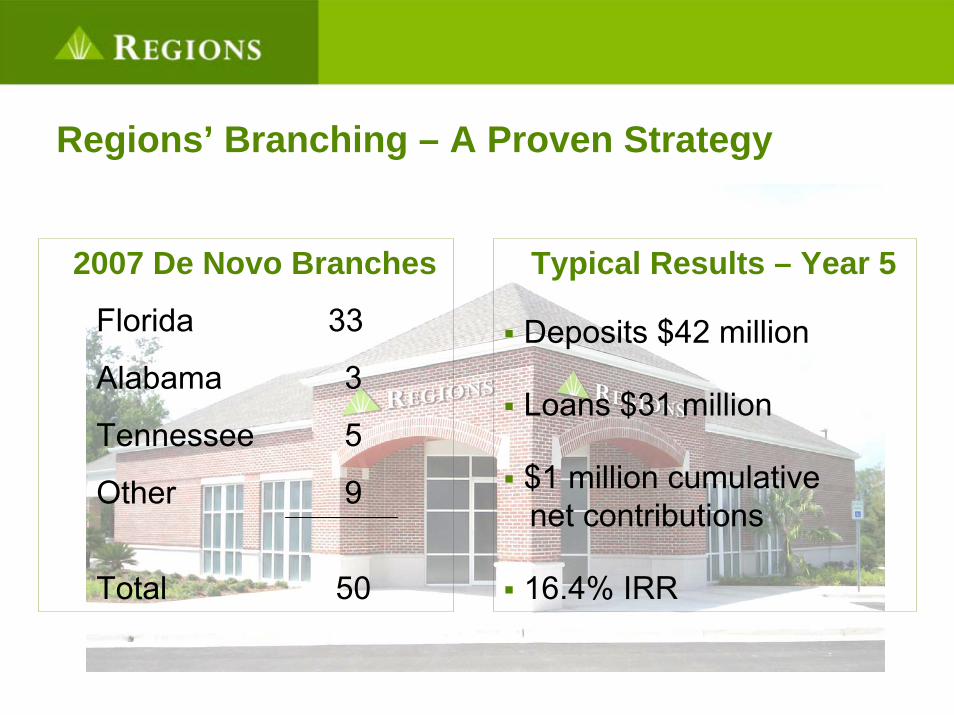
Regions’ Branching – A Proven Strategy
2007 De Novo Branches
Florida 33
Alabama 3
Tennessee 5
Other 9
Total 50
Typical Results – Year 5
Deposits $42 million
Loans $31 million
$1 million cumulative net contributions
16.4% IRR
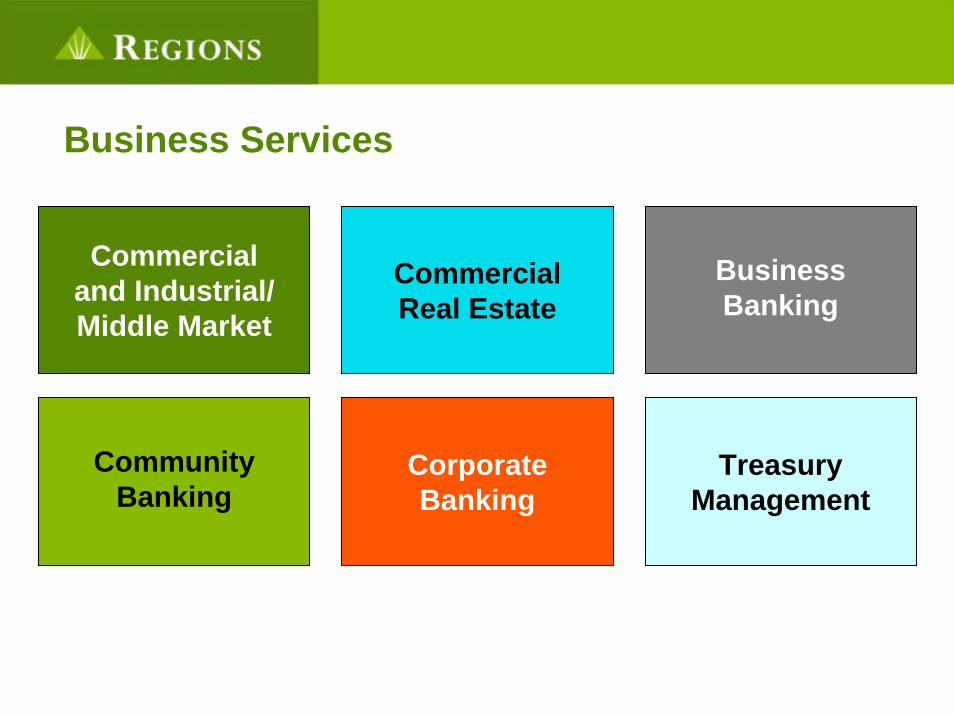
TreasuryManagement
Commercialand Industrial/Middle Market
CommunityBanking
CorporateBanking
CommercialReal Estate
BusinessBanking
Business Services
Summary of Key Initiatives
› Leverage New Capabilities and Credit Limits
› Drive Improvements in Sales Process
› Fully Develop Morgan Keegan Partnership
› Cross-sell
Tools for Driving the Business› Monitoring System – Pipeline, Closed Business and Call
Activity› Relationship Pricing Model/Exception Reporting
› Scorecards
› Enhanced Client Services Capability
› Broadened Marketing Capabilities
› Client Profitability
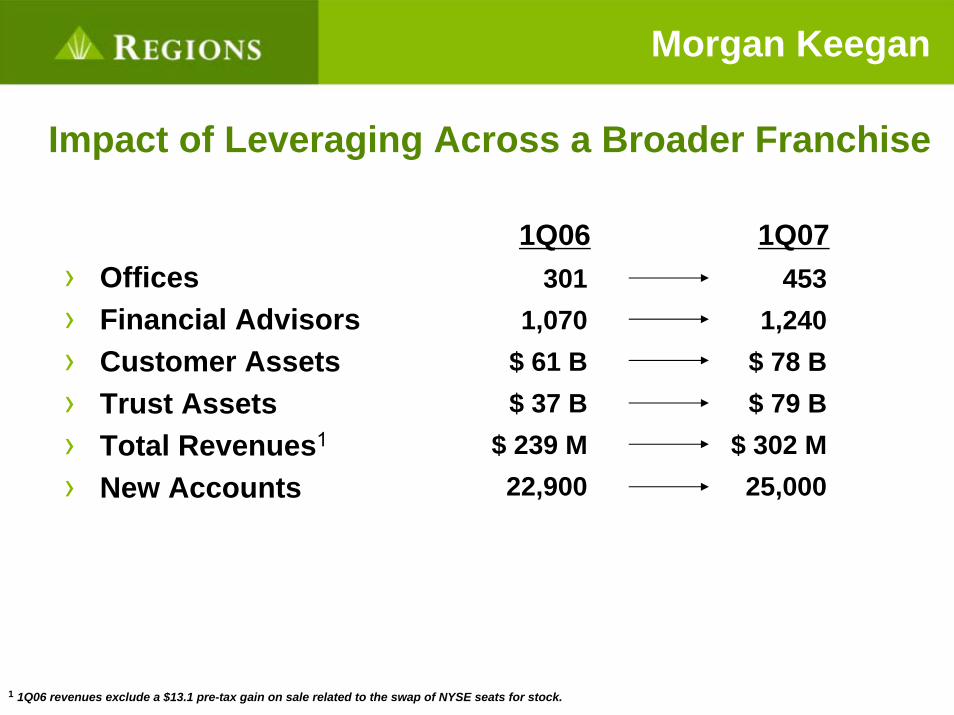
Impact of Leveraging Across a Broader Franchise
› Offices› Financial Advisors› Customer Assets› Trust Assets› Total Revenues1
› New Accounts
1Q071Q06301
1,070$ 61 B$ 37 B
$ 239 M22,900
4531,240
$ 78 B$ 79 B
$ 302 M25,000
1 1Q06 revenues exclude a $13.1 pre-tax gain on sale related to the swap of NYSE seats for stock.
Morgan Keegan
Company Profile
Integration Update
2007 Initiatives
Financial PerformanceFinancial Performance
Brand Promise
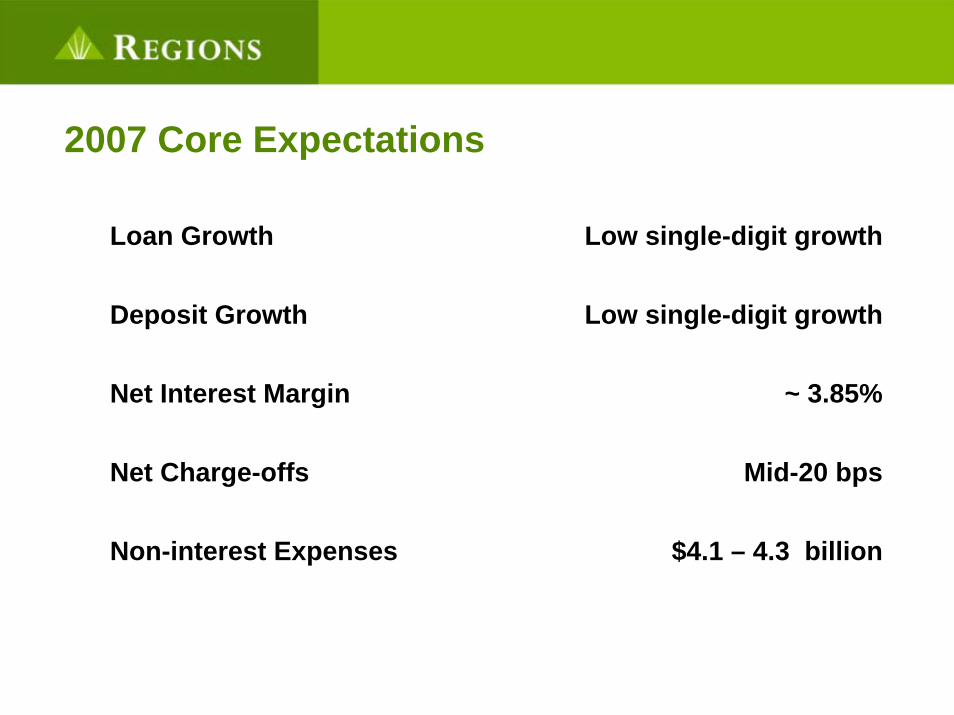
2007 Core Expectations
Loan Growth Low single-digit growth
Deposit Growth Low single-digit growth
Net Interest Margin ~ 3.85%
Net Charge-offs Mid-20 bps
Non-interest Expenses $4.1 – 4.3 billion
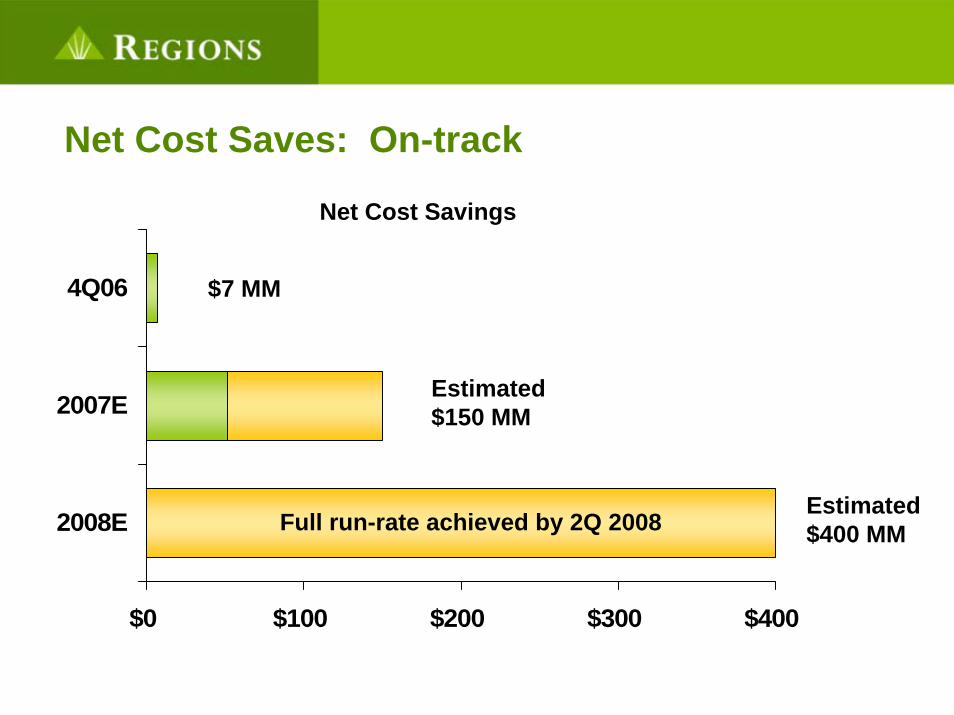
Net Cost Saves: On-track
$0 $100 $200 $300 $400
2008E
2007E
4Q06 $7 MM
Estimated $150 MM
Estimated $400 MM
Net Cost Savings
Full run-rate achieved by 2Q 2008
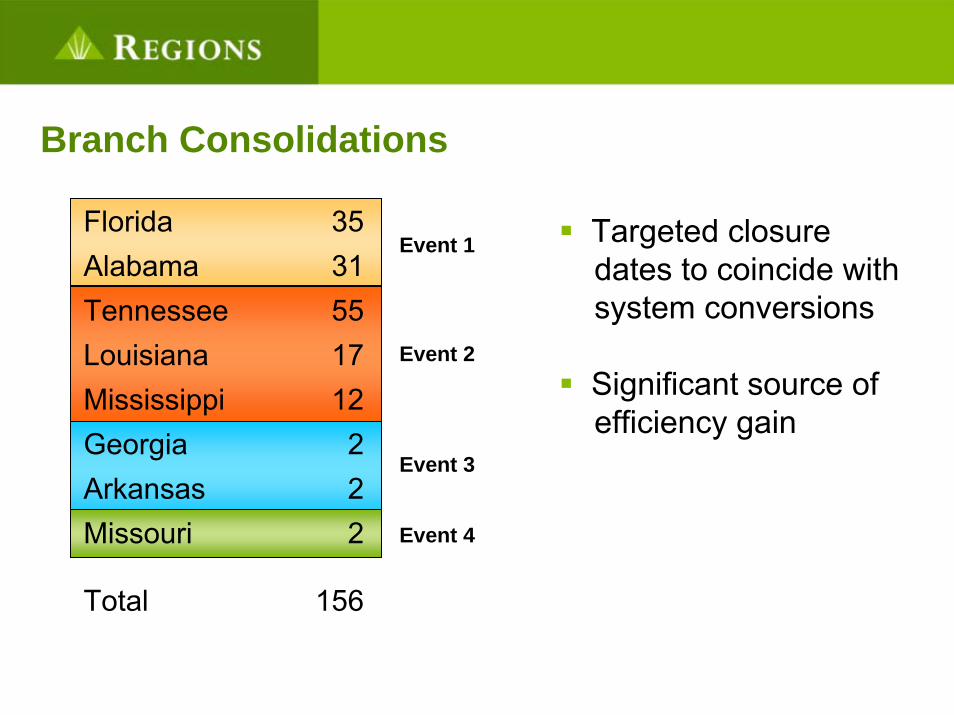
Branch Consolidations
Florida 35Alabama 31Tennessee 55Louisiana 17Mississippi 12Georgia 2Arkansas 2Missouri 2
Total 156
Event 1
Event 2
Event 3
Event 4
Targeted closuredates to coincide withsystem conversions
Significant source of efficiency gain
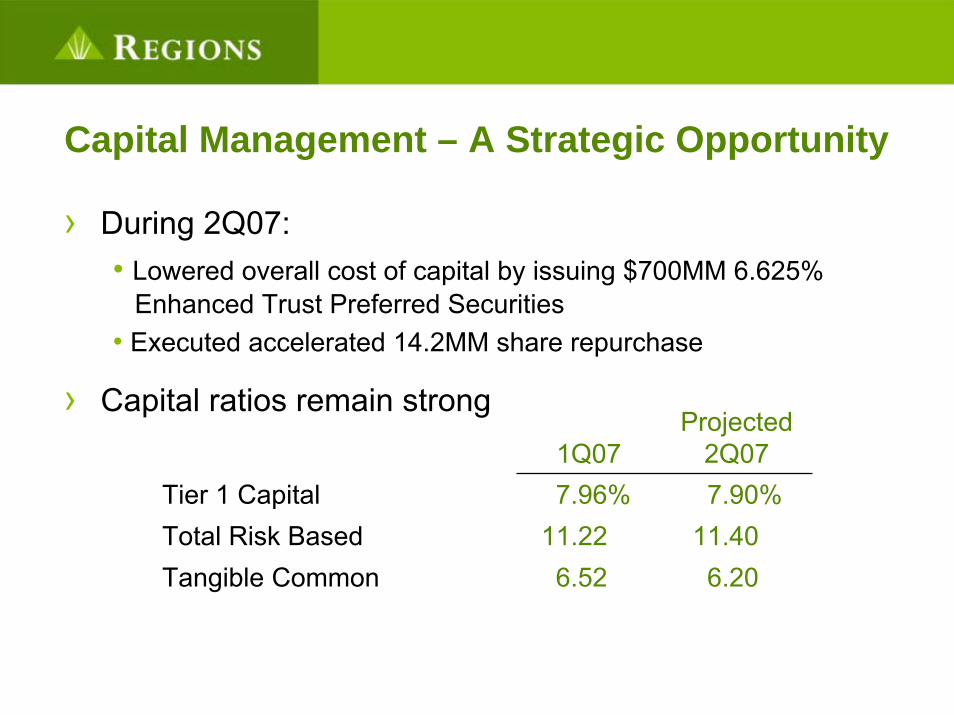
Capital Management – A Strategic Opportunity
› During 2Q07: • Lowered overall cost of capital by issuing $700MM 6.625%
Enhanced Trust Preferred Securities• Executed accelerated 14.2MM share repurchase
› Capital ratios remain strong1Q07
Projected2Q07
Tier 1 Capital 7.96% 7.90%Total Risk Based 11.22 11.40Tangible Common 6.52 6.20
Company Profile
Integration Update
2007 Initiatives
Financial Performance
Brand PromiseBrand Promise
Our Brand Promise to Customers
“You can expect more from Regions. Yes, we are in the business of banking. But we are also in the business of life.
And while our financial solutions will help you get more from your money, it is our mission to help you get more out of life.”