why unemployment remains so high in central and eastern europeed_emp/documents/... ·...
TRANSCRIPT

1
EMPLOYMENT PAPER
2002/43
Why unemployment remains so high
in
Central and Eastern Europe
______________________
Alena Nesporova

2
Employment Sector
INTERNATIONAL LABOUR OFFICE GENEVA

3
Employment Sector This ILO Sector has the responsibility for assisting and advising ILO constituents in analysing national and global employment and labour market developments in order to elaborate and negotiate policies and programmes for employment promotion and human resources development. The Employment Sector encourages them to invest more in training and human resources development for enhanced employability; to implement special employment promotion programmes in situations of high

4
unemployment, particularly in the context of different types of crisis; to promote the creation of quality jobs in enterprises; upgrade the informal sector and promote gender promotion in employment.

5
Preface The centrally planned economies of Central and Eastern Europe started their transition to a
market system with no open unemployment, with the sole exception of Yugoslavia. Due to the
well-known extensive labour hoarding the experts expected a sharp immediate increase in open
unemployment. Nevertheless, they believed that unemployment would have a transient character
and with economic recovery it would soon stabilize at a relatively low level. However, the reality
was different. The reasons why unemployment exceeded the expected levels and remained so high
are reviewed in this paper. It also provides explanation of the significant differences encountered
both between the two major groups of transition countries – Central and South-Eastern Europe and
the Baltic States on the one hand and the CIS countries on the other – and among countries within
these two groups.
The paper wishes to contribute to the debate on possible causal effects of economic and social reforms on the labour markets of the transition countries. On the basis of this analysis it also suggests how to reshape current national economic and social policies to better address employment challenges in these countries. The paper summarizes findings from the research and advisory work on employment and labour market policies in transition countries undertaken within several projects in the Employment Strategy Department. It was originally prepared for the Spring Seminar of the United Nations’ Economic Commission for Europe, held in Geneva on the 6th of May 2002, and its slightly modified version will be published in the Economic Survey of Europe, 2002, No. 2. The purpose of its publication also as an ILO Employment Paper is to make it widely available to the colleagues within the Office and to a wider external audience, in particular in Central and Eastern Europe. Rashid Amjad Director a.i. Employment Strategy Department

6
Contents
1. Introduction 1
2. Key characteristics of labour market developments in transition countries in the 1990s 1
3. Factors contributing to cross-country differences in labour market development of transition countries 13
4. Suggestions for policy improvement 30
5. Conclusions 32
Tables
Table 1: GDP and employment in transition economies 2 Table 2: Participation rates of population aged 15-64, 1990-1999 5
Table 3: Separation rates according to destination of outflows from employment, 1990-2000 6
Table 4: Participation rates according to age group, 1990-1999 7 Table 5: Registered unemployment, 1994, 1998 and 2000 9
Table 6: Total unemployment, 1994, 1998 and 2000 10
Table 7: Youth total (LFS) unemployment rate, 2000 11
Table 8: Self-employment as a share of total employment, 1993 and 2000 19 Table 9: Labour turnover in the 1990s 20
Table 10: Comparison of labour turnover and job turnover, 1994-1997 20
Table 11: Composition of population, aged 15-64, according to education level, 2000 23
Table 12: Unemployment benefit recipients and the replacement rates, 1998 26
Table 13: Expenditure on labour market policy per unemployed person, 1998 27

7
1. Introduction
This report investigates causes for the disappointingly poor employment performance and
persistently high unemployment in the transition countries of Central and Eastern Europe and Central Asia (CEECA). It begins with an overview of labour market developments in these countries, identifying some marked differences between the Central and South East European (CSEE) transition countries (including the Baltic States) and those countries grouped in the Commonwealth of Independent States (CIS). The reasons for these differences lie in the diversity of existing conditions in economies at the outset of transition and the variety of their economic reforms, institutional arrangements and policies. The report explores the effects of macroeconomic policy, modes of privatization, the ability to attract foreign direct investment, the development of small enterprise and the slow progress of institutional reforms. Demographic factors, as well as variations in education, labour market, and social policies, are evaluated from the perspective of their impact on labour supply and its match with demand. The role of labour market regulation, income policy and collective bargaining is also examined. In conclusion, the report signals some necessary improvements in policy to boost poor employment performance and reduce high unemployment in transition countries.
2. Key characteristics of labour market developments in transition countries in the 1990s
2.1 Decline in employment
The labour market situation of the former centrally planned economies of CEECA at the onset of transition was characterized by full employment, no open unemployment (with the exception of the former Yugoslavia) and an excess of labour demand over supply. However, full employment was achieved at the cost of low wages, with a demotivating effect on workers. Widespread overstaffing (labour hoarding) occurred in many sectors and serious distortions in the allocation of labour in industry contributed to low levels of labour productivity. The economic reforms launched in the wake of political changes were directed at reversing these negative characteristics, while social reforms were aimed at making these changes socially acceptable and fiscally affordable. Almost overnight, national economies had been opened to world markets through the introduction of economic measures that also allowed rapid price liberalization, combined with strict macroeconomic stabilization policy. The result was a sharp decline in the economic performance of these countries, much steeper than originally expected. Demand for labour collapsed immediately and, after a short lull, employment also started to decline. Even at this early stage, a significant difference in employment trends had emerged between the transition countries

8
of the CSEE and those of the CIS, with the three Baltic countries moving gradually from the second to the first group.
In the CSEE region the employment fall was already dramatic in the nascent years of economic transition, more or less on the heels of a sharp slump in production (see Table 1).
Table 1: GDP and employment in transition economies: Average annual growth rates, selected years (percentage)
GDP Employment Country
1990-1994 1994-2000 1990-1994 1994-2000
Albania -5.6 6.2 -5.0 -1.4 Armenia -16.2 5.4 -2.2 -2.5 Azerbaijan -17.0 3.7 -0.5 0.3 Belarus -7.8 3.3 -2.3 -0.9 Bulgaria -3.9 -0.6 -5.7 -1.6 Croatia -9.3 4.2 -6.3 0.5 Czech Republic -2.6 1.8 -2.3 -1.0 Estonia -8.8 5.0 -4.3 -2.1 Georgia -27.5 5.2 -10.8 6.9** Hungary -3.3 3.6 -7.2 0.4 Kazakhstan -9.6 0.6 -4.2 -1.0 Kyrgyzstan -14.4 3.6 -1.5 1.2 Latvia -15.9 3.7 -6.3 -0.7 Lithuania 13.4 3.3 -2.5 -0.9 Macedonia -5.5 2.2 -6.0 -3.9 Moldova (Republic of) -20.5 -2.3 -5.1 -1.7 Poland 1.0 5.5 -2.9 0.9 Romania -4.3 -0.2 -2.0 -3.4* Russian Federation -10.3 0.2 -2.3 -1.0 Slovakia -5.2 4.5 -3.8 0.0 Slovenia -1.7 4.3 -4.7 0.4 Tajikistan -20.1 -2.1 -1.1 -1.0 Turkmenistan -9.2 3.9 3.5 2.4 Ukraine -14.1 -3.8 -2.4 -1.3 Uzbekistan -4.9 3.1 1.3 1.2
Yugoslavia -18.0 1.4 -2.8 -1.3 CSEE -3.1 3.2 -4.0 -0.4* Baltic States -13.3 3.8 -4.1 -1.1 CIS -11.1 0.1 -2.3 -1.1**
Source: UN/ECE Common Database, author's calculations * 1994-1999 ** 1994-1998
9
To facilitate cross-country comparisons in this report, the transition decade has been roughly divided into two phases: the 1990-94 period of profound, initial changes driven by major economic and social reforms, in combination with macroeconomic austerity measures and intense external shocks; and the 1995-2000 period of relative economic stabilization. A comparison of production and employment trends reveals that some countries, such as the Czech Republic, Romania, Slovakia and Slovenia, were able to keep employment losses well below those of production, at the cost of further losses in labour productivity. Others, such as Bulgaria, Hungary and Poland, achieved labour productivity increases by sharper cuts in employment.
However, again in contrast with initial assumptions, employment performance did not improve much in some countries that embarked on a relatively high economic growth. On the contrary, in the Czech Republic, Hungary and Poland, for example, employment continued to decline for several years and then stabilized with only a negligible recovery. In those countries directly or indirectly affected by the Balkan conflict, or unable to sustain economic growth due to serious macroeconomic imbalances, employment was declining further (or again). Towards the end of the 1990s, macroeconomic and structural factors had contributed to a new reduction in employment virtually everywhere. Section 3 of this report discusses various reasons for these developments.
In line with employment losses in the formal sector, all transition countries saw rapid growth in informal sector employment. The size of its informal sector tends to correlate negatively with the economic level of a country. One reason for expansion in the informal sector is tax evasion, which has been facilitated by legislative changes lagging behind economic developments and by poor law enforcement. A second factor is the large decline in incomes experienced by a major share of the population in connection with the transition crisis and rising unemployment. Economic recovery and progress in legislative reform in Central Europe have been accompanied by some reduction in informal sector activity. 1 When formal and informal labour inputs are taken together, employment decline has actually been much smaller than official labour statistics indicate.
The CIS countries and initially also the Baltic States faced a slower decline (and some countries even an increase) in employment despite considerable production losses. Later, employment falls continued while those of production slowed down and eventually turned, so that finally the CIS countries also achieved some improvement in labour productivity. However, only very recently have some of these countries enjoyed a slight rise in employment. Moreover, apart from a much larger share of informal labour, compared with the CEECA countries, those in the CIS group also show high underemployment (or hidden unemployment, according to some experts
1 In Poland, a 1998 labour force survey on the “hidden” economy revealed that 4.8 per cent of the population aged 15 and over were engaged in the informal sector, (3.8 per cent in rural areas and 6.4 per cent in urban areas). Unregistered activity was more frequent in the case of men (7 per cent of the male population aged 15 and over) than women (2.7 per cent). Regarding their official labour market status, 5.5 per cent of workers engaged in informal activities were employed, 14.6 per cent were unemployed and 2.4 per cent economically inactive. For 14 per cent of respondents, this was a permanent activity done for 5 months or more, while for 30 per cent it represented only up to 5 days. Compared with the results of a similar survey conducted in 1995, a significant decrease in unregistered labour was observed. The share of persons aged 15 and over engaged in the informal sector dropped by 2.8 percentage points, from 7.6 per cent in 1995 to 4.8 per cent in 1998. This decline is mainly attributable to a general improvement in the labour market during this period, with more job opportunities emerging in the formal economy. Kostrubiec, S., Unregistered employment in Poland in 1998. Central Statistical Office, Warsaw 1999.

10
in the field) manifested in forced administrative leaves, temporary reductions in working hours, and wage payment delays.
2.2 Shrinking participation rates
Employment losses were transformed partly into open unemployment, partly into (formal) economic inactivity. Indeed, according to Table 2, participation rates of the population aged 15-64 considerably declined in all transition countries between 1990 and 1999 (with the striking exception of almost negligible changes in Georgia and Slovenia). A comparison of employment outflow in five Central European transition countries (using labour market flow data from labour force surveys) reveals that outflows to inactivity have generally exceeded outflows to unemployment (see Table 3). This imbalance was marked in the initial period of economic transition, indicating that strong labour market tensions were resolved primarily by pushing certain disadvantaged, less competitive groups of workers out of the labour market – and only secondarily resolved by open unemployment.

11
Table 2: Participation rates of population aged 15 - 64, transition economies, 1990 and 1999 (percentage)
1990 1999 Country Men Women Total Men Women Total
Albania A) 86.4 63.3 75.2 .. .. ..
Armenia A) B) 79.5 69.1 74.1 78.52) 55.62) 66.4 2)
Azerbaijan A) C) 77.8 36.4 66.7 50.13)* 44.23)* 47.1 3) *
Belarus A) C) 82.0 72.6 77.2 45.83)* 46.03)* 45.9 3) *
Bulgaria A) 77.7 72.2 75.0 75.9 64.9 70.2
Croatia A) B) 76.9 56.4 66.6 59.83) 51.43) 55.6 3)
Czech Republic A) B) 82.2 74.1 78.1 80.3 64.4 72.4
Estonia A) B) 83.3 75.9 79.4 78.1 66.4 72.1
Georgia A) B) 80.1 63.5 71.5 78.9 62.5 70.2
Hungary B) D) 74.5 57.3 65.4 67.8 52.3 59.9
Kazakhstan E) 82.01) 69.51) 75.61) .. .. ..
Kyrgyzstan E) 78.21) 65.01) 71.51) .. .. ..
Latvia A) B) 83.6 75.3 79.4 75.3 62.6 68.7
Lithuania A) C) 81.8 70.5 76.0 77.4 68.3 72.7
Macedonia A) B) 77.9 53.1 65.6 72.8 46.5 59.7
Moldova (Rep.) A) 81.5 70.4 75.7 .. .. ..
Poland A) B) 80.1 65.1 72.5 72.8 59.7 66.1
Romania A) B) 76.7 60.5 68.5 76.33) 61.93) 69.03) Russian Fed. A)B) 91.6 71.7 76.5 74.2 63.9 68.9
Slovakia A) B) 82.5 74.2 78.3 76.1 62.6 69.3
Slovenia A) B) 76.7 64.8 70.7 72.2 63.3 68.0
Tajikistan A) C) 77.7 56.2 66.8 32.54)* 28.24)* 30.34) *
Turkmenistan A) 81.0 64.3 72.5 .. .. ..
Ukraine A) B) 79.7 69.8 74.5 71.4 61.8 66.4
Uzbekistan A) 77.9 64.2 71.0 .. .. ..
Yugoslavia A) 77.0 54.9 66.0 .. .. ..
Notes: 1) 1989 2) 1997 3) 1998 4) 1996 * 15+ Sources: A) Economically active population, ILO, Bureau of Statistics (data for 1990) B) Labour force survey C) Official estimates D) Establishment census E) Population census Author's calculations.

12
Table 3: Separation rates according to destination of outflows from employment in selected transition economies, 1990-2000 (percentage)
Country 1990 1991 1992 1993 1994 1995 1996 1997 1998 1999 2000
A/ Employment to unemployment (EU)
Czech Rep. 1.7 1.4 1.2 1.5 1.8 3.0 Estonia 0.7 1.7 4.9 5.4 5.1 4.2 4.8 4.6 6.0
Hungary 4.7 2.8 2.8 2.2 2.2 1.7 1.4 1.2 Poland 7.9 8.4 8.1 6.8 6.2 5.0 5.0
Slovenia 2.3 4.1 3.3 2.3 2.2 2.7 2.4 2.5 2.8 1.8
B/ Employment to inactivity (EI) Czech Rep. 5.3 4.3 5.6 4 3.8 3.7
Estonia 5.6 6.4 10 7.5 6.5 3 5 4 4.6 Hungary 8.0 5.7 6.3 5.1 5.4 4.1 3.2 3.1 Poland 11.4 12.8 11.1 8.4 8.3 7.7 6.8
Slovenia 8.7 8.0 6.5 6.2 5.1 6.9 7.1 5.9 7.1 6.3
Source: Labour force surveys, author’s calculations. See: S. Cazes, A. Nesporova, Towards excessive job insecurity in transition economies? ILO Employment Paper No.23, Geneva, 2001.
This decline is often explained in the literature by more frequent withdrawals of women from the labour market as a result of their deteriorating access to affordable and reliable childcare facilities and the offer of long parental leave (notwithstanding a generally low parental allowance). To this argument is added the allegedly higher labour costs of women, and their family status as second- income earner, both of which might influence their decision to resign from formal gainful activity. However, Table 2 confirms this view for only seven countries (Armenia, Bulgaria, Czech Republic, Estonia, Latvia, Macedonia and Slovakia); in all others, participation rates declined more for men than for women or the decline was similar.
Table 4 compares the participation rates for three age groups: young (15-24), prime-age (25-49) and older (50-64) workers in selected transition economies, with the steepest fall in labour supply in the 15-24 age group. As returns to education have considerably increased in the course of transition, higher education has become more attractive for young people many of whom are extending their studies. A second factor is the increasingly difficult transit from education to work. Employers are unwilling to bear the additional costs of on-the-job training of inexperienced young workers; and here, an insiders’ effect may also play a significant role. In addition, many young people are confronted with lack of demand for their newly gained professional education in consequence of unsatisfactory reforms to national education systems, which lag considerably behind labour market needs and lead to skill mismatches and employers’ complaints of lower quality of education.

13
Table 4: Participation rates according to age group, transition economies, 1990-1999 (percentage)
1990 1999 Age group Age group Country
15-24 25-49 50-64 15-24 25-49 50-64
Albania A) 59.5 87.7 64.4 .. ..
Armenia A) B) 49.7 90.9 61.3 27.32) 85.32) 64.72)
Azerbaijan A) C) 48.8 85.8 56.3 .. … ..
Belarus A) C) 52.4 96.1 60.2 .. … ..
Bulgaria A) 51.9 95.1 55.3 .. … ..
Croatia A) B) 45.8 86.8* 43.5** 40.33) 70.53)* 23.33)**
Czech Republic A) B) 57.7 96.0 55.7 48.7 89.3 59.4
Estonia A) B) 53.0 95.6 68.5 43.5 88.2 62.2
Georgia A) B) 47.3 85.7 65.4 37.2 80.4 75.0
Hungary B) D) 51.5 86.0 36.0 40.7 79.0 37.9
Kazakhstan E) 53.81) 93.91) 55.71) .. … ..
Kyrgyzstan E) 50.51) 92.31) 50.91) .. … ..
Latvia A) B) 56.1 95.1 67.4 41.6 87.0 53.1
Lithuania A) C) 49.5 93.9 61.9 39.8 92.6 59.8
Macedonia A) B) 44.5 81.4 49.5 38.8 76.6 42.1
Moldova (Rep.) A) 53.0 94.9 52.4 .. … ..
Poland A) B) 44.3 87.3 60.6 37.3 85.0 47.8
Romania A) B) 59.8 87.7 42.9 45.83) 84.83) 58.13)
Russian FederationA)B) 52.4 95.2 57.7 41.9 87.7 48.8
Slovakia A) B) 58.8 95.6 55.3 45.6 89.5 45.6
Slovenia A) B) 50.4 93.1 42.0 41.8 91.3 38.2
Tajikistan A) C) 49.1 84.5 53.0 .. … ..
Turkmenistan A) 56.2 88.9 56.1 .. … ..
Ukraine A) B) 51.5 94.7 55.5 42.1 86.0 46.0
Uzbekistan A) 52.5 90.0 51.4 .. … .. Yugoslavia A) 45.1 84.9 46.6 .. … ..
Sources: A) Economically active population, ILO, Bureau of Statistics (data for 1990) B) Labour force survey C) Official estimates D) Establishment census E) Population census Author's calculations Notes: 1) 1989 2) 1997 3) 1998 * 25-54 ** 55-64

14
For older workers, the comparison is somewhat ambiguous. At the start of transition, working pensioners were the first group laid-off everywhere; many countries introduced early retirement schemes to avoid the long-term unemployment of older workers. This approach has recently changed. First, early retirement schemes have been reduced or even discontinued because they too heavily burdened national pension systems that were already in deficit. Second, in order to make pension systems more financially sustainable, the statutory retirement age has been raised in many transition countries. Third, low pension levels force older workers to keep working and accept worse jobs, while an improved labour market situation has also opened job opportunities for less competitive groups of workers. For all these reasons, participation rates for the 50-64 age group tended to recover in the second half of the 1990s – to such an extent that Armenia, the Czech Republic, Hungary, Georgia and Romania have recorded an overall increase over the past decade. Still, in Macedonia, Poland and Ukraine the 50-64 group showed the highest decline in economic activity. In five other countries (Latvia, Lithuania, the Russian Federation, Slovakia and Slovenia), the 50-64 year-olds placed second among the three age groups (see Table 4).
The reasons for these considerable falls in economic activity (even in the prime-age 25-49 group most typically represented in employment) are numerous. They include: voluntary withdrawals (e.g. persons who have been returned their previously nationalized property; or the wives of leading executives and entrepreneurs), semi-voluntary quits (e.g. women on extended maternity or parental leave 2), or forced withdrawals (discouraged workers, including those who opt for social welfare combined with informal work instead of accepting low paid or arduous jobs). 2.3 Unemployment trends
As noted earlier, open unemployment has been the second main destination of workers made redundant or voluntarily quitting jobs and unable to become re-employed. Once again, a major difference in the level and development trends of unemployment is observable between the two groups of transition countries.
In the CSEE countries, unemployment accelerated in the first 2-3 years after the introduction of economic reforms and reached double-digit levels with the exception of the Czech Republic and partly also Romania (Table 5). Economic recovery contributed first to stabilization of the unemployment rate and only later to a certain decline, supported in part by restrictions in national unemployment benefit schemes, which will be discussed further in section 3.11. Slumps in economic performance followed by macroeconomic stabilization programmes, launched with the aim of restoring macroeconomic equilibrium and pushing structural reforms in the enterprise sector in some countries (Bulgaria, Czech Republic, Romania), have again led to a new rise in unemployment since 1997 (or 1998), this time also heavily hitting the Czech Republic. After 1998, structural reforms also accelerated in other CSEE countries (some in connection with the progress in EU accession negotiations), with a similar effect on a rise in unemployment. In those countries directly affected by war or conflict, unemployment levels have risen considerably higher. 2 As parental allowances are low, a large number of these women would prefer to work if they had access to cheap and reliable childcare and could get a well-paid job.

15
Notes: * Jobseekers ** 1999 *** excluding Kosovo and Metohia Source: UNECE Common Database. Economic Survey of Europe, 2001, No. 2, p.167.
For Estonia, Labour Market Board data. Another characteristic of the CSEE group of countries is the excess of registered
unemployment (RU) over unemployment measured by LFS data (compare Table 5 with Table 6). In some countries its extent was very limited and mostly disappeared with cuts in unemployment benefit systems. In others (Croatia or Slovenia) it has persisted, pinpointing a certain misuse of public welfare schemes. This difference is sensitive to changes in incentives for unemployment registration.
Table 5: Registered unemployment (as a percentage of labour force at end of each year), transition economies, 1994, 1998 and 2000
Country 1994 1998 2000
Albania 18.0 17.6 16.9 Armenia 6.0 8.9 10.9 Azerbaijan 0.9 1.4 1.2 Belarus 2.1 2.3 2.1 Bulgaria 12.8 12.2 17.9 Croatia 17.3 18.6 22.6 Czech Republic 3.2 7.5 8.8 Estonia* 5.0 4.5 6.6 Georgia 3.8 4.2 5.6 ** Hungary 10.9 9.1 8.9 Kazakhstan 1.0 3.7 3.7 Kyrgyzstan 0.8 3.1 3.1 Latvia 6.5 9.2 7.8 Lithuania 4.5 6.9 12.6 Macedonia 30.0 41.4 44.9 Moldova (Republic of) 1.0 1.9 1.8 Poland 16.4 10.4 15.1 Russian Federation 2.1 2.7 1.4 Slovakia 14.8 15.6 17.9 Slovenia 14.2 14.6 12.0 Tajikistan 1.8 2.9 3.0 Ukraine 0.3 4.3 4.2 Yugoslavia 14.2 14.6 12 ***

16
Table 6: Total unemployment, selected transition countries, 1994, 1998 and 2000
Country 1994 1998 2000
Armenia A) .. 36.4 3) .. Bulgaria A) 20.2 14.4 3) 18.7
Croatia A) 10.0 1) 11.4 13.5 4)
Czech Republic A) 4.3 7.3 8.8
Estonia A) 7.6 9.9 13.5
Georgia A) .. 14.5 13.8 4)
Hungary A) 10.7 7.8 6.6
Kazakhstan B) 7.5 13.7 ..
Latvia A) 18.9 2) 13.8 14.4
Lithuania A) 16.4 1) 13.3 15.9
Poland A) 14.0 10.5 16.6
Romania B) 8.2 6.3 7.7
Russian Federation A) 8.1 13.3 13.4 4)
Slovakia A) 13.7 12.5 19.1
Slovenia A) 9.0 7.7 7.1 Ukraine A) 5.6 2) 11.3 11.9 4)
Notes: 1) 1996 2) 1995 3) 1997 4) 1999 Source: A) Labour force survey B) Official estimates
The CIS countries have been characterized by a slower but persistent growth in
unemployment, measured by labour force survey (LFS) data and by very low levels of registered unemployment (Tables 5 and 6). The LFS levels are now above 10 per cent and in the conflict countries considerably higher, but they are still relatively low compared with huge production losses. Economic recovery recently achieved by the Russian Federation has led to a decline in open unemployment.
The low and, in a number of CIS countries, decreasing registered unemployment is mainly attributable to the unwillingness of public labour market institutions to provide meaningful assistance to unemployed persons, primarily because of a shortage of funds. Eligibility rules for registration as a jobseeker are set in such a way that many jobseekers do not qualify. Jobs reported to public employment services (PES) are usually of poor quality and unattractive for more competitive jobseekers, who rely on other channels of job-finding. The range of active labour market programmes and the number of jobs on offer are limited. The average level of unemployment benefits is also very low, except for the few who are made formally redundant. Frequent budgetary problems cause benefits to be paid irregularly. In addition, understaffing and low salaries do not motivate PES employees to provide high-quality re-employment assistance to jobseekers.
The larger discrepancy between registered unemployment and LFS data also remains typical for the three Baltic transition countries. In the second half of the 1990s registered

17 unemployment accelerated due to labour market policy changes in eligibility criteria, so that both unemployment indicators have edged closer. Long-term unemployment on the rise Another troubling aspect of unemployment in transition countries is its long-term nature. According to LFS data, the share of long-term unemployment (over one year) in total unemployment in 1999 exceeds 40 per cent in most countries (with the puzzling exception of 22 per cent for Lithuania) and climbs to 68 per cent in Armenia. Recently, more countries have succeeded in some reduction of long-term joblessness, but in the Czech Republic, Estonia and the Russian Federation it has increased considerably (respectively from 31, 33 and 30 per cent in 1995 to 49, 47 and 41 per cent in 2000), indicating the existence of particular groups of unemployed persons with a minimal chance of re-employment. These groups usually combine several disadvantages (low skills, higher age, immobility, health problems, or employer prejudice), making their placement difficult, even after retraining or participation in temporary employment programmes. An improved labour market situation can offer them a better chance of re-employment. Their problems increase with longer unemployment spells and need to be tackled more straightforwardly – a need often impeded by the shortage of public funds. Youth unemployment Young people, in particular school leavers without work experiences, are the group hardest hit by unemployment, despite the sharp decline in their participation rates described in section 2.2. In most transition countries, unemployment rates of youth below 25 are twice as high or even higher than the national average (see Table 7). As a rule, the incidence of unemployment tends to decline with age, reaching the lowest levels for the pre-retirement population. This is related to persisting seniority rules and insiders’ power, especially in large enterprises, and the frequent willingness of older workers to accept worse jobs. It is also partly related to early retirement, pre-retirement arrangements or disability pensions often offered to older workers who are either threatened by redundancy or already jobless.
Table 7: Youth total (LFS) unemployment rate, selected transition economies, 2000 (percentage)
Country Youth unemployment rate
Population aged 15-24 National average rate Population aged 15-64
Bulgaria 9.43 18.7 Czech Republic 17.0 8.8 Estonia 23.7 13.5 Hungary 12.3 6.6 Latvia 21.2 14.4 Lithuania 27.5 15.9 Macedonia 59.9 32.5 Poland 35.7 16.6 Romania 17.8 7.7 Slovakia 36.9 19.1 Slovenia 16.4 7.1
Source: EUROSTAT: Employment and Labour Market in Central European countries. No. 3, Luxembourg, 2001.

18
A gender perspective on unemployment levels For women perceived by employers as less competitive workers due to child-raising or
care responsibilities, the situation is again ambiguous. RU data clearly show higher unemployment levels for women in all transition countries with the exception of Hungary. However, the picture becomes more diverse for LFS unemployment, with rates higher for men than for women in Armenia, Georgia, Hungary, Lithuania, the Russian Federation and Ukraine, while in Bulgaria and Romania the levels are almost the same. This disparity is primarily explained by the higher reliance of women on job-search facilities and income support assistance from the PES. It also reflects higher willingness of women than men to take up low-paid, precarious jobs in the public sector, in unprofitable enterprises or in newly created jobs with small private firms operating mainly in services. Disadvantaged groups Low-skilled workers are also more affected by unemployment. The probability of unemployment incidence declines with the increasing level of education (although in some countries persons with blue-collar vocational training face even harder unemployment problems than unskilled persons 3). People with disabilities or health problems and ethnic minorities perceived by some employers as “unskilled” and “unreliable” workers (e.g. Roma) have an extremely high incidence of unemployment, “solved” by many through inactivity. Regional disparities in unemployment
Apart from high aggregate unemployment, the transition countries suffer from large regional disparities in unemployment, increasing from county to district level and from district to community level. This springs from the past legacy of a high concentration of production in large enterprises, often the main job providers for an entire region. When these enterprises collapse, regional unemployment climbs. A second factor is the low mobility of the population, which paradoxically has further declined in the course of transition. Given that attachment to domicile and localized social network is a characteristic for Europe overall, the even lower mobility in transition countries has been compounded by the privatization of state-owned or cooperative houses and flats. Home ownership has strengthened ties to locality. In addition, public transport fares have increased considerably and many transport connections discontinued after public or enterprise subsidies were withdrawn. Petrol prices have also risen: even if they own a car, many people cannot afford to commute for work to other localities. At the current low level of wages, many who previously commuted have ceased.
The costs of housing also differ considerably by region and have become prohibitive for less competitive workers, who are obliged to stay put in regions with high unemployment, while competitive workers have access to jobs anywhere. Gradually, the quality of labour supply in depressed regions deteriorates further. This severely limits the prospects for improving regional disparities in unemployment, unless the situation is corrected by a carefully designed regional policy targeting both the supply and demand sides of the labour market.
3 The previous narrow specialization of blue-collar vocational professions often makes transfer to other industries (or agriculture) problematic, especially to industries already undergoing transition shrinkage. Higher age groups, with less access (and often less willingness) to retrain, are most affected.

19
The above analysis of the trends and structure of unemployment shows that, in the process of transformation, the character of unemployment has changed. In the initial period, unemployment was clearly transitional in character, mainly influenced by the extraordinary depth of the transition crisis and the extent of accumulated labour hoarding. However, it was soon transformed into structural unemployment, as reflected in very high long-term unemployment and the wide regional disparities in employability triggered by lack of skills, immobility or inflexibility – even when the economy recovered (although labour demand still remained rather weak).
In the CSEE countries, the level of frictional unemployment is relatively modest due, among other reasons, to well-developed information channels, including the public employment services, which function more effectively than their counterparts in CIS countries. Cyclical unemployment is also present in periods of economic downturns but is less relevant. Understanding the nature of unemployment is very important for the adequate formulation of labour market policies. Unfortunately, this has not often been the case during the past decade.
In addition to the characteristics and developments addressed above, Section 3 explores other pertinent factors affecting cross-country differences in labour market performance of the CSEE and the CIS transition economies.
3. Factors contributing to cross-country differences in labour market development of transition countries
3.1 Economic and social conditions on the starting line of transition
From the outset of their political, economic and social transformation, considerable differences existed among the transition economies that were disregarded until recently by many Western scholars. First, the CSEE countries were able to benefit from their past experience and more frequent trade contacts with world markets. The shift from Eastern to Western markets was easier and less painful for domestic enterprises in these countries. In contrast, the shift for non-Russian CIS countries was extremely difficult because, in the framework of the USSR, the limited foreign trade that existed had been exclusively controlled by Moscow. Territorial proximity also played a leading role in finding new external markets for domestic products, helping to preserve more jobs and promising new job openings after economic recovery.
Second, a number of CSEE countries retained a limited private sector (almost exclusively in the form of self-employment) under the previous regime. For example, in 1989 the share of self-employment was 8.5 per cent in Hungary, 26.9 percent in Romania and 25.7 per cent in Poland, compared with 1 per cent in the former Czechoslovakia in 1989.4 Clearly, the CSEE countries were benefiting from their pre-communist industrial and entrepreneurial tradition, a past that was much more remote for the CIS countries. This advantage reduced risk-aversion in many potential CSEE ent repreneurs who wished to tap into newly emerging market opportunities and stimulated job creation in newly established firms.
4 European Commission, Directorate-General for Employment, Industrial Relations and Social Affairs: Employment Observatory: Central and Eastern Europe, No. 1,author’s calculations.

20
Third, the countries differed in their inherited external and internal imbalances. Heavily indebted countries, such as Hungary and Poland, had to spend a larger share of public finance on debt servicing, which constrained their economic and social intervention, compared with low indebted countries such as the former Czechoslovakia or Bulgaria. As the Russian Federation took over almost the entire USSR’s external debt, the majority of other ex-Soviet countries started their transition without any external debt. The varying levels of suppressed inflation (low in Hungary and Czechoslovakia and high, in particular, in the CIS countries and Bulgaria), and the distortions in relative prices (Hungary was an early starter in correcting for price distortions) were immediately reflected in the scale of price increases after price liberalization and were later responsible for the depth of the transition crisis and a decline in labour demand.
Fourth, variations in the age structure and the quality of labour supply were also telling. Compared with non-transition countries at a similar economic level, the average educational level of the labour force was high. Nevertheless, significant differences also existed. These included higher shares of workers with primary or lower education in non-Central European countries compared with Central European ones; a very strong secondary education (especially technical) in the Czech Republic, for example, and different proportions of tertiary education in various transition countries. These differences denoted the capacity and speed of countries to adjust production to changing market demands, to attract foreign investors and to upgrade workforce skills to new labour market needs.
3.2 The role of economic policy
All the transition countries embarked on the same three postulates advised by the Washington consensus (privatization, price and trade liberalization and macroeconomic stabilization) but varied widely in their pace, extent and modes of implementation. For example, Poland was very fast in almost complete liberalization of prices combined with currency devaluation and strict macroeconomic austerity measures (only gradually relaxed after 1991), but slow in privatization and structural reforms of certain sectors (agriculture, coal mining, steel). This stance helped Poland to overcome the transition crisis speedily and embark on high economic growth – but created increasing structural problems and economic imbalances. These were tackled by a tight monetary policy and acceleration of structural changes after 1998. At the same time Poland introduced four major reforms (to the pension system, the territorial-administrative system, in health care and in education). The coincidence of the strict monetary policy large-scale structural changes and major social reforms with many initial problems and deficiencies, coupled also with negative external shocks, have resulted in significant economic slowdown and escalating unemployment.
Hungary benefited from its advance position in price and trade liberalization and concentrated mainly on restructuring and privatization of enterprises, relying mainly on direct sales. It also encouraged foreign direct investment through economic incentives. Nevertheless, the loose monetary and fiscal policy accelerated macroeconomic imbalances, which necessitated a strict stabilization policy package in 1995. A serious economic slowdown ensued, with further cuts in labour demand. Proactive economic policy launched after 1997 clearly stimulated rapid economic recovery, eventually leading to limited employment growth and reduced unemployment.
In contrast, the Czech Republic opted for almost complete price and foreign trade liberalization and steep devaluation of its currency, while relying on voucher privatization and the
21 restructuring of those enterprises with strong ties to domestic state-owned banks. This policy, initially successful in promoting structural changes in the economy at a relatively low social cost, gradually led to increasing macroeconomic imbalances, the heavy indebtedness of many enterprises and a virtual collapse of the banking sector. An austerity policy package introduced in 1997 resulted in economic recession, escalating layoffs and open unemployment. Recovery was achieved only in 2000.
These three examples of Central European countries, considered (along with Slovenia, Slovakia and Estonia) as the most advanced in economic transition, illustrate the prominent role that economic policy plays on the structure and level of labour demand and hence on employment and unemployment. Since each country implemented its own approach, intrinsically dependent on its prevailing political climate and conditions, it is difficult to make any valid generalizations. The commitment of national governments to economic reform and sound economic policies has exerted a strong influence on subsequent economic and labour market developments in some countries. However, in those countries with adverse starting conditions (the weight of their communist past, isolation from foreign markets, greater economic imbalances), it was far harder to maintain the pace of reform – unless, like Estonia, they were able to benefit from their small size, a favourable popular mentality and strong external assistance.
For most countries, the severe social consequences for the population, coupled with an understandable ignorance of the sum effects of certain systemic and policy changes and, often, cronyism, led to many inconsistencies in the reform process. In turn, this contributed to intensifying negative outcomes and the postponement of economic and labour market recovery. One concrete example of reform inconsistency is the oft-cited delay in institutional reforms in CIS countries. This slow progress impeded enterprise restructuring, further weakened the banking system, undermined economic growth and eventually led to mounting internal and external instability and economic crisis.
The combination of a country’s starting conditions, and other internal factors (the speed and consistency of economic reforms, orientation of economic policy vis-à-vis economic growth promotion, and the proximity to new solvent markets) combined with external factors, such as the impact of war or conflict and recession in their main trading partners are responsible for most differences in the economic performance of transition countries. As clearly reflected in varying labour market developments, the Central European countries – Poland, the Czech Republic, Hungary, Slovakia and Slovenia – were more successful in returning their economies to growth fairly quickly, followed by Croatia, Estonia, Latvia and Lithuania. Romania and Bulgaria were able to catch up only later. Most recently, the CIS countries have finally returned to economic growth albeit from rather low levels. Nevertheless, so far only four countries, with Poland in first place, recently followed by Slovenia, Slovakia and Hungary, have been able to exceed their pre-transition levels.
Four factors are highlighted below for their substantial influence on employment development in the first decade of transition to a market system: the privatization of state-owned enterprises; foreign direct investment; new enterprise development; and legal and institutional reforms. A special section (3.6) gives an insight into and compares the outcomes of structural changes initiated by mass privatization, foreign direct investment and small enterprise development
22
3.3 Privatization of state-owned enterprises
At the outbreak of economic reforms, rapid privatization of large state-owned enterprises was considered the only remedy for ineffective allocation and utilization of resources in the transition economies. Still, wide differences are observed among countries, both in the speed – fast or slow – and methods of large-scale privatization. For example, count ries such as Estonia and Hungary relied primarily on the direct sale of large and medium-sized companies to foreign investors, which were relatively transparent and generated considerable revenues for their state budgets. Insider buyouts by employees and managers were the second (but much less used) method of privatization and concerned only smaller and less important firms. Although direct sales of companies were originally considered as very slow, they turned out to be the most successful route to privatisation. Besides generating income for the State they also brought additional capital for investment to these companies and ensured their longer-term prosperity. Fast privatization
The Czech Republic, Slovakia (in the first round of privatization) and Lithuania opted for mass privatization through distribution of vouchers to the populace. While this approach was seen as very rapid and fair, it produced an extreme dispersion of shares’ ownership with little control over enterprise managements. It generated neither revenue for the State nor new capital for enterprise development. In order to cope with the need to innovate production and upgrade technologies, enterprise managements turned to the state banks for investment credits. In many enterprises, managements were also interested in buying out the remaining shares owned by the State or the shares managed by investment funds (where small private shareholders placed their shares for management) and took credits from the banks for these sales. However, enterprise profits were too low to allow proper loan servicing and most bank credits became non-performing. They were heavily burdening the portfolios of state banks and bringing the enterprises – many with viable production programmes – to financial collapse. Managers opted for rent-seeking and transfer of assets to their own firms, thereby depriving enterprises of scarce financial resources and accelerating their collapse. In addition, the poor protection of small shareholders meant that the benefits ultimately accrued from voucher privatization were very limited. The CIS countries, in particular the Russian Federation and Ukraine, used subsidized management-employee buyouts of firms as their main method of mass privatization. This route to privatization was also very fast. But it generated little revenue for the State, no new investment capital for enterprise and led to corporate governance no more efficient than its ex-Soviet counterpart. Compared with the previous group of countries, the only difference was the greater influence of employees on hiring and firing within the enterprise. This achieved a much higher level of labour hoarding and employment than was the case for enterprises with similar economic performance in other countries. Enterprise managements engaged in asset-stripping and the exclusion of other owners (primarily workers) while foreign investors were not interested in injecting capital into enterprises with non-transparent ownership. Slow privatization In contrast, Poland, Slovenia, Bulgaria and Romania were slow privatizers of their large state enterprises. Slovenia and to a large extent Poland succeeded in commercializing and restructuring these enterprises and putting them under hard budget constraints. Bulgaria and Romania continued to subsidize them (Bulgaria had to stop this practice with the introduction of
23 the currency board in 1998). The efforts of Slovenia and Poland led to substantial amelioration of enterprise corporate governance, resulting in improvements in enterprise performance but at the cost of massive job destruction and reduction of overstaffing. Of particular consequence is the privatization of the ailing banking sector, heavily undercapitalized and burdened by non-performing loans to state enterprises. The collapse of the banking sector was behind the economic crisis in Bulgaria in 1996 and also the Russian financial crisis in 1998 (although in both cases the fundamental causes were structural and institutional, as explained below). Capital flight through the banking sector was huge in the region and subsidization of state or semi-state banks was extremely expensive for the state budget (it cost the Czech budget, for example, several hundred billion koruna 5). The entry of foreign banks into domestic banks has been indispensable for strengthening their capacity to provide credit to enterprises and for improving their governance, while many newly established small banks have collapsed. 3.4 Foreign direct investment
The transition economies differ widely in the total amount of foreign direct investment (FDI) they attracted. To date, Poland has received the highest amount of FDI in the region (on a cash basis, US$ 28.5 billion in 1990-2000).6 However, in terms of a cumulative inflow of FDI per capita over the same period, the first places were held by the Czech Republic (US$ 2,200) and Hungary (US$ 2,100), followed by Estonia (US$ 1,680), Croatia (US$ 1,055), Latvia, Slovenia, Slovakia, Poland and other countries. While until 1997 only Hungary could boast a significant inflow of FDI per capita, since 1998 the largest recipients of FDI have become the Czech Republic and Poland. This is connected with the accelerated privatization of state-owned infrastructure companies and state banks; considerable FDI also goes into greenfield investment. The effect of FDI on job creation and job preservation both by foreign-owned enterprises and their domestic suppliers and collaborators is indisputable. Although the entry of FDI has also led to job destruction – through cuts in labour hoarding, the exclusion of less profitable domestic competitors or the replacement of less competitive domestic suppliers by imports from abroad. The level of FDI a country attracts depends on several factors: its political and economic stability; progress in EU accession negotiations; proximity to the parent company abroad; incentives for foreign investors; market prospects; and the expected profitability of the investment project, including the access to cheap and skilled labour. Obviously, the Central European accession countries are much better off than the rest of the region and they benefit considerably in terms of new job creation or preservation of exis ting jobs. 3.5 Small enterprise development
The small-enterprise sector has been identified as the main new job generator for transition economies. It has developed partly in the process of restructuring large enterprises, when a number of ancillary production and services were externalized, usually resulting in a productivity
5 US$1 = CZK 36.2 at 2002 exchange rates.
6 This and the following figures are taken from the Economic Survey of Europe 2001, No. 2, UNECE, Geneva 2001, Table B17.

24
increase both in the original enterprise and in the new unit. Many new firms also emerged as a consequence of newly opening market opportunities, creating jobs not only for their owners but also for wage-workers. At the same time a number of own-account workers were pushed into independent activity by the impossibility of finding decent work. A large share of such own-account activities has remained hidden in the informal sector, which expanded in particular in the initial transition years but later declined at least in Central Europe as mentioned earlier. The reasons for developing own-account activities vary, as does the quality of newly created jobs in small enterprises, ranging from highly qualified and lucrative jobs to those at (barely) subsistence level (usually in farming and services). Employers also often push workers to accept own-account status, particularly in the small firms economizing on social contributions. Most transition countries have introduced programmes promoting small enterprise development. Their success has also varied, depending on the overall business environment, which is more favourable in Central Europe, but much less so in South Eastern Europe and the CIS. Accordingly, a strong correlation can be demonstrated between the share of self-employed workers (see Table 8 and compare its data with those in Table 1), a country’s economic performance and its labour market situation, which again differentiates Central Europe from South Eastern Europe and the CIS.7 Also, a considerable gender gap in self-employment in all the transition countries but Ukraine should be mentioned here as well as its further increase in most countries between 1993 and 2000.
7 The remarkably high levels of self-employment in Poland and Romania are due largely to agriculture, based mainly on small, family farms.

25
Table 8: Self-employment as a share of total employment, selected transition economies, 1993 and 2000 (percentage)
1993 2000 Country Men Women Total Men women Total
Bulgaria 12.9 9.2 11.2 18.3 10.6 14.7
Croatia 25.11) 15.41) 20.7 1) 23.37) 14.47) 19.27)
Czech Republic 15.8 9.4 12.8 18.8 9.0 14.5
Estonia 10.4 6.2 8.4 9.7 6.4 8.1
Hungary 17.4 11.3 14.6 18.7 9.6 14.6
Kazakhstan 0.13) 0.23) 0.13) … … …
Latvia 12.42) 6.92) 9.82) 12.5 8.4 10.5
Lithuania 21.54) 14.64) 18.34) 19.2 12.7 15.9
Macedonia 74.05) 68.55) 71.85) … … …
Poland 32.2 29.9 31.2 25.9 18.4 22.5 Romania 24.4 19.4 22.1 32.6 17.4 25.4
Russian Federation 10.16) 5.66) 8.06) 8.4 6.2 7.4
Slovakia 9.0 3.5 6.6 10.9 4.1 7.8
Slovenia 16.0 7.6 12.2 15.3 6.5 11.2 Ukraine … … … 8.37) 9.07) 8.67)
Notes: 1) 1996 2) 1995 3) 1989 4) 1997 5) 1991 6) 1994 7) 1999 Sources: Labour force surveys; author's calculations
3.6 Comparing labour turnover and job turnover
Economic and social reforms have led to a substantial increase in labour market flows. Labour turnover (see Table 9) reflects the speed of reallocation of labour in the economy, which may result from the dynamics of job creation and job destruction, as well as from moves of employed persons among existing jobs and moves from unemployment and inactivity to employment in a given set of jobs and vice versa.8 Thus, in theory, structural changes relate only to the process of job creation and job destruction while labour turnover in excess of job turnover, sometimes called “labour churning”, points to labour mobility connected with other, non-structural reasons. Given the significant differences in transition economies regarding the extent and speed of restructuring and privatization of large state enterprises, the inflow of FDI, and small enterprise development, it is interesting to look first at their labour turnover trends and, second, compare how important the structural component has been in total labour reallocation (Table 10).
8 For detailed notes on this database, as well as a discussion of labour turnover, accession and separation rates by country and in cross-country comparison, see S. Cazes, A. Nesporova, Towards excessive job insecurity in transition economies? ILO Employment Paper 2001/23.

26
Table 9: Labour turnover for selected transition economies in the 1990s (percentage)
Country Labour turnover Source 1990 1991 1992 1993 1994 1995 1996 1997 1998 1999 2000
Poland ES 35.2 42.9 40.3 41.6 41.7 45.2 47.3 37.1 47.4 Poland LFS 35.7 44.1 54.2 47.1 53.4 40.1 38.2 Slovenia ES 27.1 34.2 31.6 32.2 32.0 31.4 31.2 29.3 28.8 31.1 30.1 Ukraine ES 38.8 37.6 35.3 35.2 37.4 Russian Fed. ES 49.8 46.2 48.2 48.3 42.8 44.4 45.9 48.7 Bulgaria ES 48.9 50.9 43.7 45.0 43.9 43.4 46.1 59.3 55.8 67.5 Estonia LFS 30.8 38.4 54.4 55.6 55.3 31.0 42.9 36.2 35.0 Czech Republic LFS 44.5 36.1 30.3 24.8 24.7 22.3
Note: ES = establishment survey; LFS = labour force survey. Labour turnover is calculated as a ratio of the sum of hirings and separations during the year to the initial employment level in that year at establishment level or a sum of aggregate changes between employment and unemployment and employment and inactivity, as well as changes in employment from one job to another over the year, divided by initial employment in that year. Source: S. Cazes, A. Nesporova, Towards excessive job insecurity in transition economies? ILO Employment Paper No.23, Geneva, 2001.
Table 10: Comparison of labour turnover and job turnover for selected transition economies, 1994-1997 (percentage)
Country Labour turnover Job turnover Share of job turnover in labour turnover
Poland 42.8 8.5 19.9
Estonia 41.4 16.0 38.6
Slovenia 31.0 9.5 30.6
Bulgaria 48.2 8.1 16.8
Russian Federation* 48.2 6.5 13.5
Note: * Only 1994-1995. Labour turnover is defined in Table 9. Job turnover is the sum of changes in the number of jobs in individual establishments, i.e. the sum of all employment gains from new or expanding establishments and all employment losses from closed-down or declining establishments. For details concerning the calculation of job turnover data in this table see source below. Sources: Labour turnover data see Table 9, job turnover data for Poland, Estonia, Slovenia and Bulgaria from Faggio and Konings, Job creation, job destruction and employment growth in transition countries in the 90s, LICOS, Leuven, 2000. For the Russian Federation from Gimpelson and Lippoldt, “Labour turnover in the Russian economy” in OECD Proceedings: Labour market dynamics in the Russian Federation , OECD, Paris, 1997.

27 As expected, Table 9 reveals a substantial increase in labour turnover in the early stages of transition and, later, a decline and stabilization. In each country, periods of sudden upswing emerge, relating to a renewed labour turmoil connected with economic imbalances and remedial policy packages. Rather surprisingly, the Russian Federation and Bulgaria had the highest labour mobility over the 1990s. Labour turnover was also high in Poland and Estonia, while the Czech Republic (after 1993), Slovenia and Ukraine recorded markedly slower labour reallocation. The comparison between labour turnover and job turnover provides an indication of the importance of structural changes in explaining the country-different levels of labour mobility. For example, Estonia is characterized by relatively high job turnover, which contributed almost 40 per cent to overall labour mobility in the period under review. This confirms the view that liberal economic reforms have accelerated the structural adjustment of the economy, resulting in the highest achieved economic dynamics in the region – although not in any employment recovery. A second case in point is Slovenia. Frequently criticized for the slow restructuring of its large state enterprise sector, this country in fact has the second highest rate of job turnover among the five countries analysed (see Table 10). Structural changes also explain the favourable economic development of Slovenia in the 1990s, often puzzling those experts who considered its low labour turnover symptomatic of its slow pace in economic transformation. 9 In contrast, low job turnover in Bulgaria and the Russian Federation is clear evidence of delayed restructuring of the enterprise sector, resulting in poor economic performance for both countries. The wide gap between job turnover and very high labour turnover should thus be attributed to the excessive movement of workers among low productive and poorly remunerated old jobs rather than to any positive reallocation of labour towards progressive industries and new enterprises. Rather surprisingly, Poland was also close to these two slow reformers both in terms of low job turnover and its small contribution to labour mobility. One reason is that the survey used for calculating job turnover included only large and medium-sized enterprises, which experienced economic problems due to delayed restructuring and privatization in the analyzed period. A temporary slowdown of large and medium enterprise restructuring was thus reflected here. In contrast, many newly established small firms – the driving force of solid growth of the Polish economy in this period - were omitted.
9 See e.g. M. Vodopivec, Studying labour market flows in a transition period. OECD workshop “The Use of Labour Force Surveys in Policy-making. Tallin, 27-28 October 1997.
28
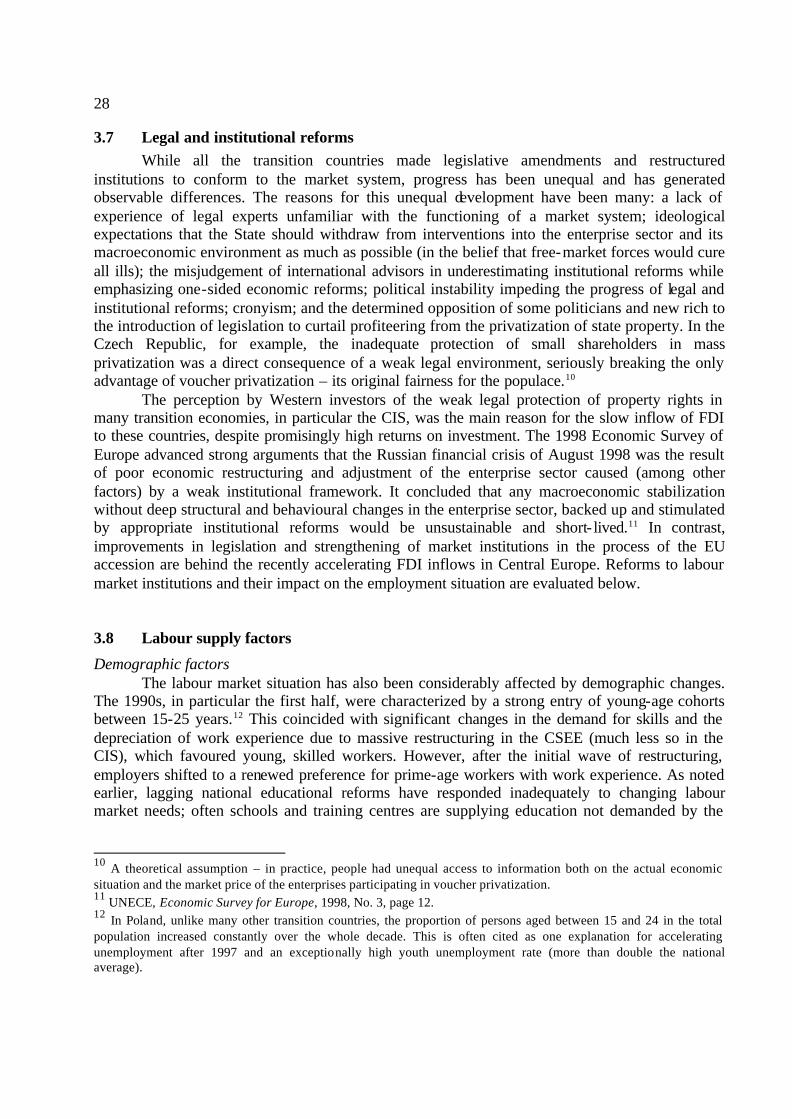
3.7 Legal and institutional reforms While all the transition countries made legislative amendments and restructured institutions to conform to the market system, progress has been unequal and has generated observable differences. The reasons for this unequal development have been many: a lack of experience of legal experts unfamiliar with the functioning of a market system; ideological expectations that the State should withdraw from interventions into the enterprise sector and its macroeconomic environment as much as possible (in the belief that free-market forces would cure all ills); the misjudgement of international advisors in underestimating institutional reforms while emphasizing one-sided economic reforms; political instability impeding the progress of legal and institutional reforms; cronyism; and the determined opposition of some politicians and new rich to the introduction of legislation to curtail profiteering from the privatization of state property. In the Czech Republic, for example, the inadequate protection of small shareholders in mass privatization was a direct consequence of a weak legal environment, seriously breaking the only advantage of voucher privatization – its original fairness for the populace.10
The perception by Western investors of the weak legal protection of property rights in many transition economies, in particular the CIS, was the main reason for the slow inflow of FDI to these countries, despite promisingly high returns on investment. The 1998 Economic Survey of Europe advanced strong arguments that the Russian financial crisis of August 1998 was the result of poor economic restructuring and adjustment of the enterprise sector caused (among other factors) by a weak institutional framework. It concluded that any macroeconomic stabilization without deep structural and behavioural changes in the enterprise sector, backed up and stimulated by appropriate institutional reforms would be unsustainable and short- lived.11 In contrast, improvements in legislation and strengthening of market institutions in the process of the EU accession are behind the recently accelerating FDI inflows in Central Europe. Reforms to labour market institutions and their impact on the employment situation are evaluated below. 3.8 Labour supply factors
Demographic factors The labour market situation has also been considerably affected by demographic changes. The 1990s, in particular the first half, were characterized by a strong entry of young-age cohorts between 15-25 years.12 This coincided with significant changes in the demand for skills and the depreciation of work experience due to massive restructuring in the CSEE (much less so in the CIS), which favoured young, skilled workers. However, after the initial wave of restructuring, employers shifted to a renewed preference for prime-age workers with work experience. As noted earlier, lagging national educational reforms have responded inadequately to changing labour market needs; often schools and training centres are supplying education not demanded by the
10 A theoretical assumption – in practice, people had unequal access to information both on the actual economic situation and the market price of the enterprises participating in voucher privatization. 11 UNECE, Economic Survey for Europe, 1998, No. 3, page 12. 12 In Poland, unlike many other transition countries, the proportion of persons aged between 15 and 24 in the total population increased constantly over the whole decade. This is often cited as one explanation for accelerating unemployment after 1997 and an exceptionally high youth unemployment rate (more than double the national average).

29 market. As job creation still remains low, school leavers without work experience are increasingly confronted with unemployment. Some have responded by staying longer in education. Another demographic factor of significance in the transition countrie s is a sharp decline in fertility rates. Reasons include the falling incomes of young families, housing problems faced by young people and women’s fear of job loss (because of child-raising). New career opportunities opening up for women are also a factor in lower fertility rates. In the short-term, the consequence is fewer women on maternity/parental leave; in the long-term, it will contribute to a more rapid ageing of the population. In the initial years of economic transition non-Central European transition countries also experienced an increase in mortality and morbidity rates, explained by a declining expenditure on health care as a result of state budget cuts and shrinking incomes. A rising health problem in the overall population is elevated levels of stress, caused by unemployment and poverty. 13 This may be one cause of the substantial growth in disability pensions among older workers (the other, more importantly, is the “solving” of labour market problems of older workers, especially those with poorer health by offering them disability pensions). Effects of education As Section 3.1 mentions, the transition countries boast high average levels of education compared with countries in a similar economic bracket (see Table 11 for population aged 15-64).
Table 11: Composition of population, aged 15-64, according to education level, selected transition economies, 2000 (percentage of total population)
Level of education: Country Primary Secondary Tertiary
Bulgaria 43.9 42.7 13.4 Czech Republic 23.8 67.0 9.1 Estonia 26.2 51.3 22.5 Hungary 38.5 50.3 11.2 Latvia 30.6 55.3 14.1 Lithuania 31.3 36.8 31.9 Poland 33.1 58.3 8.6 Romania 43.2 49.9 6.9 Slovakia 28.8 63.5 7.6 Slovenia 33.9 53.9 12.1
Source: EUROSTAT, Employment and labour market in Central European countries, Luxembourg 2001.
Although cross-country comparisons of education levels are imprecise because of wide variations in national education systems, Table 11 indicates substantial differences among countries in the shares of population with only primary education, which, for example, is very low in the Czech Republic and Estonia but much higher in Bulgaria and Romania. Low-skilled 13 For more on this aspect, see G.A. Cornia and R. Paniccia (eds.), The mortality crisis in transitional economies (Oxford University Press 2000). In this connection, an immense fall in the life expectancy of males in the Russian Federation, from 64.2 years in 1989 to 57.6 years in 1994, is often cited. Although life expectancy recovered in all the transition countries after 1995, in many of them it still remains below pre-transition levels.

30
workers face the hardest problems in the labour market, owing to their restricted ability to adjust to new technologies and new methods of work organization. Similarly, large differences are found in the shares of population with secondary education, which is very high in the Czech Republic, Slovakia and Poland. In contrast, tertiary education levels are considerably higher in Lithuania and Estonia compared with the other transition countries. If supported by favourable human resources development, this signals a large development potential for these two countries.
The traditional, extremely narrow specialization in vocational education that distinguishes the transition countries has left the legacy of a large share of blue-collar workers with obsolete skills – a problem that has emerged across-the-board and been dealt with inadequately everywhere. Adult education is insufficiently developed, not only in the training of unemployed jobseekers, which covers only a fraction of those in need of skills upgrading, but also in training those workers threatened by unemployment or those requiring skills upgrading to work with new technologies. Under the previous regime, enterprises delivered skills upgrading to staff. New, hard budget constraints have forced many enterprises to close down these facilities and look for skilled workers in the labour market, instead of investing in their own workers. 3.9 The role of employment protection legislation
National labour legislation was substantially and repeatedly amended in the transition to a market sys tem. The objective is to facilitate workforce adjustment for firms, in order to make enterprises more flexible and economically competitive, while guaranteeing solid employment protection for workers. Under the previous centrally planned system, workers enjoyed a fairly high degree of employment protection. The amended employment protection legislation (EPL) substantially moderates workers’ protection, both in current jobs and in the case of redundancy.
What is the overall effect of this new EPL on employment and unemployment – in general and in regard to specific social groups? First results from an ILO cross-country analysis of the strictness of EPL and its labour market effects reveal that on average the transition countries place around the EU average and slightly above that of the OECD countries.14 Here again, significant differences arise among transition countries: Hungary and Poland with the least restrictive EPL and Slovenia and the Russian Federation (the latter until January 2002) with the most restrictive. In fact, if the latter two countries are excluded, the average of CEE countries is even below the EU average. Moreover, outside the Central European economies the enforcement of labour legislation remains weak. The labour market implications of EPL
First results show that the strictness of EPL has no impact either on the overall level of unemployment or on youth unemployment and is only weakly associated with employment rates and the share of self-employment. However, it does appear to increase the share of temporary jobs. The link between EPL and labour market dynamics (i.e. flows between employment,
14 S. Cazes, A. Nesporova, The impact of employment protection legislation on labour market outcomes: The evidence from CEE and OECD countries, a paper presented at the ILO Regional Tripartite Seminar on Labour Market Flexibility and Employment Security in Transition Countries. Budapest, November 2001. This work is currently being further elaborated by these two authors and will be published in a forthcoming book on labour market flexibility and employment security in transition countries. Employment protection legislation covers regulation of both permanent and time -limited employment and the analysis uses OECD methodology.

31 unemployment and inactivity) appears stronger. Stricter EPL tends to contribute to lowering labour turnover. It does not lead to longer job tenure, but it is strongly associated with lower flows into unemployment and longer duration of unemployment. In sum, the impact of EPL on labour markets developments in transition countries tends to be somewhat limited but not insignificant, especially affecting the speed of transition between employment, unemployment and inactivity.15 3.10 The effect of labour market policy
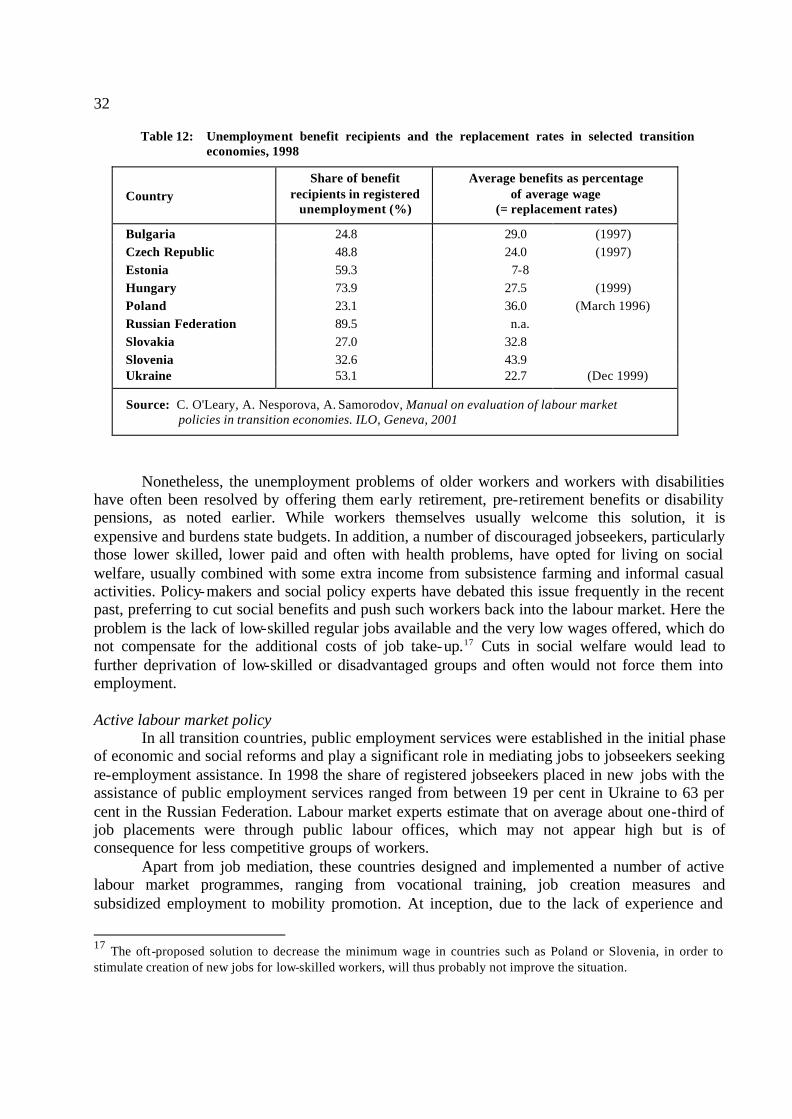
Labour market policy is applied to facilitate the transfer of workers between jobs and between employment, unemployment and inactivity and to balance labour supply with demand. In all transition countries, labour market policy (active and passive) was introduced in tandem with economic and social reforms. Unemployment benefit systems were originally set rather generously, both in terms of eligibility rules and the amount and payment duration of benefits, under the assumption of the transitory character of unemployment. When unemployment rates accelerated rapidly and remained high, the rules and benefit levels became considerably more restrictive, in order to economize on limited resources and activate jobseekers to take up new jobs.16 Passive policy The coverage of registered jobseekers by income support and the average replacement rates of unemployment benefits for 1999 are given in Table 12. In general, the share of benefit recipients among registered jobseekers is rather low, moving between 23 and 49 per cent for the CEECA countries. The higher shares for the CIS countries and the Baltic States are connected with lower registration of unemployed persons at public employment services; the proportion of benefit recipients in total unemployment would thus be even lower than in the CSEE countries. The replacement rates related to the average national wage reached a maximum of one-third, making it unlikely that unemployment benefits per se would discourage benefit recipients from taking up a job, were one available.
15 See S. Cazes and A. Nesporova, op.cit. 16 For a detailed discussion of labour market policy, its formulation, implementation and outcomes see A. Nesporova, Employment and labour market policies in transition countries (ILO, Geneva, 1999).
32
Table 12: Unemployment benefit recipients and the replacement rates in selected transition economies, 1998
Country Share of benefit
recipients in registered unemployment (%)
Average benefits as percentage of average wage
(= replacement rates)
Bulgaria 24.8 29.0 (1997) Czech Republic 48.8 24.0 (1997) Estonia 59.3 7-8 Hungary 73.9 27.5 (1999) Poland 23.1 36.0 (March 1996) Russian Federation 89.5 n.a. Slovakia 27.0 32.8 Slovenia 32.6 43.9 Ukraine 53.1 22.7 (Dec 1999)
Source: C. O'Leary, A. Nesporova, A. Samorodov, Manual on evaluation of labour market policies in transition economies. ILO, Geneva, 2001
Nonetheless, the unemployment problems of older workers and workers with disabilities
have often been resolved by offering them early retirement, pre-retirement benefits or disability pensions, as noted earlier. While workers themselves usually welcome this solution, it is expensive and burdens state budgets. In addition, a number of discouraged jobseekers, particularly those lower skilled, lower paid and often with health problems, have opted for living on social welfare, usually combined with some extra income from subsistence farming and informal casual activities. Policy-makers and social policy experts have debated this issue frequently in the recent past, preferring to cut social benefits and push such workers back into the labour market. Here the problem is the lack of low-skilled regular jobs available and the very low wages offered, which do not compensate for the additional costs of job take-up.17 Cuts in social welfare would lead to further deprivation of low-skilled or disadvantaged groups and often would not force them into employment. Active labour market policy In all transition countries, public employment services were established in the initial phase of economic and social reforms and play a significant role in mediating jobs to jobseekers seeking re-employment assistance. In 1998 the share of registered jobseekers placed in new jobs with the assistance of public employment services ranged from between 19 per cent in Ukraine to 63 per cent in the Russian Federation. Labour market experts estimate that on average about one-third of job placements were through public labour offices, which may not appear high but is of consequence for less competitive groups of workers. Apart from job mediation, these countries designed and implemented a number of active labour market programmes, ranging from vocational training, job creation measures and subsidized employment to mobility promotion. At inception, due to the lack of experience and
17 The oft-proposed solution to decrease the minimum wage in countries such as Poland or Slovenia, in order to stimulate creation of new jobs for low-skilled workers, will thus probably not improve the situation.

33 skills of PES staff, problems arose with the formulation, targeting and application of these programmes, so that although re-employment rates after their completion were initially low, this has improved over time. However, the biggest problem – financial – remains. National employment funds are already stretched to pay benefit entitlements and to combat high unemployment: what is left to spend on active labour market policies is very modest. Table 13 illustrates this but also shows important differences among countries in the amount of funds devoted to various labour market problems and the share given to active policies. Table 13 does not correlate labour market policy expenditure to registered unemployment (as is usually the case) but to LFS unemployment. It reveals a weak correlation between the level of expenditure on labour market policies and the size of labour market problems.
Table 13: Expenditure on labour market policy per unemployed person in selected transition economies, 1998
Country % GDP Total expenditure per unemployed**
Expenditure * on ALMP
Expenditure on income support
Bulgaria 0.8 0.056 0.007 0.029 Croatia 0.6 0.053 0.002 0.042 Czech Republic 0.4 0.055 0.007 0.036 Estonia 0.2 0.020 0.007 0.010 Hungary 1.3 0.167 0.036 0.117 Poland 1.0 0.095 0.028 0.056 Russian Federation 0.2 0.015 0.002 0.010 Slovakia 1.1 0.088 0.026 0.044 Ukraine 0.3 0.027 0.003 0.017
Note: * Ratio of GDP spent on labour market policy to LFS unemployment rate, (both in percentage terms) including spending on active policies and on income support. The difference between column 3 and columns 4 and 5 relates to the costs of running national public employment services.
Source: Data on LMP spending see O'Leary, Nesporova, Samorodov, op.cit. LFS unemployment rates see Table 6. Author’s calculations.
3.11 The interaction with social policy
Besides income support in unemployment, early retirement and disability pension, the level of social benefits and assistance may also have an important effect on the decision to withdraw from or return to the labour market. For example, in the CIS and South East European countries the level of social welfare is low in general, whereas studies on the Czech Republic or Estonia show that for a family with low-wage earners, the difference between income from employment and income from social transfers is negligible, and that the latter is higher when job

34
take-up costs (such as transport, clothing, etc.) are considered.18 These two countries have recently increased the minimum wage to make employment a more attractive alternative than living on social welfare. CSEE countries and CIS countries: Two models of labour management For the purposes of this report, two different models of labour management may be broadly distinguished in transition economies. The CSEE countries have opted for a model that shifts responsibility for supporting redundant workers away from enterprises and onto public institutions. Enterprises have heavily reduced their human resource programmes and social services for workers. Firms often prefer to recruit new workers with the desired work experience than to invest in the retraining their own staff or hiring school leavers without work experience. In income support and re-employment assistance, these countries rely on public employment services. They therefore have liberalized EPL, introduced unemployment benefit systems, reshaped social welfare systems and launched active labour market policy measures – although significant differences occur in the quantity and quality of assistance thus offered. The CIS countries, in contrast, continue to rely mainly on employment protection within enterprises, while assistance provided by public employment services is relatively poor. As EPL is rather restrictive, employers opt for other forms of workforce adjustment, such as short-term work, administrative leave or delayed wage payment. Given the low labour demand coupled with the inferior quality of available vacant jobs, this solution appears more acceptable for all parties. Employers can adjust labour costs to their economic situation and they do not destroy work-teams they will need when market demand recovers. Workers do not lose jobs that provide at least some income (which they complement with income from other sources) and they maintain access to the social services provided by their enterprise. And governments avoid the social unrest generated by unemployment and poverty. The CSEE model stimulates more effective allocation of labour among sectors. This results in higher labour productivity but may lead to higher unemployment and lower participation rates. The CIS model tends to moderate labour reallocation to new enterprises and trades, offering more productive jobs, but employment levels are in general higher and unemployment rates lower. 3.12 The impact of income policy
The transition countries inherited low levels of money wages and rather low wage differentials. This was due to their fairly rigid central pay systems, which set wages more as a function of the industry and type of work than of skill requirements, employee performance or the economic performance of the enterprise. Economic reforms gradually replaced centralized wage tariff systems with wage determination based on collective bargaining in the enterprise sector, while maintaining a universal tariff system in the budget- funded sector. Most countries have also introduced the minimum wage as a basis for the wage tariff system in both the budget- funded and the enterprise sectors but often also for calculating minimum social benefits. In many countries, the minimum wage has fallen well below the subsistence minimum, thus losing its social and economic function. 18 See e.g. J. Vecernik, Labour market flexibility and employment security: Czech Republic. ILO Employment Paper No. 2001/27, and R. Arro, R. Eamets et al., Labour market flexibility and employment security: Estonia. ILO Employment Paper No. 2001/25.

35 In line with price liberalization, governments also introduced economic stabilization programmes in which the key role was attributed to a tax-based income policy, controlling wage increases above a specified level through a punitive tax. The aim of this policy, imposed in most countries on state-owned enterprises, was to link wage increases more with enterprise performance and to lower a price-wage inflation spiral. The direct consequence of this tax-based income policy was a sharp fall in real (consumer) wages in 1993, equal to around 80 per cent of their 1989 level in the Czech Republic, 71 per cent in Poland, 66 per cent in the Russian Federation and down to 38 per cent in Ukraine. Wage regulation contributed to the disconnection of wages and productivity. The more profitable enterprises were not allowed to increase wages above the agreed maximum. Meanwhile, poorly performing enterprises increased their wages to the maximum, under pressure from their workers, often at the cost of postponing investments, non-payment of credits, taking new credits, etc. Small differences in wages between profitable and non-profitable enterprises did not stimulate the desired allocation of labour from the latter to the former enterprises and thus significantly contributed towards delaying enterprise restructuring. They helped maintain redundant workers in large enterprises while more productive enterprises could not attract workers by significantly higher wages. Moreover, monopolistic enterprises mainly in the extraction industries, metallurgy and energy, converted their profits (artificially inflated by price increases) into higher and faster-growing wages than in other industries, without changing technologies and raising productivity. In addition, particularly in the CIS countries, huge wage arrears emerged as a consequence of the collapse of market demand and the heavy taxation of enterprises. A credit squeeze, induced by restrictive monetary and fiscal policies, deprived enterprises of working capital and cuts in government spending resulted in mounting wage arrears, including in the budget-funded sector. Wage regulation was moderated and finally abolished, leading to a more rapid recovery of real wages. Although, by 2000, real consumer wages exceeded the 1989 level only in the Czech Republic. 3.13 The effect of collective bargaining
During the past decade the majority of transition countries moved towards a collective bargaining system. The percentage of workers covered by collective agreements is fairly high in the public sector and in large private firms. Workers in medium-sized and small firms are rarely unionized. Collective bargaining usually concentrates on negotiations on wages and working conditions. Employment issues are of less importance and focus more on compensation in case of redundancy rather than on prevention of redundancies. Major exceptions are the coal mining and steel industries, where strong trade unions have opted for strike action, temporarily blocking mass dismissals in order to coincide them with high severance payments. In the CSEE countries, EPL usually only stipulates informing the enterprise trade union organization of redundancy intentions. In a number of CIS countries, trade unions are required to agree with layoffs (which may, and did in the past, effectively prevent dismissals for redundancy) and to compel enterprise managements to turn to alternative cost reduction measures, such as forced leave or non-payment of wages. In Poland and Romania, for example, the power of trade unions has been translated into stronger protection of jobs in enterprises. In addition, privatization deals, particularly in Poland, included temporary bans on mass redundancies. The expiry of such privatization clauses after 1998 was one reason for the rapidly increasing unemployment in this country.

36
4. Suggestions for policy improvement
The important question for the policy-makers in the transition countries arises how, in which direction to refocus current economic, employment and social policy, to better stimulate employment growth and reduce the persistently high levels of unemployment. Some ideas for a possible policy redirection are outlined below. First, it is vital to put employment goals at the centre of economic and social policy and to make full, productive and freely chosen employment an overall objective of national macroeconomic strategies and policies. Undeniably, economic growth is the necessary condition for boosting new job creation and an increase of wages and incomes – but it is not sufficient per se. Macroeconomic policy should promote an economic growth that generates enough jobs for all those who want to work. These jobs should be of good quality, be safe for workers’ health and earn a sustainable livelihood for workers and their families; in short, decent work – a leading item on the ILO Global Employment Agenda.19 As the primary engine of economic growth is investment, governments must foster a stimulating environment for private investment by ensuring that legal rules and market institutions are transparent and sufficiently stabilized and that property rights are safeguarded. Simultaneously, governments should directly invest in social and technical infrastructures that best promote productivity growth, enhance returns to private investment and thus attract new investors, both domestic and foreign. New jobs are now mainly created by foreign direct investment through privatization of existing enterprises or the setting up of new firms (independent, or the subsidiaries of foreign companies). Governments of many transition countries compete among themselves in preferential policies for FDI, increasingly provoking criticism from the European Union. Other critics are closer to home: domestic investors complain they are discriminated against in favour of foreign investors. Governments need to reconsider here. A more balanced policy must be based on sound legal, economic and social conditions for investment and a fair approach to all investors. Optimal use needs to be made of comparative advantage in these countries, primarily their skilled and still cheap labour. The need for advancing the depressed regions that exist in all the transition countries makes the application of such preferential policies for attracting external investors conditional upon public investment in upgrading both technical infrastructure and workers’ skills in these regions. The second important source of new job creation is small enterprise. Many small firms and self-employed persons are locked in low productive activities because the lack of skills and capital forestalls their benefiting from new technologies or expanding. Small entrepreneurs also suffer disproportionately more from bureaucratic regulations and high taxes than larger firms. New policies promoting small enterprise development should address these obstacles. Besides creating a favourable business environment in general, government must simplify administrative rules and taxation for small firms. It must enhance the access of small entrepreneurs to capital, facilitate their capturing of new technologies, and support betterment in the managerial and technical skills
19 Global Employment Forum, November, 2001, ILO, Geneva.

37 of entrepreneurs and employees. Large firms, especially the foreign-owned ones, should be encouraged to increase their links with domestic suppliers and help them upgrade their production if necessary. The formulation and implementation of economic, employment and social policies cannot be left solely to government. Success requires the close collaboration of all concerned, involving the social partners to ensure that different interests are conciliated and the benefits fairly shared. Technological changes and product innovations require rapid adjustment on the side of producers in order to retain or extend their market shares against sharp and increasingly global competition. Adjustments concern both tangible assets and human capital – meaning workforce number, skills, productivity and costs. Employers require higher labour flexibility, mobility and productivity. Workers need reasonable security and motivation in order to accept and respond to change. Here, governments have a key responsibility: the introduction of reforms to their provision of education and training, both for youth and adults, which will meet labour demand and enable workers to maintain and improve their employability through lifelong learning. Enterprises should be encouraged to invest in the education and training of their workforce and build on the functional rather than numerical flexibility of labour.
Adjustment of the enterprise sector to technological and other changes results in acceleration of flows of workers between jobs and between employment, unemployment and inactivity. Labour market policy is the device that can facilitate a smooth and secure labour market transition of workers. It is a tool that, suitably designed, should promote high employment, reduce frictional unemployment and mitigate long-term structural unemployment or forced inactivity. The aim is to strike the right balance between the adjustment needs of enterprises and the needs of workers, who should feel secure in their jobs or in the transit between jobs and should also be encouraged to constantly improve their skills, flexibility and productivity.
Those who are losing their jobs need access to new jobs, with public assistance if necessary. In this process, the public employment service is an institution that requires further strengthening in all transition countries. Its proper function is to analyse labour market needs accurately and help those in unemployment to return to work as soon as possible, through job mediation, vocational counselling, labour market training and other active labour market programmes.
Special attention should be devoted to less competitive social groups, to eliminate discrimination and assist them to overcome their disadvantages and enter employment. Effective income support in unemployment does not let job losers and their families fall into poverty; it should simultaneously activate their job search, their participation in active labour market programmes (if necessary), and early job take-up, thus contributing to labour mobility. National social security systems must be designed to advance employment promotion of those who can work, while providing decent income support for those who cannot work permanently (or temporarily). It goes without saying that policies must also be financially sustainable for long-term progress.

38
5. Conclusions
The aim of this paper was to contribute to the debate on the reasons for which the
unemployment in Central and Eastern Europe has remained so high and is recently again on the increase, despite economic recovery and even solid growth rates finally achieved by all these countries. It also sought to explain significant differences in unemployment levels among transition countries, rather weakly dependent on their economic performance.
The response to the first question can be found in the effort of enterprises to increase labour productivity and become competitive through the elimination of labour hoarding and the use of labour- intensive technologies while cutting employment in the public sector for budget reasons. Informal sector employment also plays an important role in the persistently high unemployment rates.
Cross-country differences were explained by a combination of factors, ranging from different starting conditions and changes in the quantity and quality of the labour supply - through substantial variations in national monetary and fiscal policies, the ways of privatization of state-owned enterprises, policies encouraging foreign direct investment and new enterprise development as well as legal and institutional reforms - to disparities in national industrial relations, income, labour market and social policies. The ambition of the paper was to point to the complexity of reasons for persistently high unemployment in the transition countries without making any attempt to quantify the impact of each of the enlisted factors (which would be very difficult due to their interrelated character).
As found out in another study20, high job insecurity perceived by workers in these countries impedes relocation of labour from low productive to high productive sectors and stimulates further informal sector employment. The appropriate national policy response should take into account a combination of country specific factors affecting the supply and demand sides of the labour market that contribute to its poor employment performance, and which would thus, contribute towards stabilization and higher employment security on the labour market, and put the long-term goal of decent work for all at the centre of economic and social policy.
20 Cazes, Nesporova, Towards excessive job insecurity in transition economies, op.cit.