why hp is worth more without compaq. 2 this presentation was prepared for and on behalf of the...
TRANSCRIPT

Why HP is Worth More Without Compaq

2
This presentation was prepared for and on behalf of the Trustees of the William R. Hewlett Revocable Trust as soliciting material. The Trustees’ advisors have been retained as independent contractors to the Trustees and have no fiduciary, agency or other relationship to the Trustees, the Trust or to any other party, all of which are hereby expressly disclaimed. Therefore, no obligation or responsibility is assumed to any person with respect to this presentation. This presentation does not purport to be a complete description of the views of or analyses performed by the Trustees or its advisors.
Except as otherwise noted herein, this presentation and the views expressed herein, as well as any estimates herein, are based on publicly available information and on consultants’ and industry reports as well as on the views of certain consultants retained in connection with the consideration of the proposed merger by the Trustees. This presentation and the views expressed herein assume and rely upon the accuracy and completeness of all such publicly available information, reports and views and no responsibility for independent verification of any of the foregoing has been taken. All views and estimates expressed herein are based on economic and market conditions and other circumstances as they exist and can be evaluated as of February 19, 2002.
The views expressed in this presentation are judgments, which are subjective in nature and in certain cases forward-looking in nature. This presentation also contains estimates made without the benefit of actual measurement. Forward-looking statements and estimates by their nature involve risks, uncertainties and assumptions. Forward-looking statements and estimates are inherently speculative in nature and are not guarantees of actual measurements or of future developments. Actual measurements and future developments may and should be expected to differ materially from those expressed or implied by estimates and forward-looking statements. We do not assume any obligation and do not intend to update these forward-looking statements. The information contained in this presentation does not purport to be an appraisal of any business or business unit or to necessarily reflect the prices at which any business or business unit or any securities actually may be bought or sold. In addition, where quotations have been used herein, permission to use quotations was neither sought nor obtained.
This presentation and the views expressed herein do not constitute a recommendation by Friedman Fleischer & Lowe or The Parthenon Group to any holder of shares of Hewlett-Packard or Compaq with respect to how such shareholder should vote with respect to the proposed merger and should not be relied upon by any holder as such a recommendation.
3
Opposition to the Proposed Merger is Broad and DeepSection 1
Why the Proposed Merger is UnattractiveSection 2
HP Must Pursue a “Focus and Execute” StrategySection 3
Agenda

4
Walter Hewlett
• HP Board member for 15 years
• Agilent Board member since spin-off
• Worked with 3 HP CEOs
• Walter Hewlett is also a fiduciary and a shareholder:
– Fiduciary to Hewlett Foundation and Hewlett Trust ($6.0B)
– Unpaid
– Not seeking job
– Not spending shareholder resources

5
Broad Opposition to the Proposed Merger
Opposition Commentary
William R. Hewlett Revocable Trust
Packard Foundation
All Shareholders Stock down by 18%1 Majority opposed to merger
Decision Makers
Walter Hewlett, Edwin Van Bronkhorst
12-member Board4
Multiple InvestorsWall Street Analysts
Hewlett Foundation Unanimous intention to vote against
Hewlett Foundation Stock Committee2
1 Day of announcement2 Walter Hewlett is not a member of this committee and has no veto power over its decisions3 Formerly Chief Investment Officer of Stanford Management Company, running Stanford’s $10B endowment4 Includes a majority of non-family members, amongst them two senior retired HP executives
Intention to vote against
Unanimous intention to vote against
Advisor
FFL / Parthenon
Booz-Allen & Hamilton
Laurie Hoagland, Chief Investment Officer3

6
Market ReactionIndexed Stock Price Performance
Note: Stock data through 2/15/021 This index is comprised of companies used by Goldman Sachs in performing its “Selected Companies Analysis” in connection with rendering its fairness opinion to
HP relating to HP’s proposed merger with Compaq and includes Apple, Accenture, Computer Sciences, Dell, EDS, EMC, Gateway, IBM, KPMG Consulting, Network Appliance, Sun. Index is weighted by shares outstanding.
60%
70%
80%
90%
100%
110%
120%
130%
140%
8/31/2001 9/30/2001 10/31/2001 11/30/2001 12/31/2001 1/31/2002
HP
ComparableCompany Index1
Inde
xed
Val
ue v
s. 8
/31/
01
(12%)
5%
8/31/01-2/15/02
The market has made its view of the transaction clear on two separate occasions: 1) when the deal was announced, and 2) when the Hewlett Foundation and William R. Hewlett Revocable Trust announced their opposition to the deal
9/3/01: HP/Compaq Merger Announced. HP share price drops
19% the day after announcement.
11/6/01: Walter Hewlett Announces Opposition.
HP share price rises 17% on the day of the announcement.

7
Section 1
Section 2
Section 3
Agenda
Opposition to the Proposed Merger is Broad and Deep
Why the Proposed Merger is Unattractive
HP Must Pursue a “Focus and Execute” Strategy

8
1. Financial Impact on HP Stockholders is Unattractive1. Financial Impact on HP
Stockholders is Unattractive
The Proposed Merger is Unattractive to HP Stockholders
2. Portfolio Shift is Unattractive
2. Portfolio Shift is Unattractive
3. Integration Risk is Substantial
3. Integration Risk is Substantial
4. Acquisition Will Not Solve HP’s Strategic Problems
4. Acquisition Will Not Solve HP’s Strategic Problems
Executive Summary
9
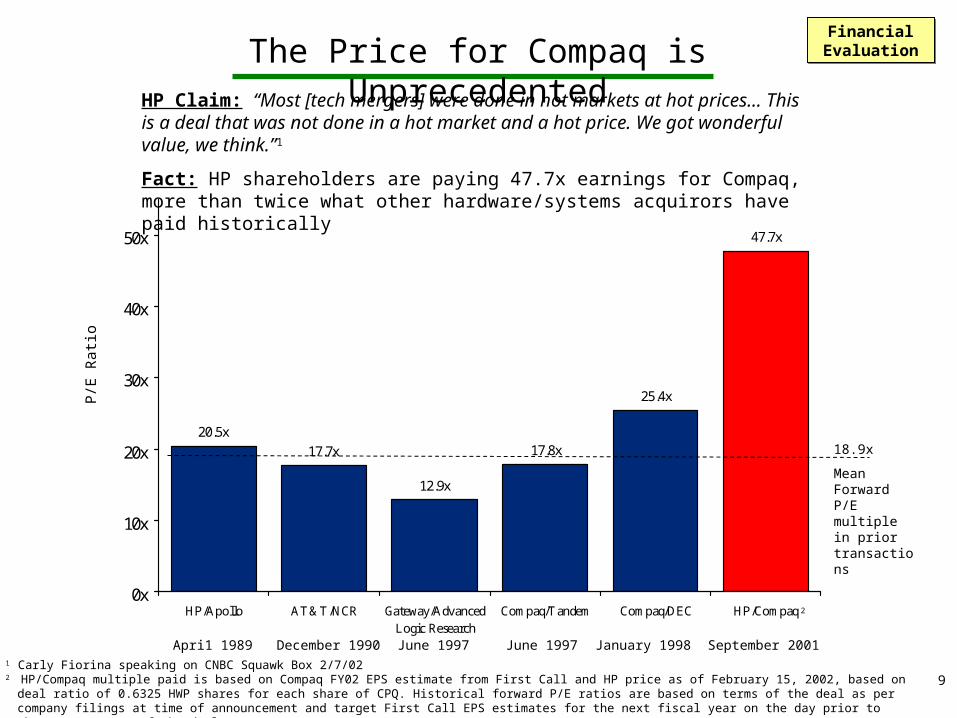
HP Claim: “Most [tech mergers] were done in hot markets at hot prices… This is a deal that was not done in a hot market and a hot price. We got wonderful value, we think.”1
Fact: HP shareholders are paying 47.7x earnings for Compaq, more than twice what other hardware/systems acquirors have paid historically
20.5x
17.7x
12.9x
17.8x
25.4x
47.7x
0x
10x
20x
30x
40x
50x
HP/Apollo AT&T/NCR Gateway/AdvancedLogic Research
Compaq/Tandem Compaq/DEC HP/Compaq
1 Carly Fiorina speaking on CNBC Squawk Box 2/7/022 HP/Compaq multiple paid is based on Compaq FY02 EPS estimate from First Call and HP price as of February 15, 2002, based on deal ratio of 0.6325 HWP shares for each share of
CPQ. Historical forward P/E ratios are based on terms of the deal as per company filings at time of announcement and target First Call EPS estimates for the next fiscal year on the day prior to the announcement of the deal.
The Price for Compaq is UnprecedentedP
/E R
atio
September 2001January 1998June 1997 June 1997December 1990Apri1 1989
18.9x
Mean Forward P/E multiple in prior transactions
Financial EvaluationFinancial
Evaluation
2

10
Earnings Dilution
• Under the terms of the proposed merger, HP would issue shares to Compaq at a valuation of 47.7x1 CY2002 earnings vs. HP’s multiple of 17.7x2
• Before synergies and revenue losses, this results in substantial earnings dilution:
• At HP’s current CY 2002 multiple of 17.7x, this dilution equates to a per share value impact of $4.56 excluding the impact of a change in P/E multiple
1 Based on HP’s closing share price of $20.36 on February 15, 2002, and the announced exchange ratio of 0.6325 and Compaq’s First Call consensus EPS estimate of $0.27 for calendar year 2002.2 Based on HP’ First Call consensus earnings estimate of $1.04 for calendar year 2002 and closing share price of $20.36 as of February 15, 2002.3 Based on pro forma combined EPS calculated based on standalone First Call estimates and excluding the impact of revenue losses and cost savings.4 Based on First Call estimates as of August 31, 20015 Based on First Call estimates as of February 15, 2002
CY 2002 CY 2003 CY 2004
($0.26)EPS Dilution3 ($0.21) ($0.23)
Financial EvaluationFinancial
Evaluation
Dilution 22.4% 15.6% 15.1%
2001 2002 2003At Announcement4 $0.36 $0.66 $0.88
Actual/Current5 $0.15 $0.27 $0.49
Percent Change (58.3%) (59.1%) (44.3%)
First Call EPS Estimates

11
HP’s Assumptions are Inconsistent with Actual Performance and Analysts’ Estimates
$0.00
$0.10
$0.20
$0.30
$0.40
$0.50
$0.60
$0.70
$0.80
Sun HP Apple Compaq Gateway Compaq /DEC
Profit Loss Benchmarks Actual Operating Profit Decline per Dollar of Lost Revenue
1 For complete detail on sources, see page 49 of the “Report to the Trustees of the William R. Hewlett Revocable Trust on the Proposed Merger of Hewlett-Packard” filed with the SEC under cover of Schedule 14A on 11/16/2001, as amended.
2 Analysts’ estimates exclude Salomon Smith Barney as they are advisers to Compaq3 Parties to Walter Hewlett proxy solicitation4 “HP Position on Compaq Merger,” 12/19/01, p. 275 Represents post-deal 1999 performance vs. analyst estimates. For complete detail see p. 50 of reference in footnote No. 16 “Computer company” results outlined in McKinsey Quarterly, “Why Mergers Fail,” 2001 Number 4. (Name of actual company disguised in article). In early 2001, HP retained McKinsey & Co. to assist in HP’s evaluation of
strategic alternatives and potential acquisition candidates including Compaq7 Sun 10Q, 10K, Sun 1/18/02 earnings press release. Represents 12 month period ending 12/31/01, (FY ends 6/30) 8 HP 11/14/01 earnings press release. Represents 12 month period ending 10/31/01 (excluding restructuring and merger-related costs)9 Apple FY2001 10K. Represents 12 month period ending 9/29/0110 Compaq earnings press release 1/16/02. Represents 12 month period ending 12/31/01 (excluding restructuring and merger-related costs)11 Morgan Stanley, “Gateway: Better Margin Structure, Lower Rev Run Rate,” 1/8/02, page 312 FFL/Parthenon assumption based on historical experience of tech companies, revenue loss in services, and high fixed cost assumptions post planned cost synergies13 Amendment No. 2 to HP S-4, 1/14/02, p. 53 “…weighted average contribution margin of 12%…”
Average: $0.42
2000-2001 Actual Experience
$0.69
$0.63
$0.21 $0.19
$0.56
9 510
1999 Post-Acquisition
0%
4%
8%
12%
16%
20%
SG Cowen'02
MorganStanley '03
BernsteinResearch '02
Banc ofAmerica '03
Compaq /DEC Merger
McKinseyStudy
Revenue Loss Benchmarks
FFL / Parthenon Assumption: $0.2512
HP Assumption: $0.1213
FFL / Parthenon Assumption: 10%3
HP Assumption: 4.9%4
Overall Averageof Analysts and Precedents:12%12% 12%
10%
8%
13%
117
Analyst Estimates1,2
68
17%
$0.36
5
Perc
ent o
f R
even
ue
Dol
lars
Financial EvaluationFinancial
Evaluation

12
The NPV of the Proposed Merger is Negative
($6)
($4)
($2)
$0
$2
$4
$6
$8
$10
Per Share Present Value of the Proposed Merger1
HP NPV of Net Cost
Savings Per Share2
Cost Savings Adjustment5
Contribution Margin
Adjustment 6
Value of Core Dilution Before Cost Savings3
Net ValuePer Share
$7.47
($4.56)
($1.14)
1 Based on assumptions similar to management’s outlined on page 30 of HP “Position on Compaq Merger,” 12/19/01. Present values, except for core dilution and cost to achieve savings, calculated as of February 19, 2002 based on a 20x forward price-earnings multiple applied to net earnings impact in calendar year 2004. Assumes 26% marginal tax rate
2 Assumes net pre-tax cost savings in calendar year 2004 of $2.0 billion based on $2.5 billion in cost savings and $0.5 billion in lost profit on lost revenues. Lost profit calculation assumes $84.0 billion in revenue in calendar year 2004 before revenue losses, 4.9% revenue loss, 12% contribution margin.
3 Represents the value of the core dilution of the transaction before the realization of cost savings at HP’s current 2002 calendar year price-earnings multiple of 17.7x. Calendar 2002 pro forma earnings before cost savings calculated based on First Call consensus earnings estimates of $1.11 and $1.35 for HP for fiscal years 2002 and 2003, respectively, and $0.27 for Compaq for its fiscal 2002. Under management’s present value methodology, the core dilution has a value of $3.56 per share based on calendar 2004 earnings estimates.
4 Realistic case based on $1.3 billion restructuring charge established in connection with Compaq’s acquisition of DEC in 1998, which also involved approximately 15,000 layoffs, and the $635 million in retention bonuses announced by management in the proposed HP/Compaq merger. In fiscal 2001, HP took a $384MM charge for a restructuring it estimated would result in annual cost savings of approximately $500MM. Downside case based on 50% premium to realistic case (11.4% of transaction value). Compaq/DEC restructuring charge as a percentage of transaction value was 13.5%. Excludes the impact of new employment agreements with Ms. Fiorina and Mr. Capellas. Assumes cash is paid out ratably over the first six months following closing
5 Realistic case based on BofA, “Hewlett-Packard: “Management Turns up the Heat,” 12/19/01 base case of 87.8% of management estimate realized in 2003 ($1.8 billion assumed vs. management estimates of $2.1 billion). Downside based on BofA downside case 75.6% of management estimate realized in 2003 ($1.6 billion assumed vs. management estimates of $2.1 billion).
6 Realistic case based on historical experience of tech companies, revenue loss in services, and higher fixed cost assumptions post planned cost synergies. See analysis presented on p. 21-26. Downside case based on discount to Compaq/DEC transaction. 7 Realistic case assumption based on historical experience of tech companies, revenue loss in services. Downside case based on discount to McKinsey computer company example (see “Revenue Loss Benchmarks” on p. 12).
Pre
sent
Val
ue P
er C
urre
nt H
P S
hare
$2.48
($4.03)
“Successful Integration”
Realistic Case 25% 10%
NA 12% 4.9%
($0.43)
($2.01)
($4.70)Cost to Achieve Cost Savings4
Corrected Value using Management Cost Savings NPV
Assumption
Revenue Loss
Adjustment 7
NA
$1.9B
$2.5B
$2.2B($4.56)
Omitted in HP Analysis Realistic Assumptions
Downside Case 35% 15% $1.9B$2.9B($4.56)
($4.70)
$2.91
($14.74)
In the realistic case, the value of the deal is negative $4 to $5 per share excluding the impact of a change in P/E multiple
Financial EvaluationFinancial
Evaluation
13
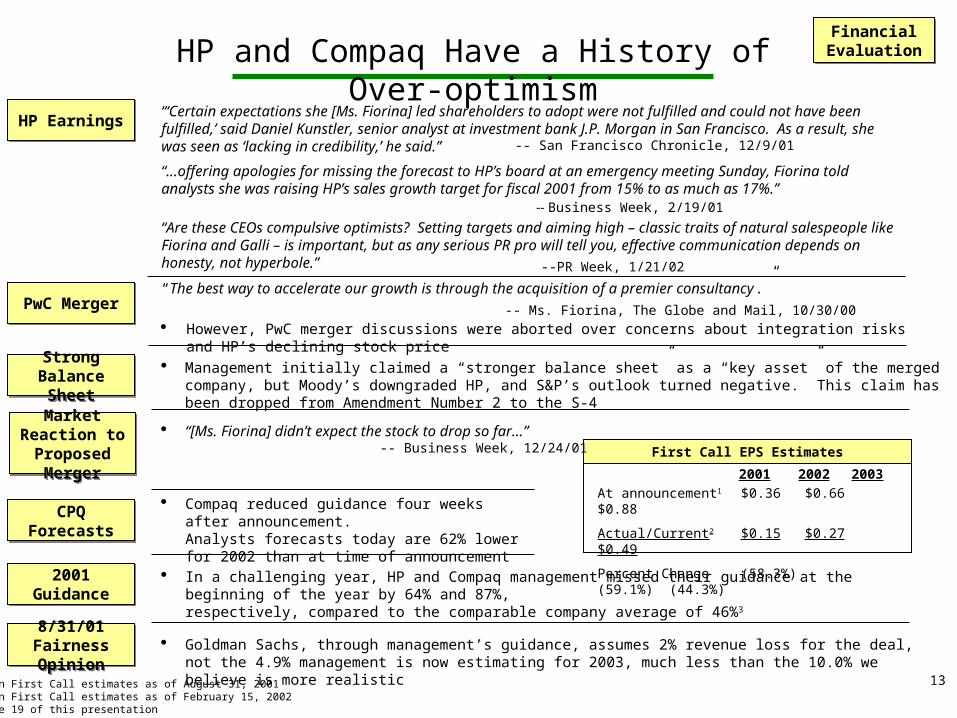
HP and Compaq Have a History of Over-optimism
HP EarningsHP Earnings
PwC MergerPwC Merger
Strong Balance Sheet
Strong Balance Sheet
Market Reaction to Proposed
Merger
Market Reaction to Proposed
Merger
CPQ ForecastsCPQ Forecasts
“The best way to accelerate our growth is through the acquisition of a premier consultancy.”
However, PwC merger discussions were aborted over concerns about integration risks and HP’s declining stock price
Management initially claimed a “stronger balance sheet” as a “key asset” of the merged company, but Moody’s downgraded HP, and S&P’s outlook turned negative. This claim has been dropped from Amendment Number 2 to the S-4
“[Ms. Fiorina] didn’t expect the stock to drop so far…”
Compaq reduced guidance four weeks after announcement. Analysts forecasts today are 62% lower for 2002 than at time of announcement
2001 2002 2003
At announcement1 $0.36 $0.66 $0.88
Actual/Current2 $0.15 $0.27 $0.49
Percent Change (58.3%) (59.1%) (44.3%)
1Based on First Call estimates as of August 31, 20012Based on First Call estimates as of February 15, 20023See page 19 of this presentation
First Call EPS Estimates
2001 Guidance2001 Guidance In a challenging year, HP and Compaq management missed their guidance at the beginning of the year by 64% and 87%,
respectively, compared to the comparable company average of 46%3
-- Business Week, 2/19/01
-- Ms. Fiorina, The Globe and Mail, 10/30/00
“…offering apologies for missing the forecast to HP’s board at an emergency meeting Sunday, Fiorina told analysts she was raising HP’s sales growth target for fiscal 2001 from 15% to as much as 17%.”
-- Business Week, 12/24/01
“‘Certain expectations she [Ms. Fiorina] led shareholders to adopt were not fulfilled and could not have been fulfilled,’ said Daniel Kunstler, senior analyst at investment bank J.P. Morgan in San Francisco. As a result, she was seen as ‘lacking in credibility,’ he said.” -- San Francisco Chronicle, 12/9/01
“Are these CEOs compulsive optimists? Setting targets and aiming high – classic traits of natural salespeople like Fiorina and Galli – is important, but as any serious PR pro will tell you, effective communication depends on honesty, not hyperbole.”
--PR Week, 1/21/02
Goldman Sachs, through management’s guidance, assumes 2% revenue loss for the deal, not the 4.9% management is now estimating for 2003, much less than the 10.0% we believe is more realistic
8/31/01 Fairness Opinion
8/31/01 Fairness Opinion
Financial EvaluationFinancial
Evaluation

14
$0
$1
$2
$3
$4
$5
$6
$7
$8
Fiscal 2003 EBIT ForecastD
olla
rs in
Bil
lion
s
1 Based on First Call consensus earnings estimates of $1.28 and $0.42 for HP and Compaq, respectively, as disclosed in HP 425 Filing 12/19/01, a 26.0% effective tax rate and zero net interest expense and other income.2 Based on management estimated pre-tax cost savings of $2.1B and revenue loss of 5% with 12% contribution margin in FY 2003 as disclosed in HP 425 Filing 12/19/01. 3 $6.9B in operating income as disclosed in HP 425 Filing on 12/19/01.
In addition to net cost savings, management appears to be forecasting a $1B improvement in operating income to hit their forecast
$4.3B1
$5.9B
$6.9B3
?? $1B
First CallHP + CPQ
$4.3B1
Revenue: $80.9B $80.9B $80.9BEBIT Margin 5.3% 7.3% 8.6%
First CallHP + CPQ
Management Net Cost Savings
$1.6B2
Management Net Cost Savings
$1.6B2
First CallHP + CPQ
$4.3B1

15
Unattractive Pro Forma Business Mix Post Merger
Hewlett-Packard1
Total = $45B
Combined2
Total = $78B
1 Based on actual results from FY 2001 and segment projections from Bernstein research dated 12/18/01.2 Based on actual results for CY 2001 for Compaq, actual results for FY 2001for HP and segment projections for HP from Bernstein research dated 12/18/01 and segment projections for Compaq from Banc of America
research dated 1/17/02.
Revenues – CY2001E
Portfolio Impact
Portfolio Impact
PC/AccessPrinting (43%)
Enterprise(20%)
(20%)
Services (17%)
Imaging &
PC / Industry Standard Servers
4%Printing (25%)Imaging &
PC/Access(30%)
Services (20%)
Enterprise(25%)
PC / Industry Standard Servers
10%

16
Proposed Merger will Negatively Alter Business Mix
1Data sources for market segment growth as follows: Imaging and Printing from Lyra research and IDC report entitled “U.S. Inkjet and Laser Printer Installed Base and Supplies Market Forecast and Analysis, 2000-2005,” PC and Access based on IDC PC tracker forecasts.
2Operating margins and revenue numbers based on actuals and BoA research, 2/4/02
Imagingand Printing
Access/PCs
8.3%
1.4%
0%
2%
4%
6%
8%
10%
Imagingand Printing
Access/PCs
Access/PCs
11.5%
-3.0%
-5%
0%
5%
10%
15%
Comparative Market Growth Rates for Segments1
Imaging & Printing has a much stronger outlook than PCs
Ope
ratin
g M
argi
n (%
)
’01
– ’0
5 C
AG
R
Exchanging Imaging & Printing for PCs is a bad trade
CY01 Margin Comparison2
…and is highly profitable
HP
Combined Entity – Pro Forma
HP Combined Entity – Pro Forma
Portfolio Impact
Portfolio Impact
17
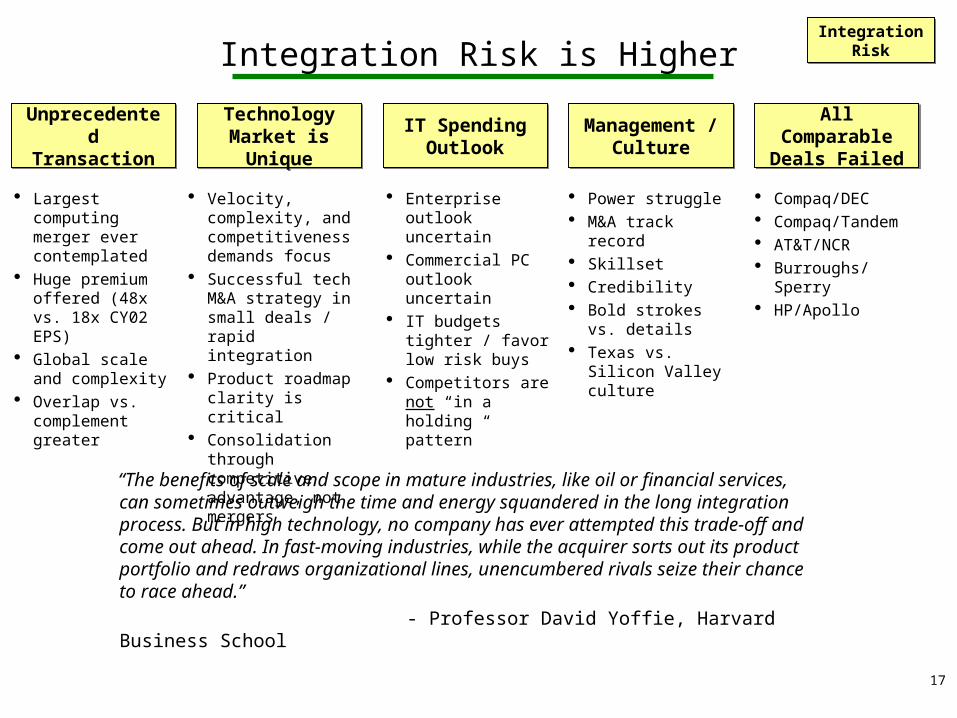
Unprecedented Transaction
Unprecedented Transaction
Integration Risk is Higher
Largest computing merger ever contemplated
Huge premium offered (48x vs. 18x CY02 EPS)
Global scale and complexity
Overlap vs. complement greater
Technology Market is Unique
Technology Market is Unique
IT Spending Outlook
IT Spending Outlook
Management / Culture
Management / Culture
All Comparable Deals Failed
All Comparable Deals Failed
Velocity, complexity, and competitiveness demands focus
Successful tech M&A strategy in small deals / rapid integration
Product roadmap clarity is critical
Consolidation through competitive advantage, not mergers
Enterprise outlook uncertain
Commercial PC outlook uncertain
IT budgets tighter / favor low risk buys
Competitors are not “in a holding pattern”
Power struggle M&A track record Skillset Credibility Bold strokes vs. details Texas vs. Silicon
Valley culture
Compaq/DEC Compaq/Tandem AT&T/NCR Burroughs/Sperry HP/Apollo
“The benefits of scale and scope in mature industries, like oil or financial services, can sometimes outweigh the time and energy squandered in the long integration process. But in high technology, no company has ever attempted this trade-off and come out ahead. In fast-moving industries, while the acquirer sorts out its product portfolio and redraws organizational lines, unencumbered rivals seize their chance to race ahead.”
- Professor David Yoffie, Harvard Business School
Integration Risk
Integration Risk

18
Compaq/DEC Value Destruction
1 Adjusted for share splits and stock dividends, the Goldman Sachs Comparable Index is comprised of companies used by Goldman in performing its “Selected Companies Analysis” in connection with rendering its fairness opinion to HP relating to HP’s proposed merger with Compaq and includes AAPL, ACN, CSC, DELL, EDS, EMC, GTW, IBM, KCIN, NTAP, SUNW, weighted by shares outstanding.
2 1998 and 1999 Standalone estimates from First Call, as of January 20, 1998(Forecast before DEC). 1998, 1999 and 2000 Combined estimates from First Call, as of August 1, 1998 (Forecast after DEC). 2002 and 2003 estimates from First Call, as of February 15, 2002. All actuals from First Call.
Since the date of the Digital acquisition, Compaq shareholders have lost 82% of their value relative to shareholders of comparable companies…and 2002 forecasted earnings are well below earnings before the acquisition
Loss in Value1
$0
$10
$20
$30
$40
$50
$60
$70
Share Price as ofJanuary 26, 1998
Increase in Value ofIndex
Loss in Value Relativeto Index
Share Price as ofFebruary 15, 2002
$29.00
$30.53
105% ($48.58)
(82%)
$10.95
Down82%
Sha
re V
alue
($)
Compaq EPS Disappointments2
$1.69
$2.16
$2.43
$0.15$0.27
$0.49
$1.35
$0.47
$1.77
$0.47$0.32
$0.97
$0.00
$0.50
$1.00
$1.50
$2.00
$2.50
$3.00
1997 1998 1999 2000 2001 2002E 2003E
Forecast before DEC Forecast after DEC Actual
Dol
lars
Integration Risk
Integration Risk
19
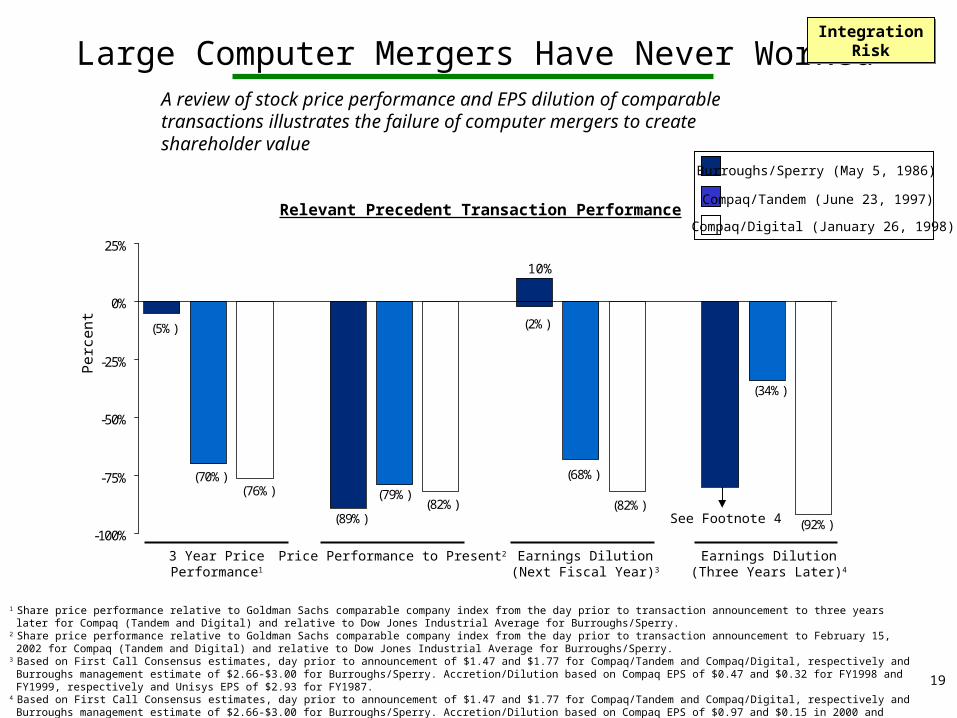
(5%)
(89%)
(2%)
(34%)
(68%)(70%)
(79%)
(92%)
(82%)(76%)
(82%)
-100%
-75%
-50%
-25%
0%
25%
Relevant Precedent Transaction Performance
Large Computer Mergers Have Never WorkedP
erce
nt
Burroughs/Sperry (May 5, 1986)
Compaq/Tandem (June 23, 1997)
Compaq/Digital (January 26, 1998)
3 Year Price Performance1 Price Performance to Present2 Earnings Dilution(Next Fiscal Year)3
Earnings Dilution(Three Years Later)4
10%
1 Share price performance relative to Goldman Sachs comparable company index from the day prior to transaction announcement to three years later for Compaq (Tandem and Digital) and relative to Dow Jones Industrial Average for Burroughs/Sperry.
2 Share price performance relative to Goldman Sachs comparable company index from the day prior to transaction announcement to February 15, 2002 for Compaq (Tandem and Digital) and relative to Dow Jones Industrial Average for Burroughs/Sperry.
3 Based on First Call Consensus estimates, day prior to announcement of $1.47 and $1.77 for Compaq/Tandem and Compaq/Digital, respectively and Burroughs management estimate of $2.66-$3.00 for Burroughs/Sperry. Accretion/Dilution based on Compaq EPS of $0.47 and $0.32 for FY1998 and FY1999, respectively and Unisys EPS of $2.93 for FY1987.
4 Based on First Call Consensus estimates, day prior to announcement of $1.47 and $1.77 for Compaq/Tandem and Compaq/Digital, respectively and Burroughs management estimate of $2.66-$3.00 for Burroughs/Sperry. Accretion/Dilution based on Compaq EPS of $0.97 and $0.15 in 2000 and 2001, respectively, as per First Call. Not meaningful for Burroughs/Sperry (later Unisys) due to loss of $(4.71) per share in FY1989, excluding non-recurring and extraordinary items.
See Footnote 4
A review of stock price performance and EPS dilution of comparable transactions illustrates the failure of computer mergers to create shareholder value
Integration Risk
Integration Risk
20
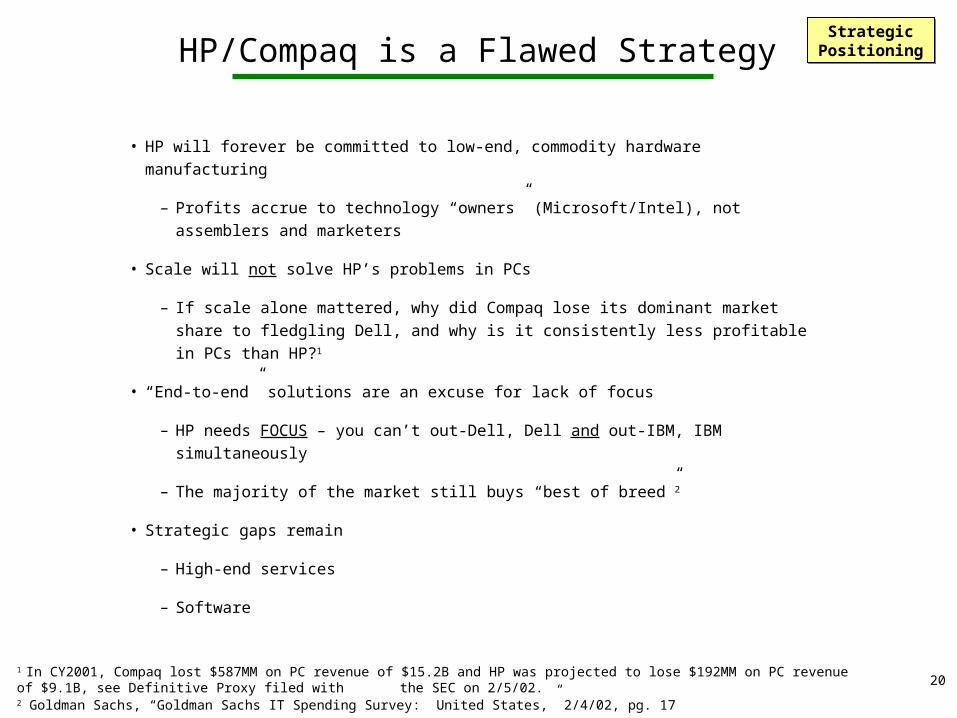
HP/Compaq is a Flawed Strategy
• HP will forever be committed to low-end, commodity hardware manufacturing
– Profits accrue to technology “owners” (Microsoft/Intel), not assemblers and
marketers
• Scale will not solve HP’s problems in PCs
– If scale alone mattered, why did Compaq lose its dominant market share to fledgling
Dell, and why is it consistently less profitable in PCs than HP?1
• “End-to-end” solutions are an excuse for lack of focus
– HP needs FOCUS – you can’t out-Dell, Dell and out-IBM, IBM simultaneously
– The majority of the market still buys “best of breed”2
• Strategic gaps remain
– High-end services
– Software
1 In CY2001, Compaq lost $587MM on PC revenue of $15.2B and HP was projected to lose $192MM on PC revenue of $9.1B, see Definitive Proxy filed with the SEC on 2/5/02.
2 Goldman Sachs, “Goldman Sachs IT Spending Survey: United States,” 2/4/02, pg. 17
Strategic PositioningStrategic
Positioning
21
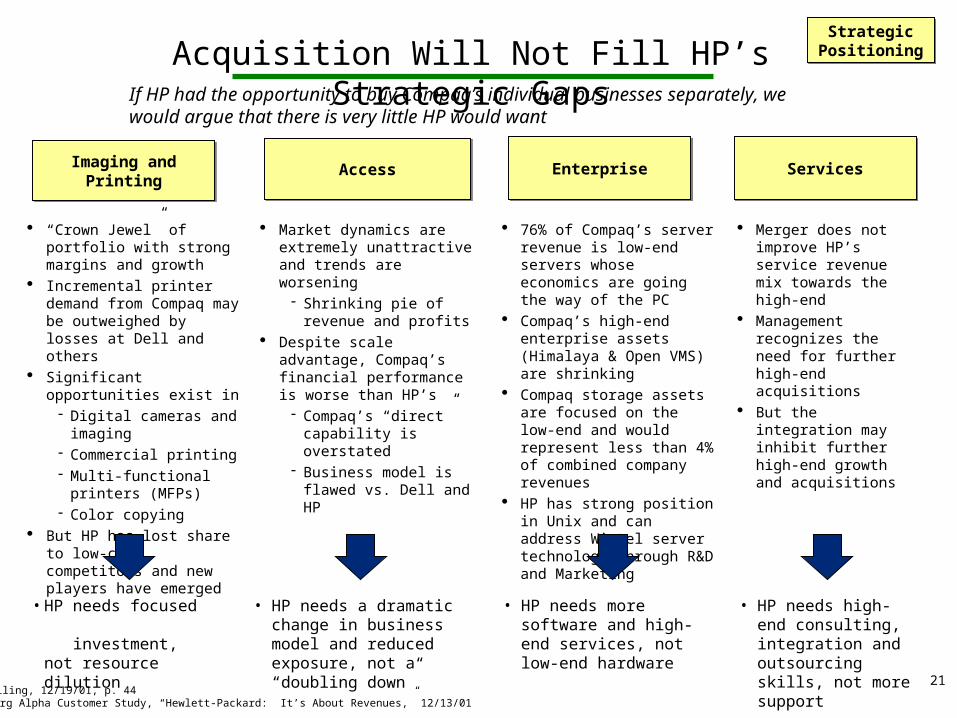
Acquisition Will Not Fill HP’s Strategic Gaps
1 HP 425 Filing, 12/19/01, p. 442 UBS Warburg Alpha Customer Study, “Hewlett-Packard: It’s About Revenues,” 12/13/01
EnterpriseEnterprise
76% of Compaq’s server revenue is low-end servers whose economics are going the way of the PC
Compaq’s high-end enterprise assets (Himalaya & Open VMS) are shrinking
Compaq storage assets are focused on the low-end and would represent less than 4% of combined company revenues
HP has strong position in Unix and can address Wintel server technology through R&D and Marketing
ServicesServices
Merger does not improve HP’s service revenue mix towards the high-end
Management recognizes the need for further high-end acquisitions
But the integration may inhibit further high-end growth and acquisitions
AccessAccess
Market dynamics are extremely unattractive and trends are worsening
Shrinking pie of revenue and profits
Despite scale advantage, Compaq’s financial performance is worse than HP’s
Compaq’s “direct” capability is overstated
Business model is flawed vs. Dell and HP
Imaging and PrintingImaging and Printing
“Crown Jewel” of portfolio with strong margins and growth
Incremental printer demand from Compaq may be outweighed by losses at Dell and others
Significant opportunities exist in Digital cameras and imaging Commercial printing Multi-functional printers
(MFPs) Color copying
But HP has lost share to low-cost competitors and new players have emerged
If HP had the opportunity to buy Compaq’s individual businesses separately, we would argue that there is very little HP would want
• HP needs focused investment, not resource dilution
• HP needs a dramatic change in business model and reduced exposure, not a “doubling down”
• HP needs more software and high-end services, not low-end hardware
• HP needs high-end consulting, integration and outsourcing skills, not more support
Strategic PositioningStrategic
Positioning

22
2001 YTD Server Market Map
Source: Factory Revenue as reported in IDC Server Tracker database for 1 st 3 quarters of 2001. Price range categories defined by IDC: “Entry” is less than $100k; “Mid-Range” is $100,000-$999,999; “High End” is $1MM+
Other
Sun
HP
Dell
IBM
Compaq
Other
Compaq
Sun
HP
IBM
Other
HP
Compaq
Sun
IBM
Entry Mid High
$18.9B $9.6B $7.8B
0%
20%
40%
60%
80%
100%
Per
cent
of
Tot
al
Total =
$36.3B
Strategic PositioningStrategic
Positioning
HP has a strong mid-range and high-end server market position while the bulk of Compaq’s volume is in the less profitable entry level category

23
OtherHitachi LTD
HDSDellSunHP
Compaq
IBM
EMC
Other
NetworkAppliance
EMC
Other
DellNECNCRSun
Compaq
IBM
HDS
Fujitsu
EMC
HP
Hitachi LTD
Other
HP
IBM
Sun
Compaq
Other
FujitsuFujitsu-Siemens
NECSun
Dell
HP
IBM
Compaq
SAN NAS DAS ExternalJBOD
Internal
$6.3B $1.8B $6.8B $2.9B $6.4BTotal =$24.2B
0%
20%
40%
60%
80%
100%
2001 Storage Market Map
External Direct Attached
External
Per
cent
of
Tot
al
1
Strategic PositioningStrategic
Positioning
Source: IDC 2001E data based on report “Worldwide Disk Storage Systems Market Forecast and Analysis, 1999-2005”, December, 2001. Internal includes internal “JBOD”. SAN is “Storage Attached Network,” NAS is “Network Attached Storage,” DAS is “direct attached storage.” Compaq is $20MM in NAS. External Direct Attached is direct attached storage excluding external JBOD and all other internal direct attached storage
Though Compaq has a decent storage business, the majority of its volume is in low-end offerings, while it is a #3 player in the high growth, high margin SAN segment
24
Other
CPQHP
Fujitsu
IBM
Other
HPCPQDeloitte & TouchePwCCap GeminiACN
CSCFujitsu
IBM
EDS
Other
HPCPQ
CSCDeloitte & Touche
FujitsuPwC
Cap GeminiACNIBM
Other
HPCPQFujitsuEDS
Deloitte& Touche
IBM
PwC
CSC
CapGemini
ACN
Support Outsourcing Systems Integration ITConsulting
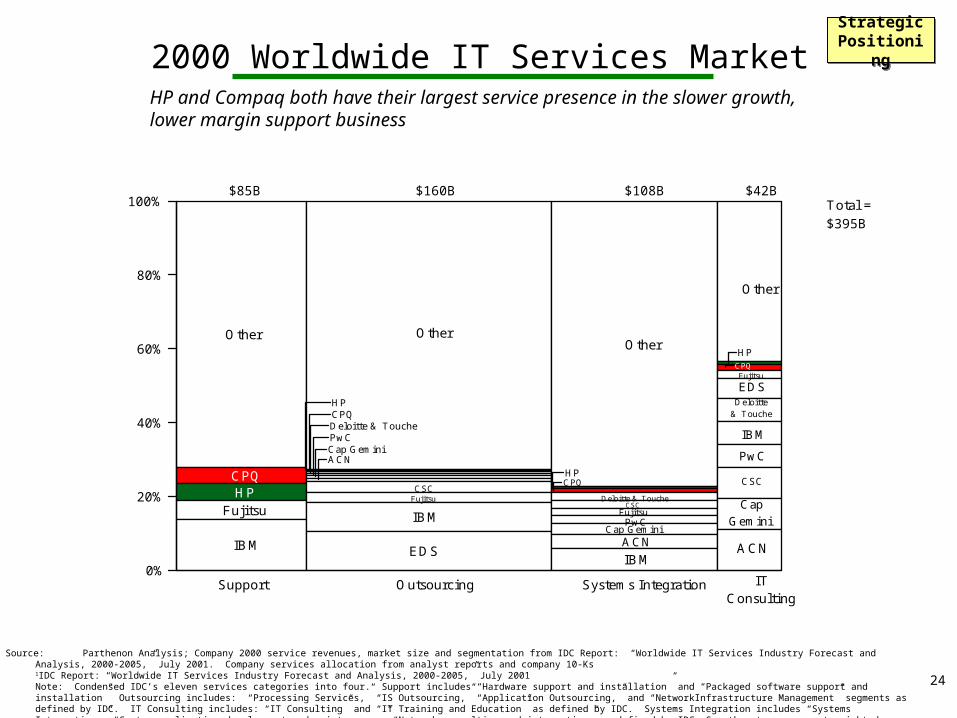
$85B $160B $108B $42BTotal =$395B
0%
20%
40%
60%
80%
100%
2000 Worldwide IT Services Market
Source: Parthenon Analysis; Company 2000 service revenues, market size and segmentation from IDC Report: “Worldwide IT Services Industry Forecast and Analysis, 2000-2005,” July 2001. Company services allocation from analyst reports and company 10-Ks1IDC Report: “Worldwide IT Services Industry Forecast and Analysis, 2000-2005,” July 2001
Note: Condensed IDC’s eleven services categories into four. Support includes “Hardware support and installation” and “Packaged software support and installation” Outsourcing includes: “Processing Services,” “IS Outsourcing,” “Application Outsourcing,” and “NetworkInfrastructure Management” segments as defined by IDC. IT Consulting includes: “IT Consulting” and “IT Training and Education” as defined by IDC. Systems Integration includes “Systems Integration,” “Custom application development and maintenance,” “Network consulting and integration” as defined by IDC. Growth rates represent weighted averages of the re-categorized groups, p. 16-31
Strategic PositioningStrategic
Positioning
HP and Compaq both have their largest service presence in the slower growth, lower margin support business
25
Section 1
Section 2
Section 3
Agenda
Opposition to the Proposed Merger is Broad and Deep
Why the Proposed Merger is Unattractive
HP Must Pursue a “Focus and Execute” Strategy

26
HP Has a Stronger Outlook without Compaq
• The integration and financial risk of the proposed merger is enormous while the upside is at best limited and probably significantly negative
• HP is a great company and will continue to thrive
– Strong earnings outlook, balance sheet and cash flow
– HP has outstanding assets in Imaging and Printing, Unix servers, its reputation and capability in the enterprise, and its brand name
– HP has reinvented itself several times
• HP has gaps but there are better and much less radical ways to address them
A vote to reject an enormously risky move is not a vote to stand still; it is a vote to move
forward and build value
A vote to reject an enormously risky move is not a vote to stand still; it is a vote to move
forward and build value

27
“It is not all or nothing” said Richard Hackborn. If HP shareholders vote against the Compaq merger “we will do everything possible to explore the next best possible alternative.”
Hackborn also stated, “‘Nobody is talking about leaving on the board, nor is anyone talking about asking anyone to leave… That has got to be taken out of the equation” for investors.
- Reuters, 2/13/02
“If the deal doesn’t pass a shareholder vote, Wayman said he’ll stay on at Hewlett-Packard and “make the best out of the businesses we have.” He said he thinks that’s true for other managers as well.”
“‘I have no intention of voluntarily resigning,’ he said.”
- Bloomberg, 1/22/02
The Board and Senior Executives are Committed to HP
28
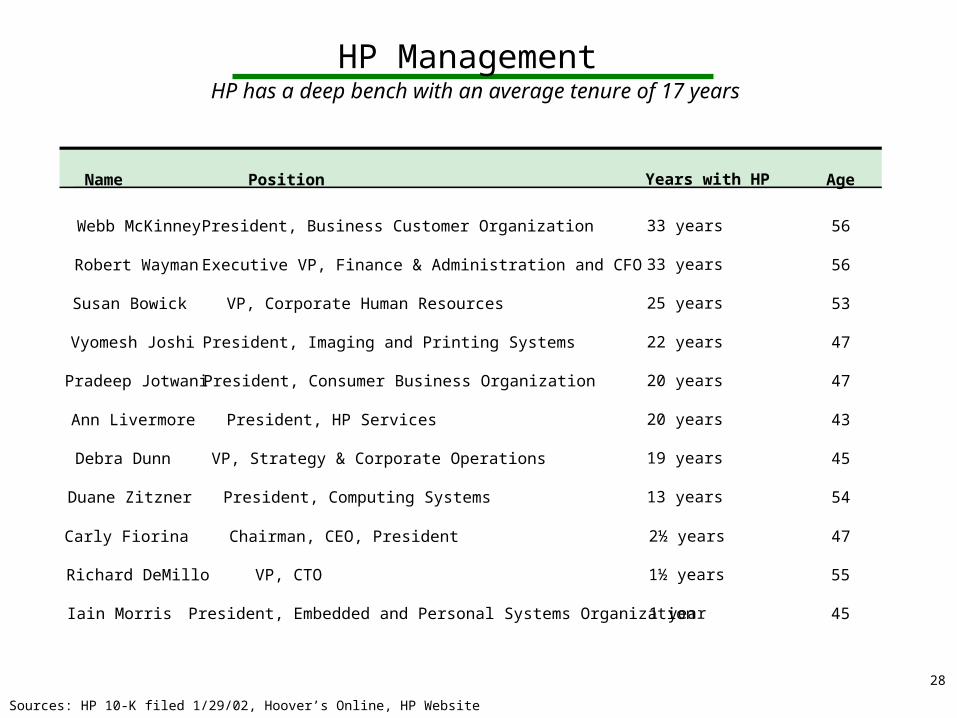
HP Management HP has a deep bench with an average tenure of 17 years
Name Position Age
Susan Bowick VP, Corporate Human Resources 53
Debra Dunn VP, Strategy & Corporate Operations 45
Vyomesh Joshi President, Imaging and Printing Systems 47
Pradeep Jotwani President, Consumer Business Organization 47
Ann Livermore President, HP Services 43
Webb McKinney President, Business Customer Organization 56
Years with HP
25 years
19 years
22 years
20 years
20 years
33 years
Robert Wayman Executive VP, Finance & Administration and CFO 5633 years
Duane Zitzner President, Computing Systems 5413 years
Sources: HP 10-K filed 1/29/02, Hoover’s Online, HP Website
Iain Morris President, Embedded and Personal Systems Organization 45
Richard DeMillo VP, CTO 55
1 year
1½ years
Carly Fiorina Chairman, CEO, President 472½ years

29
Examples of CEO Transitions
Company New CEOCompound Annual Stock Performance Since CEO Change1
Apple Fred Anderson/Steve Jobs2 31%
Mattel Robert Eckert 23%
IBM Lou Gerstner 23%
Appointment Date
7/9/97
2/3/003
3/26/93
Safeway Steve Burd 12%5/1/93
1Compound annual stock stock growth from date of CEO departure until 2/15/022 Interim committee appointed to appoint CEO. In the interim period, Fred Anderson, executive VP and CFO, acted as CEO. Steve Jobs ended up as CEO.3 Date of Jill Barad departure; Eckert assumed CEO position on 5/17/00 4 Departure of co-CEO David Mahoney5 Resignation of Carl Yankowski. Eric Benhamou chosen as interim CEO
Palm
Hyperion
McKesson
Steven Imbler
John Hammergren
Eric Benhamou
15%2/27/014
335%11/7/015
15%5/3/99

30
Transition ComparisonsA “No” vote involves much less risk than a “Yes” vote
Potential CEO transition
Re-evaluation of business from “focus and execute” perspective
Actions RequiredAfter Rejecting Merger
Actions RequiredAfter Approving Merger
Management and employee integration in 160 countries
Layoffs possibly lasting 18-24 months
Product line rationalization
Brand rationalization
Customer relationship re-building
Supply-chain integration
Supplier rationalization
Back-office systems integration
Facilities rationalization
Employee benefits combination
Reassignment of R&D resources
Stable, continuous operations under current business unit heads
Strategic focus and clarity within 6 months
Continued merger integration, lack of focus, and possible turf battles for 24 months and subsequent CEO change if it fails
31
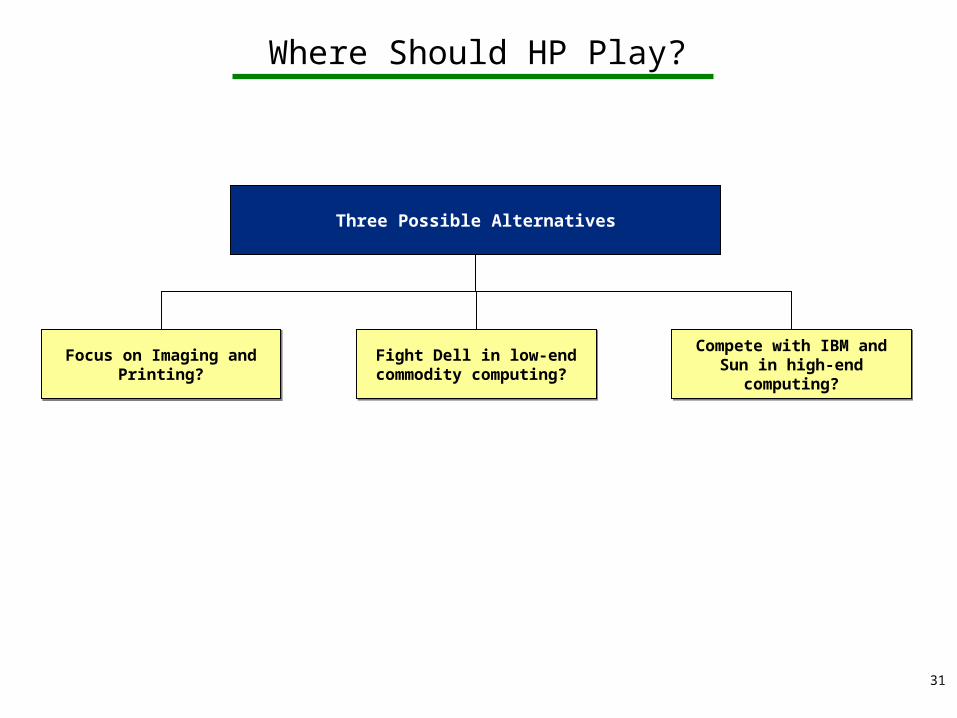
Focus on Imaging and Printing?Focus on Imaging and Printing?
Three Possible Alternatives
Fight Dell in low-end commodity computing?
Fight Dell in low-end commodity computing?
Compete with IBM and Sun in high-end computing?
Compete with IBM and Sun in high-end computing?
Where Should HP Play?
32
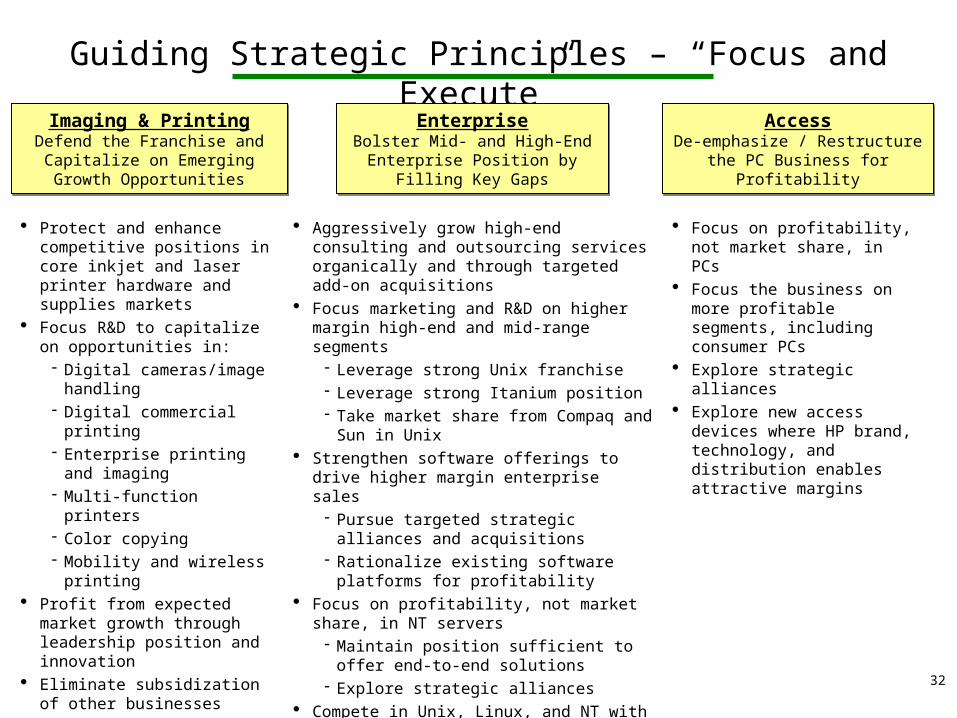
Guiding Strategic Principles – “Focus and Execute”
Imaging & PrintingDefend the Franchise and Capitalize on
Emerging Growth Opportunities
Imaging & PrintingDefend the Franchise and Capitalize on
Emerging Growth Opportunities
EnterpriseBolster Mid- and High-End Enterprise
Position by Filling Key Gaps
EnterpriseBolster Mid- and High-End Enterprise
Position by Filling Key Gaps
AccessDe-emphasize / Restructure the PC
Business for Profitability
AccessDe-emphasize / Restructure the PC
Business for Profitability
Protect and enhance competitive positions in core inkjet and laser printer hardware and supplies markets
Focus R&D to capitalize on opportunities in:
Digital cameras/image handling Digital commercial printing Enterprise printing and imaging Multi-function printers Color copying Mobility and wireless printing
Profit from expected market growth through leadership position and innovation
Eliminate subsidization of other businesses
Seriously consider spin-off within 12 to 18 months
Focus on profitability, not market share, in PCs
Focus the business on more profitable segments, including consumer PCs
Explore strategic alliances Explore new access devices where
HP brand, technology, and distribution enables attractive margins
Aggressively grow high-end consulting and outsourcing services organically and through targeted add-on acquisitions
Focus marketing and R&D on higher margin high-end and mid-range segments
Leverage strong Unix franchise Leverage strong Itanium position Take market share from Compaq and Sun in
Unix Strengthen software offerings to drive higher margin
enterprise sales Pursue targeted strategic alliances and
acquisitions Rationalize existing software platforms for
profitability Focus on profitability, not market share, in NT
servers Maintain position sufficient to offer end-to-end
solutions Explore strategic alliances
Compete in Unix, Linux, and NT with value-added services, systems
33
Imaging & Printing (43%)
Enterprise(19%)
PC/Access(21%)
Services (17%)
Imaging & Printing (46%)
Enterprise(19%)
PC/Access(16%)
Services (19%)
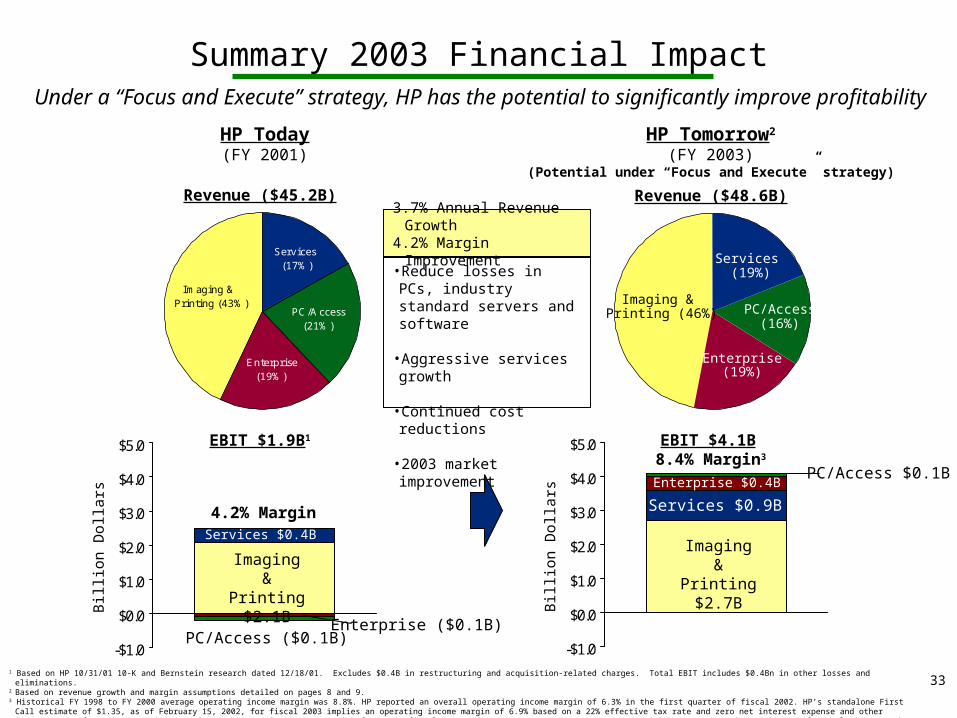
Summary 2003 Financial Impact
HP Today(FY 2001)
HP Tomorrow2
(FY 2003)(Potential under “Focus and Execute” strategy)
Revenue ($45.2B) Revenue ($48.6B)
EBIT $1.9B1 EBIT $4.1B 8.4% Margin3
-$1.0
$0.0
$1.0
$2.0
$3.0
$4.0
$5.0
Services $0.4B
Imaging & Printing $2.1B
PC/Access ($0.1B)Enterprise ($0.1B)
Enterprise $0.3B
1 Based on HP 10/31/01 10-K and Bernstein research dated 12/18/01. Excludes $0.4B in restructuring and acquisition-related charges. Total EBIT includes $0.4Bn in other losses and eliminations.2 Based on revenue growth and margin assumptions detailed on pages 8 and 9.3 Historical FY 1998 to FY 2000 average operating income margin was 8.8%. HP reported an overall operating income margin of 6.3% in the first quarter of fiscal 2002. HP’s standalone First Call estimate of $1.35, as of February 15, 2002, for fiscal 2003 implies an operating
income margin of 6.9% based on a 22% effective tax rate and zero net interest expense and other income. Banc of America Securities projects an operating income margin of 7.4% in fiscal 2003 under management’s current strategy and incorporates estimated impact of pre-closing negative revenue synergies.
Under a “Focus and Execute” strategy, HP has the potential to significantly improve profitabilityB
illi
on D
olla
rs 4.2% Margin
3.7% Annual Revenue Growth4.2% Margin Improvement
•Reduce losses in PCs, industry standard servers and software
•Aggressive services growth
•Continued cost reductions
•2003 market improvement
-$1.0
$0.0
$1.0
$2.0
$3.0
$4.0
$5.0
Enterprise $0.4B
Imaging & Printing $2.7B
PC/Access $0.1B
Bil
lion
Dol
lars Services $0.9B
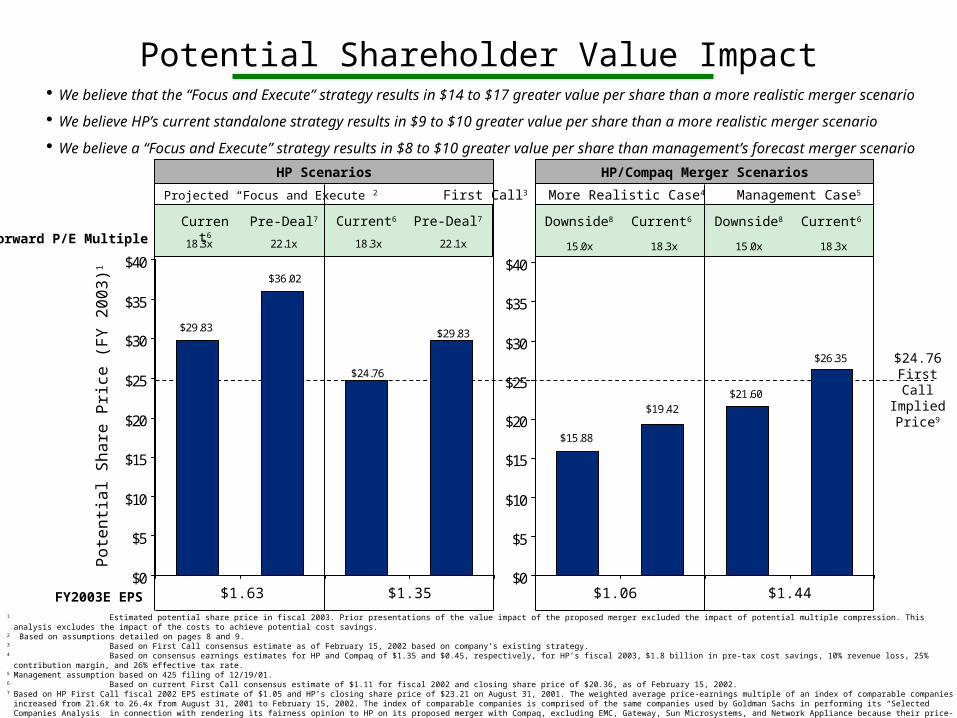
Projected “Focus and Execute”2 First Call3
$29.83
$24.76
$36.02
$29.83
$0
$5
$10
$15
$20
$25
$30
$35
$4018.3x 22.1x 18.3x 22.1x
Potential Shareholder Value ImpactP
oten
tial
Sha
re P
rice
(F
Y 2
003)
1
HP Scenarios HP/Compaq Merger Scenarios
1 Estimated potential share price in fiscal 2003. Prior presentations of the value impact of the proposed merger excluded the impact of potential multiple compression. This analysis excludes the impact of the costs to achieve potential cost savings. 2 Based on assumptions detailed on pages 8 and 9.3 Based on First Call consensus estimate as of February 15, 2002 based on company’s existing strategy.4 Based on consensus earnings estimates for HP and Compaq of $1.35 and $0.45, respectively, for HP’s fiscal 2003, $1.8 billion in pre-tax cost savings, 10% revenue loss, 25% contribution margin, and 26% effective tax rate.5 Management assumption based on 425 filing of 12/19/01.6 Based on current First Call consensus estimate of $1.11 for fiscal 2002 and closing share price of $20.36, as of February 15, 2002.7 Based on HP First Call fiscal 2002 EPS estimate of $1.05 and HP’s closing share price of $23.21 on August 31, 2001. The weighted average price-earnings multiple of an index of comparable companies increased from 21.6x to 26.4x from August 31, 2001 to February 15, 2002. The index of
comparable companies is comprised of the same companies used by Goldman Sachs in performing its “Selected Companies Analysis” in connection with rendering its fairness opinion to HP on its proposed merger with Compaq, excluding EMC, Gateway, Sun Microsystems, and Network Appliance because their price-earnings ratios were not meaningful as of February 15, 2002.
8 Based on lowest end of price-earnings multiple range used in December 19, 2001, HP Position on Compaq Merger presentation, page 29.9 Based on HP’s current fiscal 2002 price-earnings multiple of 18.3x applied to HP’s current First Call consensus earnings estimate of $1.35 for fiscal 2003.
More Realistic Case4 Management Case5
Forward P/E Multiple
FY2003E EPS $1.63 $1.35 $1.06 $1.44
$24.76First Call
Implied Price9
$26.35
$21.60$19.42
$15.88
$0
$5
$10
$15
$20
$25
$30
$35
$4015.0x 18.3x 15.0x 18.3x
Current6 Pre-Deal7 Downside8 Current6Current6 Pre-Deal7 Downside8 Current6
We believe that the “Focus and Execute” strategy results in $14 to $17 greater value per share than a more realistic merger scenario
We believe HP’s current standalone strategy results in $9 to $10 greater value per share than a more realistic merger scenario
We believe a “Focus and Execute” strategy results in $8 to $10 greater value per share than management’s forecast merger scenario

35
Projected Return on Equity
0%
1%
2%
3%
4%
5%
6%
HP Compaq
0.50
0.75
1.00
1.25
1.50
HP Compaq
0.0%
5.0%
10.0%
15.0%
20.0%
HP HP/Compaq More RealisticHP/Compaq
10.0
12.5
15.0
17.5
20.0
HP Compaq
Potential Multiple Compression
Historical Price-Earnings Multiple
Historical Beta (Equity Risk)
1 On 9/5/01, Moody’s downgraded HP from Aa3 to A2, and placed Compaq under review for possible upgrade from Baa2. S&P placed ratings watch on HP with negative implications and on Compaq with positive implications on 9/4/01.2 Compaq missed its 2000 and 2001 earnings forecasts at the beginning of each year by 11.0% and 87.3% whereas HP missed by 1.1% and 63.5% for the same periods.3 Based on average next twelve months price earnings multiple from StockVal data from 10/25/91 to 8/31/01.4 Based on management projections contained in 425 filing dated 12/19/01.5 Based on realistic case pro forma EPS (see page 8 and 9 for detailed assumptions) excluding pro forma amortization of intangibles.6 Based on monthly Barra predicted beta from 12/92 to 9/01.7 Based on First Call revenue estimates for each company’s fiscal 2003 as of 2/15/02.
17.9x
P/E
8.7%Per
cent
1.18
1.46
Bet
a
Projected Revenue Growth
2.3%Per
cent
16.1x
18.1%
4.7%
3
6 7
We believe that merged HP/Compaq would trade at a discount to HP given the new entity’s lower returns on equity, lower revenue growth, higher beta, lower credit rating1, and less predictable earninings2
16.5%
5
4 4
36
0%
2%
4%
6%
8%
10%
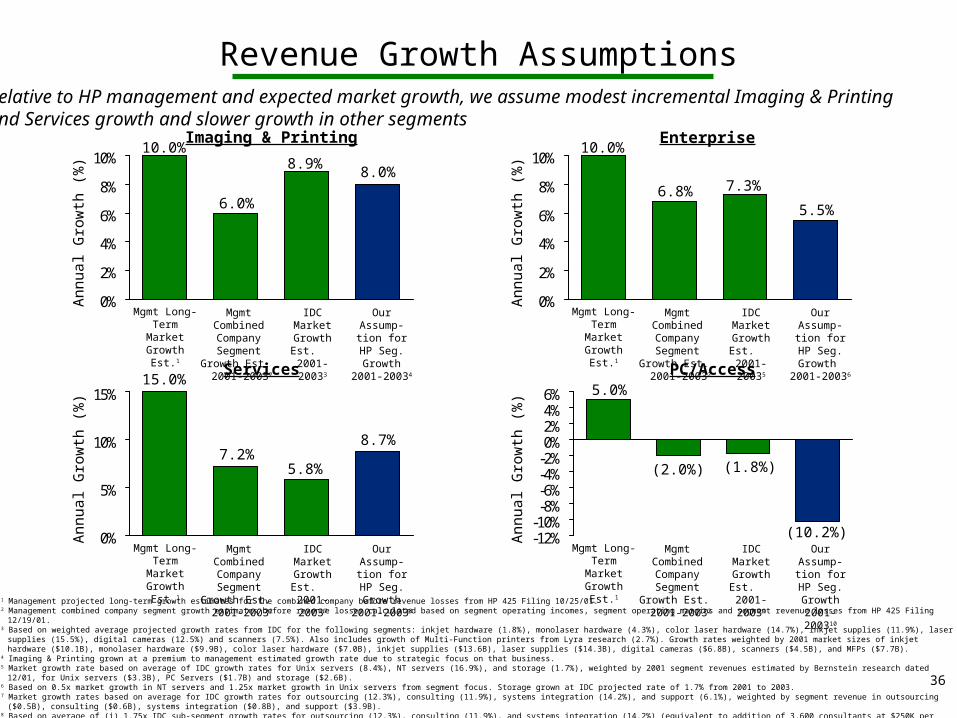
Revenue Growth Assumptions
Imaging & Printing Enterprise
Services
6.0%
8.0%
Ann
ual G
row
th (
%)
PC/Access
Relative to HP management and expected market growth, we assume modest incremental Imaging & Printing and Services growth and slower growth in other segments
8.9%10.0%
Mgmt Long-Term Market Growth Est.1
Mgmt Combined Company
Segment Growth Est. 2001-20032
IDC Market Growth Est. 2001-20033
Our Assump-tion for HP
Seg. Growth 2001-20034
0%
2%
4%
6%
8%
10%
6.8%5.5%
Ann
ual G
row
th (
%)
7.3%
10.0%
Mgmt Long-Term Market Growth Est.1
Mgmt Combined Company
Segment Growth Est. 2001-20032
IDC Market Growth Est. 2001-20035
Our Assump-tion for HP
Seg. Growth 2001-20036
0%
5%
10%
15%
7.2%8.7%
Ann
ual G
row
th (
%)
5.8%
15.0%
Mgmt Long-Term Market Growth Est.1
Mgmt Combined Company
Segment Growth Est. 2001-20032
IDC Market Growth Est. 2001-20037
Our Assump-tion for HP
Seg. Growth 2001-20038
-12%-10%-8%-6%-4%-2%0%2%4%6%
(2.0%)
(10.2%)A
nnua
l Gro
wth
(%
)
(1.8%)
5.0%
Mgmt Long-Term Market Growth Est.1
Mgmt Combined Company
Segment Growth Est. 2001-20032
IDC Market Growth Est. 2001-20039
Our Assump-tion for HP
Seg. Growth 2001-200310
1 Management projected long-term growth estimates for the combined company before revenue losses from HP 425 Filing 10/25/01. 2 Management combined company segment growth estimates before revenue losses calculated based on segment operating incomes, segment operating margins and segment revenue losses from HP 425 Filing 12/19/01.3 Based on weighted average projected growth rates from IDC for the following segments: inkjet hardware (1.8%), monolaser hardware (4.3%), color laser hardware (14.7%), inkjet supplies (11.9%), laser supplies (15.5%), digital cameras (12.5%) and scanners (7.5%). Also includes growth of
Multi-Function printers from Lyra research (2.7%). Growth rates weighted by 2001 market sizes of inkjet hardware ($10.1B), monolaser hardware ($9.9B), color laser hardware ($7.0B), inkjet supplies ($13.6B), laser supplies ($14.3B), digital cameras ($6.8B), scanners ($4.5B), and MFPs ($7.7B).
4 Imaging & Printing grown at a premium to management estimated growth rate due to strategic focus on that business.5 Market growth rate based on average of IDC growth rates for Unix servers (8.4%), NT servers (16.9%), and storage (1.7%), weighted by 2001 segment revenues estimated by Bernstein research dated 12/01, for Unix servers ($3.3B), PC Servers ($1.7B) and storage ($2.6B). 6 Based on 0.5x market growth in NT servers and 1.25x market growth in Unix servers from segment focus. Storage grown at IDC projected rate of 1.7% from 2001 to 2003. 7 Market growth rates based on average for IDC growth rates for outsourcing (12.3%), consulting (11.9%), systems integration (14.2%), and support (6.1%), weighted by segment revenue in outsourcing ($0.5B), consulting ($0.6B), systems integration ($0.8B), and support ($3.9B).8 Based on average of (i) 1.75x IDC sub-segment growth rates for outsourcing (12.3%), consulting (11.9%), and systems integration (14.2%) (equivalent to addition of 3,600 consultants at $250K per consultant per year) and (ii) Bernstein estimates for HP 2000 to 2001 growth rate in support
(6.1%), weighted by segment revenue in outsourcing ($0.5B), consulting ($0.6B), systems integration ($0.8B), and support ($3.9B). Financing ($1.9B) projected with flat growth to 2003. 9 Market growth based on IDC 2001 PC Tracker. 10Based on HP growth at IDC 2001 PC Tracker segment growth rates for consumer and notebook segments, and assuming a 50% contraction of business desktops based on focus strategy.
37
-2%
-1%
0%
1%
2%
3%
4%
1998-2000Average
FY 2001 Q1 FY 2002
0%2%4%
6%8%
10%12%
14%16%
1998-2000Average
FY 2001 Q1 FY 2002
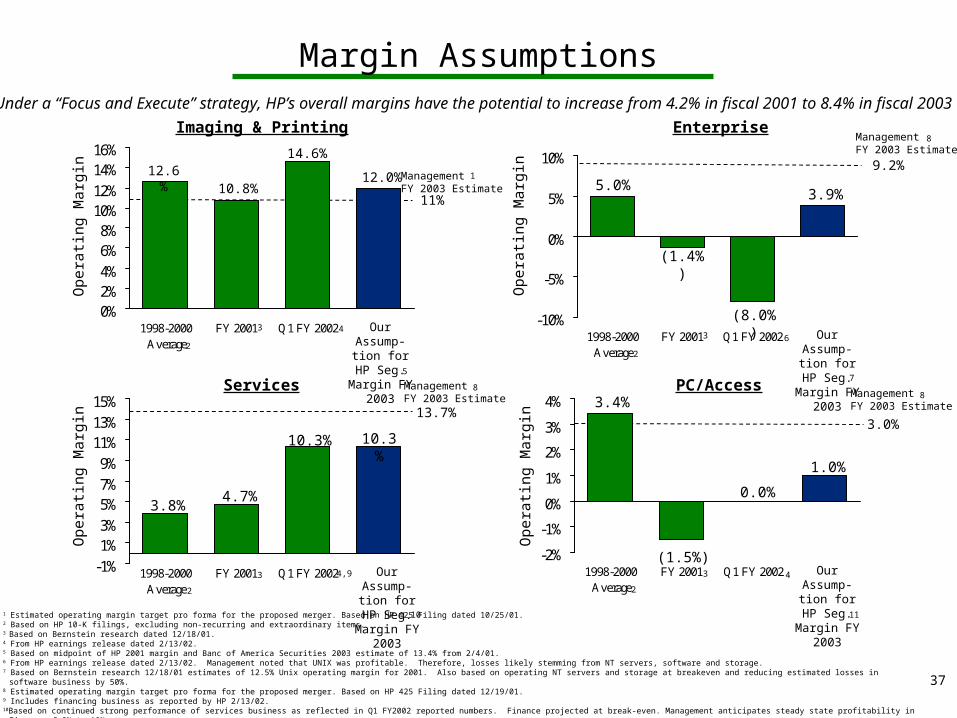
Margin Assumptions
Imaging & Printing Enterprise
Services
Services $0.8B
12.6% 12.0%
Ope
rati
ng M
argi
n
-10%
-5%
0%
5%
10%
1998-2000Average
FY 2001 Q1 FY 2002
(1.4%)
3.9%
Ope
rati
ng M
argi
n
-1%
1%3%
5%7%
9%
11%13%
15%
1998-2000Average
FY 2001 Q1 FY 2002
3.8%
10.3%
Ope
rati
ng M
argi
n
PC/Access
(1.5%)
1.0%
Ope
rati
ng M
argi
n
10.8% 5.0%
4.7%
3.4%
Under a “Focus and Execute” strategy, HP’s overall margins have the potential to increase from 4.2% in fiscal 2001 to 8.4% in fiscal 2003
ManagementFY 2003 Estimate
11%
ManagementFY 2003 Estimate
9.2%
ManagementFY 2003 Estimate
13.7%
ManagementFY 2003 Estimate
3.0%
7
10
1
8
88
2
3
5
2
3
2
3
11
2
3
4
14.6%
(8.0%)
6
10.3%
4,9
0.0%
4
1 Estimated operating margin target pro forma for the proposed merger. Based on HP 425 Filing dated 10/25/01.2 Based on HP 10-K filings, excluding non-recurring and extraordinary items.3 Based on Bernstein research dated 12/18/01.4 From HP earnings release dated 2/13/02. 5 Based on midpoint of HP 2001 margin and Banc of America Securities 2003 estimate of 13.4% from 2/4/01.6 From HP earnings release dated 2/13/02. Management noted that UNIX was profitable. Therefore, losses likely stemming from NT servers, software and storage.7 Based on Bernstein research 12/18/01 estimates of 12.5% Unix operating margin for 2001. Also based on operating NT servers and storage at breakeven and reducing estimated losses in software business by 50%.8 Estimated operating margin target pro forma for the proposed merger. Based on HP 425 Filing dated 12/19/01.9 Includes financing business as reported by HP 2/13/02.10Based on continued strong performance of services business as reflected in Q1 FY2002 reported numbers. Finance projected at break-even. Management anticipates steady state profitability in Finance of 8% to 10%.11Based on average of 12/18/01 Bernstein research 2000 and 2001 estimated Access segment operating margins, weighted by segment revenue breakdown, and accounting for 50% reduction in commercial PCs per footnote 10 in prior slide.
Our Assump-tion for HP Seg. Margin
FY 2003
Our Assump-tion for HP Seg. Margin
FY 2003
Our Assump-tion for HP Seg. Margin
FY 2003
Our Assump-tion for HP Seg. Margin
FY 2003
38
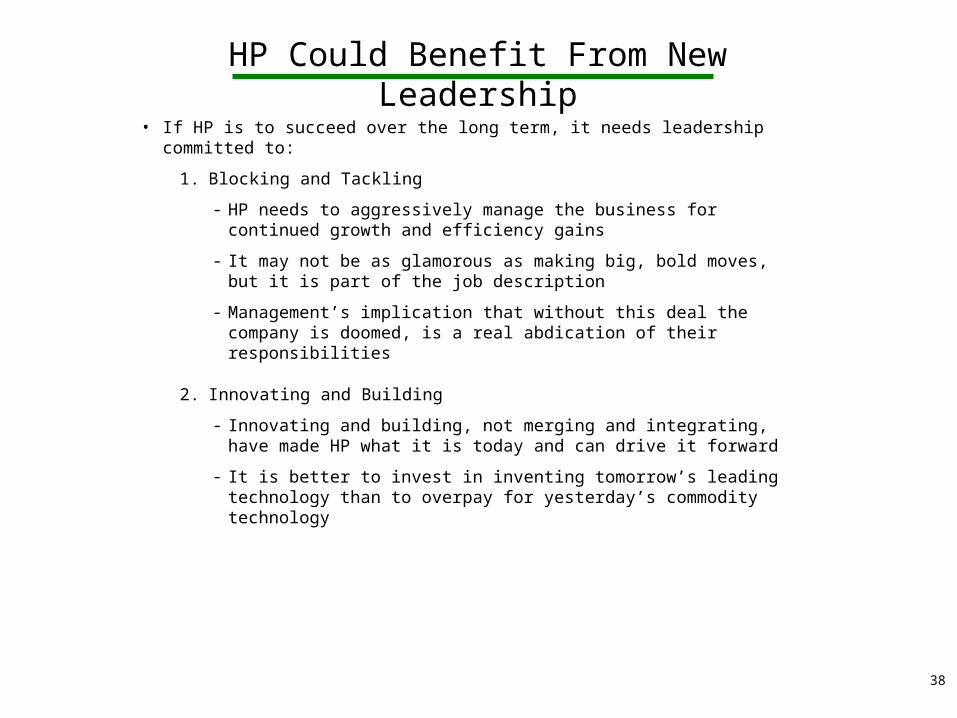
HP Could Benefit From New Leadership
• If HP is to succeed over the long term, it needs leadership committed to:
1. Blocking and Tackling
- HP needs to aggressively manage the business for continued growth and efficiency gains
- It may not be as glamorous as making big, bold moves, but it is part of the job description
- Management’s implication that without this deal the company is doomed, is a real abdication of their responsibilities
2. Innovating and Building
- Innovating and building, not merging and integrating, have made HP what it is today and can drive it forward
- It is better to invest in inventing tomorrow’s leading technology than to overpay for yesterday’s commodity technology
39
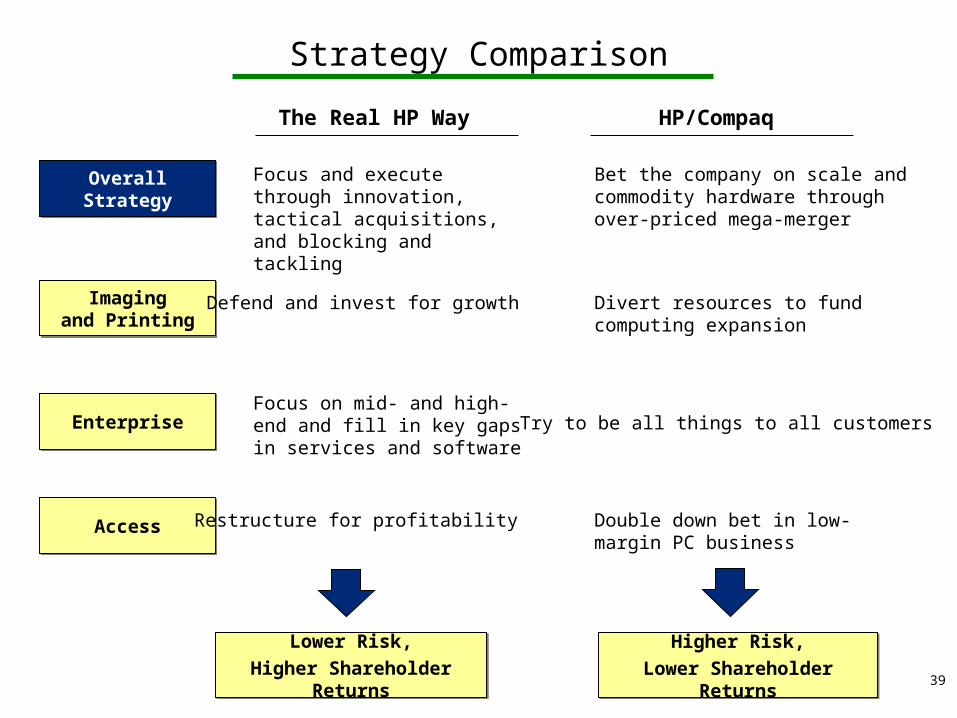
Strategy Comparison
The Real HP Way HP/Compaq
OverallStrategyOverallStrategy
Imagingand Printing
Imagingand Printing
EnterpriseEnterprise
AccessAccess
Focus and execute through innovation, tactical acquisitions, and blocking and tackling
Bet the company on scale and commodity hardware through over-priced mega-merger
Defend and invest for growth Divert resources to fund computing expansion
Focus on mid- and high-end and fill in key gaps in services and software Try to be all things to all customers
Restructure for profitability Double down bet in low-margin PC business
Higher Risk,
Lower Shareholder Returns
Higher Risk,
Lower Shareholder Returns
Lower Risk,
Higher Shareholder Returns
Lower Risk,
Higher Shareholder Returns

40
On February 5, 2002, Walter B. Hewlett, Edwin E. van Bronkhorst and the William R. Hewlett Revocable Trust (collectively, the “Filing Persons”) filed a definitive proxy statement with the Securities and Exchange Commission relating to their opposition to the proposed merger involving Hewlett-Packard Company and Compaq Computer Corporation. The Filing Persons urge stockholders to read their definitive proxy statement because it contains important information. You may obtain a free copy of the Filing Persons’ definitive proxy statement and other soliciting materials on the Securities and Exchange Commission’s website at www.sec.gov, at the Filing Persons’ website at www.votenohpcompaq.com, or by contacting MacKenzie Partners at 1-800-322-2885 or 1-212-929-5500, or by sending an email to [email protected].
Additional Information