why has burundi grown so slowly? - · pdf filewhy has burundi grown so slowly? ... the...
TRANSCRIPT

WHY HAS BURUNDI GROWN SO SLOWLY?†
Janvier D. Nkurunziza
UNECA, Addis Ababa, ETHIOPIA
e-mail: [email protected]
and
Floribert Ngaruko
Université de Nice-Sophia Antipolis
e-mail: [email protected]
This Draft: March 2005
Abstract:
This study analyses Burundi’s economic performance over the period 1960-2000 and finds that it has been catastrophic. The usual economic factors determining growth are endogenous to political objectives, suggesting that politics explains the dismal performance. This finding limits the relevance of textbook models of growth relying on the assumption of a competitive resource allocation environment. When cronies rather than qualified managers are running the economy, when priority is given to investment projects in function of their location rather than the objective needs of the economy, economic models lose their explanatory power. Economic performance has been shaped by the occurrence of violent conflicts caused by factions fighting for the control of the state and its rents. The capture of rents by a small group has become the overarching objective of the governments that have ruled the country since the mid-1960s. In this regard, economic performance will not improve unless the political system is modernised from a dictatorial regime playing a zero-sum game to a more democratic and accountable regime. It would be naïve to advocate economic reforms as a way of boosting the country’s economy if they are not preceded or at least accompanied by political reforms. One central message of this study is that Burundi’s growth failure is the result of specific identifiable factors evolving around governance. There is nothing fundamentally wrong with Burundi: Development failure may be reversed if the problems identified in this study are properly addressed.
† This chapter is based on a study carried out in the framework of the AERC Global Project on “Explaining Africa’s Growth Performance”. AERC’s financial assistance is gratefully acknowledged. The study greatly benefited from comments by Jan W. Gunning on several drafts; his contribution is highly appreciated. We also thank Léonce Ndikumana, William Easterly, Randall Filer, Vittorio Corbo, Paul Collier, Robert Bates, Steven O’Connell, Charles Soludo, Dominique Njinkeu and all those who provided comments at the conferences where the paper has been presented: GDN conference in Brazil; HILR at Harvard University; CGD in Washington, D.C.; AERC in Nairobi, Kenya; University of Ngozi in Burundi; and American University in Washington, D.C., USA. However, the authors alone remain responsible for the study’s contents.

1
1. Introduction
Burundi is a ‘low opportunity’ economy. The country is small and overpopulated with more
than 6 million people divided into three ethnic groups: the Hutus (about 84 percent), the
Tutsis (about 15 percent) and the Twas (1 percent).1 With an urbanisation rate of only 7
percent, Burundi is essentially rural. Furthermore, Burundi’s location in the tropics, where
malaria and other debilitating tropical diseases are prevalent, imposes a heavy constraint on
the country’s development potential.2 In addition, Burundi is landlocked and dependent on
its neighbours’ wrecked road and rail infrastructure in the conduct of its international trade.
The country’s isolation within a geographically isolated continent (Fafchamps, 2003)
compounds the challenges to Burundi’s economic growth.
Instead of responding to the country’s adverse natural environment by adopting pro-
growth policies, Burundi leadership have isolated the country even further through its
catastrophic governance. The main argument developed in this chapter is that from the early
1960s, poor governance has been at the heart of Burundi’s dismal economic performance.
Putting the state at the centre of economic activity the ruling elite have ensured that their
hold on political power guarantees them total control over the economy and its rents.
Although the country is poor there are ‘rents to sovereignty’ that have motivated policy
choices. The sovereign has appropriated part of foreign aid and international borrowing. The
leaders have allocated public investment and public employment to benefit members of their
group. Even taxation of the domestic economy and the organisation of markets have been
1 These figures as well as the notion of ethnicity should be taken with caution. All Burundians speak the same language (Kirundi), share the same culture, live side by side in the different regions of the country and do not present systematic physiological features differentiating them. The differences between groups may have to do with ‘imagined identities’ rather than the usual factors used to empirically define ethnic groups [see Horowitz, 1985]. This caveat should be kept in mind when interpreting ethnicity in Burundi. 2 Easterly and Levine (2003) provide an interesting contrast between Burundi and Canada in terms of the two countries’ geographic location and physical environment.

2
shaped not to encourage production and growth but to generate rents enjoyed by those in
power.
As a result, the traditional economic determinants of growth such as investment and
human capital have been endogenous to political imperatives. In response to the predatory
policies pursued by the successive governments, households have retreated into a
subsistence economy while the modern private sector has remained rudimentary.
Consequently, Burundi’s economic performance over the last four decades has been
catastrophic, even by African standards. In absolute terms, GDP per capita fell from about
620 dollars to 370 dollars between 1960 and 1998.
Most of post-colonial Burundi’s history has been dominated by military dictatorships.
Three military Tutsi presidents from Rutovu, a commune of the Southern province of
Bururi, have been at the helm of the country for 34 years out of 41 since the country’s
independence in 1962.3 Increasingly, the leadership’s greed and poor governance have
generated grievances which, in turn, have led to a cycle of civil wars. From independence,
the country has recorded five episodes of civil war that have claimed more than 500,000 lives
and have produced about a million refugees. The latest civil war has been raging for ten years
so it is hardly surprising that the country’s economy is currently in tatters.
This chapter is organised in four blocks. Firstly, it reviews Burundi’s growth based on
the traditional macroeconomic analysis to highlight the limitation of this approach and to
show the position of Burundi relative to other developing regions. Secondly, the chapter
discusses how the organisation of market institutions by the state has been responsible for
the poor performance of the economy. Thirdly, the behaviour of agents, both firms and
3 Lack of information on the period before 1960 did not allow us to start the analysis from 1950. Even for the period 1960 to 1970, statistical information is sketchy.
3
households, faced with a discouraging environment, is analysed. Lastly, the chapter develops
a political economy argument to explain why Burundi’s economy has performed so poorly
and why the leadership hardly cared.
The chapter contributes to the literature on Africa’s growth in many respects. Firstly, it
is the first comprehensive study of Burundi’s growth experience we are aware of. Secondly,
the chapter shows the central role played by politics in explaining the lack of growth and its
underlying characteristics such as equity, poverty and income distribution. Thirdly, the
chapter clarifies the nature of one of the most misunderstood conflicts in Africa by showing
that the simplistic interpretation of the Burundi conflicts as ethnic contests is flawed.
Different groups fight to control important economic rents and they use ethnicity as an
instrument for their propaganda.
2. Burundi Growth in a Comparative Perspective
This section provides, first, a brief historical background of Burundi’s pre-independence
growth performance. Secondly it proposes three episodes of the growth experience and,
thirdly, it discusses the results of growth accounting in comparison with other developing
regions.
2.1. Historical Background
Before independence, Burundi’s economy was integrated with those of Rwanda and Congo,
the three Belgian colonies, using Bujumbura as the industrial base serving Burundi, Rwanda
and Eastern Congo. Until Congo’s independence in 1960, this area used the same currency.
Congo adopted its own currency after independence in 1960 but Burundi and Rwanda

4
currency union was terminated only in 1964, two years after the two countries’ independence
in 1962.4 As economic independence was thought to give teeth to political independence,
Rwanda and Eastern Congo decided to create their own industries. Disintegration of the
common market was damaging to Burundi’s economy. Following the loss of the Rwandese
and Eastern Congolese markets in addition to the loss of qualified manpower after the
Belgians left Burundi, firm capacity utilisation dropped to about 25-50 percent in 1962-63
(Ngaruko, 1993).
At the political level, Belgium’s colonial’s policy was based on divide et impera. Playing
the Hutus against the Tutsis reinforced group distinctions that had traditionally been
relatively innocuous. The Hutu versus Tutsi existed before colonisation, and to a large
extent, the Tutsi ethnic group enjoyed relatively more economic privileges and political
power. However, this state of play was institutionally regulated through sophisticated rules
that tempered the exclusion of Hutus. The colonial power institutionalised the domination
of Hutus by Tutsis through extremely rigid rules and policies clearly biased against the
Hutus.
For instance, in the 1920s, there were 27 Hutu chiefs ruling Hutus and Tutsis alike in
their chiefdoms. In 1945, after a colonial administrative reform implemented from the late
1920s, all Hutu chiefs had been replaced (Reyntjens, 1994). In the same vein, Belgian
‘scholars’ went out of their way to show that Tutsis were a superior race born to rule while
Hutus were inferior (de Lespinay, 2000). It is ironic that instead of dismissing the colonial
propaganda, many Hutus and Tutsis, especially the elites, were made to believe it. This
perception of the superiority/inferiority of the two groups has shaped their relations ever
4 See Nkurunziza (2001) for a summary of Burundi’s monetary history.
5
since. In the 1950s, there was a change of heart. Belgium turned against the Tutsis,
apparently because they adopted a more open rebellious attitude towards the colonial power.
Belgium’s education policy in Burundi reflected the perceptions of the colonial
masters. For every Hutu student admitted in Butare colonial institute, there were 5 Tutsi
students in 1932, 15 in 1945, 3 in 1954 and 2 in 1959 (Lemarchand, 1994). Not surprisingly,
at independence in 1962, some Tutsi leaders believed they had special prerogatives to rule
the country. Moreover, the removal of Tutsis from leadership in Rwanda in the 1959
Belgian-orchestrated bloody social revolution profoundly affected Burundi. With the same
ethnic configuration as in Rwanda, Burundi could not remain unscathed by the events. Not
only did the country play host to vast numbers of Tutsi refugees who attempted to
destabilise Rwanda a few years later, but Tutsi and Hutus in Burundi started seeing each
other through the Rwandese prism.
Radical Hutu leaders in Burundi saw it as the model to replicate arguing that their
numeric majority should guarantee them de facto control of political (and hence economic)
power. On the other hand, most Tutsi leaders viewed the events in Rwanda as the scenario
to avoid by all means arguing that power in the hands of the Hutus would inexorably lead to
their extermination.5 This fundamental difference of perception explains, to date, the cycle
of wars in Burundi and the actions of many within Burundi’s elites in both groups.
Despite Belgian efforts to divide Burundians, the struggle for independence assembled
politicians from the two major ethnic groups in UPRONA, a nationalist partly founded and
led by Prince Louis Rwagasore. The party won legislative elections in September 1961
leading to independence on 1 July 1962. UPRONA was largely built on democratic values
5The 1994 Rwandan genocide has somehow vindicated those holding this view.
6
and included Hutus as well as Tutsis in its highest leadership structures. The assassination of
Rwagasore in October 1961 and the political crisis that ensued changed the political
atmosphere in the country. King Mwambutsa IV lost control and the unity Rwagasore had
instilled in his followers gave place to merciless political fights among the political elites.
For most of the 1960s and early 1970s, politicians were so busy fighting against each
other that they devoted little time to economic growth. Rarely did governments between
1962 and the early 1970s last for more than a year. Amid this chaos, it was easier for political
elites to seek an immediate gain than speculate on some uncertain long-term or even
medium-term economic benefit they would get by fostering economic growth. In retrospect,
it is clear that this period set the standards for political competition and economic
management for the following decades. Short-term gain and predatory politics have
remained the most distinctive characteristics of Burundi’s political culture.
2.2. Periodization of Burundi Growth Experience
Burundi’s economic policies evolved in thee different periods. The period from 1960 to
1972 is characterised by policy instability resulting in economic decline. The second period
from 1972 to 1988 saw the expansion of the basis for economic rents to cater for the needs
of young members of the elite. Per capita GDP increased but the cost was massive
borrowing and alarming inefficiencies. The third period from 1988 to date is characterised by
war and an unprecedented economic crisis. A brief discussion of each period follows.
7
1960-1972: Institutional Instability and Economic Decline
Most of the factors explaining economic decline during this period were a consequence of
the chaotic departure of Belgians from their three colonies. Firstly, the legacy of high ethnic
tensions inherited from the Belgians paralysed institutions culminating, in 1965, in the first
large-scale political violence. Secondly, as already noted, Congo and Rwanda’s independence
spelt the end of the economic union, resulting in the loss of most of Burundi’s export
markets. Large trade deficits ensued. Thirdly, the scarcity of qualified manpower and capital
stock following decolonisation resulted in a sluggish economy, especially within the modern
sector. During this period, Burundi’s economic growth was lower than the African average
and much lower than the average for Asian highly performing countries.
1972-1988: Political Repression and Expansion of the Basis for Rents
On the political front, this period was characterised by a relative calm warranted by a highly
repressive regime. The period followed the 1972 massacre in which thousands of Tutsis were
killed by a group of Hutu rebels, triggering a horrendous repression directed against the
Hutus by the Tutsi-dominated army. Most Hutus able to exercise any political,
administrative, or economic power were physically eliminated. The massacre was followed
by a long period of political repression until the fall of Colonel Jean-Baptiste Bagaza and his
replacement by Major Pierre Buyoya in September 1987.
From 1975 the country embarked on a massive programme of investment, financed
mostly by foreign resources in addition to increased export revenue following the coffee
boom of the 1970s. A large number of public corporations were created and used to collect
and distribute rents to the members of the political elite. The management of these loss-
making corporations involved massive transfers of subsidies, crowding out resources for

8
productive investment. Although this period experienced positive rates of economic growth,
the widening budget deficits and the cost of servicing the debts contracted in the 1970s
became unsustainable in the 1980s. As a result, Burundi adopted a structural adjustment
programme in 1986. To economic difficulties was added the 1988 civil war, a result of
political tensions that had been brewing during the preceding period of repression.
1988-To Date: War and Economic Decline
Despite the fact that war in 1988 was shorter and less costly in terms of human loss relative
to 1972, it opened the way for increasing grievances from a new generation of Hutus who
had been excluded from political and economic participation since 1972. Facing an
international community that conditioned more and more of its external aid to political
inclusion of the Hutus, Burundi experienced a volatile political and economic environment
(Reyntjens: 1994). In 1993, another civil war erupted after the assassination by the army of
the first democratically elected president.
In August 1996, the crisis deepened when Burundi’s neighbouring countries imposed
a total economic embargo in reaction to a new military coup by Major Pierre Buyoya, the
officer who had lost the 1993 elections. The international community followed suit by
suspending its cooperation with Burundi. As a result, economic agents, including the
government, attempted to import and export some strategic products illegally, criminalizing
economic activity. Transactions costs increased manifolds as speculation and corruption
reached new heights. The Burundi franc plummeted and inflation reached levels never seen
before. Not surprisingly, Burundi recorded its highest levels of poverty during this period.

9
Today, although the embargo has been suspended, war is still ravaging the country and the
economy is in shambles.6
2.3. Growth Accounting and Cross-Country Comparison
Using secondary school enrolment ratio as a proxy for human capital despite the inherent
limits of this indicator (Gemmell, 1996) and adopting the usual assumptions on the
measurement of the number of workers, capital depreciation and the elasticity of capital to
output (see Collins and Bosworth (1996); and Ndulu and O’Connell, 2000) we find the
following. GDP per capita decreased by more than 40 percent between 1960 and 1997;
physical capital per capita was multiplied by 58 and human capital by 5; TFP was divided by
25. Overall, these figures conform to Burundi’s reality. While investments made before
independence to cater for Belgian colonial needs were made with efficiency in mind the
pattern changed after independence. Investment was generally allocated based on non-
economic objectives to respond to such needs as rent seeking, regionalism, clientelism,
nepotism and patronage.
This picture limits the relevance of the textbook growth model which assumes that
resources are efficiently allocated. When cronies rather than qualified managers are running
the economy, when priority is given to investment projects in function of their location
rather than the objective needs of the economy, it is not surprising that TFP decreases
(Easterly, 2001). Consequently, despite an apparent large increase in investment which
6 In order to have an idea on what Burundi would have become if it had not experienced all its civil wars, we have assumed that the country would have had the mean growth rate of African countries, including those that have experienced war. It turns out that by 1997, GDP per capita would have been $ 667 an amount that is 68 percent higher than the actual figure of $ 397. Taking the mean growth rate of countries that have experienced no war would increase the figure. This simple figure gives an idea of the cost of Burundi policies in the period post-1960.

10
became predominantly public since the 1970s, effective increase in productive physical
capital was modest.
In Table 1, the enormous rates of increase of physical and human capital per capita
between 1960 and 1972 are due to the particularly low initial conditions rather than high
additional capital. Furthermore, the specification of capital depreciation does not seem to be
appropriate for war economies. Taking into account the massive destructions of human and
physical capital due to repetitive wars, the figures in the table should be lower. HIV/AIDS
has become another important source of human capital destruction. Recent figures show
that HIV prevalence has accelerated during the current civil war as a result of population
displacements, army and rebel movements and promiscuity in displacement camps. The
prevalence rate in cities has increased from 1% in 1983 to 15.1% in 1993 and to 21% in
1997, against 0.73% in 1989 to 5.9% in 1997 in rural areas (The World Bank, 1999).
Educated urban elites are among the most affected.
Conflicts have also caused huge losses of physical capital. The killing and looting of
livestock have caused its decline from 2.6 million heads to 1.8 million from 1993 to 1999, a
fall of 31 percent in just six years. Given the importance of livestock for land productivity
through its supply of organic fertiliser, looting and killing of livestock has not only deprived
rural households of an important source of food but also an important source of agriculture
input. Hence, the rates of growth of physical and human capital in Burundi are likely to be
over-estimated as their computation does not integrate these factors.
In a comparative perspective, it is notable that the evolution of Burundi’s economic
performance is atypical (See Table 2). Whereas most African economies were growing in the
period following independence, Burundi was declining. The main reason is the high political
instability that followed the assassination of Prince Louis Rwagasore, the leader who

11
spearheaded the country’s struggle for independence. Rwagasore was as charismatic and
visionary as other well known African figures of the time. Arguably, it is thanks to his
visionary leadership that the events in Rwanda in 1959 did not spread to Burundi as
explained in Ngaruko and Nkurunziza (2000). His assassination robbed the country of a
leader who would have put Burundi on a different course. Countries that would have lost
charismatic leaders at such a sensitive time would most probably have followed Burundi’s
path.7
In the 1970s and 1980s, Burundi’s economy was growing higher than the African
average another departure from the norm. Although this was a period of repression of civil
liberties, the country experienced no civil war after the 1972 tragedy. It is during this period
that the government embarked on a large-scale programme of modernisation of the
country’s infrastructure including roads, dams, schools, etc. partly in view of the rents these
projects generated for the elites. However, in the 1990s, civil wars reversed the gains of the
previous periods. Most of the variables considered in Table 2 show that Burundi was worse
off than the group of developing countries.
Other growth determinants such as the age dependency ratio, black market premium
and inflation from 1990 to 1997 are consistent with a war economy as noted, for example in
Cukierman et al. (1992). These variables are also consistent with the typology of African
economies proposed by Hugon (1993). As Table 3 shows, the deviation in Burundi’s actual
economic growth from the sample mean is correlated with war occurrence, suggesting that
Burundi’s economic dynamics is largely explained by war. Moreover, while Table 3 confirms
the importance of traditional economic variables in explaining growth, it also highlights the 7 The current chaos in Cote d’Ivoire, more than 40 years after independence but only a few years after the loss of their charismatic leader is revealing.

12
role of policies, with a particular effect attributed to government spending. The next section
analyses how government intervention affected the structure of markets underlying this poor
macroeconomic performance.
3. Government Intervention and Market Structure
Markets are normally institutions that facilitate exchange and hence foster production and
growth. In Burundi, markets respond to political objectives. This section looks at three
different markets, namely the markets for goods, the financial and labour markets and the
way they have been used as political tools.
3.1. Markets for Goods
Traditionally, the government has been involved in the goods markets through its
parastatals. Prominent among them are OCIBU, OTB and COGERCO8 which, together,
control almost 100 percent of the country’s total exports.9 Through these three parastatals
the government control the determination of producer prices providing a way to appropriate
an important proportion of export earnings. For instance, during the 15 years preceding the
adoption of a structural adjustment programme in 1986, coffee farmers were paid, on
average, 40 percent of the world price, the lowest share in the region. The difference was
8 OCIBU is Office des cultures industrielles du Burundi; OTB is Office du thé du Burundi and COGERCO is Compagnie de gérance du coton. 9 In the late 1970s the government also established parastatals to regulate the commercialization of consumer goods. SOBECOV (Societe Burundaise d’entreposage et de commercialisation des produits vivriers) was tasked with the marketing of local produce while ONC (Office national de commerce) was marketing imported consumer goods, from needles to motor vehicles. These state firms were eventually ruined in the 1980s by bad management, corruption and nepotism.

13
appropriated by different agents and institutions, many of them controlled by the
government or politically-connected individuals.
The government has several other indirect ways of controlling the goods market
including taxation and exchange rate controls. Burundi’s tax system lacks all three
characteristics of an efficient tax system: certainty, simplicity and transparency. The frequent
changes in tax rates and the ad hoc use of quantitative import restrictions and import
licenses illustrate the lack of certainty. Anecdotal evidence purports that non-connected
businesses are sometimes denied licenses even when they do not require foreign currency
from the central bank to pay for their imports. Moreover, the multiplicity of tax rates within
each category of taxes makes the tax system too complex. The lack of transparency is
illustrated by the fact that tax exemptions are so widespread that they provide a leeway for
abuses, increasing the potential for corruption.
For instance, in 1993, import duty exemptions represented 50 percent of total
potential import duty revenue. The undefined category of “other exemptions” represented
3.3 billion Burundi francs in 1996, accounting for as much as 42 percent of total exemptions.
The problem is that most officials making these decisions do not hesitate to monetise them.
This complicated tax system has a purpose: leaving the determination of the taxes different
individuals should pay to the appreciation of senior tax officers, a discretionary power they
may use to extract and distribute rents.
With respect to the distortions in exchange rate markets, Burundi is the only country
in the region that is still controlling the allocation of foreign currency. All other countries in
the region were able to unify their foreign exchange markets in the early 1990s. In Burundi,
the average premium more than doubled in the 1990s, reaching 45 percent per annum

14
between 1990 and 2000. Controlling who may have access to cheap foreign currency from
the central bank creates a two tier system where importers incur different costs for the same
imported products. Since the same imported product is sold at the same price on the local
market, importers using cheaper foreign currency have larger profit margins, another way of
allocating rents.
3.2. Financial Markets
For most of the post-independence period, the financial sector was dominated by two
commercial banks owned partly by the state and partly by Belgian banks. There was also a
government savings bank, a government development bank, and a few non banking financial
institutions. With financial liberalisation in the late 1980s and early 1990s, Burundi’s financial
sector has become more diversified. However, the country has no stock market and no
dynamic informal financial markets, implying that most financial transactions are carried out
through banks. Financial institutions are concentrated in Bujumbura, the capital city, but the
main banks have branches in a number of provinces.
Despite some progress in terms of diversification, the financial sector remains
underdeveloped. The average ratio of M2 to GDP was only 15 percent in the period 1965-
98, which is 7 percentage points lower than the African average and less than half that of
other LDCs. In the same connection, the level of M2/M1, which stands at 1.35, is almost
half Africa’s as well as LDC means. Furthermore, the country’s particularly low ratio of
M2/M0 is characteristic of a subsistence economy. These simple statistics show that the
economy is less monetized even relative to other poor economies, suggesting both a lack of
openness and a high level of financial repression.

15
The large spreads between lending and borrowing rates are usually a symptom of
both an inefficient and oligopolistic financial sector. In Burundi, lending and borrowing rates
were fixed by the government for most of the sample period. On average, the interest rate
spread was 8.7 percent for the period 1975 to 1998, for average lending and deposit rates of
12.5 and 3.8 respectively. The average spread to lending rate was 0.70, a value that is higher
than in most African countries including Kenya (0.4); Ghana (0.5); Malawi (0.6); Nigeria
(0.65) and Tanzania (0.70)10. The lending rate is 2.5 points lower than the mean for Africa or
83 percent of the latter while the deposit rate is 4.5 percentage points lower or only 46
percent of the African average, with an average real rate of -6.19 percent between 1970 and
1998. These large spreads and the negative real deposit rate translate the objective of a
government interested in extracting rents from depositors most of whom are not able to
borrow from the same market.
Furthermore, credit allocation is inefficient, as it does not reflect sectoral
contributions to the economy. In 1995, credit to agriculture represented only 1.7 percent of
total credit, in comparison with 35 percent for trade; 14 percent for civil engineering and
other services and 10.5 percent for industrial activities. During the same year, the agriculture-
dominated primary sector contributed about 50 percent to GDP against 6 percent, 3 percent
and 9 percent for trade, other services and manufacturing, respectively. The high proportion
of credit to the trading sector is in line with the rent sharing model: since trade itself is
controlled by the government through, among others, the issuance of import licenses, the
financing of trade activities implies that banks are either part of the game, or they are more
interested in speculative activities, or both. Either way, the financial sector has a limited
contribution to the process of economic growth.
10 These comparative data are from Nkurunziza, J. D. (2003).

16
3.3. Labour Markets
The labour market does not function as a competitive market. In rural areas only 24 percent
of households employ paid labour, often without a clear wage contract. Employment
opportunities are almost limited to public employment which accounts for 80 percent of
total formal employment. It is a major source of accumulation through indirect benefits such
as subsidised credit and housing, free or subsidised transportation, frequent international
travels and other rents extracted through corruption and patronage. As a result, the
conditions in the labour market reflect largely political rather than economic fundamentals.
Large parts of the population are excluded from participation in public employment by
direct ethnic and regional selection, or indirectly by discriminatory access to education as we
discuss later.
It is not clear that there is a proper labour market in Burundi even in the modern
sector. The matching of demand and supply is done more informally than through the
allocative function of an open and competitive market. Firm-level workers’ data from a
survey of 120 firms carried out in 1993 in the context of the World Bank’s Regional Program
on Enterprise Development (RPED) show that firms recruited only about 20 percent of
employees through formal channels, namely job advertisement and recruitment agencies.
About 75 percent of workers were recruited through informal channels such as friends and
relatives of the manager, word of mouth, friends of other workers, etc.
Although recruitments do not appear to be based on economic considerations,
wages seem to be generally determined by economic factors. This does not imply that
economic factors alone explain workers’ compensation. In addition to wages, private sector
employment entitles workers to a number of additional benefits including borrowing from

17
the firm, interest free; allowances for housing, transportation, food, health care, etc. Table 4
presents the results of earnings equations based on worker-level information as well as the
characteristics of the firms they work for.11
The main message of the findings is that workers’ wages are driven by the same
economic factors that drive wages elsewhere. The main determinants are workers’ education,
age or tenure, the size and the age of the firm. Firms in Bujumbura appear to offer better
wages than those in the interior, and formal firms offer higher wages than informal ones,
even after controlling for firm size. Workers hired through informal and formal channels do
not seem to earn different wages. The reason may be that once a worker is hired, his wage is
determined on the basis of government labour laws. However, differences may be noticeable
once allowances are taken into account, especially those at the discretion of the employer.
These findings have implications for economic growth. Firstly, the results confirm
the argument of a dual economy: rural versus urban and formal versus informal. Secondly,
given that schooling is the most important variable explaining the level of wages unequal
access to education has a strong effect on social inequality. Thirdly, even if it were true that
workers recruited through informal channels do not earn more than those recruited through
formal channels, those recruited informally occupy positions that could have been taken by
others, who might remain unemployed or opt for lower paid jobs. In addition, the fact that
employees recruited informally tend to pledge their loyalty to individuals who recruited them
rather than the firms employing them creates an incentive problem that is harmful to firm
performance. In the end, individuals may benefit from informality but on the whole, the
economy at large loses.
11 Given that worker-level information on non-wage benefits is not available, the following results may be biased. Such allowances could be important in determining the relationship between an employee and his firm or his employer.

18
4. The Response of Firms and Households
The market structure discussed above defines the opportunities available for firms and
households as well as the constraints they have to confront.
4.1. Firm Response
We briefly discuss three constraints facing firm development in Burundi and the responses
of firms. These are the small size of the domestic market and the difficulty of accessing
external markets, the legal framework supporting firm activity, and the risks associated with
Burundi’s geographic and political environment.
4.1.1. Size of Domestic and External Markets: With 6 million people who are among the
poorest in the world, Burundi is one of the smallest economies in Africa. In this light, it is
difficult to envisage a development strategy based on the domestic markets. Wit respect to
Burundi’s external markets, they were largely Rwanda and the Eastern provinces of Congo
under colonial rule. In this regard, firms established during colonial times were tailored to
meet the demand of this relatively large market. Firms created before 1960 have an average
production capacity of 240 kilowatts in comparison to 98.5 kilowatts for firms created after
1960. Although the pre-1960 firms did not grow they are still among the biggest in Burundi,
suggesting that the collapse of the economic union in the early 1960s had a limited long-term
impact on the firms.
By 1993, these ‘large’ firms were, on average, more active than the group of firms
created after 1960. Their average capacity utilisation was 87 percent in comparison to 66

19
percent for the post-1960 firms. In addition, 33 percent of firms in the first group were
exporting relative to 13 percent in the second group. This difference in performance may be
the result of two different managerial cultures. Pre-1960s firms were created and run by
Belgians. After independence, these firms were run either by their Belgian owners who
decided to stay in the country or they were taken over by Burundian managers who had
worked under the original owners. On the other hand, post-1960 firms were mostly created
by the government with little regard for efficiency, or by former politicians who converted to
business to put to use their valuable political networks but without managerial experience or
expertise.
The fact that the country is landlocked increases transportation costs and hence total
production costs. This constraint limits firm competitiveness in international markets. One
opportunity for the country to increase its exports could be to devise a strategy targeting
regional markets. Since Burundi is signatory to a number of regional trading blocks, firms
should strive to take advantage of the preferential provisions offered by such bodies to
increase their businesses across the region.12 However, mistrust among the countries’ leaders,
their nationalist short-sightedness and egoistic interests have, so far, undermined attempts to
establish vibrant regional markets.
4.1.2. Regulatory Framework: Firm efficiency is hampered by an inappropriate regulatory
framework particularly the weak legal system that fails to enforce commercial contracts and
property rights. For instance, it appears that when a bank takes a defaulting borrower to
12 Attempts to create regional institutions include the Communauté Economique des Pays des Grands Lacs (CEPGL), Communaute Economique des Pays d’Afrique Centrale (CEAC), and the Common Market for Eastern and Southern African States (COMESA). Of the three institutions, only the last one functions at some level of normalcy.

20
court, the case may take up to ten years to be settled. Judges tend to sympathize with the
plight of defaulting borrowers at the expense of “those silly bankers”.13 This increases the
cost of lending, which may partly explain the large interest rate spreads observed in Burundi.
Hence, 86 percent of firms interviewed in 1993 preferred to settle their conflicts with clients
through direct negotiations while only 15 percent of the conflicts were taken to court.14
In addition to legal institutions, firms also need government business support
services. However, as in the case of import licenses, government discretionary measures have
often not been used transparently. For example, large firms are more likely to benefit from
tax and duty exemptions provided for in the Investment Code than small firms. By 1993, 31
percent of firms in the RPED sample had applied for the benefits. Successful firms
represented 60 percent of the applicants but what is striking is that, as for credit, smaller
firms not only applied less, but they were also less successful than bigger ones when they
applied. The importance of returns to size when dealing with government institutions is also
highlighted by Gauthier and Gersovitz (1997). They show that in Cameroon, large firms are
more able to save through tax evasion than smaller firms because they are powerful enough
to lobby tax administrators.
4.1.3. Risk and Uncertainty: Burundi is characterised by high economic and political risk.
Economic risk is partly due to bad policies. For instance, exchange rate uncertainty resulting
from the controlled regime increases uncertainty about future prices and costs, limiting
firms’ involvement in medium and long-term activities. Devaluations increase the cost of
imports. Since they are unpredictable by essence, firms face unexpected additional costs that 13 Personal discussions with Burundi bank managers. 14 This is not particular to Burundi. Bigsten et al. (2000) find comparable findings in a study covering Burundi, Cameroon, Côte d’Ivoire, Kenya, Zambia and Zimbabwe.
21
may affect their capacity to honour commitments towards banks and suppliers. Between
1990 and 1993, RPED data show that 53 percent of firms failed to pay their loans in time,
while 40 percent failed to pay at all.
The effects of geographical isolation add to policy induced uncertainty. The country
is fully dependent on its neighbours’ wrecked roads, ports and railways for the conduct of its
international trade. As a result, firms in Burundi have to invest in large stocks of raw
materials to minimise the cost of supply interruptions. On average, RPED data show that
firms held inventories of raw material worth 39 percent of the value of their yearly
production or the equivalent of 87 percent of their raw material needs for a year. This
strategy has a high opportunity cost as large financial resources are tied in unproductive use.
With respect to political risk, the cycle of civil wars has created an extremely volatile
political environment with a heavy toll on manufacturing activity. For instance, as a result of
the current war, manufacturing production has declined by an average of 13 percent per
annum between 1993 and 1997 (World Bank, 1999). In 1994, only one year into the current
political crisis, a sample of 84 firms showed that only 45 percent had kept their pre-crisis size
or had reduced it by less than 10 percent; 15 percent shrank by 10 to 25 percent whereas 21
declined by more than 25 percent (MPDR, 2001).
Rather than war itself, its recurrence increases instability eroding the credibility of
government announcements about its capacity to sustain long-term peace. This lack of
credibility is one of the most important deterrents of investment in countries at war or those
recovering from it (Collier and Pattillo, 2000). By nature, war economies are short-term
oriented. Even when wars end, post-war economies inherit destroyed infrastructure, all kinds
of disruptions including social disorder, a pattern of resource allocation penalizing

22
productive sectors by diverting resources to war financing, dis-saving, portfolio substitution
in favour of foreign assets, degradation of moral standards, activity choices skewed towards
the short-term, etc. Most of these problems have a strong persistence effect (Collier, 1999).
In this light, it is not surprising that Burundi witnessed disinvestment rather than investment
in the 1990s. The rate of gross investment declined from 17.5 percent in 1990 to a mere 5.6
percent in 1998 (Burundi, MPDR, 2001).
4.2. Household Response
The lack of appropriate incentives and a support environment, especially adequate
infrastructure, in addition to government policies skewed against the rural sector, have
hampered the development of a rural economy. The lack of a basic market infrastructure in
rural Burundi has been a major cause of market failure and probably the single most
important factor affecting production. As de Janvry et al. (1991, p. 1401) remark, “a market
fails when the cost of a transaction through market exchange creates disutility greater than
the utility gain that it produces, with the result that the market is not used for the
transaction”.
According to the Enquete Prioritaire carried out in 1998 (subsequently EP1998),
farmers in rural areas walk an average of one hour to get to the nearest market place while it
takes them 30 minutes to reach the nearest grocery. Adding the fact that there is only one
market day per week in many rural areas, and that there are no storage facilities for
perishable agriculture produce, farmers have no incentive to produce marketable surpluses.
Communication infrastructure that could help integrate markets is either inexistent or poor,
especially during periods of insecurity. For instance, with 3 mainlines per 1000 persons,

23
Burundi has the lowest telephone density in Africa. Even the few lines are concentrated in
urban areas so they do not help the rural economy. The same may be said for electricity and
other types of infrastructure.15 To cap it all, government predatory policies and the lack of
financial and insurance markets constrain heavily household activities.
Farmers have responded to this adverse environment by retreating into subsistence
production in line with de Janvry et al. (1991). EP1998 data show that producers consume
on average 64 percent of their own food produce. In regions where climatic conditions
permit diversified production, this average is as high as 80 percent. In addition, as suggested
by Ghosh (1986) the fear of market exposure and ensuing taxation has induced many
households to transform their surpluses into in-kind savings in the form of cattle. This
policy has prevented accumulation in agriculture and its transformation into a more
productive sector, leading to stagnation (Benhabib and Rustichini, 1996).
Coercion has not been capable of reversing this trend. Sometimes using their power
as area representatives of the single party and informers of the state security apparatus to
impose their choices on farmers, extension workers have behaved as policemen, failing to
induce increase in production. In general, households are better off producing staple crops
rather than coffee, tea or cotton [see Table 5], three crops favoured by government.16 For
instance, the preference of many farmers we surveyed in the cotton growing Imbo region
was to grow tomatoes which generated three times more income than cotton. But as they
did not have the opportunity to choose what to grow and as monitoring by government
agents was regular, farmers were forced to adopt “cheating” strategies by growing tomatoes
under the cover of the wide cotton leaves.
15 These problems are not limited to Burundi (see Collier and Gunning, 1999). 16 Generally speaking, for the same quality of land and even taking into account the different levels of taxation of the different crops in the table, food crops are much more productive than industrial crops.

24
Hence, forced specialization by government has failed because it is ill advised,
ignores the basic cost-benefit economic principle, is not incentive compatible and, above all,
it is biased against the food sector that is of more direct interest to farmers. In the euphoria
that followed the 1993 democratic elections, farmers in some regions manifested their
displeasure with previous regimes by destroying their coffee stands, an offence that had been
traditionally punishable by a long prison sentence.
5. Political Economy of Growth
The question that arises from the discussions above is why the country’s leadership chose
policies allowing the economy to perform so poorly for such a long time. To understand the
logic underlying the government choices, we discuss the problem of politicisation of the
economy and how it undermined market efficiency. Firstly, we discuss the formation of
interest groups and the patterns of distributive politics. Secondly, we analyse the policies
underlying the predatory system that defines the modalities governing rent sharing among
the members of the ruling elite. Thirdly, we propose our perspective on the question why the
system has been stable for such a long time.
5.1. Interest Groups and the Patterns of Distributive Politics
The early 1960s saw the emergence of two political groups divided along ethnic lines. In
November 1966, in the midst of this politically charged period, Captain Michel Micombero,
a young Tutsi officer from the Southern province of Bururi, deposed the centuries-old
monarchy in a military coup, instituting a republican regime. Micombero government

25
dissolved parliament and established a single-party repressive system. Slowly, political
institutions were purged of Hutus leaving Tutsis, especially those from the president’s
Southern province of Bururi, at the helm of the country’s institutions.
Although to some extent non-Bururi Tutsis may have benefited from power more
than Bururi Hutus [Nkurunziza and Ngaruko, 2003] from Micombero’s coup in 1966 until
very recently, the presidents, key ministers and their advisors, managers of public firms as
well as the army commanders, have mostly been from Bururi. What is called ‘Regionalism’ in
Burundi was born with the 1966 coup. Interestingly, as the group of Bururi Tutsis claiming a
share to rents widened, political fights started among the ruling elite, this time within a
narrow intra-ethnic and intra-regional space. Fights opposed those from Matana to those
from Rutovu communes of Bururi. In the mid-1980s, in-fights were between the Bayanzi
and the Bashingo clans of Bururi Tutsis. Although some prominent politicians of army
officers were thrown in jail, the fighting groups never resorted to violence against each other.
5.1.1. Using Education to Filter Entry into the Elite Group
Offering Bururi Tutsis a privileged access to primary, secondary and university education,
including access to overseas scholarships, has been used to guarantee that power remains in
the hands of the Southern ruling elite. Jackson (2001), for example, notes that that Mugamba
commune of Bururi (out of a total of 114 communes nationwide) accounts for 15 percent of
the 6000 students of the government-run national university. The fact that the latter was the
country’s single institution of higher education until about five years ago shows that denying
non-Bururi students access to the national university was tantamount to economic and

26
political marginalization.17 Safeguarding the privileges of the elite became the bedrock of
government policy resulting in the marginalization of the majority of the population.
For instance, to ensure that Bururi produced the most educated people who would
be the future leaders, Jackson (2001, p. 31-35) finds that Bururi accounted for 15 percent of
all primary school teachers, 19 percent of the country’s secondary school students and 36
secondary schools. In short, Bururi boasts the best educational infrastructure in the country
[see Table 6]. Together with Bujumbura, the capital city, the two provinces host 11 percent
of the country’s population but they account for 32 percent of all secondary school students.
In contrast, the five least endowed provinces account for only 10 percent of secondary
school students, almost half of the number for Bururi. Jackson (2001, p. 35) notes that in the
late 1980s the government allocated about 60 percent of donor aid to education to Bururi
alone.18 Since the modern labour market is dominated by public employment, and given that
access to public employment depends on the level of education,19 those denied education in
early age are denied access to most opportunities offered by the economic system.
The transfers to Bururi have also taken other forms. Guichaoua (1991) reports that
out of the country’s 15 provinces, the Fifth Five-Year Plan allocated 66% of gross fixed
capital formation to a geographical area comprising Bujumbura, the capital city, and its
surrounding areas and the southern province of Bururi. The regions that are the breadbasket
of the country are the ones that least benefit from state resources. At a tender age, due to the
17 Pritchett and Filmer (1999) have shown, in a detailed multi-country study, that access to education increases wealth and that wealth increases the level of education. The implication is that lack of access to education perpetuates poverty, especially in countries like Burundi where access to education opens the doors to the civil service, the best and almost single opportunity to escape poverty. 18 These statistics are so embarrassing that, according to Jackson (2001), the Belgian minister for development cooperation, reacting to a government request for aid to education, asked to be given the number of colleges and students in Bururi in 2000 in order to send the required aid; he never got a response from the government. 19 For instance, every job in the public sector, up to district level, requires knowledge of French. Since the language is only taught in schools, those who do not attend school or those who do not go far enough are automatically excluded from job opportunities.

27
lack of schools, many young Burundians from the North, the East and the West engage in
agriculture, trading and other productive activities when in the South, children of their age
attend school to be prepared for future leadership. Those from the South who are not
successful in schools enrol in the army or join their relatives in Bujumbura and in other
regions where they work in government-controlled institutions.20 Hence, rather than
preparing future entrepreneurs, the education system has been shaped to prepare rent-
seekers. Politicisation of the education system has had a devastating impact on growth.
An interesting question is why the donors acquiesced to these discriminatory policies
despite the fact that most of the schools were built and run with the use of foreign aid. The
answer is that since the 1960s, the doctrine underlying international development assistance
was that the new sovereign nations would be entrusted with domestic allocation of aid
regardless of their internal institutions and governance standards. Insofar as the agenda of
the donors was not compromised (containment of communism, buying off diplomatic
support in international institutions, etc.) the groups in power could use foreign aid as they
wished, regardless of the impact on growth (Herbst: 2000, 97-132). Conditioning external
assistance to “good” domestic policies is a recent development still shyly applied.
5.1.2. The Army at the Heart of the Rentier State
The army ensures that the rentier system is not threatened by outsiders. The army plays a
prominent role as both an actor and guarantor of the mechanism of rent collection and
distribution within the elite group. Public expenditures allocated to the army rose by more
20 There is a story in Burundi about a manager who had just replaced a Southerner in a managerial position of a government institution in the North of the country. He realised that all the drivers, cleaners and night watchmen were from the South. He once asked the watchmen: Why did you come all the way from the South to be watchmen here? Do you mean there are no thieves in the South?
28
than 100% between the mid-1970s and the mid-1980s, reflecting a strengthening of the
institution protecting the predatory system. The army also acts as a distributive machine.
From the early 1970s, it has been overwhelmingly dominated by Bururi Tutsis at all levels.
According to the International Crisis Group (2001), all 37 highest command positions are
held by Tutsis, 27 of whom (or 73 percent) are from Bururi. Hence, policies privileging the
army, parastatals or public servants target a specific group within the population and anyone
threatening the status quo is mercilessly suppressed. When Melchior Ndadaye, the first
civilian, first Hutu and first non-Bururi democratically elected president attempted to change
the system, he was murdered by members of the army only three months after taking power.
Reyntjens (1994) notes that factors that induced members of the army to assassinate
the president include the following: Firstly, the new government had a plan to reduce bid
bonds by 80% to allow small businessmen, including many Hutus, benefit from privatisation
of state-owned enterprises. Secondly, the attempt to reconsider the conditions under which
the Belgian firm Affimet had been authorized to refine and export gold under an export
processing zone licence a few weeks before the June 1993 elections was against the interests
of influential people both from the firm itself and from the previous government. Thirdly,
the attempt by returning Hutu refugees to recover their property some of them in powerful
hands was obviously too sensitive. Fourthly, the intention of the President to reform the
army did not please those who felt threatened. Bururi civilian and military oligarchy felt most
threatened by these measures in view of the benefits they stood to lose. In this light, it is
clear that regionalism is not just a political phenomenon but has also an important economic
dimension.

29
5.2. The Policies Underlying Rent Sharing
Behind the merciless fights for political control are important economic rents. The ultimate
aim of political factions fighting for the control of the state is to control public institutions
which have become the centre of a system of rent sharing. We illustrate how this system
works using two examples: public employment and trade policy.
5.2.1. Public Employment and Parastatals as Sources of Economic Rents
Unlike most African bureaucracies Burundi’s public sector is relatively small. While many
populist governments used public employment to provide revenue to a maximum number of
followers, Burundi’s public sector has remained elitist. The successive governments reserved
the relatively high paying jobs for their political clients. In Burundi, the mean income of a
civil servant puts him among the richest 6% of the population,21 against an average of 13%
in sub-Saharan Africa, 30% for the Middle East and North Africa region, 33% for Asia, 40%
for Latin America and the Caribbean, 76% for Eastern Europe and the former USSR and
63% for OECD countries. Hence, individuals in the highest civil service jobs are among the
richest Burundians.
Table 7 gives information on ethnic identity of the highest civil servants and army
officers. Although it is difficult to ascertain the accuracy of the data, the reality is that the
Tutsi group dominates in all government institutions. However, the reality is that this
generalisation of ethnic dominance masks a more subtle discrimination pattern based on
regionalism. Disaggregated data on some of the positions in Table 7 unveils Bururi’s
dominance. Table 8 shows the ethnic and regional background of the managers of state
21 The percentile would be even smaller if other ‘rents to power’ are taken into account.

30
owned corporations. The dominance of Tutsis from Bururi supports our hypothesis that the
firms were created to enlarge the rent basis in order to fulfil the needs of the new members
of the elite.
The government embarked on an active economic policy programme, raising the
share of public investment from 5.6 percent to 42.8 percent of total investment between
1971 and 1980. The programme was funded by both internal and external debt (see Table 9).
As Nyamoya (1998) notes, from 1977 to 1982, about 100 State-owned companies were
created and put in the hands of cronies. Most of the corporations were mismanaged and had
cash flow problems from their inception resulting in large infusions of subsidies that
imposed a high cost on the economy. World Bank (1998) shows that although they
produced only 9 percent of the country’s GDP in 1990, state firms accounted for 31 percent
of formal sector employment, 25 percent of outstanding domestic credit, and benefited from
3.4 percent of GDP in subsidies from the government.
Furthermore, IMF (1997) shows that by 1995, equity capital of thirty-six such firms
with majority state participation represented 20 percent of the country’s GDP, but overall,
these corporations posted a net loss equivalent to 6 percent of GDP or 14 percent of
government revenue, excluding grants. These losses and subsequent government transfers
are just illustrations of the ways used to transfer resources from taxpayers, including farmers,
to bail out firms that served group rather than national interests.
It could be argued that those discriminated against in the public sector have better
opportunities in the private sector, suggesting some type of specialisation. The answer is that
government policies have not allowed the development of a private sector in Burundi. Using
the data on private investment as a measure of private sector involvement in economic

31
activity, Table 9 shows that between 1975 and 1984 when massive investments in the public
sector were undertaken, private investment was ten times lower at a mere 1.5 percent of
GDP compared to 9.9 percent for Sub-Saharan Africa. The contrast is staggering given that
private investment is higher than public investment in other African countries. As a result,
the alarmingly low level of domestic savings has increased the economy’s dependence on
foreign aid.
5.2.2. External Trade Policy as a Source of Economic Rents
The real motive for external trade controls is far from its official objective of guaranteeing
low prices for strategic imports. These controls confer a huge amount of economic rents.
Using a sample of 33 imported commodities, Greenaway and Milner (1990) have found that
in 1984, the amount of rents associated with the distribution of quota import licences was
about 2 billion Burundi francs, the equivalent of 17 percent of government revenue. These
controls benefit a small circle of individuals including a pool of former high-ranking civil
servants turned businessmen who capitalise on their links with the government to make
money. Any effort towards relaxation of the controls erodes these privileges so reforms are
fiercely resisted.
For instance, following the adoption of a structural adjustment programme in 1986
the country adopted trade liberalisation measures culminating in an Open General Licence
(OGL) for both imports and exports in 1992. As a result, the number of licensed importers
grew from 145 in 1985 to 400 in 1991. This increase by almost 200 percent in six years could
be interpreted as a measure of rents that had been captured by protected importers.22
22 Some of these liberalisation measures have been reversed during the current political crisis.

32
Likewise, the country’s export sector has also been a victim of the lopsided policy as the
example of coffee, the main export product accounting for more than 80 percent of total
exports, shows. Although producer price stability has been the main justification of the
government’s intervention in the coffee sector, the government did not isolate peasants from
fluctuating international prices. The correlation coefficient between producer and world
prices is 0.90, suggesting that, as Bates (1981) notes “what was stabilized is the off-take of
the marketing boards rather than incomes of farmers”.
The previous examples suggest that ultimately, the justification for the predatory
behaviour of the elite is economic. As Table 10 illustrates, being a Bururi Tutsi confers
material economic gain. Though Bururi province ranks 14 in a total of 15 provinces both in
terms of its contribution to central government’s tax revenue and in terms of food
production per capita, Bururi’s income per capita puts it in the second highest place. The
absence of any specific natural resource Bururi may claim to explain its high per capita
income leaves one explanation. The province benefits from large transfers, both directly
from the central government and from remittances of Bururi natives running the country
from Bujumbura and the rest of the country.
5.3. Why Has the Predatory System Been So Stable for So Long?
In Burundi, narrowly based governing elites tend to promote policies that distort the
economy because they benefit from the distortions without incurring their cost. Adam and
O’Connell (1999) show that when the elite group is small, economic distortions are largely
borne by the non-favoured group, and a small distortion may have large payoffs for each
member of the elite. Therefore, in the absence of political punishment of poor performers,

33
narrowly based political elites have an incentive to distort the economy, especially when they
are illegitimate and privilege immediate gain.
As to why such illegitimate regimes can last for so long, Humphreys and Bates
(2002) provide useful insights. In countries where a selectorate, that is a small group of
citizens such as the army in Burundi, enjoys monopoly power to change governments, a bad
leader may remain in power unchallenged for a long time. The condition to conserve power
is to ensure that the selectorate’s reservation utility is satisfied; this being the single criterion
against which the performance of an incumbent leader is measured. In Burundi, the
selectorate or the Bururi elite has no incentive to remove a leader from power when he
satisfies their needs. Instead, the army is used to quell any opposition to the selectorate’s
policies.
These two models have two results that perfectly fit Burundi. First, the probability of
distorting the economy and engaging in predation is highest for governments at war.
Secondly, regionally based governments engage more in predation and in disequilibrating
macroeconomic policies. We have seen that households respond by retreating into
subsistence agriculture. How do agents in other productive sectors respond? Faced with
predatory leaders, citizens move their wealth outside the economy. But, fearing this move,
predatory governments impose restrictions on factor mobility, particularly capital. Ironically,
narrow-based elites themselves are more engaged in capital flight as they live with a constant
fear of losing their illegitimate power. The case of General Abacha, his family and their
associates in Nigeria is an illustration of this fact.
In Burundi, despite strict controls on capital mobility even before the current war,
capital flight was relatively high, representing 30 percent of total revenue between 1985 and

34
1992.23 It is probable that those involved in capital flight were chiefly members of the
Bagaza regime before it was deposed in 1987, and subsequently, the elites around Buyoya,
for two reasons. Firstly, strict capital controls meant that one needed the complicity of those
enforcing the controls to violate them. Such complicity could be easily obtained by those in
power and their associates. The data on the parallel exchange rate show no important
increases until the last two years (1991 and 1992), suggesting that the market was not widely
used to make these transfers.
Secondly, it is the members of the elite who had substantial capital to send abroad
considering that most other Burundians lived in poverty. These hypotheses illustrate Adam
and O’Connell (1999) proposition that economic distortions benefit the elites.24 Since 1993,
there has been a pattern among the elites in Burundi to send their children to Europe or
North America. The parents stay in Burundi, well protected by armed bodyguards. These
people continue preaching that those in the country should keep fighting the ‘enemy’ as it is
others who bear the brunt of the war.
It is too easy, ex-post, to wonder why Burundian leaders have been so “irrational”
for almost four decades. We should not forget that this “irrational” system was put in place
in the 1960s and survived four civil wars. It was a stable system that could have withstood
the recent shocks (and we would probably not be questioning it) if the external events that
destabilised the system had not taken place. These include the wave of democracy that swept
the continent in the early 1990s, the genocide in Rwanda, the war in Congo, etc. (see
Ngaruko and Nkurunziza, 2000; Nkurunziza and Ngaruko, 2003). We would be mistaken to
23 We are grateful to Paul Collier who suggested that capital flight could be a possible explanation why Burundi’s political elite do not seem to care about political stability and economic efficiency. 24 There distortions should not be confused with the taxes discussed by Azam (1995) in the case of Cote d’Ivoire. In his analysis, taxes are collected from rich members of the ruling ethnic group in the South to be invested in the poor North in projects that may be economically nonviable to maintain social cohesion.

35
think that the system has imploded; its internal dynamics is still relatively intact. The slow
but remarkable changes that are taking place are due to pressure from the international
community. However, it is not clear how far the elite is prepared to abandon its benefits and
whether the pressure will not weaken, leading to the reversal of what has been achieved.
6. Conclusion
This study has analysed the process of economic growth in Burundi over the period 1960-
2000. The growth pattern followed closely the country’s political trajectory represented in
three sub-periods: 1960-1972; 1972-1988, and 1988 to date. Economic decline during the
first sub-period was largely due to political instability and the loss of Burundi’s export
markets in neighbouring Rwanda and Congo following decolonisation. During the period
1972-1988, economic growth was fuelled by an increase in coffee export revenues in the
second half of the 1970s and massive foreign borrowing. Most of the funds were used to
create inefficient state firms used by the ruling elite as a source of economic rents. During
the third sub-period, economic decline was a result of three civil wars, a total economic
blockade, the freezing of aid by international donors and the collapse of investment and
infrastructure.
On the whole, growth has been a failure because it has not been the priority of
Burundi’s leadership. Blending traditional macroeconomic growth analysis with
microeconomic, institutional and political economy approaches, the study has shown that
economic outcomes have been endogenous to political imperatives. Controlled access to
education and to the civil service and the army, the creation of a large number of state
corporations, monetary policy, trade policy and a myriad of other policies were used to

36
ensure that resources were allocated to the members of the ruling elite. The overarching
objective of the leadership was the government’s desire to hold its grip over the different
sources of economic rents. In this light, political economy is a more appealing approach in
explaining Burundi’s dismal economic performance.
The main contribution of the study to the cross-country growth literature has been
not only to provide the first detailed study of growth in Burundi but also to highlight the
centrality of the oft-neglected political factors in explaining growth outcomes. A traditional
analysis of growth focusing on macroeconomic variables such as investment and schooling is
not only limited but may also be misleading. This case study has shown that economic
growth is the outcome of a complex process in which political objectives of the individuals
in power play a central role. The challenge is, therefore, to develop new growth analytical
frameworks integrating political and traditional economic and policy variables.
If Burundi’s track record remains unchanged, Ali (2001) has calculated that it would
take 225 years to cut the country’s poverty level by half. This suggests that the status quo is a
hopeless option so the question is rather how to change this situation and put Burundi on a
better growth path. When the current war broke out in 1993, the country was 7 years into a
structural adjustment programme that had been hailed as a success in Africa. However,
economic reforms were built on a shallow political foundation so economic policy and
political infrastructure collapsed in 1993. Therefore, without pretending to have a miracle
solution to the deeply rooted problems facing the country, we think it is not appropriate to
advocate economic reforms in Burundi without accompanying structural political reforms.
It will not be easy to achieve this objective but there is no better alternative. In
Burundi as elsewhere, economic agents respond to incentives. Burundians’ contribution to

37
economic growth will in large part depend on the extent to which the structure of incentives,
both political and economic, is aligned with people’s preferences (Easterly, 2001). In the
process, the protection of human life and the socio-economic integration of all Burundians
without distinction based on regional or ethnic background should be the basic principle
guiding political and economic reforms. It remains to be seen whether the recent political
reforms and the installation of a new “inclusive” interim government on 1 November 2001
will bring about such changes. The cooperation of the members of the traditional ruling class
will be needed to make such change possible, but their track record suggests that they cannot
credibly commit to change. In this context, external pressure will be needed to force change
(Addison and Murshed, 2002). To a certain extent, this is already happening.

38
References
Adam, C. S. and O’Connell, S.A. (1999): “Aid, Taxation and Development in Sub-Saharan
Africa”, Economics and Politics, Volume 11 (3), 225-54
Addison, T. and S. M. Murshed (2002), “Credibility and reputation in Peace Making”, Journal
of Peace Research, Volume 39 (4), 487-501
Ali, A. G. Ali (2001), “Can Africa cut its poverty level by half by 2015?” United Nations
Economic Commission for Africa, Economic Report on Africa 2000, Addis Ababa,
Ethiopia.
Azam, J.-P. (1995), ‘How to Pay for Peace? A Theoretical Framework with Reference to
African Countries’, Public Choice, 83(1/2): 173-84.
Bates, R. (1983), Essays on the Political Economy of Rural Africa, Cambridge: Cambridge
University Press, United Kingdom.
Benhabib, J. and Rustichini, A. (1996), “Social Conflict and Growth”, Journal of Economic
Growth, 1 (March), 125-142
Bigsten, A., P. Collier, S. Dercon, M. Fafchamps, B. Gauthier, J. W. Gunning, M. Soderbom,
A. Oduro, R. Oostendorp, C. Pattillo, F. Teal, and A. Zeufack (2000): “Contract
Flexibility and Dispute Resolution in African Manufacturing," Journal of Development
Studies, 36, 1-37.
Collier, P. (1999), “On the Economic Consequences of Civil War”, Oxford Economic Papers
51, 168-83.
Collier, P. and Gunning, J. (1999), “Explaining African Economic Performance”, Journal of
Economic Literature, Vol. XXXVII (March), 64-111.
Collier, P. and C. Pattillo (2000), Investment and Risk in Africa, Macmillan Press Ltd., United

39
Kingdom.
Collins, S. M. and Bosworth, B. P. (1996), “Economic Growth in East Asia: Accumulation
versus Assimilation”, Brookings Papers on Economic Activity, 2.
Cukierman, A., Edwards, S. and Tabellini, G. (1992), “Seignorage and Political Instability”,
American Economic Review, vol. 82(3), 537-555.
De Janvry, A., Fafchamps, M. and Sadoulet, M. (1991), “Peasant Household Behaviour with
Missing Markets: Some Paradoxes Explained”, Economic Journal, 101(409), 1400-1417
De Lespinay, C. (2000), “Les Eglises et le génocide dans la région des Grands Lacs
est-africains”, http://www.u-paris10.fr/gdr1178/lesp-egl.htm
Easterly, W. (2001), The Elusive Quest for Growth, Cambridge, Massachusetts: MIT Press.
Easterly, W. and R. Levine (2003), “Tropics, Germs, and Crops: The Role of Endowments
in Economic Development”, Journal of Monetary Economics, 50 (1), 3-39.
Fafchamps, M. (2003), “Engines of Growth and Africa’s Economic Performance”, in
Emmanuel Nnadozie, ed. African Economic Development, Academic Press.
Gauthier, B. and M. Gersovitz (1997): “Revenue Erosion through Exemption and Evasion
in Cameroon, 1993”, Journal of Public Economics, volume 64, 407-424.
Gemmell, N. (1996), “Evaluating the impacts of Human Capital Stocks and Accumulation
on Economic Growth: Some New Evidence”, Oxford Bulletin of Economics and
Statistics, 58, 9-28.
Ghosh, D. (1986), “Savings Behaviour in the Non-Monetized Sector and Its Implications”,
Savings and Development, 2.
Greenaway, D. and Milner, C. R. (1990), “Policy Appraisal and the Structure of Protection in
a Low-Income Developing Country: Problems of Measurement and Evaluation in
Burundi”, Journal of Development Studies, Volume 27, 22-42

40
Herbst, J. (2000), States and Power in Africa: Comparative Lessons in Authority and Control,
Princeton: Princeton University Press.
Horowitz, D. L. (1985), Ethnic Groups in Conflict, Berkley, CA: University of California Press
Hugon, P. (1993), L’Economie de l’Afrique, Paris : Repères – La Découverte.
Humphreys, M. and R. Bates (2002), “Political Institutions and Economic Policies: Lessons
From Africa”, Working Paper, Centre for International Development, Harvard Univeristy.
IMF (1997), “Burundi: Recent Economic Developments”, IMF Staff Country Report No.
97/114, November 17.
IMF (1999), “Burundi: Statistical Annex”, IMF Staff Country Report No. 99/8 (February),
International Monetary Fund, Washington, D. C.
International Crisis Group—ICG-- (2001), Burundi: Breaking the Deadlock: The Urgent Need for
a New Negotiating Framework, Africa Report No. 29, May 14, Brussels/Nairobi.
ISTEEBU (2001), Enquête Prioritaire 1998: Etude Nationale sur les Conditions de Vie des
Populations, Bujumbura, Burundi.
Jackson, T. (2001), “L’Egalite d’accès à l’éducation: un impératif pour la paix au Burundi”,
International Alert, manuscript.
Lemarchand, R. (1994). Burundi : Ethnic Conflict and Genocide. Cambridge: Cambridge
University Press.
Ministère de la Planification du Développement et de la Reconstruction-MPDR (2001),
Programme National d’Action pour le Développement du Burundi 2001 – 2010, Troisième
Conférence des Nations Unies sur les Pays les Moins Avancés, Bruxelles, 13–20 mai
Ndulu, B. J. and O’Connell, A. O. (2000), Background Information on Economic Growth,
AERC Explaining African Economic Growth Project, Nairobi, Kenya.
Ngaruko, F. (1993), “L’Industrie et l’Accumulation au Burundi”, Mondes En Développement

41
Vol. 21, No. 2.
Ngaruko, F. and Nkurunziza, J. D. (2000), “An Economic Interpretation of Conflict in
Burundi”, Journal of African Economies, Volume 9, No.3, 370-409
Nkurunziza, J. D. and F. Ngaruko (2003), “War and Its Duration in Burundi”, World
Bank/Yale Project on The Economics of Political and Common Violence, Yale University
Nkurunziza, J. D. (2003), The Effect of Credit on Firm Growth and Survival in Kenyan
Manufacturing, D. Phil Thesis, University of Oxford.
______ (2001), “Exchange Rate Policy and the Parallel Market for Foreign
Currency in Burundi”, African Journal of Economic Policy, Volume 8 (1), 69-121.
Ntibazonkiza, R. (1993), Au Royaume des Seigneurs de la Lance. Une Approche Historique de la
Question Ethnique au Burundi. Tome 2 – De l’independence à Nos Jours (1962-
1992)”, La Louvière: Centre d’Animation en Langues.
Nyamoya, P. (1998), Pour un Modèle Original de Privatisation des Entreprises Publiques au Burundi,
RIDEC, Vol. 2 No. 2, Septembre, Bujumbura, Burundi.
Pritchett, Lant and Deon Filmer (1999), “What Educational Production Functions Really
Show: A Positive Theory of Education Spending”, Economics of Education Review 18,
no. 2 (April): 223-239.
Reyntjens, P. (1994), L’Afrique des Grands Lacs en Crise, Karthala, Paris: Summers
World Bank (1999), Burundi: Poverty Note. Prospects for Social Protection in a Crisis Economy,
Report No. 17909-Bu, Washington, D.C., February 23.
World Bank (1998), African Development Indicators 1998/1999, Washington, D.C.

42
Table 1: Decomposition of the contribution to Growth: Period annual average (%) Period l
q lk H A
1960-72 -2.5 105.8 15.4 -49.5 1973-88 1.56 13.4 3.3 -5.27 1989-97 -2.8 2.1 2.7 -5.25 1960-97 -0.74 40.56 7.01 -19.47
Table 2: Factors of Growth: Burundi Compared to Africa and Asia
Position of Burundi Relative to SSA and HPAE 75-79 80-84 85-89 90-97
Explanatory Factors of Growth
Expl. power*
SSA HPAE SSA HPAE SSA HPAE SSA HPAEReal GDP per Capita Growth Rate - c A c a c b a a Initial Income (expressed in log) High a A a a b a b a Landlocked High d D d d c d d d Cumulative Terms of Trade Shocks
None c D c c b c c b
Black Market Premium High b D b d b d d d Initial Life Expectancy High b A b a b a a a Age Dependency Ratio High c D c d c d c d Growth in Potential Labour Force High d A c a a a b a Trade-wt Growth Rate of GDP per Capita, Trading Partners
High b A b a b a b a
Political Instability High b A b b b d c d Inflation Low c D b b c c d d Extended Barro-Lee Gov Spending (% GDP)
High b D b d n.a. n.a. n.a. n.a.
Ln Ratio Investment to GDP (%) b A c a c a n.a. n.a. Notes: * High, low and none explanatory power apply to 1%, 25% and more than 50% of error, respectively. These parameters result from OLS multivariate regression of real GDP per capita on several explanatory factors. Blanks mean that the variables are not included in the regression: they are included in Table 2 just for comparative purposes of Burundi’s position relative to SSA and HPAE groups of countries; (a): Burundi falls below the mean of the group of countries and below the one-standard deviation margin; (b): Falls below the mean of the group of countries but within the one-standard deviation margin; (c): Falls over the mean of the group of countries but within the one-standard deviation margin; (d): Falls over the mean of the group of countries and over the one-standard deviation margin; (n.a.): Not available; SSA: Sub-Saharan Africa; HPAE: Highly Performing Asian Economies.

43
Table 3: Burundi: Fits and Residuals From Pooled Conditional Model
Fits and Residuals Actual and Predicted Growth Deviation
Breakdown of Policy Contribution by Variable
Contribution to Predicted
Growth Deviation
Period
Actual Growth
Fitted Growth
Res
Actual Growth Deviation from Sample Mean
Base Variab.
PoliticInstab
Policy
Inflation >500%
Black
Market Prem
>500%
B/L Gov
spend/ GDP
1970-74 3.80 1.60 0.11 0.00 0.04 -0.70 1975-79 2.07 2.06 0.01 -0.13 -0.05 0.13 -0.43 -0.01 0.01 -0.44 1980-84 0.46 0.29 0.17 -1.74 -0.95 0.20 -0.45 0.03 -0.01 -0.47 1985-89 2.50 0.30 -0.69 0.13 0.04 0.01 1990-97 -4.18 -6.37 -1.16 -0.13 0.00 -0.09 Total 0.93 1.18 0.09 -1.27 -0.55 0.07 0.14 0.03 0.00 -0.06
Source: Based on Ndulu and O’Connell (2000).
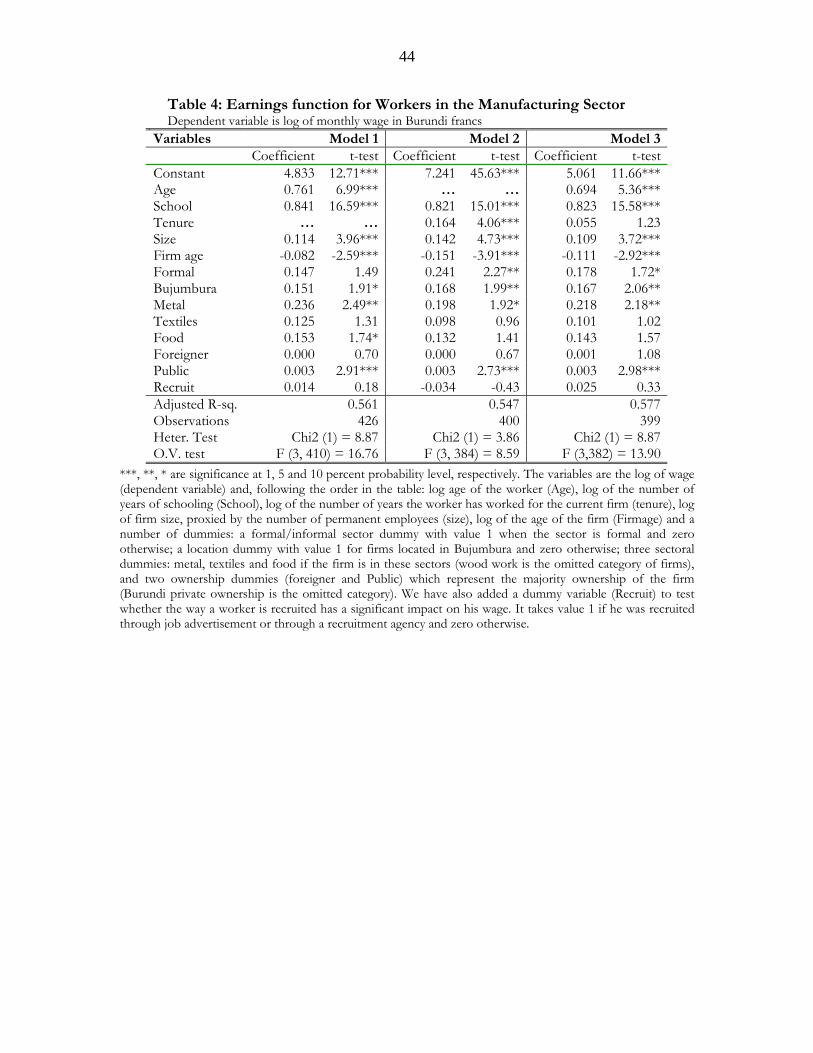
44
Table 4: Earnings function for Workers in the Manufacturing Sector Dependent variable is log of monthly wage in Burundi francs
Variables Model 1 Model 2 Model 3 Coefficient t-test Coefficient t-test Coefficient t-testConstant 4.833 12.71*** 7.241 45.63*** 5.061 11.66***Age 0.761 6.99*** … … 0.694 5.36***School 0.841 16.59*** 0.821 15.01*** 0.823 15.58***Tenure … … 0.164 4.06*** 0.055 1.23Size 0.114 3.96*** 0.142 4.73*** 0.109 3.72***Firm age -0.082 -2.59*** -0.151 -3.91*** -0.111 -2.92***Formal 0.147 1.49 0.241 2.27** 0.178 1.72*Bujumbura 0.151 1.91* 0.168 1.99** 0.167 2.06**Metal 0.236 2.49** 0.198 1.92* 0.218 2.18**Textiles 0.125 1.31 0.098 0.96 0.101 1.02Food 0.153 1.74* 0.132 1.41 0.143 1.57Foreigner 0.000 0.70 0.000 0.67 0.001 1.08Public 0.003 2.91*** 0.003 2.73*** 0.003 2.98***Recruit 0.014 0.18 -0.034 -0.43 0.025 0.33Adjusted R-sq. 0.561 0.547 0.577Observations 426 400 399Heter. Test Chi2 (1) = 8.87 Chi2 (1) = 3.86 Chi2 (1) = 8.87O.V. test F (3, 410) = 16.76 F (3, 384) = 8.59 F (3,382) = 13.90
***, **, * are significance at 1, 5 and 10 percent probability level, respectively. The variables are the log of wage (dependent variable) and, following the order in the table: log age of the worker (Age), log of the number of years of schooling (School), log of the number of years the worker has worked for the current firm (tenure), log of firm size, proxied by the number of permanent employees (size), log of the age of the firm (Firmage) and a number of dummies: a formal/informal sector dummy with value 1 when the sector is formal and zero otherwise; a location dummy with value 1 for firms located in Bujumbura and zero otherwise; three sectoral dummies: metal, textiles and food if the firm is in these sectors (wood work is the omitted category of firms), and two ownership dummies (foreigner and Public) which represent the majority ownership of the firm (Burundi private ownership is the omitted category). We have also added a dummy variable (Recruit) to test whether the way a worker is recruited has a significant impact on his wage. It takes value 1 if he was recruited through job advertisement or through a recruitment agency and zero otherwise.

45
Table 5: Land and Labour Returns for Main Crops (1985) Crops
Average Yield
(kg/ha) [1]
Price 1985
(Fbu/kg) [2]
Income (000Fbu/ha)
[3=1*2]
Work Days
[4]
Daily Income
[5=3/4]
Food Crops Corn 800 41.9 33.5 232 144.5 Sorghum 780 33.4 26.1 177 147.2 Rice 1,410 30.0 42.3 590 71.7 Wheat 410 40.0 16.8 274 61.2 Beans 800 46.5 37.2 210 177.1 Peas 550 82.6 45.4 210 216.3 Sweet Potatoes
5,240 10.1 52.9 372 142.3
Cassava 6,370 21.1 134.4 342 393 Potatoes 5,750 18.9 108.7 435 249.8 Palm Oil 2,520 7.9 19.9 244 81.6 Groundnuts 790 74.5 58.9 240 245.2 Bananas 11,240 11.0 128.6 253 488.7 Industrial Crops Coffee 240 160 38.4 500 76.8 Dry Tea 731 17 12.4 526 23.6 Cotton 1,185 35 41.5 255 162.6 Source: World Bank (1988)
Table 6: Distribution of Social Infrastructure and Returns to Regionalism
Variables Bururi
ProvinceAverage 15 provinces Std. Dev
Bururi Rank
Overall School Enrolment Ratio 0.39 0.245 0.105 1Teachers per classroom 2 1 0.3 1Illiteracy Rate 57 64 5 14Population/hospital ratio (000) 107 266 134 2Source: Data on the first four variables are from: Ministère de la Planification du Développement et de la Reconstruction and UNDP (1999). Data on per capita tax are from Ministère de l’Administration du Territoire et du Développement Communal (2001).

46
Table 7: Ethnic Disparities in Public Senior Civil Service Posts in 1987
Hutu* Tutsi* Twa* Office of the President 1 98 0 Central Committee of Single Party (UPRONA) 2 50 0 Administration of Single Party 3 52 0 Ministers 5 13 0 Ministerial Cabinet Directors 1 17 0 Ministry Permanent Secretaries 0 40 0 Province Governors 2 13 0 Ambassadors 1 21 0 Embassy Diplomats 0 88 0 Army Barrack Commanders 0 20 0 Army High Ranking Officers 2 398 0 Army Sergeant and Privates 30 11970 0 State Owned Company Directors 5 252 0 Hospital Directors 1 19 0 University Lecturers 10 80 0 Secondary School Directors and Inspectors 6 89 0 Prosecutors 0 66 0 Magistrates 5 92 0 High Court Presidents 1 7 0 Judiciary Police Officers and Inspectors 0 400 0 Source: Ntibazonkiza, R. (1993). Note: Hutus, Tutsis and Twas reportedly represent 85 percent, 14 percent and 1 percent of the population, respectively. * Even though it is difficult to ascertain the accuracy of these statistics, they carry a non-controversial message, that the Tutsi have dominated all government institutions.
Table 8: Ethnic and Regional Distribution of Public Firm Managers (%)
Ethnic Group Region of Origin
Tutsis Hutus Twa TOTAL
Bururi Province 60 3 0 63 Remaining 14 Provinces 29 8 0 37 TOTAL 89 11 0 100
Source: Based on data from “La Lumière”, a Burundian weekly, and reported in International Crisis Group (2001).

47
Table 9: External borrowing, domestic savings and investment (% of GDP)
Burundi Sub-Saharan Africa
75-84 85-89 90-98 75-84 85-89 90-98 Investment 15.6 16.3 11.9 17.8 16.3 17.0 Public 14.1 13.6 9.6 7.9 7.0 6.1 Private 1.5 2.7 2.3 9.9 9.3 10.9 Domestic Savings 4.1 3.3 -2.9 23.9 20.2 16.1 Net Long-Term Borrowing
4.8 7.5 4.7 3.0 2.4 1.0
Source: The World Bank (2000).
Table 10: Economic benefits underlying regionalism
Variables Bururi
provinceAverage 15 provinces
Standard deviation
Rank of Bururi
province
Per Capita Income (1998) in US PPP$ 444 328 99 2Food prod. Per cap (Tons) 0.41 1 0.15 14Per capita tax (1999) 268 366 90 14Source: Data on the first two variables are from: Ministère de la Planification du Développement et de la Reconstruction and UNDP (1999). Data on per capita tax are from Ministère de l’Administration du Territoire et du Développement Communal (2001).