why germany? warum deutschland? dr nicole hilbrandt daad daad fachtage 2007 osaka - october 6 2007
Post on 19-Dec-2015
223 views
TRANSCRIPT

Why Germany? Warum Deutschland?
Dr Nicole HilbrandtDAAD
DAAD Fachtage 2007 Osaka - October 6 2007

2
Structure of the German Research Landscape
Fraunhofer Society
Leibniz Association
Max Planck Society
Universities
Applied sciencesBasic research
AiF
IndustryHelmholtz Association

3
High-tech strategy
Excellence initiative Graduate schools Excellence clusters Institutional strategies
Internationalization International Research Training Groups/Schools, IMPRS Emmy Noether Programme etc. Working permits
Improved career path Tenure track option, Junior professorship etc. Age limit of fellowships GAIN
Current developments in Germany

4
Europe (current: 1.84% of GDP)
Increase of the annual budget by €100 billion
700,000 additional scientists
Germany (current: 2.51% of GDP)
Increase of the annual budget by €10 billion
70,000 additional scientists
bright perspective for bright people
Implications of the Lisbon Process

5
Investment in research and development
third-highest investments worldwide highest investments in Europe
Source: Eurostat, PM 12.Januar 2007
251 117 56 20130360
50
100
150
200
250
USA Japan Germany France GB EU 27
€ billions

6
940 818 655 4895870
200
400
600
800
1.000
USA Japan Germany France GB
Source: Federal Government Report on Research 2004; calculated purchasing power
US $ per capita
Investment in research and development
Per capita investment in R&D
7
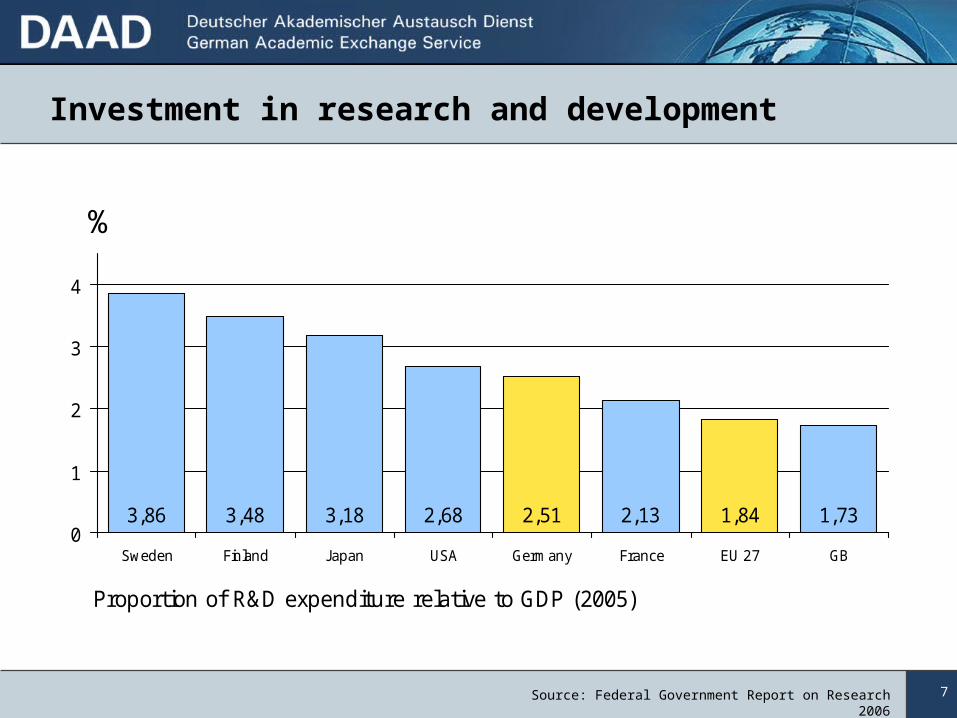
Investment in research and development
3,86 3,48 3,18 2,68 2,51 2,13 1,84 1,730
1
2
3
4
Sweden Finland J apan USA Germany France EU 27 GB
Proportion of R&D expenditure relative to GDP (2005)
Source: Federal Government Report on Research 2006
%

8Source: EU - Towards a European Research Area. Key Figures 2005
in 2003
Worldwide research capacity
Land Researchers (total)
USA 1,261,227
Japan 675,330
Germany 264,721
France 186,420
UK 157,662
EU 1,178,237 0
2
4
6
8
10
Forscher
Finnland
Japan
USA
Deutschland
Frankreich
UK
EU
Researchers per 1000 inhabitants
USAJP
FDEUUK
FIN

9
266 227 212 199 182 180 171 1450
50
100
150
200
250
300
350
CH S J D USA F EU 15 GB
Source: Key Figures 2003-2004
In €1000 per researcher
Research funding per researcher

10
Scientific qualifications
32 19 16 16 90,0
10,0
20,0
30,0
Germany GB France USA Japan
Newly acquired doctoral degrees per 100,000 inhabitants in 2000
Source: PSA target metrics for the UK Research Base

11
38,31 31,1 9,55 8,49 8,4 6,080
10
20
30
40
EU 25 USA Japan GB Germany France
Source: Key Figures 2005
Scientific quality
Publications in %
12
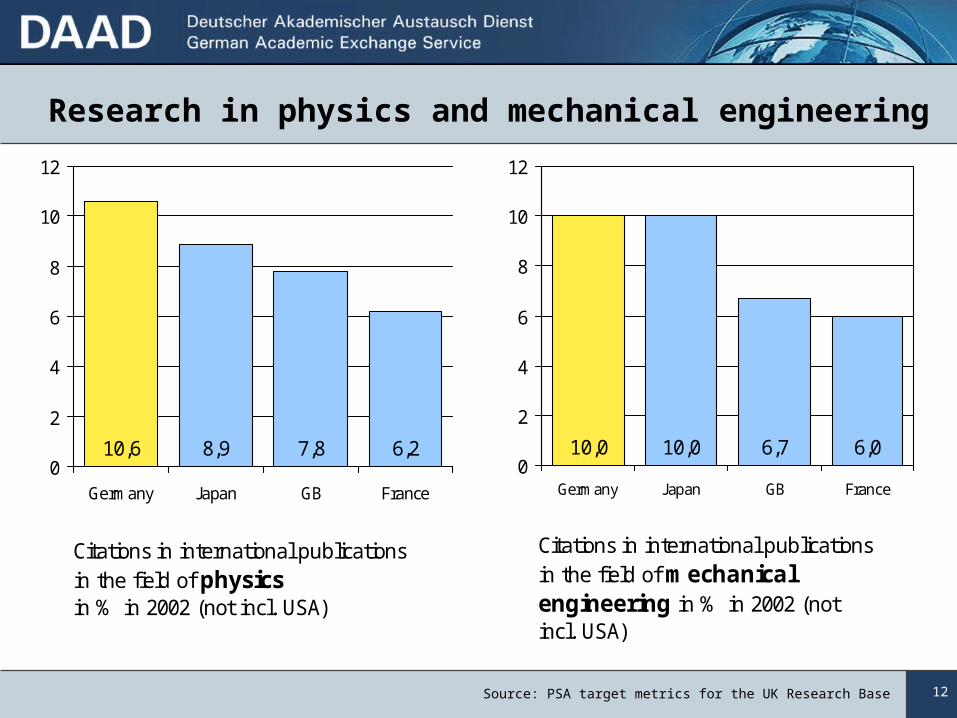
Research in physics and mechanical engineering
Citations in international publications in the field of mechanical engineering in % in 2002 (not incl. USA)
10,0 10,0 6,7 6,00
2
4
6
8
10
12
Germany Japan GB France
Citations in international publications in the field of physics in % in 2002 (not incl. USA)
10,6 8,9 7,8 6,20
2
4
6
8
10
12
Germany Japan GB France
Source: PSA target metrics for the UK Research Base
13
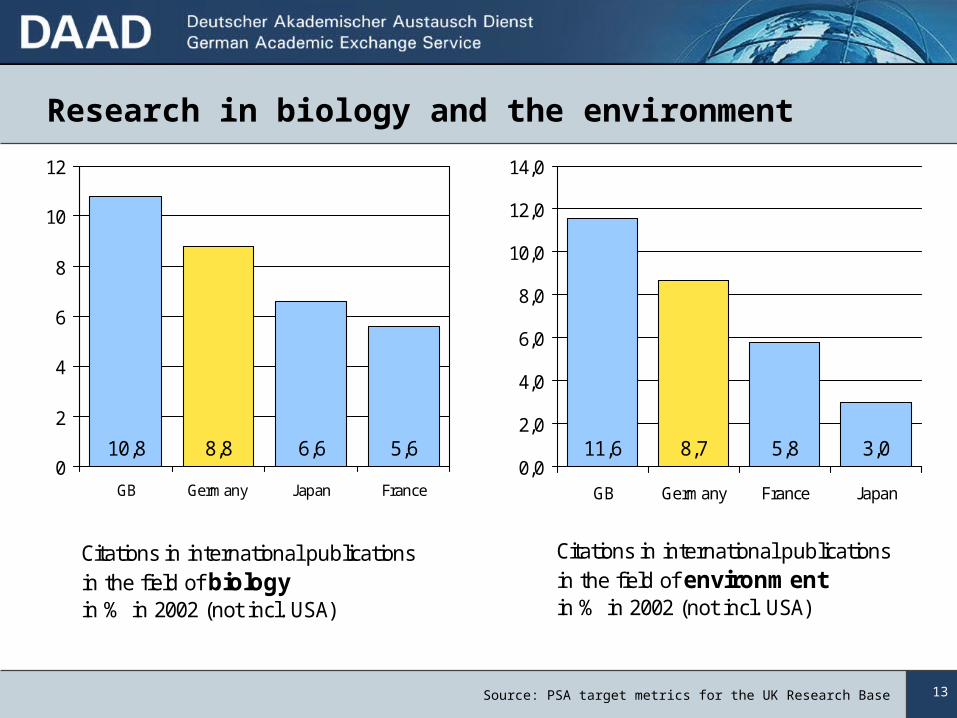
Research in biology and the environment
Source: PSA target metrics for the UK Research Base
Citations in international publications in the field of biologyin % in 2002 (not incl. USA)
10,8 8,8 6,6 5,60
2
4
6
8
10
12
GB Germany Japan France
Citations in international publications in the field of environment in % in 2002 (not incl. USA)
11,6 8,7 5,8 3,00,0
2,0
4,0
6,0
8,0
10,0
12,0
14,0
GB Germany France Japan

14
Research in medicine and mathematics
Citations in international publications in the field of medicine in % in 2002 (not incl. USA)
10,2 7,4 4,8 4,80
2
4
6
8
10
12
GB Germany France Japan
Source: PSA target metrics for the UK Research Base
Citations in international publications in the field of mathematics in % in 2002 (not incl. USA)
10,0 8,6 6,6 4,10
2
4
6
8
10
12
France GB Germany Japan

15
289 99 77 1350 30 20
0
50
100
150
200
250
300
USA GB
Germ
any
Fran
ce
Swed
en
Switz
erlan
dJa
pan
Source: www.nofestibel.com
Nobel Prizes 1901 - 2005
783 Nobel Prizes in total 77 Nobel Prizes to German scientists
16
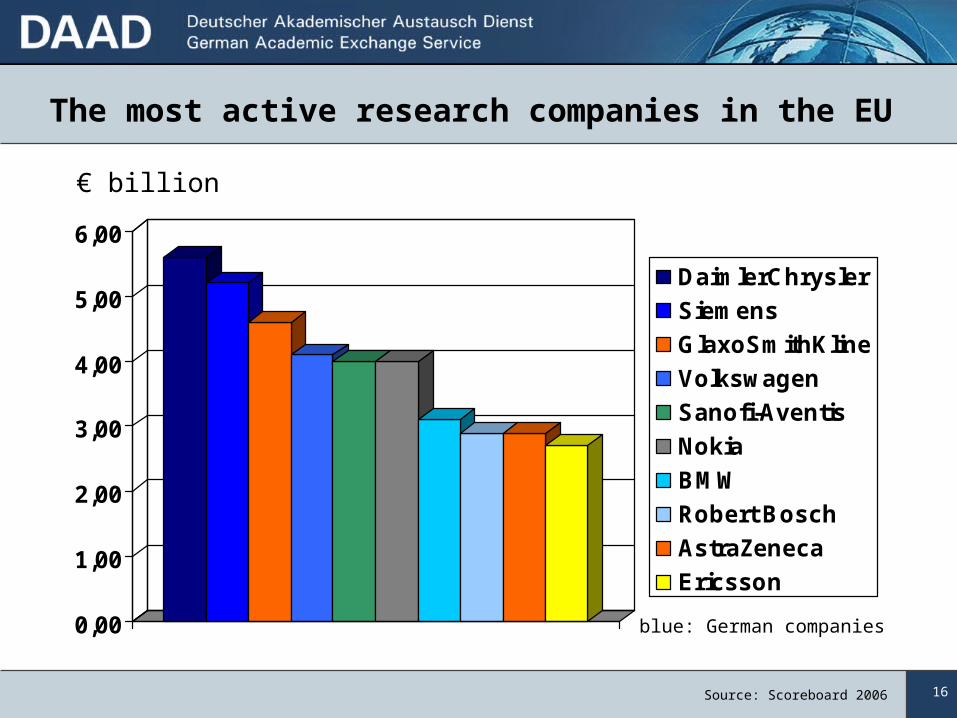
The most active research companies in the EU
0,00
1,00
2,00
3,00
4,00
5,00
6,00
DaimlerChrysler
Siemens
GlaxoSmithKline
Volkswagen
Sanofi-Aventis
Nokia
BMW
Robert Bosch
AstraZeneca
Ericsson
€ billion
Source: Scoreboard 2006
blue: German companies
17
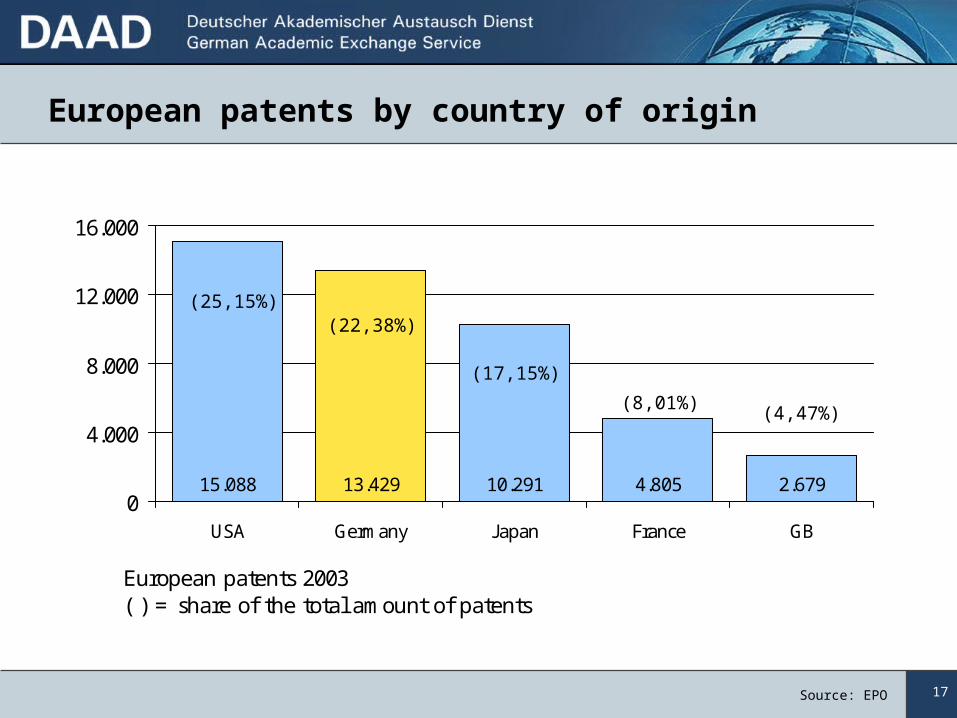
European patents by country of origin
15.088 13.429 10.291 4.805 2.6790
4.000
8.000
12.000
16.000
USA Germany Japan France GB
European patents 2003 ( ) = share of the total amount of patents
Source: EPO
(25,15%)(22,38%)
(17,15%)
(8,01%) (4,47%)
18
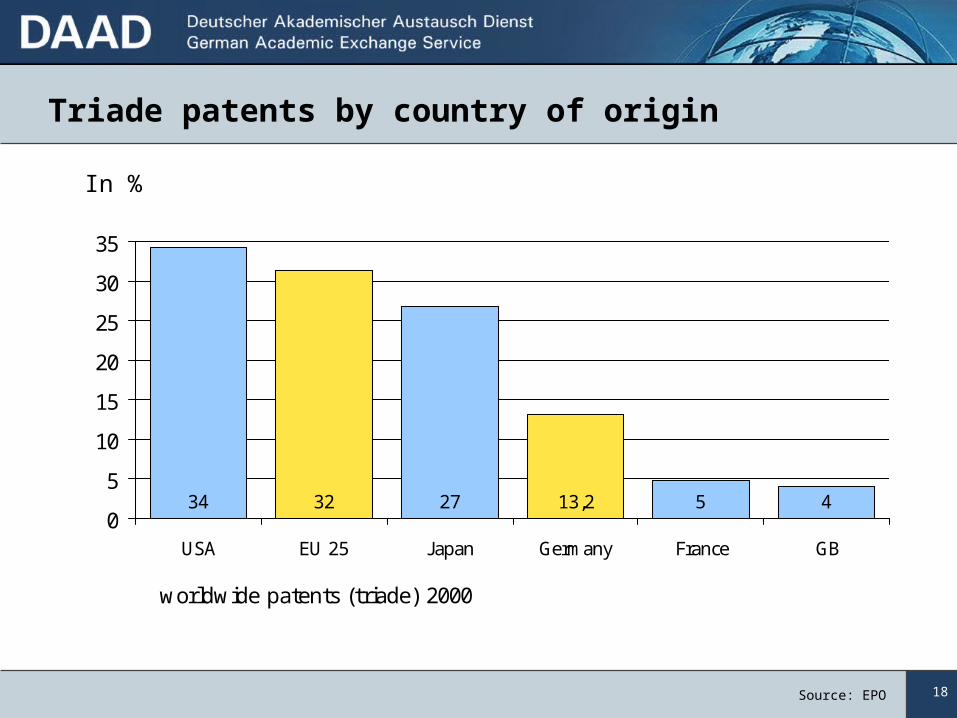
Triade patents by country of origin
34 32 27 13,2 5 40
5
10
15
20
25
30
35
USA EU 25 Japan Germany France GB
worldwide patents (triade) 2000
Source: EPO
In %

19
Worldwide patents - country of origin
Source: EPO, 2005
Germany is world No. 2 and No. 1 in Europe!
Leading research areas:• Automobile research• Nanotechnology, Biotechnology• Environment and energy research
USA
Germany
Japan
Rest of theworld
25 %
19%
17%
Other countries < 7%
20
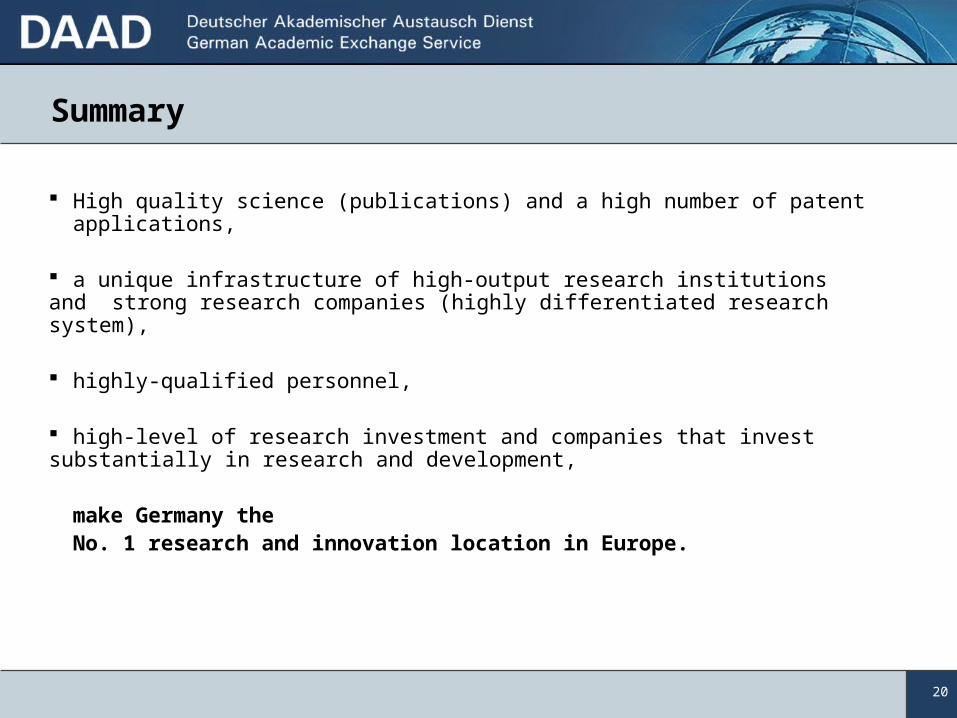
Summary
High quality science (publications) and a high number of patent applications,
a unique infrastructure of high-output research institutions and strong research companies (highly differentiated research system),
highly-qualified personnel,
high-level of research investment and companies that invest substantially in research and development,
make Germany theNo. 1 research and innovation location in Europe.

21
High-tech strategy
Intern. Initiative
Promoting Research in GermanyDAAD
Integration into research policy
22
0
10
20
30
40
50
60
70C
hin
a
US
A
Ind
ia
Ja
pa
n
GB
Ru
ss
ia
Fra
nc
e
Ge
rma
ny
Ne
the
rla
nd
s
Ca
na
da
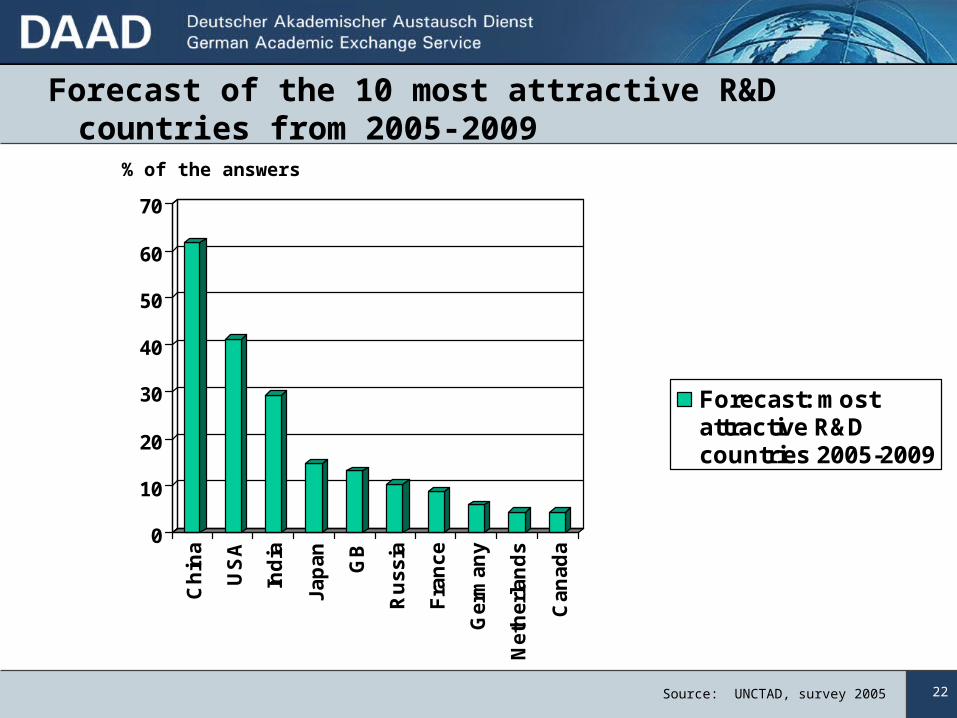
Forecast: mostattractive R&Dcountries 2005-2009
Source: UNCTAD, survey 2005
Forecast of the 10 most attractive R&D countries from 2005-2009
% of the answers

23
Many thanks.
For more informationwww.research-in-germany.de

24
German Nobel Prize winners
1991
Erwin Neher
MPI Göttingen
Medicine
1991
Bert Sakmann
MPI Heidelberg
Medicine
1994
Reinhard Selten
University of Bonn
Business
1995 Christiane Nüsslein-VollhardMPI Tübingen
Medicine
1997Horst L. Störmer Columbia University
Physics
1999
Günther Grass
Literature
2001
Wolfgang Ketterle
MIT Cambridge
Physics
2000 Herbert Kroemer University ofCalifornia
Physics
2005
Theodor W. Hänsch
MPI München
Physics

25Source: Key Figures 2005
0
20
40
60
80
100
Luxe
mbo
urg
Japa
n
Sweden
Finlan
d
Germ
any
Belgium
Irelan
dUSA
EU 25
Other
State
Industry
Ratio of industrial to federal investment
Figures are standardised to 100%
%