why biomath? whynow? -...
TRANSCRIPT
DIMACS Series in Discrete Mathematics
and Theoretical Computer Science
Why BioMath? Why Now?
Fred S. Roberts
Abstract. The rationale for and the opportunities to bring the biology-mathematics interface into the high schools are explored through examplesfrom the author’s career. Among topics considered are (1) epidemiologicalmodeling, (2) biology as information science, (3) physical mapping of DNA,(4) DNA and RNA chains and the “RNA detective game,” (5) systems biol-ogy, (6) graph-theoretical models of the spread of disease, (7) measurement ofcough severity and fatigue, (8) biosurveillance, and (9) location of bioterror-ism sensors. With each, activities appropriate for the high school Biology andMathematics classrooms, and often both in partnership, are described.
1. Introduction
In 2002, I was invited to join the Secretary of Health and Human Services’Smallpox Modeling Group. How was a mathematician selected to join this group?The answer has a lot to do with the theme of this book.
The story I will tell is organized around my own career. One of the goals ofbringing the biology-mathematics interface into the high schools is to open up tostudents the possibilities of new types of careers and in particular careers that blenddisciplines. In turn, the availability of such careers is connected to new, rapidly-increasing, interdisciplinary educational programs in biomath at the college andgraduate school level. Having examples of areas in which new types of careers arepossible can be very helpful. In the process of telling this story, I will give a varietyof examples of activities that are appropriate for high schools. I have tried many ofthem already with high school teachers and/or students. The blending of disciplinesprovides a wonderful vehicle for highlighting each of them, and the examples I givecan be used in either high school Biology or high school Mathematics classes, andoften in both with teachers collaborating in new partnerships.
One of the reviewers of this article felt that it would be helpful for me to sum-marize my educational background and career path. By way of background: MyBachelors, Masters, and Ph.D. degrees are all in Mathematics, though already as anundergraduate I had interests in the connections between Mathematics and otherdisciplines. After getting my Ph.D., I did a postdoctoral fellowship in a PsychologyDepartment, worked in the Math Dept. at a “think tank,” did another postdoc in
The author thanks the National Science Foundation for its support under grants xxxx, yyyyy,zzzzz.
c©2010 American Mathematical Society
1
2 FRED S. ROBERTS
a social sciences group, and then joined the Rutgers University Mathematics De-partment, where I have been on the faculty since 1972. I have been associated withthe Center for Discrete Mathematics and Theoretical Computer Science (DIMACS)since 1988. DIMACS, based at Rutgers, was one of the original National ScienceFoundation “science and technology centers” and is a consortium of academic, in-dustry, and government partners (http://dimacs.rutgers.edu). Since 1996, I havebeen Director of DIMACS, which runs a wide gamut of research and educationprograms with an emphasis on interdisciplinarity.
2. Epidemiological Modeling
My story starts with mathematical modeling of epidemics, though that is morenear the end than the beginning. Epidemiological models of infectious diseases goback to Bernoulli’s mathematical analysis of smallpox in 1760 (Bernoulli [1760]) andsince then mathematical models have been developed for key pathogens such as in-fluenza (see e.g., Lin, Andreasen, and Levin [1999]), malaria (see e.g., Anderson andMay [1991]), gonorrhea (see e.g., Hethcote and Yorke [1984]), tuberculosis (see e.g.,Blower, et al. [1995]), and HIV (see e.g., Perelson, et al. [1996]). Understandinginfectious systems requires being able to reason about highly complex biological sys-tems, with hundreds of demographic and epidemiological variables. Intuition aloneis insufficient to fully understand the dynamics of such systems. Experimentationor field trials are often prohibitively expensive or unethical and do not always leadto fundamental understanding. Therefore, mathematical modeling becomes animportant experimental and analytical tool. Mathematical models have become im-portant tools in analyzing the spread and control of infectious diseases, especiallywhen combined with powerful, modern computer methods for analyzing and/orsimulating the models. Great concern about the deliberate introduction of diseasesby bioterrorists has led to new challenges for mathematical modelers. Great concernabout possibly devastating new diseases like avian influenza or H1N1 virus (“swineflu”) has also led to new challenges for mathematical modelers. Since Bernoulli’spioneering work, mathematical modeling has provided insights into drug-resistance,rate of spread of infection, and effects of treatment and vaccination, and is beingused today to help us deal with emerging disease threats such as SARS or pandemicflu.
The size and overwhelming complexity of modern epidemiological problemscalls for new approaches and tools. As a result, in 2002, DIMACS launched a “Spe-cial Focus” on “Computational and Mathematical Epidemiology” that has pairedmathematicians, computer scientists, and statisticians with epidemiologists, biolo-gists, public health professionals, physicians, etc. (See http://dimacs.rutgers.edu/-SpecialYears/2002 Epid/.) The special focus has featured tutorials, workshops, andresearch working groups and has introduced numerous students and faculty to thesubject of epidemiology and the possible approaches to epidemiological problemsthrough mathematics, computer science, statistics, and other methods. This specialfocus has also led to a wide variety of related activities, including activities thatare bringing materials at the interface between the biological and mathematicalsciences into the high schools and training teachers to bring such materials intotheir classrooms.
While much of traditional mathematical epidemiology uses more advancedmathematical tools such as differential equations, a growing body of methods that

WHY BIOMATH? WHY NOW? 3
use tools accessible to high school students is being developed. These include graph-theoretical models of spread of disease (see section on that topic below) and combi-natorial group testing to test for AIDS and other sexually-transmitted diseases (Duand Hwang [2000]). The biological background required to understand these topicsis minimal and requires only some understanding of hosts, pathogens, incubationperiods, etc. At DIMACS, we have had considerable experience with introducingthese topics at the high school level and have found them to be very successful withboth mathematics and biology students and teachers who do not have a majorbackground in mathematics or one in biology. We started out in 2005 with a pro-gram called the DIMACS BioMath Connect Institute (BMCI) that was DIMACS’first attempt to bring together high school biology and mathematics teachers toexplore topics in biomath together and design activities and prepare materials tobring back to their schools (http://dimacs.rutgers.edu/dci/2005/). BMCI contin-ued in 2006 and then we developed the DIMACS BioMath Connection (BMC) thatis concerned with developing modules at the interface between the biological andmathematical sciences that are usable in both Biology and Mathematics classes inthe high schools. These modules are pilot- and field-tested, and we run programsto train teachers to implement them. To date, modules have been developed orare in the process of being developed in three areas: computational molecular bi-ology, epidemiology, and ecology/population biology. (For more about BMC, seehttp://dimacs.rutgers.edu/BMC/.)
BMC has so far produced three modules in epidemiology that are aimed at bothmath and biology classes in the high schools. They have been pilot-tested and field-tested in the schools and are, at this writing, being revised for completion. The titlesof these modules are: “Mathematical Modeling of Disease Outbreaks,” “ImperfectTesting,” and “Competition in Disease Evolution.” The contents of these modulesreflect a variety of important themes in epidemiology, from a mathematical pointof view.
The module “Mathematical Modeling of Disease Outbreaks” introduces simplemathematical models that can answer some of the following questions: Will therebe a flu outbreak this season? How many individuals will become infected? Howlong will it persist? Would vaccination prevent an epidemic? What other mea-sures could be taken to prevent an epidemic? Two hypothetical infectious diseaseoutbreak investigations serve as the motivating examples and storyline. Studentsreceive an introduction to the basic characteristics of viruses and bacteria and thedifferences in treatment options for diseases they cause. Students then participatein a classroom simulation of the spread of disease to introduce the concepts be-hind the mathematical model before the details of the model are described. Themodel is constructed and the students have the opportunity to interactively see howchanges in the parameters of the model change the pattern of the disease outbreak.For example, students can assume that a certain proportion of the population isvaccinated and compare the resulting outbreak to one where none of the populationis vaccinated. At the end of the module, the students return to the outbreak inves-tigations and are able to understand how epidemiologists might go about trying toanswer the questions posed using mathematical models that incorporate some ofwhat they know about the biology of the pathogen. The Mathematics topics are

4 FRED S. ROBERTS
arithmetic and state graphs, and the Biology topics are viruses, bacteria and thediseases they cause; vaccination, transmission routes and spread of disease.1
The module “Imperfect Testing” uses a case study approach to answer the fol-lowing questions: What do the results of an imperfect medical test actually mean?How does one measure the effectiveness of a particular medical test or comparetests? How does this information affect public policy or personal decision making?The results of a mammogram, like those of many tests, are not always correct. Afalse positive test result may create unnecessary anxiety, while a false negative testresult may result in a false sense of security. The students are presented with thecase of an adult female who learns her mammography test is positive. They thendiscuss the possible implications or outcomes of a positive test result, given theproperties of the test. These properties, which include sensitivity and specificity,help to determine the rates of incorrect test results and the predictive value of atest for a single individual. Next the woman has a genetic test where she learnsshe has the BRCA gene mutations associated with breast cancer. This leads to adilemma for her daughter who must now decide if she will be tested for this BRCAallele. Since results from testing for this allele still do not completely determinewhether or not she will develop breast cancer, the students now learn about theconcept of relative risk. The Mathematics topics include probability, conditionalprobability, ratios, and graphing a rational function, and the Biology topics includegenetic testing, genetic variation, ethical choices, decision making based on datainterpretation, taking perspectives, and gold standards. This module can be usedin classes in biology, anatomy, algebra I, and algebra II.
In the module “Competition in Disease Evolution,” students learn to considerinfectious diseases from the perspective of evolutionary biology on a basic level.They gain an understanding of how different methods of pathogen reproductioncan greatly affect the evolutionary fitness of a disease. After learning to computesimple and conditional probabilities, students use this to calculate probable levelsof exposure to a disease in a population, probabilities of infection given exposure,and expected population-level rates of disease incidence. The Mathematics topicsinclude rounding real numbers to integers, and converting among fractions, decimalrepresentations and percentages, and the Biology topics include disease transmis-sion, evolutionary fitness, natural selection, and evolutionary competition. Thismodule is appropriate for use in Pre-Algebra or Algebra 1 courses, or in any bi-ology class (Introductory through AP) that covers concepts of evolution and/orreproductive fitness. After using this module in her school, Vicki Shirley, a teacherfrom Corinth, Mississippi, indicated that contributions to the disciplines of mathe-matics, biology and teaching do indeed overlap: “The chance to ‘team-teach’ sucha real-world topic was beneficial to both our students and to us (the teachers).Debbie, my partner, knew the biology and I knew the math so when you put ustogether .... we were a dynamite duo! Having us both in the classroom togethergave the students two experts and we were able to field any question they had aboutthe module. Together we were able to truly help the students to understand thatMath and Biology can be used together to solve real-world problems. (Before this
1This paragraph and the next two are taken from the BMC Project Annual Report to theNational Science Foundation, September 2008 and, in turn, were taken from teacher materials forthe modules.
WHY BIOMATH? WHY NOW? 5
module, the students didn’t even know that Biology and Math were even remotelyrelated!!!)”2
In describing the result of using these modules in her classroom, biology teacherKathy Gabric from Hinsdale Central High School, Hinsdale, Illinois, told us3:“Bringing the modules into my classroom has really opened my eyes. Studentsthat are not so keen on biology but love math are suddenly animated. Studentsthat love biology but are not so great at math, begin to see that the two go handin hand. As they say on TV ‘numbers are everywhere’. The modules have takenthe topics they cover to a whole new level. The visualization that the math allowsresults in fantastic discussions about what is really occurring.”
In sum, mathematical epidemiology is a wonderful vehicle for bringing theinterface between the biological and mathematical sciences into the schools.
3. Biology as an Information Science
I have long been interested in applications of mathematics. I became interestedin mathematical problems in biology very early in my career, well before smallpoxand mathematical epidemiology became a major interest of mine. As a graduatestudent at Stanford University in the 1960s, I worked on a problem posed by award-winning geneticist Seymour Benzer. The problem involved molecular biology.
Molecular biology is a prime example of the new biology. Many biologicalphenomena are coming to be viewed as involving the processing of information(Jackson [2005]). Computer and information science are playing an increasing rolein modern computational molecular biology and were critical players in the scientificbreakthrough of sequencing the human genome. We played a role in this at DI-MACS through the DIMACS Special “Year” on Mathematical Support for Molec-ular Biology (1994-2000) (see http://dimacs.rutgers.edu/SpecialYears/1994 1995-index.html). During this six-year program, we invited biological and mathematicalscientists to collaborate, held workshops and tutorials, and led many previouslyesoteric topics such as alignments, physical mapping, and phylogeny reconstructionto become central areas of research in computer science and their precise math-ematical formulation to become a building block for development of progress incomputational molecular biology. Through such partnerships between biologicaland mathematical scientists, a variety of topics in biology have come to be stud-ied from an information science point of view; examples include gene finding andmotif recognition, protein and RNA folding, protein structure prediction, and link-age analysis. Through partnerships between mathematical and biological scien-tists, major new areas of research have been developed, stimulated by the avail-ability of massive amounts of new data, the integration of experimental methodswith algorithmic methods, and the development of powerful new tools for modelingever-more-complex biological systems. In recent years, the term “digital biology”(Morris, et al. [2005]) has come to be used to represent such trends in the biologicalsciences.
Just as ideas from computer science and mathematics have led to new biologicalideas and research areas, biological ideas have inspired new concepts and methodsin information science. Increasingly, for example, analogies with naturally occurring
2The feedback from the teacher came from the extensive evaluation we did of the field-testingof the module, and was reported by our evaluator, Professor Len Albright.
3Private communication via email, September 2008.
6 FRED S. ROBERTS
biological phenomena such as “swarming” have led to paradigms for new computeralgorithms.
It is not surprising that many undergraduate and graduate students are study-ing topics at the intersection between the mathematical and biological sciences. A2008 US-China Computer Science Leadership Summit, which I organized in Arling-ton, Virginia, brought this point home in a dramatic way. The participants weredeans, directors, and department chairs of leading computer science departmentsin the US and China. A major portion of the program was devoted to the increas-ing interplay between computer science and biology and for the need to find newways to train computer scientists to work in this area. There is similar interestin doing this for students in the biological sciences. Both themes have been em-phasized in such conferences and reports as Hastings, et al., [2002], Hastings andPalmer [2003], Levin, et al., [1997], Palmer, et al., [2003]. A variety of sourceshave called for programs integrating mathematics and biology at the undergradu-ate level. The report BIO2010 (Board on Life Sciences [2003]) recommends thatconcepts, examples, and techniques from math and the physical and informationsciences be included in biology courses and that biological concepts and examplesbe included in other science courses. The National Institute of General MedicalSciences at NIH has launched an initiative to incorporate more mathematics andphysics in the biology curriculum. The Biomedical Information Science and Tech-nology Initiative at NIH (see http://www.bisti.nih.gov/) has launched a variety ofprograms to support development of connections between the mathematical andbiological sciences. The Mathematical Association of America report Math & Bio2010 (Steen [2005]) describes efforts at the undergraduate level to reduce barriersto cross-disciplinary collaboration and activities.
While the interface between the biological and mathematical sciences at theundergraduate and graduate level has taken off, high schools have done little to in-troduce students to these interconnections. In April 2005, Midge Cozzens and I or-ganized the first international conference on linking the biological and mathematicalsciences in the high schools at DIMACS (http://dimacs.rutgers.edu/Workshops/-Biomath/). At that conference, a number of speakers emphasized the possibilitythat introducing high school students to topics in biomath will enhance the studyof both disciplines. It is likely that students interested in mathematics will findbiological applications as a motivation to study more mathematics, as they willsee how math is useful. Similarly, students in biology who are exposed to mod-ern math/computer science topics relevant to biology will come to understand theimportance of understanding modern mathematics and computer science. In bothcases, there will be an opportunity to introduce students to new career possibilitiesand to newly-developing opportunities for further study.
Bringing the interconnections between the mathematical and biological sciencesinto the high schools requires new curricular materials that teachers can use. De-velopment of such materials is the principal goal of the DIMACS BMC programthat was discussed above. Moreover, we need to train teachers to use these newmaterials, and this will involve exposing them to the interface between the dis-ciplines. Teachers from different disciplines need to learn each others’ language,open lines of communication, and develop new approaches for introducing cross-disciplinary topics. This was a major goal of the DIMACS BMCI program, andthis goal continued in the DIMACS BMC program. Through BMCI and BMC, we

WHY BIOMATH? WHY NOW? 7
have experimented with methods to prepare teachers to use our interdisciplinarymaterials, and we have started to evaluate these methods, document them, anddisseminate the documentation.
Molecular biology programs at BMC and BMCI have been built around suchtopics as global and local string alignment algorithms; the BLAST algorithm, in-cluding algorithms for protein sequences; FAST algorithms (FASTP, FASTA); PAMmatrices; phylogenetic trees and tree parsimony; phylogenetic tree reconstructionand phylogenetic footprinting; and genome rearrangement. These topics use math-ematical methods that are easily accessible to high school students and do notrequire sophisticated mathematical background. The basic mathematics requiredinvolves graph theory, counting principles, the basics of probability, and the notionsof string, substring, and superstring from computer science. The biological back-ground for the topics involves the basics of genomes, sequences, genes, introns andexons, the genetic code, transcription, and translation, and is readily explained.
Three BMC modules in computational molecular biology have been pilot- andfield-tested through BMC. “Biomatrices (Evolution by Substitution)” deals primar-ily with evolutionary processes resulting in amino acid substitutions due to changesin DNA; it does not assume any prior knowledge about biology. The mathematicalcontent includes single- and multi-stage probability events, disjoint and indepen-dent events, matrices, matrix multiplication, and powers of matrices. The moduledoes not assume any prior knowledge about biology. Some very basic knowledge ofchemistry would be useful. Mathematics prerequisites are decimal multiplicationand percentage calculations. Other mathematics topics in this module are not as-sumed as prior knowledge, and are developed in such a way that students can learnthem for the first time or refresh their prior knowledge of those topics. The moduleis written to provide students clear access to the problem under investigation. Thelessons were developed with the assumption that students have no prior exposureto matrices, or Markov chains, and minimal understanding of probability. Practiceproblems are provided to reinforce the key concepts and to vary the relative amountof attention paid to the content in each lesson of the module. At the completion ofthe module, assessment questions are also provided to determine what the studentshave learned and are capable of doing.4
In the module “Genetic Inversions,” students apply the basic concepts of DNAand evolution to a particular kind of genetic mutation. They play a game involvingthe rearranging of sequences by inverting subsequences. Next, they are challengedto develop and write an algorithm for carrying out inversions. Finally, an improvedalgorithm is introduced and analyzed. Students connect the algorithm with theconcept of gene mutation, and with the evolutionary distances that separate differ-ent species of animals. There is no assumption of any background in either biologyor mathematics so that the module should be appropriate in all high school classes.
The module “Spider Silk” asks students to apply knowledge of protein structureand function to pose and answer the fundamental question: What alignment oftwo sequences is biologically most meaningful? The module develops the basicmathematical principles that underlie computer programs used to align amino acids
4This paragraph and the next two are taken from the BMC Project Annual Report to theNational Science Foundation, September 2008 and, in turn, were taken from teacher materials forthe modules.

8 FRED S. ROBERTS
nearly instantaneously. After becoming familiar with spiders, their webs and theirsilks, students use graphs (networks), dynamic programming, and recursive thinkingto model sequence alignments. Then students use the computer program BiologyStudent Workbench (BSW) (http://bsw-uiuc.net/) to align the amino acids of silksfrom different species of spiders and interpret their differences. “Spider Silk” canbe used in its entirety in either a Biology class or a Math class. If less time isavailable, Days 1-3 can stand alone in a Math setting, or Days 1, 4, and 5 could beused alone in Biology. Ideally the module could be team-taught by a pair of mathand biology teachers. This module is appropriate for use with Biology 1 studentswho have studied protein structure, synthesis, and function, and classification oforganisms. It would be an appropriate capstone to the study of DNA/RNA andprotein synthesis in biology. Mathematically, “Spider Silk” would be an appropriateunit of study in a discrete mathematics course, either as a self-contained unit orin conjunction with the study of graph theory or recursion. Alternately, it couldbe used in more traditional math courses to introduce discrete mathematics topicsas enrichment or to examine recursion in an applied setting in preparation for thestudy of sequences.
All biology students should be exposed to topics such as these because it isdifficult to appreciate modern biology without viewing it through the lens of themathematics underlying information science. Mathematics students should also beexposed to such topics, to enhance their appreciation for the wide variety of usesof modern mathematics. While I was not exposed to these topics in high school,my first exposure to the biology-mathematics interface came as a sophomore atDartmouth College, when I learned about predator-prey models. That exposureopened up many new horizons for me. I followed that in graduate school at StanfordUniversity with a Ph.D. thesis that combined my growing interest in the social andbehavioral sciences (also stemming from Dartmouth) with a biological motivation,and, as mentioned above, included work on a problem posed by geneticist SeymourBenzer.
4. Benzer’s Problem
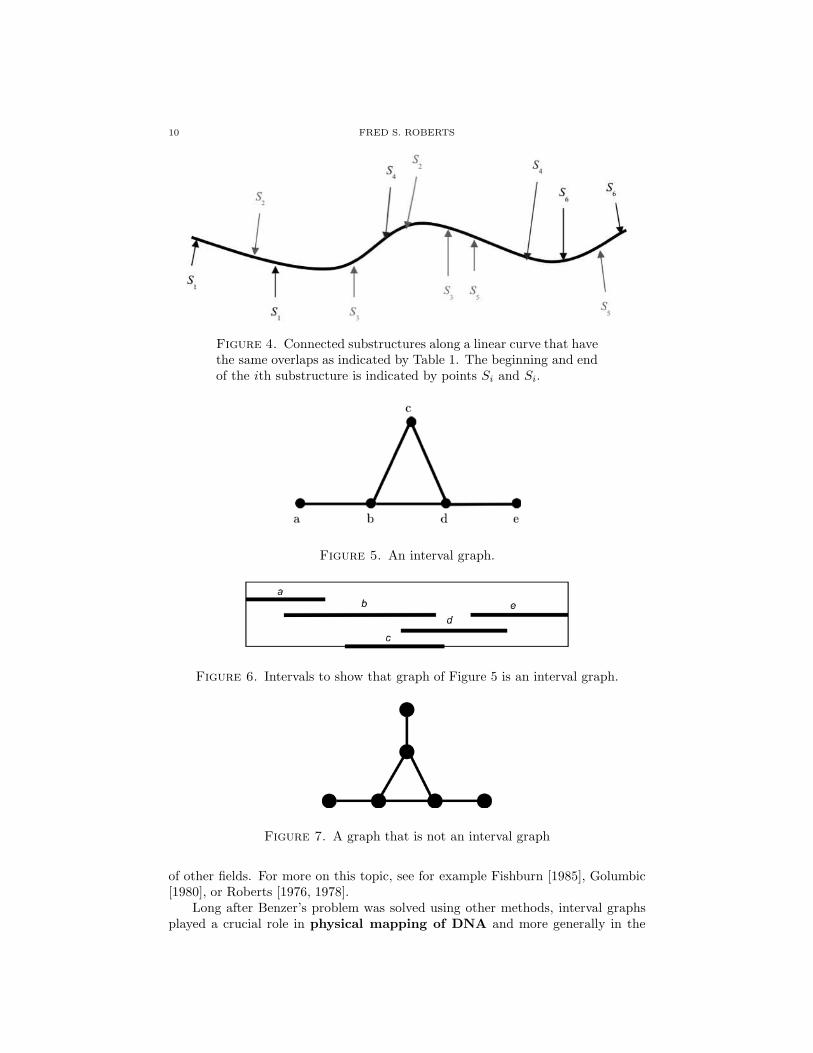
Benzer’s problem was posed in the late 1950s and, briefly put, asked: Howcan you understand the “fine structure” inside the gene without being able to seeinside? (This was in the days before gel electrophoresis and modern methods ofsequencing genomes.) Classically, geneticists had treated the chromosome as alinear arrangement of genes. Benzer [1959, 1962] asked whether the same thingwas true for the “fine structure” inside the gene. So, was the gene fundamentallylinear (as in Figure 1)? Or did it have a circular structure (as in Figure 2)? Afigure-eight structure (as in Figure 3)? At the time, we could not observe thefine structure directly. Benzer studied mutations. He assumed mutations involved“connected substructures” of the gene. By gathering mutation data, he was ableto surmise whether or not two mutations overlapped. Consider the data in Table1, where the i,j entry is 1 if mutations Si and Sj overlap and 0 otherwise. Figure 4shows connected substructures along a linear curve that have the same overlaps asindicated by Table 1. The beginning and end of the ith substructure is indicatedby points Si and Si. Asking students to do the same thing for other tabular datais an activity that is readily accessible at the high school level. Benzer’s 1959paper gave overlap data for a small portion of the genetic structure of a certain

WHY BIOMATH? WHY NOW? 9
virus, bacteriophage T4 (phage T4). The overlap data for 19 mutants of phage T4is consistent with the hypothesis of linearity. This data and corresponding linearrepresentation are shown in Roberts [1976]. Benzer’s paper includes partial overlapdata for 145 mutations of phage T4. This data is also consistent with the hypothesisof linearity. Having students look up Benzer’s 19-mutation data and checking thelinearity makes for a good exercise.
Figure 1. Linear Structure for Gene.
Figure 2. Circular structure for fine structure in the gene.
Figure 3. Figure-eight structure for fine structure inside the gene.
S1 S2 S3 S4 S5 S6
S1 1 1 0 0 0 0S2 1 1 1 1 0 0S3 0 1 1 1 0 0S4 0 1 1 1 1 0S5 0 0 0 1 1 1S6 0 0 0 0 1 1
Table 1. The i, j entry is 1 if the mutations Si and Sj overlap, 0otherwise. (The example is from Roberts [1976].)
Suppose we represent the tabular (matrix) information as a vertex-edge graphwith vertices corresponding to the rows and columns of the matrix and the verticescorresponding to rows i and j joined by an edge if and only if the i, j entry ofthe matrix is 1. Then if we can find such corresponding substructures along alinear curve, we say that the graph is an interval graph. Interval graphs havebeen very important in genetics. Figure 5 gives an example. To show that it is aninterval graph, we find intervals, one for each vertex, whose corresponding overlapscorrespond exactly to the edges in the graph. Such intervals are shown in Figure 6.A good exercise is to show that the cycle of length 4 is not an interval graph. Nor isthe graph of Figure 7. Today, there are efficient algorithms for recognizing intervalgraphs and they have a great many applications both in biology and in a variety
10 FRED S. ROBERTS
Figure 4. Connected substructures along a linear curve that havethe same overlaps as indicated by Table 1. The beginning and endof the ith substructure is indicated by points Si and Si.
Figure 5. An interval graph.
Figure 6. Intervals to show that graph of Figure 5 is an interval graph.
Figure 7. A graph that is not an interval graph
of other fields. For more on this topic, see for example Fishburn [1985], Golumbic[1980], or Roberts [1976, 1978].
Long after Benzer’s problem was solved using other methods, interval graphsplayed a crucial role in physical mapping of DNA and more generally in the

WHY BIOMATH? WHY NOW? 11
mapping of the human genome. A physical map represents a piece of DNA,telling us the location of certain markers along the molecule, markers being pre-cisely defined subsequences. In physical mapping, the first step is to make copiesof the molecule we wish to map – the target molecule. Then we break each copyinto disjoint fragments using restriction enzymes (more on fragments in the nextsection). We obtain overlap information about the fragments and then use theoverlap information to obtain the mapping. One method of obtaining the overlapinformation is called hybridization. The fragments are replicated, giving us thou-sands of clones. The DNA fingerprinting is used to check if small subsequencescalled probes bind to fragments. The fingerprint of a clone is the subset of probesthat bind to it. Two clones sharing part of their fingerprints are likely to havecome from overlapping regions of the target DNA. From the overlap information,we create a fragment overlap graph whose vertices are fragments (clones) andwith an edge joining two fragments (clones) if they overlap. If the clone overlap in-formation is complete and correct, the fragment overlap graph is an interval graph.Then the corresponding “map” of intervals gives the relative order of fragments onthe target DNA and this gives the beginning of a “physical map” of the DNA. Formore details about this process, see for example Setubal and Meidanis [1997]; thepreceding paragraph borrows heavily from their introduction to physical mapping.
5. DNA Chains and RNA Chains
So how did I get from Benzer’s problem to modeling smallpox for the Secre-tary of Health and Human Services?5 It has become increasingly clear, as I saidabove, that biology has become an information science. How so starts withdeoxyribonucleic acid, DNA, the basic building block of inheritance and carrier ofgenetic information. DNA can be thought of as a chain consisting of bases. Eachbase is one of four possible chemicals: Thymine (T), Cytosine (C), Adenine (A),Guanine (G). Thus, using shorthand, the following are DNA chains:
GGATCCTGG, TTCGCAAAAAGAATC.
However, real DNA chains are long. That in Algae is 6.6× 10⁵ bases long; that inslime mold 5.4 × 10⁷ bases long; that in a fruit fly 1.4 × 10⁸ bases long; that in achicken 1.2× 10⁹ bases long. DNA in humans is 3.3× 10⁹ bases long. The sequenceof bases in DNA encodes certain genetic information. In particular, it determineslong chains of amino acids known as proteins.
RNA is a “messenger molecule” whose links are defined from DNA. An RNAchain has at each link one of four bases, the same as those in DNA except thatthe base Uracil (U) replaces the base Thymine (T). Thus, GGAGUUCCAGU is anexample of an RNA chain.
DNA and RNA provide prime examples of how fundamental mathematicalmethods of counting can be important in molecular biology and explained to highschool students. Let us start by asking: How many possible DNA chains are there inhumans? To answer this question, we apply the fundamental rule of combinatoricsknown as the Product Rule. Let us start with a simpler question: How manysequences of 0’s and 1’s are there of length 2? There are 2 ways to choose the firstdigit and, no matter how we choose the first digit, there are two ways to choose
5This section borrows heavily from Roberts and Tesman [2009]. All of the examples are takenfrom that book.

12 FRED S. ROBERTS
the second digit. Thus, there are 2× 2 = 22 = 4 ways to choose the sequence. Thefour possible sequences are:
00, 01, 10, 11
How many sequences of 0’s and 1’s are there of length 3? By similar reasoning, wesee that this is 2× 2× 2 = 23 = 8.
This reasoning illustrates the Product Rule: If something can happen in n1
ways and, no matter how the first thing happens, a second thing can happen in n2
ways, then the two things together can happen in n1 × n2 ways. More generally,if something can happen in n1 ways and, no matter how the first thing happens,a second thing can happen in n2 ways, and, no matter how the first two thingshappen, a third thing can happen in n3 ways, . . . then all the things together canhappen in n1 × n2 × n3 × . . . ways.
So, how many possible DNA chains are there in humans? How many DNAchains are there with two bases? Using the product rule, we see that this is 4× 4 =42 = 16. There are 4 choices for the first base and, for each such choice, 4 choices forthe second base. How many DNA chains are there with 3 bases? We get 43 = 64.How many with n bases? We get 4n. By this reasoning, the number of possiblehuman DNA chains is 4∧ (3.3× 10⁹), i.e., 4 to the 3.3× 10⁹ power. How big is thisnumber? It is greater than 10 ∧ (1.98× 10⁹) (1 followed by 198 million zeroes). Asimple counting argument helps us to understand the remarkable diversity of life.Perhaps mathematical modeling will help us protect this rich array of life on ourplanet.
More sophisticated counting arguments can also help us to understand issuesof molecular biology. RNA chains are very long. Early in the era of modernmolecular biology, scientists asked if we can we discover what they look like withoutactually observing them. The trick they used was to split up long RNA chains intosmaller ones, called fragments, using enzymes. The idea behind this leads to amathematical challenge that I call the “RNA Detective Game,” but which inthe history of molecular biology was called the fragmentation stratagem. Someenzymes break up an RNA chain into fragments after each G link and others breakup the chain after each C or U link. For example, consider the chain
Chain K: CCGGUCCGAAAG
Applying the G enzyme breaks the chain into the following fragments:
G fragments: CCG, G, UCCG, AAAG
We know that these are the fragments, but we do not know the order in which theyappear. How many possible chains have these four fragments? Again using theproduct rule, we see that there are 4 choices for the first fragment, for each suchchoice 3 choices for second fragment, . . . . Thus, there are 4 × 3 × 2× 1 = 4! = 24possible chains. There is one chain corresponding to each permutation of these fourfragments. One such chain different from the original is
UCCGGCCGAAAG
Suppose we instead apply the U,C enzyme to the chain K. We get the followingfragments:
U,C fragments: C, C, GGU, C, C, GAAAG
How many chains are there with these fragments? Is 6! = 720 the correct answer?Two of the permutations are the one that takes the fragments in the order givenand the one that takes the second fragment first and the first second and all others

WHY BIOMATH? WHY NOW? 13
in this order. They give rise to the same chain. So 6! is wrong. What is the answer?What if the fragments were
C, C, C, C, C?
There are 5! permutations of these fragments, but only one RNA chain with thesefragments:
CCCCC
To understand how to find the answer to this kind of counting problem, let usconsider a classical combinatorics problem of putting n distinguishable balls into kdistinguishable boxes. The number of ways to put n1 balls into the first box, n2 ballsinto the second box, . . . , nk balls into the kth box is denoted by C(n;n1, n2, . . . , nk),where n = n1 + n2 + . . . nk. It is well known that this multinomial coefficient isgiven by:
C(n;n1, n2, . . . , nk) = n!/n1!n2!...nk!
Using this formula, we can calculate how many RNA chains of length 6 have 3 C’sand 3 A’s. Think of 2 boxes, a C box and an A box. How many ways are there toput 3 positions (balls) into the C box and 3 into the A box? (Similarly, if a familyhas 3 boys and 3 girls, how many different orders are there for the 6 children tobe born?) The answer is C(6; 3, 3) = 6!/3!3! = 20. Some of these RNA chains are:CACACA, ACACAC, AAACCC. If a 6-link RNA chain is chosen at random, whatis the probability of obtaining one with 3 C’s and 3 A’s? There are 46 possibleRNA chains of length 6. Thus, the probability is given by
C(6; 3, 3)/46 = 20/4096 ≈ 0.005.
The number of 10-link RNA chains consisting of 3 A’s, 2 C’s, 2 U’s, and 3 G’s isC(10; 3, 2, 2, 3) = 25, 200. What if we know they end in AAG? Then, only the first7 positions need to be filled, and 2 A’s and one G are already used up. Hence,the answer is C(7; 1, 2, 2, 2) = 630. Notice how knowing the end of a chain candramatically reduce the number of possible chains.
We can now return to the U,C fragments of the RNA chain K. We have alreadyobserved that the number of RNA chains with these fragments is not 6! = 720.To calculate the answer, think of having 6 positions (there are 6 fragments) andassigning 4 positions to the C box, 1 to the GGU box, and 1 to the GAAAG box.Then, we see that the number of ways of doing this is given by
C(6; 4, 1, 1) = 6!/4!1!1! = 30
Actually, this computation is still a bit off, though not because the combinatorialargument is wrong. Notice that the fragment GAAAG does not end in U or C.Thus, we know it comes last. There are 5 remaining U,C fragments. The numberof chains beginning with these 5 fragments is given by C(5; 4, 1) = 5. These chainsbegin as follows:
CCCCGGU, CCCGGUC, CCGGUCC, CGGUCCC, GGUCCCC
We get all chains with the given U,C fragments by adding GAAAG to the end ofeach of these:
CCCCGGUGAAAG, CCCGGUCGAAAG, CCGGUCCGAAAG,CGGUCCCGAAAG, GGUCCCCGAAAG
Thus, there are 24 possible chains with the given G fragments and 5 with thepossible U,C fragments.

14 FRED S. ROBERTS
However, we have not yet combined our knowledge of both G and U,C frag-ments. Which of the 5 chains above with the given U,C fragments have the right Gfragments? CCCCGGUGAAAG does not: It has CCCCG as a G fragment. Check-ing the remaining 4 possible RNA chains with the given U,C fragments shows thatonly the third one has the given G fragments. Hence, we have recovered the initialchain. This is an example of recovery of an RNA chain given a complete digestby enzymes.
How remarkable is it that we could recover the initial RNA chain this way?How many RNA chains are there with the same bases as chain K? There are 12bases: 4 C’s, 4 G’s, 3 A’s, and 1 U. The number of chains with these bases is givenby C(12; 4, 4, 3, 1) = 138, 600. Thus, knowing the number of bases is not nearly asuseful as knowing the fragments.
Consider another example. Suppose an unknown chain has the following frag-ments:
G fragments: UG, ACG, ACU,C fragments: U, GAC, GAC
Does any fragment have to come last? The G fragment AC has to come last becauseit doesn’t end in G. Thus, the other two G fragments come first in some order andthere are only two possible RNA chains with these G fragments: UGACGAC,ACGUGAC. The latter has AC as a U,C fragment. So, the former is the correctchain.
Is it always possible to completely recover the original RNA chain given its Gfragments and U,C fragments? The answer is no, i.e., that there are two distinctRNA chains with the same G and U,C fragments. Finding two such RNA chainsmakes for a good exercise, certainly appropriate for the high school classroom. Itis one of many good exercises surrounding this “RNA Detective Game.” For moreon the RNA Detective Game, see Roberts and Tesman [2009].
The fragmentation stratagem we have described was used by R.W. Holley andhis colleagues at Cornell in 1965 (Holley, et al. [1965]) to determine the first nucleicacid sequence. The method is not used anymore and was only used for a short timebefore other, more efficient methods were adopted. However, it has great historicalsignificance and illustrates an important role for mathematical methods in biology.Currently, by use of radioactive marking and high-speed computer analysis, it ispossible to sequence long RNA and DNA chains rather quickly. The mathematicalpower of the fragmentation stratagem, nevertheless, is a good illustration of theuse of methods of discrete mathematics in modern molecular biology (and of thepower of counting) at a level that is understandable in the high school classroom.Brother Patrick Carney of DePaul Catholic High School, Wayne, New Jersey re-ports (personal communication) having presented the RNA Detective Game to hisstudents with considerable success.
6. Systems Biology
Simple counting arguments, as we have noted, can lead us to an apprecia-tion of the remarkable diversity of life on earth. Modern mathematical methodsallow us to deal with huge ecosystems and understand massive amounts of eco-logical data. Mathematical ecology and population biology has a long history.Yet, modern biology runs the gamut between understanding very huge systems

WHY BIOMATH? WHY NOW? 15
and very tiny systems. In 2003, the National Science Foundation and the Na-tional Institutes of Health asked me to organize a Workshop entitled Informa-tion Processing in the Biological Organism (A Systems Biology Approach). (Seehttp://dimacs.rutgers.edu/Workshops/InfoProcess/ for information and a programof the Workshop.) The key thesis of the Workshop was that the potential for dra-matic new biological knowledge arises from investigating the complex interactionsof many different levels of biological information.
Such information starts from the small: DNA, RNA, and proteins. It extendsto protein interactions and biomolecules, protein and gene networks, and fromthere to cells, organs, individuals, populations, and ecosystems. The Workshopinvestigated information processing in biological organisms from a systems point ofview – the point of view in the modern area of research known as systems biology.The list of “parts” is a necessary but not sufficient condition for understandingbiological function. Understanding how the parts work is also important. But itis not enough. We need to know how they work together. This is the systemsapproach. The Workshop was organized around four themes illustrative of thesystems approach: Genetics to gene-product information flows; signal fusion withinthe cell; cell-to-cell communication; and information flow at the whole system level,including environmental interactions.
Some examples discussed at the Workshop will illustrate this approach. Prince-ton University professor Bonnie Bassler talked about her work on information pro-cessing between bacteria that helps squids maneuver in the dark. Bacteria processthe information about the local density of other bacteria through a chemical lan-guage that allows them to “count” numbers of other bacteria and react as a popu-lation when this number has reached a “critical mass.” They use this, for example,to produce luminescence. The process involved can be modeled by a mathemati-cal model involving quorum sensing. Similar quorum sensing has been observedin over 70 species. For more on this topic, see http://www.hhmi.org/research/-investigators/basslerbio.html and http://www.molbio.princeton.edu/index.php?option=content&task=view&id=27 (Quorum sensing is anticipated to be the topicof a future module in the BMC project.)
A second example involved a feedback system called the “P53-MDM2” loop,which is used in DNA damage repair. This was presented by Uri Alon, WeizmannInstitute, and Galit Lahav, Harvard University. Alon and Lahav and their col-laborators (Lahav, et al., [2004]) modeled the process by which the P53 - MDM2feedback loop contributes to the regulation of DNA damage repair. This loop re-sults in a warning signal when there is stress to the DNA and the system thendecides whether to repair the damage or allow a cell to die – the death of a cellmight protect the life of the organism.
A third example, based on the work of Raimund Winslow of Johns HopkinsUniversity, was concerned with mathematical modeling of systems in the body suchas the heart, specifically of phenomena arising in excitation/contraction couplingin the ventricle. Winslow’s models (Hinch, et al. [2004]) study the behavior ofcalcium release channels, which are understandable using stochastic models basedon notions of probability. The work has application to the connection betweenheart failure and sudden cardiac death.
These three examples involve more sophisticated mathematics than the count-ing ones, in fact dynamical systems and differential equations. However, at some
16 FRED S. ROBERTS
level, these too can be explained to high school students. Feedback loops canbe represented as vertex-edge graphs. Quorum sensing involves simple conceptslike majority rule. The stochastic nature of calcium release and other biologicalphenomena can be discussed at the level of simple probabilities. What is mostimportant here is the wide variety of biological phenomena that can be discussedusing mathematical language.
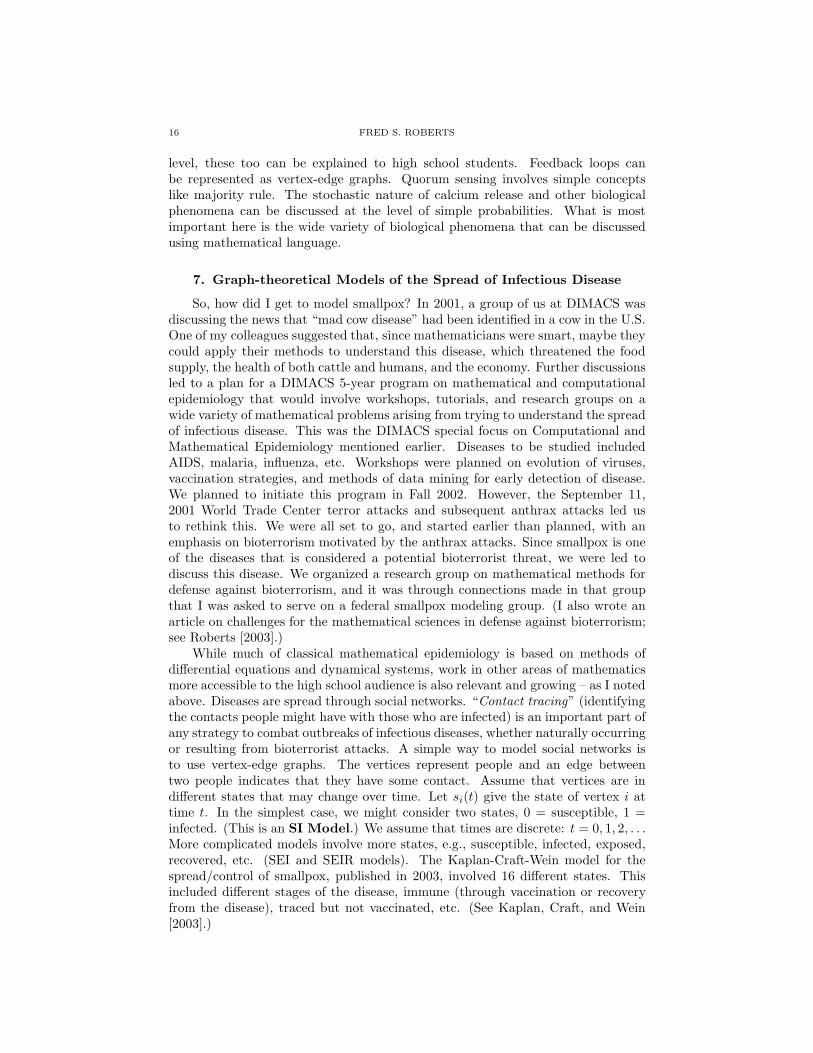
7. Graph-theoretical Models of the Spread of Infectious Disease
So, how did I get to model smallpox? In 2001, a group of us at DIMACS wasdiscussing the news that “mad cow disease” had been identified in a cow in the U.S.One of my colleagues suggested that, since mathematicians were smart, maybe theycould apply their methods to understand this disease, which threatened the foodsupply, the health of both cattle and humans, and the economy. Further discussionsled to a plan for a DIMACS 5-year program on mathematical and computationalepidemiology that would involve workshops, tutorials, and research groups on awide variety of mathematical problems arising from trying to understand the spreadof infectious disease. This was the DIMACS special focus on Computational andMathematical Epidemiology mentioned earlier. Diseases to be studied includedAIDS, malaria, influenza, etc. Workshops were planned on evolution of viruses,vaccination strategies, and methods of data mining for early detection of disease.We planned to initiate this program in Fall 2002. However, the September 11,2001 World Trade Center terror attacks and subsequent anthrax attacks led usto rethink this. We were all set to go, and started earlier than planned, with anemphasis on bioterrorism motivated by the anthrax attacks. Since smallpox is oneof the diseases that is considered a potential bioterrorist threat, we were led todiscuss this disease. We organized a research group on mathematical methods fordefense against bioterrorism, and it was through connections made in that groupthat I was asked to serve on a federal smallpox modeling group. (I also wrote anarticle on challenges for the mathematical sciences in defense against bioterrorism;see Roberts [2003].)
While much of classical mathematical epidemiology is based on methods ofdifferential equations and dynamical systems, work in other areas of mathematicsmore accessible to the high school audience is also relevant and growing – as I notedabove. Diseases are spread through social networks. “Contact tracing” (identifyingthe contacts people might have with those who are infected) is an important part ofany strategy to combat outbreaks of infectious diseases, whether naturally occurringor resulting from bioterrorist attacks. A simple way to model social networks isto use vertex-edge graphs. The vertices represent people and an edge betweentwo people indicates that they have some contact. Assume that vertices are indifferent states that may change over time. Let si(t) give the state of vertex i attime t. In the simplest case, we might consider two states, 0 = susceptible, 1 =infected. (This is an SI Model.) We assume that times are discrete: t = 0, 1, 2, . . .More complicated models involve more states, e.g., susceptible, infected, exposed,recovered, etc. (SEI and SEIR models). The Kaplan-Craft-Wein model for thespread/control of smallpox, published in 2003, involved 16 different states. Thisincluded different stages of the disease, immune (through vaccination or recoveryfrom the disease), traced but not vaccinated, etc. (See Kaplan, Craft, and Wein[2003].)

WHY BIOMATH? WHY NOW? 17
In such graph-theoretical models of the spread of disease, a vertex moves fromstate to state every discrete time. But what kinds of movements are allowed? Onceyou are infected, can you be cured? If you are cured, do you become immune orcan you re-enter the infected state?
In a simple model with only two states 0 and 1, we set a “threshold” k andassume that a person in state 0 at time t moves to state 1 if at least k of theirneighbors in the graph are in state 1: You become infected if sufficiently many ofyour neighbors are infected. It is assumed that once you are in state 1, you nevergo back to state 0. We call this process an irreversible k-threshold process.It is illustrated in Figure 8, where we take k = 2 and show the progression overtime of the state of infection of vertices in a graph. Here, we represent the infectedvertices (state 1 vertices) with solid circles like c and d, and the uninfected vertices(state 0 vertices) with hollow circles like a and b. Notice that at time 1, vertices aand b change from state 0 to state 1 since they each have two neighbors in state 1.Also, by time t = 2, the situation is fixed and never changes again.
Figure 8. An irreversible k-threshold process with k = 2. Solidvertices are infected (state 1), hollow ones uninfected (state 0).
There are various complications we could add to this model, and I like to let mystudents suggest them. For instance, we could take k = 1, but only allow a vertexto get infected with a certain probability if it has an infected neighbor. We couldadd the condition that you are automatically cured after you are in the infectedstate for d time periods. We could give a public health authority the ability to“vaccinate” a certain number of vertices, making them immune from infection.
Mathematical models are very helpful in comparing alternative vaccinationstrategies. The problem is especially interesting if we think of protecting againstdeliberate infection by a bioterrorist. If you didn’t know whom a bioterrorist mightinfect, what people would you vaccinate to be sure that a disease doesn’t spreadvery much? In terms of the graph, we will think of vaccinated vertices as stayingat state 0 regardless of the state of their neighbors. The question of whom tovaccinate makes a good exercise for students. Consider the graph of Figure 9, a “5-cycle.” One strategy is “mass vaccination”: Make everyone 0 and immune in theinitial state. In the 5-cycle, mass vaccination means vaccinate all 5 vertices. Thisobviously works to protect the population in the sense that no one can be infected.However, in practice, vaccination is only effective with a certain probability, soresults could be different. Also, vaccines have side effects, so some people could getsick or even die if we vaccinate. If vaccine has no cost and is unlimited and has noside effects, of course we use mass vaccination.

18 FRED S. ROBERTS
Figure 9. A 5-cycle.
What if vaccine is in limited supply? Suppose we only have enough vaccine tovaccinate 2 vertices. Suppose we can only vaccinate at time 0 and no new vaccinewill become available after that time. Suppose an adversary has two doses of a“pathogen” that can be used to infect two vertices at time 0. Consider an irre-versible 2-threshold process. There are, up to symmetry, two different vaccinationstrategies: Vaccinate two neighboring vertices and vaccinate two non-neighboringvertices. These are shown in Figures 10 and 11, with a V indicating vaccinatedvertices. If you assume your adversary does not try to infect vaccinated vertices,the adversary has in each case, up to symmetry, two responses: infect neighbor-ing vertices or non-neighboring vertices. The “alternation” between your choice ofa defensive strategy and your adversary’s choice of an offensive strategy suggestswe consider the problem from the point of view of game theory. The Food andDrug Administration is studying the use of game-theoretic models in the defenseagainst bioterrorism. In the graph of Figure 10, in an irreversible 2-threshold pro-cess, if the adversary infects two neighboring non-vaccinated vertices, no one elsegets infected. However, if the adversary infects two non-neighboring non-vaccinatedvertices, three vertices end up being infected. In the graph of Figure 11, in an irre-versible 2-threshold process, no matter what the adversary does by way of infectingtwo non-vaccinated vertices at time 0, no one else gets infected. Thus, the vaccina-tion strategy represented by Figure 11 is better in the sense that in the worst casefewer people end up getting infected. Your students could “play” with this typeof problem for larger graphs, make assumptions that allow one to vaccinate moreoften or the adversary to infect people more often, etc.
Figure 10. First vaccination strategy. V indicates vaccinated vertices.

WHY BIOMATH? WHY NOW? 19
Figure 11. Second vaccination strategy. V indicates vaccinated vertices.
Suppose an adversary is out to infect as many people as possible. Given agraph, what subsets S of the vertices should he or she plant a disease with sothat ultimately the maximum number of people will get it? This problem has aneconomic interpretation: What set of people do we place a new product with toguarantee “saturation” of the product in the population? As a defender againstbioterrorism, your job can be defined as follows: Given a graph, what subsets Sof the vertices should we vaccinate to guarantee that as few people as possible willbe infected? A more extreme version of the attacker’s problem is: Can we find aset of vertices to infect that will guarantee that ultimately everyone is infected?Mathematically, we speak of an irreversible k-conversion set: A subset S of thevertices that can force an irreversible k-threshold process to the situation where ev-ery state si(t) = 1. Note that if we can change back from 1 to 0 at least after awhile,we can also consider the Defender’s Problem: Can we guarantee that ultimately noone is infected, i.e., all si(t) = 0? A variant of the Defender’s Problem asks us todesign a graph (with a given number of vertices and/or edges) that minimizes thenumber of vertices an opponent can ultimately force into the state 0.
To illustrate these ideas, consider the graph of Figure 12. It is easy to see thatan irreversible 2-conversion set consists of the vertices x1 and x3. For if we infectthem at time 0, then at time 1, x2 gets infected, then at time 2, x4 and x5 getinfected, and at time 3, x6 gets infected.
Figure 12. The set {x1, x3} is an irreversible 2-conversion set.
One can prove a variety of theorems about irreversible k-conversion sets. SeeDreyer and Roberts [2009] for details. Here, we simply note some simple examplesthat students might be challenged to investigate. The size of the smallest irre-versible 2- conversion set in a cycle with n vertices is ceiling[n/2], i.e., the least

20 FRED S. ROBERTS
integer greater than or equal to n/2. This is easy to verify, starting with examples.Finding irreversible k-conversion sets in trees and in grids also makes for interest-ing exercises illustrative of the concepts. Remarkably, even for grids in the plane,we don’t know the size of the smallest irreversible k-conversion sets even for smallvalues of k.
A variant on the vaccination problems we have discussed allows a defender tovaccinate v people per time period, while an attacker can only infect people at thebeginning. What vaccination strategy minimizes the number of people infected? Inthe literature, this is sometimes called the firefighter problem and we think of aforest with trees, with a blaze spreading from trees to neighbor trees unless there isa firefighter placed at those trees. Consider an irreversible k-threshold process withk = 1, so a tree catches fire if any of its neighboring trees are on fire and it does nothave a firefighter protecting it. This is a place to observe an important property ofmathematical models: Once we translate a problem into mathematical language,the analysis can apply under multiple interpretations, whether it is firefighting orinfection control. A variation on this problem in the infection context has thevaccinator and infector alternate turns, having v vaccinations per period and pdoses of pathogen per period. What is a good strategy for the vaccinator?
To illustrate the process with v = 3 and i = 0 on a grid, consider the 8 × 12rectangular grid, where point (i, j) means the point in row i and column j. Supposethe process starts with vertex (4, 7) infected. One possible defensive strategy then isfor the vaccinator to put firefighters at (“vaccinate”) vertices (3, 6), (3, 8), and (5, 7).If this is done, then the fire spreads to vertices (3, 7), (4, 6), and (4, 8), the three“unprotected” neighbors of (4, 7). Suppose the vaccinator then puts firefightersat (2, 7), (4, 5), and (5, 6). In turn, the fire spreads to (4, 9) and (5, 8). Supposenow the vaccinator puts firefighters at (3, 9), (4, 10), and (5, 9). Now the fire canonly spread to (6, 8). In the final step, it is completely surrounded by puttingfirefighters at (6, 7), (6, 9), and (7, 8). There are many issues to be studied in thefirefighter/disease spread problem. In the language of firefighting, we might ask:Can the fire be contained? How many time steps are required before the fire iscontained? How many firefighters per time step are necessary? What fraction ofall vertices will be saved (burnt)? Does where the fire breaks out matter? Whatabout a fire starting at more than one vertex? For some references on the firefighterproblem, see Dreyer and Roberts [2009] and, for example, Hartnell and Li [2000],MacGillivray andWang [2003], andWang and Moeller [2002]. In the above example,12 firefighters (doses of vaccine) are required to contain the fire (epidemic) and inthe end, out of 96 vertices, seven are burnt and the rest are saved. Your studentsmight want to see if they can do better than this either in terms of number offirefighters needed or in terms of more vertices saved.
One example of a problem that should be readily accessible to high schoolstudents involves fighting diseases (firefighting) on graphs that are given as treesthat are rooted and that we can navigate from top to bottom. For each vertexu, define the weight(u) = 1 + number descendants of u, where a descendant is avertex reachable from u by a path heading downwards in the tree. Assume thatthe number of doses of vaccine (number of firefighters) per time period is given byv = 1 and the attacker infects the root and then cannot infect anyone after that.One algorithm for distributing doses of vaccine is the greedy algorithm: At eachtime step, place a firefighter (vaccinate) a vertex u that has not been saved such

WHY BIOMATH? WHY NOW? 21
that weight(u) is maximized. Consider the tree of Figure 13. A disease starts atthe root. In the following process, the vertices that end up being infected are shownin the figure as black, while those that end up being noninfected are white. Thevertices one level below the root are called level 1 vertices, and similarly for level2, level 3, etc. The leftmost vertex at level 1 has weight 12 and that is highest, soit is vaccinated. At time t = 1, all other vertices at level 1 are infected but verticesdescended from the vaccinated vertex can never get infected. Next, we considervertices at level 2 that are not descendants of a vaccinated vertex. Two of themhave the maximum weight 6. We choose at random in case of ties, say choosing theweight 6 vertex to the right to vaccinate, thus also saving all its descendants. Theremaining level 2 vertices now get infected at time t = 2. At t = 3 we vaccinateone of the vertices at level 3 that is not a descendant of a vaccinated vertex andthat has weight 3 and at time t = 4, we vaccinate one of the vertices at level 4 thatis not a descendant of a vaccinated vertex. In the end, if this greedy procedure isused, 26 vertices are infected and 22 are not.
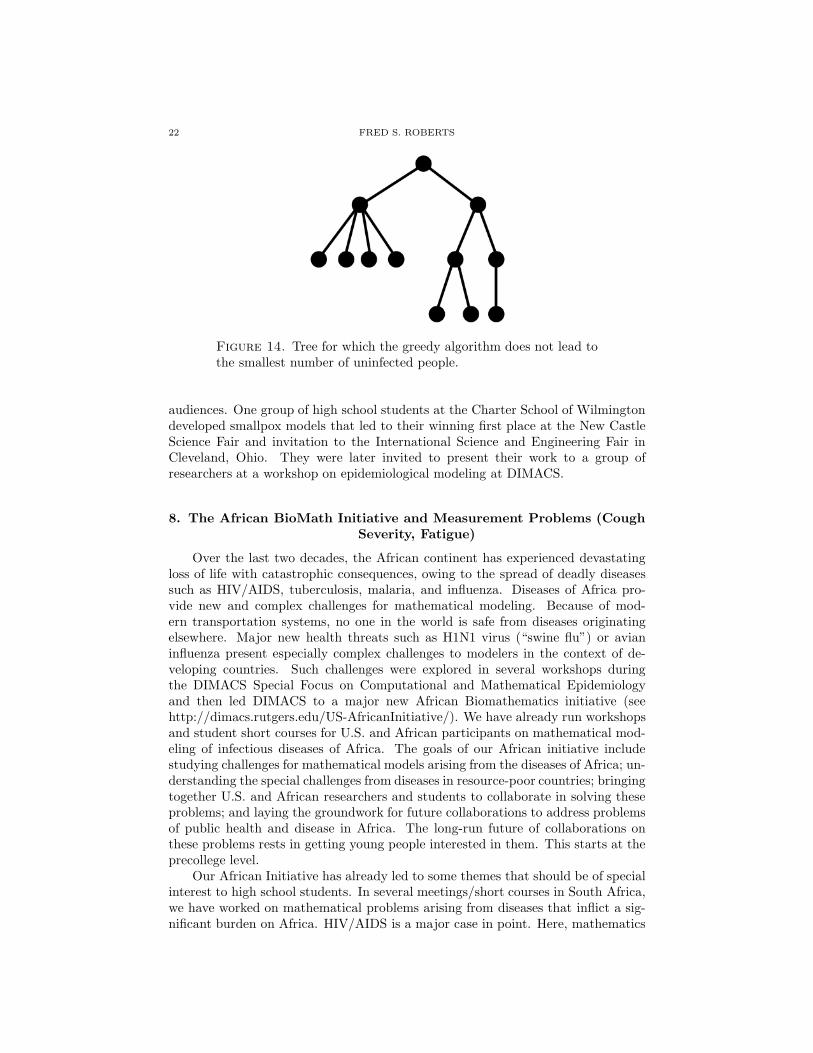
The greedy algorithm does not always lead to the result with the largest num-ber of uninfected people. For example, consider the tree of Figure 14. If we use thegreedy algorithm, we vaccinate the right-hand vertex at level 1 and end up with 7uninfected people. However, if we vaccinate the left-hand vertex at level 1, we canend up with 9 uninfected people. Hartnell and Li [2000] showed that for any treewith one infection starting at the root and one dose of vaccine to be deployed pertime step, the greedy algorithm always saves more than half of the vertices thatany algorithm saves. Is this an acceptable solution? If we have a rapidly escalatingepidemic, finding a speedy solution that is pretty good through an efficient algo-rithm might be preferable to finding an optimal solution if it takes so long to findthe latter that it cannot be implemented in time.
Figure 13. Tree for which the greedy algorithm leads to 26 in-fected and 22 uninfected vertices. The infected vertices are black,the uninfected ones white.
These graph-theoretical models of spread of disease have engaged me and mygraduate students. At the same time, I have talked about them to high school
22 FRED S. ROBERTS
Figure 14. Tree for which the greedy algorithm does not lead tothe smallest number of uninfected people.
audiences. One group of high school students at the Charter School of Wilmingtondeveloped smallpox models that led to their winning first place at the New CastleScience Fair and invitation to the International Science and Engineering Fair inCleveland, Ohio. They were later invited to present their work to a group ofresearchers at a workshop on epidemiological modeling at DIMACS.
8. The African BioMath Initiative and Measurement Problems (CoughSeverity, Fatigue)
Over the last two decades, the African continent has experienced devastatingloss of life with catastrophic consequences, owing to the spread of deadly diseasessuch as HIV/AIDS, tuberculosis, malaria, and influenza. Diseases of Africa pro-vide new and complex challenges for mathematical modeling. Because of mod-ern transportation systems, no one in the world is safe from diseases originatingelsewhere. Major new health threats such as H1N1 virus (“swine flu”) or avianinfluenza present especially complex challenges to modelers in the context of de-veloping countries. Such challenges were explored in several workshops duringthe DIMACS Special Focus on Computational and Mathematical Epidemiologyand then led DIMACS to a major new African Biomathematics initiative (seehttp://dimacs.rutgers.edu/US-AfricanInitiative/). We have already run workshopsand student short courses for U.S. and African participants on mathematical mod-eling of infectious diseases of Africa. The goals of our African initiative includestudying challenges for mathematical models arising from the diseases of Africa; un-derstanding the special challenges from diseases in resource-poor countries; bringingtogether U.S. and African researchers and students to collaborate in solving theseproblems; and laying the groundwork for future collaborations to address problemsof public health and disease in Africa. The long-run future of collaborations onthese problems rests in getting young people interested in them. This starts at theprecollege level.
Our African Initiative has already led to some themes that should be of specialinterest to high school students. In several meetings/short courses in South Africa,we have worked on mathematical problems arising from diseases that inflict a sig-nificant burden on Africa. HIV/AIDS is a major case in point. Here, mathematics

WHY BIOMATH? WHY NOW? 23
has been important in evaluation of alternative preventive and therapeutic strate-gies; allocation of anti-retroviral drugs; evolution and transmission of drug-resistantstrains of antibiotics; and the interaction of HIV/AIDS with other infections suchas TB and malaria. (Such “coinfection” is a major theme in modern mathematicalepidemiology.) Malaria is another interesting case in point. For malaria, mathe-matics has helped develop new methods of control (e.g., insecticide-treated cattle).It has also been used to study the effect of global warming on mosquito populations– a topic of central importance in a new DIMACS initiative on climate and disease.Children are often exposed to news about climate change and other similar prob-lems of society. Many of these problems are fundamentally interdisciplinary and itis important for them to understand as early as possible how different disciplinesinterface.
Diseases of animals are of special significance in the developing world. In Africa,some key examples of such diseases are bovine tuberculosis (in domestic and wildpopulations), avian influenza, and trypanosomiasis. Since children are especiallyinterested in animals, discussion of animal diseases has the strong potential ofengaging them. Our workshops and short courses in Africa have included math-ematical models of animal diseases. The U.S. Department of Homeland Securityhas established a university “center of excellence” FAZD (the National Center forForeign Animal and Zoonotic Disease Defense), based at Texas A&M University,to study the spread of disease among animals. FAZD (see http://fazd.tamu.edu/)has an extensive educational program, emphasizing the importance of educatingthe next generation of homeland security workers in the area of disease.
While we hear about human diseases a great deal, and from time to time areexposed to diseases of animals, few of our young people understand that plants arealso subject to disease. Diseases of plants are a major threat to the food supplynot only in Africa but everywhere in the world. The Department of HomelandSecurity has also established a university center of excellence NCFPD (NationalCenter for Food Protection and Defense), based at the University of Minnesota,that deals with protection of the food supply. A number of mathematical questionsamenable to presentation at the high school level include the dose-response modelsneeded to understand the impact on human health of certain concentrations ofagents in food, and NCFPD, like FAZD, has an extensive educational program.(See http://www.ncfpd.umn.edu/ for more about NCFPD.)
DIMACS is running some new programs in its African Initiative. Each presentspossible problems of interest at the high school level. A DIMACS workshop andshortcourse on conservation biology was held in South Africa in 2010. They dealtwith the mathematics of ecological reserves. A key idea here that could lead tointeresting discussion at the high school level is to define a notion of biologicaldiversity that applies to a reserve with a variety of species and that provides areasonable metric for the health of the reserve. Is biodiversity the inclusion of a lotof species? A reasonable distribution of individuals in each species? A distributionof individuals of varying ages? (See for example Sarkar [2002].) Another DIMACSworkshop, to be held in Madagascar, will deal with genetics and disease control. Interms of food supply, this will deal with the safety of genetically altered crops. Interms of diseases, it will consider for example control of malaria by genetically mod-ifying mosquitoes. One idea here is to sterilize male mosquitoes. What percentageof males do you need to sterilize to cut mosquito population significantly? What
24 FRED S. ROBERTS
if sterilized males are more attractive to females for mating – say 25% more? Orwhat if they are less attractive? How would this change the conclusions? (For moreon this topic, see for example Adam [2005].) Still a third workshop and shortcoursewas held in Uganda in 2009. It explored the relationship between economics andepidemiology. If people won’t comply with a quarantine order, how much shouldwe pay them to do so? What incentives will encourage more people to get testedfor HIV? (For more on economic epidemiology, see e.g., Klein, et al. [2007]). Wehave followed up this workshop with an emphasis on “behavioral epidemiology”in the DIMACS Special Focus on Computational and Mathematical Biology, ex-ploring ways to bring into epidemiological models the difference between individualresponses to disease events, caused by their own personal economic considerationsor their own priorities, concerns, and attitudes toward risk. These issues of eco-nomic epidemiology, genetics and disease control, and conservation biology can allbe formulated in relatively simply mathematical models that should be of interestboth in Biology and Mathematics classes at the high school level.
One of the major complications of HIV is the susceptibility of patients to otherdiseases, in particular tuberculosis. One activity that can be of interest even at veryelementary precollege levels is to discuss how to measure the severity of the coughassociated with TB. Another is to measure the fatigue associated with any diseasesuch as HIV. Typically, we measure severity of a patient’s cough on a 5-point scale:5 = extremely severe, 4 = very severe, 3 = severe, 2 = slightly severe, 1 = no cough.To test a particular cough-suppressant, we might ask if the average cough severityin a group of patients treated with the suppressant is lower than the average in a“control” group. To make this precise, we let a1, a2, . . . , an be the patients in thefirst group and b1, b2, . . . , bm be the patients in the second group. Let f(x) be theseverity of patient x’s cough. Then we would like to see if
(1)1
n
n∑
i=1
f(ai) <1
m
m∑
i=1
f(bi).
We are comparing arithmetic means. Note that there can be a differentnumber of patients in each group, which is why we use n for one and m for theother. For instance, if there are three patients in the test group and five in thecontrol group, those in the test group have cough severities 4, 3, and 1 while thosein the control group have cough severities 5, 5, 2, 1, and 1, then the average coughseverity in the test group is 2.67 while that in the control group is 2.8 and weconclude that, indeed, the average cough severity is less in the first group. On theother hand, if we were comparing the median cough severity, then the test group hasmedian 3 and the control group median 2, and the conclusion about average coughseverity is no longer true. We have to decide which of these two ways of averagingscores is the more appropriate one, which may depend on the application. (Thereare more complications. In the theory of measurement (Roberts [1979, 1994]), onedistinguishes the types of scales used. In this case, it is possible to argue that the5-point scale is “ordinal”. In the case of ordinal scales, there are arguments thatcomparison of medians is “meaningful” in a precise sense whereas comparisons ofarithmetic means is not.)
Judgments of cough severity are subjective. Suppose we ask a number of healthcare professionals to make a judgment of the severity of patients’ coughs. We wantto compare the average cough rating of patient a to the average cough rating of

WHY BIOMATH? WHY NOW? 25
patient b. Let fi(x) be the cough severity rating of patient x by health care workeri. Now, instead of Equation (1), we have
(2)1
n
n∑
i=1
fi(a) <1
n
n∑
i=1
fi(b).
Note the subtle differences between Equations (1) and (2). In (2), we have the samen on both sides since there are the same number of raters in each case. Also, thesubscript has moved to the f. We can make the same kind of analysis as before.Here, the exercise is to ask the students to produce the equation and to explain thedifferences.
If instead of cough severity, we talk about weight loss, then we could measurethe weight in kilograms or in pounds. If we do that, then it is a good exerciseto have the students show that if (1) is true in kilograms, it must also be truein pounds, and vice versa. It is also true that if (2) is true with all raters usingkilograms, then it is also true if all raters use pounds, and vice versa. However, itis also an interesting exercise to ask students to give a numerical example to showthat if raters can choose their scales, then (2) can be true with some raters usingpounds and some using kilograms but false with some other combinations of whouses pounds and who uses kilograms. For example, you could ask the students toshow via numerical example that if n = 2 and rater 1 uses pounds while rater 2uses kilograms, then statement (2) could be true, whereas if rater 1 switches tokilograms and rater 2 switches to pounds, then (2) could fail. Surprisingly, thelatter is not the case for geometric means and it is a good exercise to prove this.Here, we are talking about the statement
(3) n
√
√
√
√
n∏
i=1
fi(a) <n
√
√
√
√
n∏
i=1
fi(b)
Similar examples can be given using the scale measuring fatigue. In seriousdiseases, one widely used scale is the Piper scale of fatigue. It asks questions like:
• On a scale of 1 to 10, to what degree is the fatigue you are feeling nowinterfering with your ability to complete your work or school activities?(1 = none, 10 = a great deal)
• On a scale of 1 to 10, how would you describe the degree of intensity orseverity of the fatigue which you are experiencing now? (1 = mild, 10 =severe)
For more on averaging judgments of cough severity and of fatigue, see Roberts[2010].
9. Biosurveillance
As diseases spread rapidly from country to country or within a large country,and, for example, travelers from Africa can bring highly infectious diseases suchas Ebola across the miles to the U.S. in a matter of hours, it becomes incumbentupon us to develop new ways of identifying the outbreak of diseases. Early on inmy exposure to epidemiology, I learned about the importance of “biosurveillance.”Biosurveillance is aimed at giving us early warning of the outbreak of a disease– whether naturally occurring or caused by a bioterrorist. This involves modern
26 FRED S. ROBERTS
data-gathering methods, which bring with them new challenges for mathematicians.There are some obvious types of data to gather in biosurveillance, including reportson number of people diagnosed with a given disease. However, before diagnosis,we would like to get early warning that something is happening. For this purpose,we want to look at a variety of data and see if, using various pieces of data, wecan see patterns that suggest that there is a “disease event” taking place. Someof the unusual sources of data being considered today are: managed care patientencounter data; pre-diagnostic/chief complaint (emergency department data); over-the-counter sales transactions at drug stores or grocery stores; 911-emergency calls;ambulance dispatch data; absenteeism data; emergency department discharge sum-maries; prescription/pharmaceuticals; “hits” on certain medical information web-sites; and “adverse event reports” about responses to diseases and vaccines. Forexample, the New York City Department of Health (see e.g., Mostashari [2002])looks for absenteeism among subway workers, who presumably would be exposedto a new disease in the city through subway riders. But it might combine this withother data. For instance, suppose there is an unusual amount of subway workerabsenteeism in workers whose trains pass through a part of the borough of Brook-lyn and there is also an increase in sales of Tylenol in the same neighborhood andan increase in “hits” on websites that deal with “achy legs.” This “syndrome” ofdata might give warning that a certain event is taking place. Today, we some-times talk about the special type of biosurveillance called “syndromic surveillance”(see http://www.cdc.gov/ncphi/disss/nndss/syndromic.htm) that includes combi-nations of symptoms and other observed phenomena. New methods of syndromicsurveillance are being developed. They include spatial-temporal “scan statistics;”statistical process control (SPC); Bayesian applications; “market-basket” associa-tion analysis; text mining; rule-based surveillance; and change-point techniques.It should be easy to devise exciting classroom activities that include syndromicsurveillance where we give each student some symptoms and do some “monitoring”to discover syndromes.
At DIMACS, our work on syndromic surveillance was carried out in a “workinggroup” on disease detection, which led to collaboration with the CDC (U.S. Centersfor Disease Control and Prevention). CDC has recently launched a new programon mathematical modeling of disease.
There are many sources of data that students can access and examine in class-room activities involving syndromic surveillance. Some examples are the following6:
• Morbidity and Mortality Weekly Report: http://www.cdc.gov/mmwr/• SEER Cancer Registry: http://seer.cancer.gov/• US Vital Statistics: http://wonder.cdc.gov/welcome.html
10. Bioterrorism Sensor Location
Early warning is critical in public health and that is a major reason for ouremphasis on new tools for biosurveillance. Biosurveillance is important for all kindsof diseases, both naturally-occurring ones, ones that come around periodically likeinfluenza, and those that are deliberately introduced by “bioterrorists.” Smallpox isone of the diseases that the government fears could be reintroduced by bioterrorists.I say “reintroduced” because we believe that smallpox has been eradicated in the
6Thanks to Dona Schneider for suggesting these.

WHY BIOMATH? WHY NOW? 27
world. The only known stores of smallpox virus are kept in two locations in theworld, one in the U.S. and one in Russia. However, there is concern that terroristscould get hold of some of the virus or genetically engineer a copycat virus, and thusintroduce a smallpox epidemic. One of the ways that the government seeks to getearly warning about potential bioterrorist attacks with diseases like smallpox is toplace networks of sensors/detectors to warn of such attacks. A key challenge is todetermine where to best locate these sensors.
There are many issues surrounding the location of bioterrorism sensors thatcould make for good student activities. In 2006, DIMACS’ work on epidemiologyand bioterrorism, among other things, led to the center being named a “center ofexcellence” by the U.S. Department of Homeland Security (DHS). Through Dy-DAn, the DHS Center of Excellence for Dynamic Data Analysis that is based atDIMACS, I have already presented some potential activities to high school teach-ers that involve sensor location problems. (DyDAn is being supplanted by the newDHS Center of Excellence, the Command, Control, and Interoperability Center forDynamic Data Analysis, CCICADA, also based at DIMACS.)
I first got involved with the bioterrorism sensor location initiative when theU.S. Defense Threat Reduction Agency asked me to think about the mathematicalproblem of locating sensors/detectors in an efficient way. I ended up learning alot about the problem from the Institute for Defense Analyses and from the NewYork City Department of Health. Sensors are finding many uses in homeland se-curity. We place sensors in buildings, on bridges, at border crossings, and evenon uniforms of police. These sensors sense radiation, dangerous chemicals, biolog-ical agents, etc. Similar issues arise in placing sensors to protect against or giveearly warning about attacks with chemical or nuclear weapons or attacks on ournetworks: communication, financial, power, etc.
Bioterrorism sensor location problems are probably best explored in parallelbetween Biology and Mathematics classes. For example, Biology students couldlearn about how such sensors work. Typically, the sensors collect samples in theair over a period of time, like a day, and then those samples are brought to alaboratory for analysis. Students could study how the analysis is made and howlong it takes, and think about how to speed up the process. Mathematics studentscould study more about the mathematics of efficient location patterns, which Idescribe below. In turn, Biology students could study the properties of the differenttypes of “pathogens” of concern in bioterrorism and connect those properties up tothe location problem.
Sensors are expensive. How do we select them and where do we place themto maximize “coverage,” expedite an alarm, and keep the cost down? Approachesthat improve upon existing, ad hoc location methods could save countless lives inthe case of an attack and also money in capital and operational costs.
We can define two fundamental problems. The Sensor Location Problem(SLP) is to choose an appropriate mix of kinds of sensors and decide where tolocate them for best protection and early warning. The Pattern InterpretationProblem (PIP) involves what to do when sensors set off an alarm. How canwe help public health decision makers decide: Has an attack taken place? Whatadditional monitoring is needed? What was the attack’s extent and location? Whatis an appropriate response?

28 FRED S. ROBERTS
The first step in addressing the SLP is to formulate models for making it preciseand measures of success of a sensor distribution plan. There are many possibleformulations of the SLP and these present good explorations for your students inMath classes. What, indeed, is a measure of success? Is it to identify and amelioratefalse alarms? To defend against a “worst case” attack or an “average case” attack?To minimize time to first alarm? (Worst case? Average case?) To maximize“coverage” of the area? To minimize geographical area not covered? To minimizesize of population not covered? To minimize probability of missing an attack? Yourstudents can be asked to come up with such criteria (and others). Other criteriainvolve cost. For example, given a mix of available sensors and a fixed budget,what mix will best accomplish our other goals? It is hard to separate the goals.Even a small number of sensors might detect an attack if there is no constraint ontime to alarm. Without budgetary restrictions, a lot more can be accomplished.Of special interest are the biological characteristics of the different viruses thatmight be used in a bioterrorist attack. Among those of interest besides smallpoxare plague and tularemia. They differ in size, weight, concentration needed tobe dangerous, etc. In turn, these characteristics of viruses affect where to locatesensors that try to capture them. If viruses are disbursed through the air, lighterviruses might be higher up, for example, than lower ones. I can imagine some veryinteresting investigations for Biology students in connection with the location ofsensors to capture viruses with particular characteristics.
One approach to the SLP is to develop new algorithmic methods. Developingnew algorithms involves fundamental mathematical analysis. Analyzing how effi-cient algorithms are involves fundamental mathematical methods. Implementingthe algorithms on a computer is often a separate problem – which needs to go handin hand with the basic mathematics of algorithm development. All of these aretopics appropriate for a Math class. For example, one can investigate “greedy al-gorithms.” In such algorithms, we first find the “most important” location to placea sensor and locate a sensor there. (What things could “most important” mean?)Then we find the second-most important location. And so on. This approachhas been explored by researchers at the Institute for Defense Analyses. It uses a“steepest ascent method” that doesn’t guarantee an “optimal” or best solution butin practice gets close to optimal. Students could try this out by overlaying a mapof New York City or Washington, DC with bioterrorism sensors, each of which hasa circle around it representing area in which it can detect pathogens. One can seehow few sensors can cover the region “almost” completely.
Problems of locating facilities (fire houses, garbage dumps, etc.) are classicalproblems in the field of the mathematical sciences known as operations research.Often, these problems are defined on networks with vertices and edges and withdiffering distances along edges. Users u1, u2, . . . , un are located at vertices. Oneapproach is to locate the facility at vertex x chosen so that sum of distances tousers is minimized. Thus, we want to minimize
∑
i d(x, ui), where d(x, ui) is thedistance between x and ui. Consider for example the network of Figure 14, wherethe vertices are places for users or facilities and every edge has the same distance,1, as indicated. If d(x, y) = length of shortest route from x to y, then, for example,d(a, c) = 2. Given users at f = u1, b = u2, and c = u3, where do we placea facility to minimize the sum of distances to the users? A simple calculationshows that if x = a, then
∑
i d(x, ui) = 1 + 1 + 2 = 4, while if x = b, then
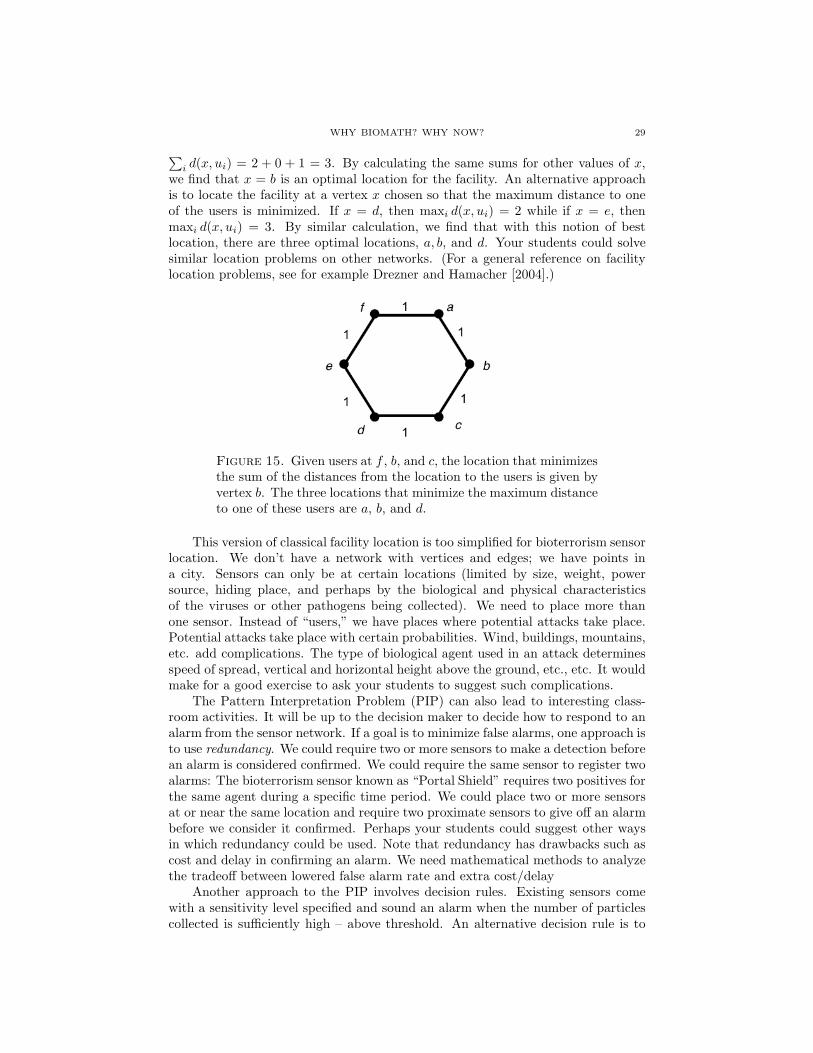
WHY BIOMATH? WHY NOW? 29
∑
i d(x, ui) = 2 + 0 + 1 = 3. By calculating the same sums for other values of x,we find that x = b is an optimal location for the facility. An alternative approachis to locate the facility at a vertex x chosen so that the maximum distance to oneof the users is minimized. If x = d, then maxi d(x, ui) = 2 while if x = e, thenmaxi d(x, ui) = 3. By similar calculation, we find that with this notion of bestlocation, there are three optimal locations, a, b, and d. Your students could solvesimilar location problems on other networks. (For a general reference on facilitylocation problems, see for example Drezner and Hamacher [2004].)
Figure 15. Given users at f , b, and c, the location that minimizesthe sum of the distances from the location to the users is given byvertex b. The three locations that minimize the maximum distanceto one of these users are a, b, and d.
This version of classical facility location is too simplified for bioterrorism sensorlocation. We don’t have a network with vertices and edges; we have points ina city. Sensors can only be at certain locations (limited by size, weight, powersource, hiding place, and perhaps by the biological and physical characteristicsof the viruses or other pathogens being collected). We need to place more thanone sensor. Instead of “users,” we have places where potential attacks take place.Potential attacks take place with certain probabilities. Wind, buildings, mountains,etc. add complications. The type of biological agent used in an attack determinesspeed of spread, vertical and horizontal height above the ground, etc., etc. It wouldmake for a good exercise to ask your students to suggest such complications.
The Pattern Interpretation Problem (PIP) can also lead to interesting class-room activities. It will be up to the decision maker to decide how to respond to analarm from the sensor network. If a goal is to minimize false alarms, one approach isto use redundancy. We could require two or more sensors to make a detection beforean alarm is considered confirmed. We could require the same sensor to register twoalarms: The bioterrorism sensor known as “Portal Shield” requires two positives forthe same agent during a specific time period. We could place two or more sensorsat or near the same location and require two proximate sensors to give off an alarmbefore we consider it confirmed. Perhaps your students could suggest other waysin which redundancy could be used. Note that redundancy has drawbacks such ascost and delay in confirming an alarm. We need mathematical methods to analyzethe tradeoff between lowered false alarm rate and extra cost/delay
Another approach to the PIP involves decision rules. Existing sensors comewith a sensitivity level specified and sound an alarm when the number of particlescollected is sufficiently high – above threshold. An alternative decision rule is to

30 FRED S. ROBERTS
sound an alarm if two sensors reach 90% of threshold, three reach 75% of threshold,etc. These rules could be formulated precisely in the language of mathematics andsome examples illustrating such decision rules could make for interesting exercises.Biology students could collaborate with Mathematics students in designing theserules. For instance, could 75% of threshold have no biological significance while 90%does? Most likely, the answers to these questions are: We don’t know or we thinkthat 75% is dangerous with probability p while 90% is dangerous with probabilityp′ > p. This will then lead to questions of the meaning of probability estimates andto risk assessment. Ah, but I could go on and on.
11. Closing Comments
Smallpox has taken me far afield. While my interest in and excitement aboutecological models and DNA-RNA has continued, indeed grown, smallpox has gottenme into activities I never would have dreamed of less than a decade ago – using mybackground and skills to address problems of public health, the spread of disease,protection against bioterrorist attacks, climate change, and the cost of health care.There is a wide variety of topics that arise from the interconnections between thebiological and mathematical sciences. So many of these are appropriate for highschool students in both Biology and Mathematics classes. Introducing studentsto such topics should prepare them for a new world in which the traditional linesbetween disciplines are increasingly fuzzy, in which new careers are developingand new educational opportunities are opening up, in which it is incumbent uponus to understand Mathematics so as to understand Biology, and in which it isincumbent upon us to teach our students the value of Mathematics for so manyapplied problems that affect our world and their lives. Bringing the bio-mathinterface into the high schools is not going to be easy, but the rewards for doing sowill be great.
References
[1] Adam, D., “Scientists create GM mosquitoes to fight malaria and save thousands of lives,”The Guardian,http://www.guardian.co.uk/science/2005/oct/10/infectiousdiseases.medicineandhealth, Oct.10, 2005.
[2] Anderson, R. M., and May, R. M., Infectious Diseases of Humans, Oxford University Press,UK, 1991.
[3] Benzer, S. “On the topology of the genetic fine structure,” Proc. Nat. Acad. Sci. USA, 45(1959), 1607-1620.
[4] Benzer, S., “The fine structure of the gene,” Sci. Amer., 206 (1962), 70-84.[5] Bernoulli, D., “De la mortalite causee par la petite verole, et des avantages de l’inoculation
pour la prevenir,” Mem. Math. Phys. Acad. R. Sci. Paris (1760), 1– 45 (Imprimerie Royale;1766); English translation: by L. Bradley, “An attempt at a new analysis of the mortalitycaused by smallpox and of the advantages of inoculation to prevent it,” in L. Bradley (ed.),Smallpox Inoculation: An Eighteenth Century Mathematical Controversy, Adult EducationDepartment, University of Nottingham, 1971.
[6] Blower, S.M., McLean, A.R., Porco, T.C., Small, P.M., Hopewell, P.C., Sanchez, M.A., andMoss, A.R. ”The intrinsic transmission dynamics of tuberculosis epidemics,” Nature Medicine,
1 (1995), 815-821.[7] Board on Life Sciences, BIO2010: Transforming Undergraduate Education for Future Research
Biologists, The National Academies Press, Washington, DC, 2003,http://www.nap.edu/books/0309085357/html/
WHY BIOMATH? WHY NOW? 31
[8] Dreyer, P.A., Jr., and Roberts, F.S., “Irreversible k-threshold processes: Graph-theoreticalthreshold models of the spread of disease and of opinion,” Discrete Applied Mathematics, 157(2009), 1615-1627.
[9] Drezner, Z, and Hamacher, H.W., Facility Location: Applications and Theory, Springer, 2004.[10] Du, D-Z, and Hwang, F.K., Combinatorial Group Testing and its Applications, 2nd ed.,
World Scientific, Singapore, 2000.[11] Fishburn, P.C., Interval Orders and Interval Graphs, Wiley, New York, 1985.[12] Golumbic, M.C., Algorithmic Graph Theory and Perfect Graphs, Academic Press, New York,
1980.[13] Hartnell, B., and Li, Q., “Firefighting on trees: How bad is the greedy algorithm?”, Congres-
sus Numerantium, 145 (2000), 187-192.[14] Hastings, A., Arzberger, P., Bolker, B., Ives, T., Johnson, N., and Palmer, M., “Quantitative
biology for the 21st Century,” Report from an NSF-sponsored workshop on Quantitative En-vironmental and Integrative Biology held in December 2002 at the San Diego SupercomputerCenter, http:/ /www.sdsc.edu/QEIB.
[15] Hastings, A., and Palmer, M.A., “A bright future for biologists and mathematicians,” Science,299 (2003), 2003-2004.
[16] Hethcote, H.W., and Yorke, J.A., Gonorrhea Transmission Dynamics and Control, Springer-Verlag, Berlin, 1984.
[17] Hinch, R., Greenstein, J.L., Tanskanen, A.J., Xu, L., and Winslow, R.L., “A simplified localcontrol model of calcium-induced calcium release in cardiac ventricular myocytes,” Biophys.J., 87 (2004), 3723-3736.
[18] Holley, R.W., Everett, G.A., Madison, J.T., Marquisee, M., and Zamir, A., “Structure of aribonucleic acid,” Science, 147 (1965), 1462-1465.
[19] Jackson, J.H., ”Bioinformatics and genomics,” in L.A. Steen (ed.), Math & Bio 2010: LinkingUndergraduate Disciplines, Mathematical Association of America, 2005, 51-61.
[20] Kaplan, E.H., Craft, D.L., and Wein, L.M., “Analyzing bioterror response logistics: The caseof smallpox,” Mathematical Biosciences, 185 (2003), 33-72.
[21] Klein, E., Laxminarayan, R., Smith, D.L., and Gilligan, C.A., “Economic incentives andmathematical models of diseases,” Environment and Development Economics, 12 (2007), 707-732.
[22] Lahav, G., Rosenfeld, N. Sigal, A., Geva-Zatorsky, N., Levine, A.J., Elowitz, M.B., andAlon, U., “Dynamics of the P53-Mdm2 feedback loop in individual cells,” Nature Genetics, 36(2004), 147-150
[23] Levin, S.A., Grenfell, B.., Hastings, A., and Perelson, A.S., “Mathematical and computationalchallenges in population biology and ecosystems science,” Science, 275 (1997), 334-343.
[24] Lin, J., Andreasen, V., and Levin, S.A., “Dynamics of influenza A drift: the linear three-strainmodel,” Math Biosci, 162 (1999), 33-51.
[25] MacGillivray, G., and Wang, P., “On the firefighter problem,” J. Combin. Math. Combin.Comput., 47 (2003), 83-96.
[26] Morris, R.W., Bean, C.A., Farber, G.K., Gallahan, D., Hight-Walker, A.R., Liu, Y., Lyster,P.M., Peng, G.C.Y., Roberts, F.S., Twery, M., and Whitmarsh, J., “Digital biology: Anemerging and promising discipline,” Trends in Biotechnology, 23 (2005), 113-117.
[27] Mostashari, F., “Syndromic surveillance in New York City,” Presentation to New York Acad-emy of Medicine, Nov., 2002,http://www.nyam.org/events/syndromicconference/presentationpdf/farzad mostashari.pdf
[28] Palmer, M.A., Arzberger, P., Cohen, J.E., Hastings, A., Holt, R.D., Morse, J.L., Sumners,D., and Luthey-Schulten, Z., “Accelerating mathematical biological linkages: Report of a jointNSF -NIH workshop,” February 2003, https://www.palmerlab.umd.edufreport.pdf
[29] Perelson, A.S., Neumann, A.U., Markowitz, M., Leonard, J.M., and Ho, D.D., “HIV-1 dy-namics in vivo: Virion clearance rate infected cell life span and viral generation time,” Science,271 (1996), 1582-1586.
[30] Roberts, F.S., Discrete Mathematical Models, with Applications to Social, Biological, andEnvironmental Problems, Prentice-Hall, Englewood Cliffs, NJ, 1976.
[31] Roberts, F.S., Graph Theory and its Applications to Problems of Society, NSF-CBMS Mono-graph #29, SIAM Publications, Philadelphia, 1978.

32 FRED S. ROBERTS
[32] Roberts, F.S., Measurement Theory, with Applications to Decisionmaking, Utility, and theSocial Sciences, Addison Wesley, Reading, MA, 1979. Digital printing, Cambridge UniversityPress, 2009.
[33] Roberts, F.S., “Limitations on conclusions using scales of measurement,” in S.M. Pollock,M.H. Rothkopf, and A. Barnett (eds.), Operations Research and the Public Sector, Handbooksin Operations Research and Management Science, Vol. 6, 1994, 621-671.
[34] Roberts, F.S., “Challenges for discrete mathematics and theoretical computer science in thedefense against bioterrorism,” in C. Castillo-Chavez and H.T. Banks (eds.), Mathematical andModeling Approaches in Homeland Security, SIAM Frontiers in Applied Mathematics Series,2003, 1-34.
[35] Roberts, F.S., “Meaningful and meaningless statements in epidemiology and public health,”in B. Berglund, G. B. Rossi, J. Townsend and L. Pendrill (Eds.), Measurements with Persons,Taylor and Francis, 2010, to appear.
[36] Roberts, F.S., and Tesman, B., Applied Combinatorics, 2nd Edition, Chapman&Hall/ CRC,an imprint of Taylor&Francis, 2009.
[37] Sarkar, S., “Defining ‘biodiversity’: Assessing biodiversity,” Monist., 85 (2002), 131-155.[38] Setubal, J., and Meidanis, J. Introduction to Computational Molecular Biology, Brooks/Cole,
Pacific Grove, CA, 1997.[39] Steen, L.A. (ed.), Math & Bio 2010: Linking Undergraduate Disciplines, Mathematical As-
sociation of America, 2005, 51-61.[40] Wang, P., and Moeller, S.A., “Fire control on graphs,” J. Combin. Math. Combin. Comput.,
41 (2002), 19-34.
DIMACS Rutgers University, 96 Frelinghuysen Road, Piscataway, NJ 08854-8018
E-mail address: [email protected]