why are there so few women top managers? a large … · why are there so few women top managers? a...
TRANSCRIPT

Why Are There So Few Women Top Managers?
A Large-Sample Empirical Study of the Antecedents
of Female Participation in Top Management
Cristian L. Dezső University of Maryland
Robert H. Smith School of Business 3347 Van Munching Hall College Park, MD 20742 [email protected]
David Gaddis Ross Columbia Business School
Uris Hall, Room 726 New York, NY 10027 [email protected]
Jose Uribe Columbia Business School
Uris Hall, Room 7F New York, NY 10027 [email protected]
Current Draft: March 2013
Note: The authors contributed equally to the study and are listed in alphabetical order.
1
Why Are There So Few Women Top Managers?
A Large-Sample Empirical Study of the Antecedents
of Female Participation in Top Management
The low rates of female participation in top management represent a puzzle, especially since some research suggests that the initial entry by women into top management in recent decades should have led to a positive social dynamic that made entry by subsequent women easier. We draw on the literature on majority-minority relations, gender in management, and social categories to theorize that the presence of a woman on a top management team may reduce rather than increase the probability that another top management position in the same firm will be occupied by a woman. Using twenty years of panel data on the top management teams of S&P 1,500 firms, we find robust evidence for such negative spillovers, which are especially strong for women chief executive officers and within similar job categories. We argue that our results are consistent with two mechanisms acting in concert: lack of solidarity among women managers and norms related to gender equity in management.

2
1. INTRODUCTION
Inspired by women’s significant educational, social, and economic advancements over the past decades, a
provocative book declares that we are witnessing “The End of Men” as the dominant sex (Rosin, 2012).
Indeed, in 2011, women accounted for 47% of the labor force and 38% of all managerial positions (BLS,
2011), and have made slow but steady progress in some levels of corporate leadership, with 16% of board
seats of Fortune 500 companies being held by women – a 40% increase over 2000 (Catalyst, 2005, 2012).
Yet, women continue to be significantly underrepresented in the top management of U.S. corporations,
despite evidence that the “pipeline to the top” is well supplied (BLS, 2011; Helfat, Harris, & Wolfson,
2006), that women exhibit managerial skills and styles associated with organizational success in the
contemporary business environment (Dezso & Ross, 2012; Eagly, 2007), and that they benefit from the
presence of female board members (Bilimoria, 2006; Catalyst, 2007; Matsa & Miller, 2011). In fact, the
overall percentage of women in top management positions remains under 8.5%, and their percentage has
actually declined in professional positions (e.g., chief financial officer), the category in which women
have made the greatest inroads, from a peak of 14.2% in 2004 to 12.8% in 2011.
Insert Figure 1 about here
Why have women failed to make better progress in top management positions despite making so
much progress in many other traditionally male-dominated areas, including similar milieus like lower
managerial levels and corporate boards, where resource dependence theory suggests women greatly
benefit the organizations for which they work (Hillman, Shropshire, & Cannella, 2007)? While a number
of specific mechanisms have been advanced, a general perspective, which is associated with the tokenism
theory of Kanter (1977), holds that women’s small numbers make them symbols of their category rather
than individuals and subject them to social and professional stresses. If more women were hired to similar
positions, women would lose their token status, leading to a positive social dynamic that made it easier to

3
recruit, train, and motivate additional women. Other barriers to women’s managerial advancement such as
the failure to accommodate women’s desire to bear children (Bertrand, Goldin, & Katz, 2010; Miller,
2011), statistical discrimination due to uncertainty about women’s suitability for leadership positions on
the part of other managers (Aigner & Cain, 1977; Bielby & Baron, 1986; Phelps, 1972) or investors (Lee
& James, 2007), gendered behaviors in screening job applicants whereby men and women are sorted into
different types of work whether due to differential commitments to the labor market or social closure
(Fernandez-Mateo & King, 2011), or the dearth of role models and mentors for women at lower levels of
the managerial hierarchy (Ely, 1994; Ibarra, 1992, 1993; Tsui, Egan, & Oreilly, 1992; Tsui & O’Reilly,
1989; Williams & O'Reilly, 1998) would also be expected to attenuate as the number of women senior
managers increases, due to the consequent changes to organizational culture and human resources
policies, the attitudes of male managers, and the incidence of women-to-women interaction in the
workplace. From this “optimistic” perspective, it should get progressively easier for women to ascend the
corporate career ladder as more and more women do so, eventually eliminating gender inequity in
corporate life.
And yet, if the optimistic perspective were the whole story, one might expect that female
participation rates in top management would be steadily growing – even at a progressively higher rate –
until something approaching equality; in fact, the growth of female participation rates has flattened out
and, for some kinds of positions, turned negative. Is it possible that it is in fact progressively harder for
women to ascend the corporate career ladder as more and more women do so, almost as if women get in
each other’s way? In this paper, we draw, inter alia, on the literature on majority-minority relations,
gender in management, and social categories to theorize two possible reasons for this: (1) lack of
solidarity among women: women may actively undermine the advancement of other women or prefer not
to work for other women; and (2) norm satisfaction: organizational efforts to recruit, train, and promote
women may slacken and perhaps even reverse their orientation as the aspirational norm of hiring women
to top management is gradually achieved. In this paper, we test these ideas using longitudinal data on
individual top management positions in U.S. public companies over a 20-year period.

4
In regressions that control for unobservable heterogeneity associated with firms and years, as well
as observable firm-specific and job-specific factors that have been linked in the literature to female
participation in top management, we find robust evidence in support of the “pessimistic” perspective.
Specifically, we find that the presence of a woman on a top management team makes it less likely that
another position on the same top management team in the same year will be occupied by a woman; that
this negative influence is particularly strong within job categories (e.g., line officers or professional
positions); and that the presence of a woman chief executive officer (CEO) has an especially strong
negative influence, in particular on the propensity of a woman to occupy line officer positions, which may
represent more credible internal replacements for the CEO. As we discuss in detail later, we believe these
results are consistent with two mechanisms – lack of solidarity among women and norm satisfaction –
playing an empirically relevant role in constraining the advancement of women to top management.
We also note that our results suggest that women are over dispersed among firms’ top
management teams relative to a random allocation of women to firms, to say nothing of an allocation that
would arise if some firms were particularly congenial to advancement by women. In other words, once
firm-specific observable and time-invariant unobservable attributes are controlled for, if we randomly
assigned women to firms, we would see more bunching of women in a given firm in a given year than we
actually observe. Finally, we find that standard firm-specific control variables like financial performance
and spending on research and development do not have consistent explanatory power; these non-results
are inconsistent with a number of extant normative and descriptive theories related to female participation
in top management.
Our study contributes to the literature on women’s access to corporate leadership positions and the
literature on the impact of female managers on gender inequality in the workplace. From a practical
perspective, our study implies that human resources practices designed to improve women’s access to the
upper echelons of management should be strengthened rather than weakened after the appointment of a
woman to a senior position.

5
2. THEORETICAL BACKGROUND
2.1 Women in Top Management Positions: Reasons for a Positive Spillover
The tokenism theory proposed by Kanter (1977) generally holds that women in management may find
safety in numbers. Indeed, a wide range of theoretical and empirical research lends support to the general
proposition that women’s entry into traditionally male-dominated realms like the upper echelons of
corporate management should resemble the S-curve of adoption; the first woman would face the highest
barriers, the next woman slightly fewer and so on, so that the number of women entering top management
would accelerate progressively until eventually leveling off at something approaching equality. An
identical argument could be applied to the concurrent advancement of multiple women.
To wit, from a cognitive perspective, social similarity enhances communication and the
development of trust and acts as a mechanism for reducing uncertainty, leading to similarity attraction
(Byrne, 1971; Kanter, 1977), and thus a propensity for women to seek to work with other women. In
addition, social identity theory (Tajfel, 1974) argues that social categorization is driven not only by
cognitive considerations but also by “values, perception, and social representations” (Tajfel & Forgas,
1981: 114) and that membership in a social category plays a significant role in an individual’s social
identity and self-image. As a result, gender-based social categorization may prompt women to positively
discriminate in favor of other women (Baron & Pfeffer, 1994; see Brewer & Kramer, 1985; and Powell &
Butterfield, 2002 for extensive reviews). A woman may also serve as a model for social comparison,
mentor, or sponsor for women at lower levels and may, simply by her presence, encourage men and
women in the organization to enact fewer masculine behaviors and more feminine behaviors, thereby
making the work environment more hospitable to women (Ely, 1994; Ibarra, 1993). A woman on the top
management team may thus serve as a catalyst for change that increases the possibility of additional
women joining her on the top management team, and women who rise together would be expected to
enhance each other’s chances of success within the organization.
Moreover, as the number of women in senior positions rises, there could well be greater internal
pressure to accommodate maternity leave, flexible work schedules, and alternative career paths, which are

6
differentially important to women (Bertrand et al., 2010; Miller, 2011). These changes would mitigate a
potential barrier to the managerial advancement by women. Likewise, to the extent that male managers
consciously or subconsciously use gender as a proxy for managerial ability, a woman on the top
management team could, through her demonstrations of competent leadership, engender a more positive
attitude toward the competency of women in general; this would lessen statistical discrimination against
women due to uncertainty about their skills (Aigner & Cain, 1977; Bielby & Baron, 1986; Phelps, 1972),
again lowering the barriers to advancement by other women in the same organization, whether at the
same level or below.
Finally, from an econometric perspective, one might also suspect that the presence of even a
single woman on a top management team would be positively associated with important but unobservable
changes in the firm’s culture and human resources policies that made the environment more favorable to
women than during periods when there were no women on the top management team. That is, there could
be a sort of reverse causality whereby the presence of a woman on the top management team serves as a
proxy for the very mechanisms discussed above. We would thus expect that women would tend to come
in bunches, as it were, in top management:
Hypothesis 1: The presence of a woman in a given top management position in a firm will be
positively associated with the presence of a woman in another top management position in that
firm.
2.2 Women in Top Management Positions: Reasons for a Negative Spillover
Despite the arguments advanced in the preceding section, there are two distinct reasons for believing that
in fact, it may become harder for women to advance to the upper levels of the corporate hierarchy when
token women are already present in top management or women peers are ascending the corporate
hierarchy concomitantly.
Lack of solidarity among women: Women in positions of power may actually be resistant to the
ascension of other women. Where organizations are subject to pressure to create opportunities for
disadvantaged groups, the first admitted member of the minority often has competitive advantages and

7
may be given access to important resources (Blalock, 1967). Token women in particular may benefit from
being different in an environment where success is associated with being known (Kanter, 1977). A token
woman in a top management position may in effect occupy an ecological niche made possible by her
organization’s need to conform to the aspirational norm of gender equity. Another woman on the top
management team would represent a threat to be actively resisted (Staines, Tavris, & Jayaratne, 1974).
In addition, members of a disadvantaged minority may adopt the identification strategy of
affiliating psychologically with the ideology of the advantaged majority, particularly if the advantaged
majority also occupies a higher status position in a different categorical dimension such as an elite
profession (Chattopadhyay, Tluchowska, & George, 2004). This strategy may be especially useful in the
context of a corporation’s top management, given its predominately male discourse and scarcity of female
role models. Indeed, a requirement for a woman to receive token status may be a credible ongoing
demonstration of acceptance of any prevailing misogynies of the male majority (Nieva & Gutek, 1981).
Moreover, after achieving a top management position, women might perceive the value of their
membership in such a high status group to be threatened if they exhibit favoritism towards other women
or if other women either bring higher qualifications or reinforce negative stereotypes about women’s lack
of qualification (Duguid, Loyd, & Tolbert, 2012). As a result, women who have succeeded in male-
dominated environments are sometimes accused of being “more male than men” in the popular jargon
(Mavin, 2006), and relationships among women may be more competitive than supportive in such
environments (Ely, 1994). These postulated behaviors by senior women suggest that the presence of a
woman on a top management team would reduce the probability that another position on that team would
be filled by a woman.
The foregoing would also suggest that women at lower management levels might seek to avoid
working for more senior women. The popular business press echoes these ideas, with some women
reporting particularly abusive behavior from their female superiors (Mooney & D'Argy Smith, 2005;
Platell, 2004). In addition, scholars argue that because females are discouraged from aggressive behavior,
their aggression may be channeled towards other women (Warning & Buchanan, 2009). Some women

8
also internalize gendered norms, including that female supervisors should be nurturing; these women may
resist working for a female supervisor either in reaction to, or anticipation of, the supervisor’s failure to
comply with these norms (O'Leary & Ryan, 1994). Women who have successfully adopted sexualized
strategies for relating to senior men will encounter difficulty in working for senior women, with regard to
whom these strategies are inappropriate. It is therefore unsurprising that scholars have found that women
believe that other women are good managers but do not want to work for them (Warning & Buchanan,
2009). It follows that women may avoid subordinate positions that would lead to contact with a woman
on a firm’s top management team. This avoidance behavior would not only reduce the probability of a
successful mentoring relationship between the woman on the top management team and a subordinate
woman but also reduce the subordinate woman’s exposure to the entire top management team and thus
her chances for an internal promotion to that top management team.
Norm satisfaction: Firms clearly face pressure to recruit, train, and promote women managers, and many
managers of both genders may subscribe to an aspirational norm of gender equity in senior management.
Organizations like Catalyst actively lobby for greater female representation at senior corporate levels.
Large investment companies like CalPERS, CalSTRS, and Pax World Funds have overtly promoted
gender equity at senior corporate levels either across their investment portfolio or in specific funds (Dezso
& Ross, 2012). In general, firms require legitimacy in the eyes of internal and external constituents to
secure needed resources and trading partners (Meyer & Rowan, 1977), thus making a public
demonstration of progress toward gender equity in senior management important for firm prosperity.
While equal numbers of women and men on the top management team may be normative, even a
single member of a minority can act as a symbol (Blalock, 1967), and the paucity of women on top
management teams means that firms with even a single female top manager are likely to be perceived as
doing well, at least in relative terms. Thus, a single woman can act as a female representative of the firm
to the media and other external constituencies by making credible representations about the firm’s
proactive approach to assisting the advancement by women up the hierarchy. This suggests that from the
standpoint of organizational legitimacy, the marginal value of the first woman on a firm’s top

9
management team would be considerably higher than the marginal value of any additional women. Senior
managers who subscribe to the aspirational norm of gender equity could also be expected to feel less
immediate urgency with respect to recruiting, training, and promoting a woman to the top management
team if a woman is already (or soon will be) on the top management team simply because these managers
feel their organizations are closer than peer firms to the ideal. Indeed, Kanter (1977) describes many
managers as being ready to relax at any sign of progress. The general shift in organizational focus away
from women’s advancement would be expected to reduce the possibility of another woman overcoming
any barriers that may exist to her advancement to the top management team.
Indeed, the shift in organizational focus may go beyond neutrality to an active resistance to the
ascension of additional women to the top management team. In general, majority resistance to a minority
is increasing in the degree to which the majority perceives the minority to be a threat to its power and
resources; this threat is usually an increasing function of the minority’s relative size (Blalock, 1967). In
studies of discrimination in voting, for example, a strong positive relationship has been observed between
the size of a racial minority in a given state and proxies for both minority disenfranchisement and white
racial solidarity in voting. Giles (1977) likewise finds a positive association between the degree of racial
hostility in white (American) Southerners’ attitude toward blacks and the proportion of the local
population accounted for by blacks, and Reed (1972) documents a similar relationship with lynchings in
Mississippi. The degree of majority resistance often appears to increase at a convex rate from as little as
20-25% (Blalock, 1967), i.e., roughly the percentage accounted for by a token woman on a typical five-
person top management team.
With regard to gender, Kanter (1977) herself notes that if more than one woman manager was
present in a corporate setting, then male managers adopted a number of behavioral strategies, whether
consciously or not, to set the women against each other. These findings are corroborated by South et al.
(1982), who find that token women did not face greater organizational pressure than non-token women;
rather the proportion of workgroups accounted for by women was negatively related to the social support
and encouragement for promotion women received from men. South et al. (1982) also find that as the

10
proportion of women increased, they interacted less with the male majority, potentially depriving women
of important sources of support and mentoring.
In general, this perspective suggests that however welcoming men in the majority may be to a
single woman on a top management team, they will be significantly less welcoming and perhaps actively
hostile to the presence of multiple women on the top management team. These same arguments suggest
that organizations would rarely seek to have multiple women on the top management team at the same
time. Taken together, these arguments lead to a countervailing hypothesis:
Hypothesis 2: The presence of a woman in a given top management position in a firm will be
negatively associated with the presence of a woman in another top management position in that
firm.
In what follows, we seek to investigate the extent to which each of these mechanisms plays a role
in explaining female participation in top management. To do so, we use a series of moderating factors,
each of which, we would like to argue, provide support for one of the mechanisms.
Top management team hierarchical structure and lack of solidarity among women: The CEO
position is clearly the most powerful position in most firms. Therefore, the few women who occupy, or
are newly promoted to, the CEO position possess greater ability than other top managers to influence the
composition of the executive team. Thus, if, due to lack of solidarity, women actively block the
advancement of other women, we would expect that the negative association between the presence of a
woman on a top management team and the probability that another top management position is filled by a
woman to be particularly strong when the focal woman is CEO. We therefore propose that:
Hypothesis 3a: The presence of a woman chief executive officer in a firm will have a particularly
strong negative association with the presence of a woman in another top management position in
that firm.
Senior women line managers represent a more credible replacement to a woman CEO than
women in other top management positions. In addition, a woman CEO may be particularly sensitive to

11
the repercussions of placing a woman in a line position, since poor performance in such a position could
reinforce negative stereotypes about women as managers (Duguid et al., 2012). Thus, we expect that:
Hypothesis 3b: The negative association between the presence of a woman chief executive officer
in a firm and the presence of a woman in another top management position will be especially
strong for line positions.
Occupational categories and norm satisfaction: Categories play a critical role in our understanding of
the world from both a social and cognitive point of view (Fiske & Taylor, 1991; Mervis, 1980). Senior
managers would use categories to classify and understand their environment. While these categories and
related schemata would undoubtedly have elements specific to the manager and firm, other elements
would reflect the norms of the top management profession. Among others, such norms include a
distinction between line positions with profit and loss responsibility (e.g., head of a subsidiary) and staff
positions more oriented toward supporting line positions (e.g., chief accounting officer). These
occupational categories would guide senior managers’ beliefs about their firm’s progress toward the goal
of gender equity, such that having women across different categories of top management position would
be more normative than having women clustered in one category.1 In addition, external constituencies
collect data not only with respect to the total number of women managers in top management but also
with respect to the types of positions that women occupy. One would expect that firms would acquire
more legitimacy from a relatively even distribution of women across top management job categories than
if the same number of women were “ghettoized” in a particular type of top management position.
Similarly, the need to compete for valuable resources is widely held to be a strong driver of
prejudicial behavior toward outgroups (Kurzban & Neuberg, 2005; Rodeheffer, Hill, & Lord, 2012;
Schaller, Park, & Faukner, 2003), and, in general, majority resistance to minority influence and access to
resources is increasing in the size of the minority (Blalock, 1967). It follows that as women become more
represented in a given top management job category in a given firm, they would thereby gain access not
1 One observes a similar phenomenon in academic hiring, whereby universities and the communities they serve focus not only on the total number of women professors but also on their distribution across disciplines and schools.

12
only to the management positions themselves but also to other related pools of resources, and would be
perceived as “growing in strength” within that job category. The male majority might then not merely be
less inclined to assist other women in acquiring positions in that job category but might actively resist the
ascension of other women to such positions.
It follows that organizations will, on the margin, direct resources more towards hiring women
across categories rather than in a single category, and may actively resist hiring multiple women to the
same category.
Hypothesis 4: The presence of a woman on a top management team will have a particularly
strong negative association with the presence of a woman in another top management position in
the same category.
3. METHOD
Data
We examine a large sample of U.S.-listed firms from 1992 to 2011. In general, U.S. public companies are
required to report information on the CEO and four other most highly-paid managers. Standard & Poor’s
ExecuComp provides data on these executives for the S&P 1,500 firms, a widely used index of public
companies designed to reflect the broad U.S. equity market (Standard & Poor’s, 2010). Following
previous research (c.f. Dezso & Ross, 2012), we take the managers reported in ExecuComp to be a firm’s
top management team. The size of the top management teams reported in ExecuComp is in line with
studies in the upper echelons literature, which typically report the “inner circle” of top management to
number between three and seven people (Carpenter & Sanders, 2002).
ExecuComp contains, inter alia, the gender and job title of the executives in our sample, but job
title is missing for 67% of the managers in the ExecuComp database in one or more years, or for about 22%
of the total number of observations. We accordingly supplemented ExecuComp using BoardEx, which
provides detailed career histories for board members of U.S. public companies, many of which are
executives in other firms. To obtain accurate matches between the two datasets, we first identified

13
companies in both datasets using three common identifiers, Central Index Key, CUSIP, and ticker symbol.
We then matched individuals within each firm by full name (including suffixes such as Jr. and Sr.) and
year of birth where available. Due to differences in spelling, inconsistent use of middle names and
nicknames (e.g., Bob, Bill, Ben, etc.), we conducted a second round of matching on last name and first
name initials only. These matches where then manually validated by comparing years of entry and exit
into each firm and with extensive web queries. After the matching procedure, the number of managers
with any missing titles for any year was reduced to 43%.
ExecuComp contains a field indicating whether a given executive is male or female. However,
inspection of the data revealed that approximately 40% of the women managers in the five most recent
years of the database (and a much smaller number in prior years) were improperly coded as male because
the managers in question had the female honorific “Ms.” and obviously female first names. (The number
of men improperly coded as female appeared to be much lower.) We accordingly coded a manager as a
woman if either ExecuComp coded the manager as a woman or the manager had the honorific “Ms”.
(Our results do not qualitatively change if we use ExecuComp’s gender coding as is.)
We used S&P’s CompuStat database as our source of financial information about the firms in our
sample. CompuStat collects financial information from firms’ public filings. We use the Center for
Research in Securities Prices (CRSP) as our source of firms’ initial public trading date. CRSP provides
stock trading information for firms whose shares trade on the NYSE, AMEX, and NASDAQ exchanges.
Variable Definitions
Dependent variable: The dependent variable in our regressions is the dummy Female, which takes the
value 1 if a given top management position in a given firm in a given year is occupied by a woman (with
gender determined as described above).
Job categories: We classify top management team positions into categories by extending the taxonomy
of Helfat et al. (2006) and defining dummy variables representing category membership as follows. Chief
executive officer, the highest ranking position in a firm, is coded using the CEO flag field in ExecuComp.
For over 99% of the firm-years in our sample, ExecuComp identifies one and only one CEO. Line officer

14
includes senior managers with responsibility for running revenue generating operations; these include a
second in command after the CEO like the President or COO (Hambrick & Cannella, 2004) and the head
of a division or subsidiary. Professional denotes a manager with responsibility for a support area;
examples include the chief accounting officer, chief administrative officer, chief compliance officer, chief
financial officer, chief marketing officer, chief technology officer, and general counsel, as well as the
head of human resources or research and development. Miscellaneous includes all other managers,
primarily those either with missing titles or with generic titles denoting hierarchical level but not the
nature of the manager’s job (e.g., EVP). Some managers have multiples titles that span categories; the
most common example is a CEO who is also COO or President, which would mean that the CEO is not
only responsible for strategy formulation and representation of the firm to external constituencies but also
responsible for strategy implementation and oversight of operations. To resolve these instances of overlap,
we establish an implicit hierarchy of Chief executive officer > Line officer > Professional, and code a
manager as belonging to the highest category for which that manager has an appropriate title. 2
Justification for this hierarchy is reflected in compensation data; if we rank each manager in terms of
salary and bonus from lowest to highest, the mean ranks are 1.26, 3.15, and 3.88 for Chief executive
officer, Line officer, and Professional, respectively. These data reflect the fact that revenue generating
positions are generally of higher status than support positions, and are more apt to lead to promotion to
CEO. In fact, of the over 6,400 CEOs who held their first CEO position in our data, about 45% were line
officers in their previous job versus only 2% who were professionals (and these figures are, respectively,
76% and 3% after 2000, in which years we have fewer missing job titles). Small wonder that women’s
relatively lower representation in line positions (see Figure 1) is frequently identified as a significant
barrier to women’s managerial advancement (e.g., Morrison & Vonglinow, 1990).
2 About 55% of Chief executive officer-years in our data have titles that would otherwise have resulted in the CEO being classified as Line officer or Professional, and about one tenth of the Line officer-years in our data have titles that would otherwise have resulted in the manager being classified as Professional.

15
Female representation in other positions: For each management position, we define the dummy
variable, Other woman, which takes the value 1 (0) if any (none) of the other managers reported in
ExecuComp for the same firm in the same year is also a woman. Other woman thereby functions like a
spatial autoregressive term in a model of geographic influences. In the same way that one could regress
crime rates in a given district on crime rates in neighboring districts, we use Other woman to determine to
what extent women in “neighboring management positions” influence the propensity for a woman to
occupy a focal management position. In that connection, defining the variable as a dummy rather than
using a continuous measure avoids imposing a functional form on the nature of the spatial influence and
mitigates concerns of mean reversion, which are as present in spatial autoregressive models as in the more
commonly used intertemporal autoregressive models. We also use the current value of Other woman
rather than its lagged value for two reasons. First, we are interested in, and have theorized about, the
contemporaneous influence on the propensity for a woman to occupy a given management position in a
given firm in a given year as a function of whether another woman occupies another position in the same
firm in the same year, that is, we are explicitly theorizing about codetermination. As with the example of
crime rates in neighboring districts, one would expect the contemporaneous relationship to be more
theoretically grounded and empirically relevant than a lagged relationship. For instance, a departing
senior woman manager would presumably have less influence on whether another senior management
position in her firm is filled by a woman in the subsequent year than a senior woman manager who
remains with her firm; we capture the woman who remains with her firm by using contemporaneous
values. Second, using lagged values requires having a proper panel of management positions, wherein the
nature of each job is relatively constant in the same firm across time. In our data, except for the CEO
position, firms exhibit variation across time in the management positions composing their top
management teams. Thus, it is hard to define the lagged value of Other woman in a consistent and
meaningful way.
16
In order to see whether the influence of Other woman varies by job category, we divide Other
woman into orthogonal subcategories based on our job classifications, yielding Other woman – CEO,
Other woman – Line, Other woman – Prof. and Other Woman – Misc.
Other control variables: We use a number of other control variables, many of which have been linked
theoretically in the literature to female representation in top management: Advertising intensity, the ratio
of advertising expense to assets; Firm age, the firm’s age in years measured as the difference between the
current year and the earlier of the firm’s first year in CompuStat or CRSP; Leverage, the ratio of debt to
the market value of a firm’s assets; R&D intensity, the ratio of R&D expense to assets; Size – assets, the
book value of a firm’s assets; Size – employees, the size of a firm’s workforce; and Tobin’s q, a forward-
looking measure of firm performance defined as the ratio of the market value of a firm’s assets to their
replacement value. If R&D expense or advertising expense is not material, a firm is not required to
disclose it as a separate line item. Accordingly, if one of these items is not separately disclosed, we
impute the value of zero to it. We log transform each of the foregoing variables (except Leverage) to
reduce skewness and lag each of them (except Firm age) by one year.
Empirical Design
We test our hypotheses regarding the propensity for a given top management position to be filled by a
woman while exploiting the longitudinal nature of our data to control for the many unobservable factors
that may make a firm’s work environment more or less congenial to women managers. Specifically, we
use two different econometric specifications where the dependent variable is the dummy Female: (a) a
linear probability model with fixed effects at the level of the firm and year (FE OLS), and (b) a logit
regression with random effects at the firm level and fixed effects at the year level (RE Logit). (Note that
controlling for firm level unobservable factors implicitly controls for industries, since industries are
composed of firms.) FE OLS has the following advantages: the marginal effects of each independent
variable are the same as the variable coefficients, making interpretation easier, and we can include fixed
effects for each firm with relatively few assumptions regarding the distribution of these fixed effects or
their correlation with the error term. A disadvantage of FE OLS is that it is not a proper discrete choice

17
model, meaning that predicted probabilities may lie outside the range [0,1]. Conversely, RE Logit is a
proper discrete choice model but does require separate calculation of marginal effects (which we report),
and imposes more assumptions on the distribution of the unobservable firm-level effects. In general,
marginal effects in FE OLS will tend to be larger than those in RE Logit where the unadjusted probability
of the dependent variable is close to 1 or 0, as in this paper, because so few top management team
positions are occupied by woman. The reason is that unlike FE OLS, predicted probabilities in RE Logit
are bounded by 0 and 1. See Greene (2002) for a discussion of these models.3 We cluster standard errors
by firm in our regressions to control for any remaining intertemporal error correlation within each panel.
We use year fixed effects to control for intertemporal changes to the baseline probability that a given top
management position will be occupied by a woman.
4. RESULTS
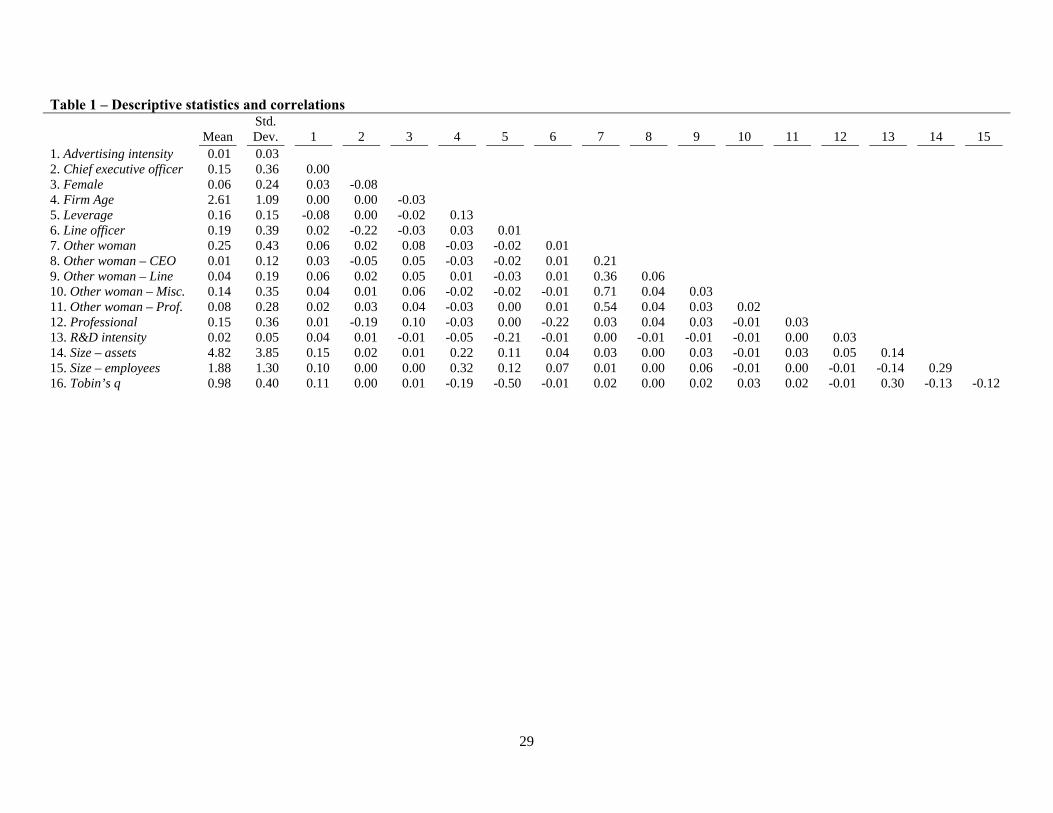
Table 1 presents summary statistics and correlations for the variables in our analysis.
Insert Table 1 about here
Table 2, Model 1 presents FE OLS and RE Logit regressions on the control variables. The negative
marginal effects of Chief executive officer and Line officer reflect the fact that women are particularly
underrepresented in management positions with leadership content, whereas the positive marginal effect
of Professional reflects the relative success women have enjoyed in supporting managerial positions.
More highly-levered firms are less likely to have women in senior managerial positions, perhaps
reflecting greater financial conservatism of women managers. The other control variables do not have
consistent predictive power.
3 While it possible to estimate a logit model with fixed effects at the firm level, that model does not allow for calculation of proper marginal effects, which is ultimately what is of interest to the researcher. We do obtain coefficient estimates with a fixed effects logit model that are qualitatively similar to those of the FE OLS and RE Logit models used in the paper.

18
Insert Table 2 about here
Table 2, Model 2 adds Other woman, which is highly statistically significant and negative. Thus, having a
woman in a given position within a firm’s top management team makes it less likely that another woman
will occupy another position. We note that this effect is larger in magnitude than any of the job category
dummies. This result provides strong initial support for hypothesis 2. Table 2, Model 3 divides Other
woman into orthogonal job categories, each of which is negative and highly statistically significant,
providing further support for hypothesis 2. In addition, the negative marginal effect of Other woman –
CEO is larger than all the other categories (p-values <0.01 for all coefficient comparisons), providing
support for hypothesis 3a and also suggesting that female CEOs may not generally endeavor to further the
interests of other women in their firms, that is, at least with respect to the CEO position, lack of solidarity
among women appears to be one of the mechanisms underlying the negative influence of Other woman.
In Models 2 and 3, we also observe that the size of a firm’s workforce is negatively related to the
propensity that a given top management position is occupied by a woman; while this result is of potential
theoretical interest, it is not robust to the more fine-grained analysis we run on separate job categories in
Table 3.
In Table 3, we run separate regressions for each job category. These are highly demanding
specifications because they implicitly allow unobservable firm and year effects to vary within each job
category and because the number of observations in each regression is substantially lower than in the full
sample. In these models, the number of significant control variables barely exceeds what one would
expect to find by chance. An implication is that once unobservable firm-level heterogeneity is controlled
for in a rigorous way, many of the standard theoretical drivers of female participation in top management
have no explanatory power.
Insert Table 3 about here
19
Other woman – CEO has no effect at all on the propensity for a professional position to be
occupied by a woman, suggesting that it is a woman CEO’s negative influence on line positions that is
primarily driving the result in Table 2, Model 3 that female CEOs have the overall largest negative effect
on the propensity for another position to be occupied by a woman. (Other woman – CEO is also negative
and significant for miscellaneous positions but this category would include some line positions that we
are unable to observe as such.) This is in line with hypothesis 3b and is consistent with the idea that
women CEOs find a senior woman line officer particularly threatening. This would in turn provide further
support for the proposition that lack of solidarity among women is one of the mechanisms behind the
negative influence of Other woman.
We also observe that the within-category version of Other woman always has the largest negative
effect; the difference with the next-largest coefficient is statistically significant at the 1% level in every
category except for line officers vis-à-vis CEOs in the FE OLS regression, where the difference is
statistically significant at the 10% level. This result lends strong support to hypothesis 4. The relatively
smaller difference for line officers between Other woman – CEO and Other woman – Line is, as noted,
consistent with hypothesis 3b.
5. DISCUSSION
The foregoing results indicate that the probability a given position in a given firm in a given year is filled
by a woman is lower if another position in the same firm in the same year is filled by a woman. We also
found that woman CEOs exert a particularly large negative influence, primarily by lowering the
probability that a woman will occupy a line position; and that having a woman in a particular job category
(e.g. professional) exerts an especially large negative influence on the probability that another position in
the same category will be filled by a woman.
We would like to argue that these results are consistent with each of lack of solidarity among
women and norm satisfaction playing a role in determining the propensity for women to participate in top
management. First, the strong negative spillovers we observe between top management jobs in the same
20
broad category suggest that organizational actors tend to reduce their efforts to place women in top
management jobs. One would expect these efforts to be directed towards avoiding the ghettoization of
women in particular job categories, due to the sensibilities of both top managers themselves and external
constituencies. The sensibilities of the top male managers might even be oriented toward active resistance
if a concentration of women in a particular category triggered greater hostility by the male ingroup toward
the female outgroup and competition between these groups for the resources to which the top
management positions in a given category gave access. That said, it could be argued that lack of solidarity
among women could also play a role in the strong within-category effects. Although most of the jobs in
the professional and miscellaneous categories are sufficiently specialized that one would not expect a
woman in a given such job (e.g., senior legal counsel) to regard a woman in another such job (e.g., chief
financial officer) as a potential replacement, a woman who enacts gender-based niche strategies may find
the presence of other women in qualitatively similar positions to be especially threatening to her identity.
Second, one could argue that the especially strong negative influence of having a female CEO on
the probability a woman occupies another top management position reflects the possibility that having a
woman in the firm’s top job would shield the firm from accusations of gender bias. Another possibility is
that the firm’s board feels less compulsion to support the ascension of women to the top management
team if the firm has a female CEO and thereby so visibly demonstrates the firm’s compliance with the
aspiration norm of gender equity. Nonetheless, the result is highly suggestive of lack of solidarity among
women, especially given that the full sample results appear to be primarily driven by revenue-generating,
line positions, where internal replacements to the CEO would be expected to come from. At the very
least, this result suggests that female CEOs are not actively helping other women ascend the corporate
hierarchy.
It is interesting to contrast the results we obtain with other work that seems to suggest that women
do help each other in a corporate setting. For instance, female managers have been related to other
gender-related organizational outcomes such as wages. Based on a small sample of Swedish employees
Hultin and Szulkin (1999) find that in 1991, women who worked in establishments with more female

21
managers received higher wages. Cardoso and Winter-Ebmer (2010) investigate the effect of female
CEOs on the wage policies of all Portuguese private firms over the period 1987-2000. They find that
female CEOs pay their female employees higher wages than do male CEOs, and that the gender wage gap
is 1.5% lower in female-led firms. Similarly, some large-sample studies find that women with influence
over the hiring process may reduce workplace gender segregation at non-managerial levels (Huffman,
Cohen, & Pearlman, 2010), or increase participation by women at lower levels (Kalev, Dobbin, & Kelly,
2006). It is possible that the effects we observe in our data are largely confined to the same or nearby
levels within a managerial hierarchy. Women of significantly lower status than those who set their pay
may not represent enough of a threat to trigger the mechanisms we have theorized. In addition, paying a
subordinate more money does not directly threaten a supervisor’s own organizational standing to the same
extent that the promotion of that subordinate to the supervisor’s level might do. A similar argument could
be made for organizational distance. A woman in a given department would presumably not be as
threatened by the presence of a woman in another department, especially if the two departments rarely
interacted. It is also possible that the spillover effects of female participation in management may depend
on the level in the managerial hierarchy. Cohen, Broschak, and Haveman (1998) use data from the
California savings and loan industry and find that the proportion of women at a focal level in a firm is
positively associated with the probability that a hire is a woman at that level. There are some important
differences between that study and this one, notably their focus on hires rather than on the ongoing
presence of women, which would include the effects of departures, as in our study. Perhaps, the most
important difference is that their results appear to be primarily driven by mid-level positions and
promotions, whereas our study, by design, focused solely on firms’ top management teams.
Closer in spirit to our investigation, Bilimoria (2006) and Matsa and Miller (2011) find that, in
the largest U.S. corporations, the share of female board members is positively associated with the share of
female senior managers. It is notable, however, that for boards of directors, which are mostly outsider
dominated, some of the mechanisms posited in this study work in the opposite direction: female board
members have little reason to feel their position threatened by other female top managers and both male

22
and female board members, being representatives of various stakeholders, might regard it as part of their
remit to push the organization to fulfill societal norms related to female representation in management.
We also think that the non-results of this paper are interesting. For example, the scarcity of senior
women managers may allow them to self-select into more successful firms (Farrell & Hersch, 2005), and
more successful firms may be more prone to respond to institutional pressure to hire women, either
because of a greater need for legitimacy (Meyer & Rowan, 1977), greater slack in resources, and less
resistance from the male majority in times of resource abundance. These arguments suggest a positive
relationship between lagged firm performance and the probability that a given management position in a
given firm in a given year is occupied by a woman. Moreover, literature on the “glass cliff” would
suggest that hiring a woman to a senior management position would predict poor future performance
(Ryan & Haslam, 2007), which, in the context of our empirical specification, would be expected to
manifest as a positive relationship with lagged firm performance. However, we found that firm
performance (Tobin’s q) had essentially no explanatory power. Likewise, neither Figure 1 nor the year
fixed effects in our regressions (not reported) reveal any consistent change in the baseline probability for
a woman to occupy a senior management position in the wake of the global financial crisis in the latter
2000s, despite the effect this episode might have been expected to have on the scarcity value of a top
management position and the attitudes of senior male managers toward the same. Dezso and Ross (2012)
find that innovation intensity as measured by R&D expenditures makes female participation in top
management more valuable, but this variable does not predict that a woman will occupy a given top
management position. A number of authors have argued that women managers are particularly important
if a firm is focused on selling to consumers, because women understand women consumers better (See,
for example, Hillman et al., 2007: 944, and the references therein); our measure of advertising intensity
proxies for the importance of consumers to a firm’s business, but has no explanatory power. The lack of
explanatory power of these various variables may be a result of the fact that we control rigorously for
firm-level heterogeneity.
23
We believe that our results offer many opportunities for future research. Some research suggests
that at least part of the reason that women have not made larger inroads into top management stems from
different preferences. For instance, relative to men, women may have an aversion to competing for
promotions (Niederle & Vesterlund, 2007) or be less interested in achievement and power (Adams &
Funk, 2012). These differential preferences, however, could be related to, and even caused by, the
mechanisms of lack of solidarity among women and norm satisfaction. More broadly, lack of solidarity
among women may itself be a product of societal norms in which women see themselves, and each other,
as not fully legitimated members of an organization’s upper echelon. Further work on the interactions
among these various mechanisms is warranted.
In addition, we note that our research design does not allow us to observe the behavior of the
managers we study or directly measure their attitudes. We thus view our work as complementary to the
large body of anthropological work that has studied gender issues in management.

24
6. REFERENCES
Adams, R. B. & Funk, P. 2012. Beyond the glass ceiling: Does gender matter? Management Science, 58:
219-235.
Aigner, D. J. & Cain, G. G. 1977. Statistical theories of discrimination in labor markets. Industrial and
Labor Relations Review: 175-187.
Baron, J. N. & Pfeffer, J. 1994. The social psychology of organizations and inequality. Social Psychology
Quarterly, 57(3): 190-209.
Bertrand, M., Goldin, C., & Katz, L. 2010. Dynamics of the Gender Gap for Young Professionals in the
Financial and Corporate Sectors. American Economic Journal: Applied Economics, 2: 228-255.
Bielby, W. T. & Baron, J. N. 1986. Men and women at work: Sex segregation and statistical
discrimination. American Journal of Sociology: 759-799.
Bilimoria, D. 2006. The Relationship Between Women Corporate Directors and Women Corporate
Officers. Journal of Managerial Issues, 18(1): 47-61.
Blalock, H. M. 1967. Toward a theory of minority-group relations. New York: John Wiley & Sons, Inc.
BLS. 2011. Women in the Labor Force: A Databook. Washington, DC: Bureau of Labor Statistics.
Brewer, M. B. & Kramer, R. 1985. The psychology of intergroup attitudes and behaviors. Annual Review
of Psychology, 36: 219-243.
Byrne, D. E. 1971. The Attraction Paradigm. New York: Academic Press.
Cardoso, A. R. & Winter-Ebmer, R. 2010. Female-Led Firms and Gender Wage Policies. Industrial and
Labor Relations Review, 64: 143-163.
Carpenter, M. A. & Sanders, W. G. 2002. Top management team compensation: the missing link between
CEO pay and firm performance? Strategic Management Journal, 23(4): 367–375.
Catalyst. 2005. Census of Women Board Directors of the Fortune 500; Ten Years Later: Limited
Progress, Challenges Persist. New York: www.catalyst.org.

25
Catalyst. 2007. The Bott om Line: Corporate performance and women’s representation on boards. New
York: www.catalyst.org.
Catalyst. 2012. Census of Fortune 500 Women Board Directors. New York: www.catalyst.org.
Chattopadhyay, P., Tluchowska, M., & George, E. 2004. Identifying the ingroup: A closer look at the
influence of demographic dissimilarity on employee social identity. Academy of Management Review,
29(2): 180-202.
Cohen, L. E., Broschak, J. P., & Haveman, H. A. 1998. And then there were more? The effect of
organizational sex composition on the hiring and promotion of managers. American Sociological Review,
63: 711-727.
Dezso, C. L. & Ross, D. G. 2012. Does Female Representation in Top Management Improve Firm
Performance? A Panel Data Investigation. Strategic Management Journal, 33: 1072–1089.
Duguid, M. M., Loyd, D. L., & Tolbert, P. S. 2012. The Impact of Categorical Status, Numeric
Representation, and Work Group Prestige on Preference for Demographically Similar Others: A Value
Threat Approach. Organization Science, 23(2): 386-401.
Eagly, A. H. 2007. Female leadership advantage and disadvantage: resolving the contradictions.
Psychology of Women Quarterly, 31(1): 1-12.
Ely, R. J. 1994. The Effects of Organizational Demographics and Social Identity on Relationships Among
Professional Women. Administrative Science Quarterly, 39(2): 203-238.
Farrell, K. A. & Hersch, P. L. 2005. Additions to corporate boards: the effect of gender. Journal of
Corporate Finance, 11(1–2): 85-106.
Fernandez-Mateo, I. & King, Z. 2011. Anticipatory Sorting and Gender Segregation in Temporary
Employment. Management Science, 57(6): 989-1008.
Fiske, S. T. & Taylor, S. E. 1991. Conditions of Schema Use, Social Cognition: 142-179. New York:
McGraw-Hill.
Giles, M. W. 1977. Percent Black and Racial Hostility: An Old Assumption Reexamined. Social Science
Quarterly, 58(3): 412-417.

26
Greene, W. H. 2002. Econometric Analysis (5th ed.). Upper Saddle River, NJ: Prentice Hall.
Hambrick, D. C. & Cannella, J., Albert A. 2004. CEOs who have COOs: Contingency analysis of an
unexplored structural form. Strategic Management Journal, 25(10): 959-979.
Helfat, C. E., Harris, D., & Wolfson, P. J. 2006. The Pipeline to the Top: Women and Men in the Top
Executive Ranks of U.S. Corporations. Academy of Management Perspectives, 20(4): 42-64.
Hillman, A. J., Shropshire, C., & Cannella, A. A. 2007. Organizational predictors of women on corporate
boards. Academy of Management Journal, 50(4): 941-952.
Huffman, M. L., Cohen, P. N., & Pearlman, J. 2010. Engendering Change: Organizational Dynamics and
Workplace Gender Desegregation, 1975-2005. Administrative Science Quarterly, 55(2): 255-277.
Hultin, M. & Szulkin, R. 1999. Wages and unequal access to organizational power: An empirical test of
gender discrimination. Administrative Science Quarterly, 44(3): 453-472.
Ibarra, H. 1992. Homophily and Differential Returns: Sex-Differences in Network Structure and Access
in an Advertising Firm. Administrative Science Quarterly, 37(3): 422-447.
Ibarra, H. 1993. Personal Networks of Women and Minorities in Management - a Conceptual Framework.
Academy of Management Review, 18(1): 56-87.
Kalev, A., Dobbin, F., & Kelly, E. 2006. Best Practices or Best Guesses? Assessing the Efficacy of
Corporate Affirmative Action and Diversity Policies. American Sociological Review, 71: 589-617.
Kanter, R. M. 1977. Men and women of the corporation. New York: Basic Books.
Kurzban, R. & Neuberg, S. 2005. Managing ingroup and outgroup relationships. In D. M. Buss (Ed.), The
Handbook of Evolutionary Psychology. Hobken, NJ: Wiley.
Lee, P. M. & James, E. H. 2007. She'-E-Os: Gender effects and investor reactions to the announcements
of top executive appointments. Strategic Management Journal, 28(3): 227-241.
Matsa, D. A. & Miller, A. R. 2011. Chipping away at the Glass Ceiling: Gender Spillovers in Corporate
Leadership. American Economic Review: Papers and Proceedings, 101(3): 635–639.
Mavin, S. 2006. Venus envy: problematizing solidarity behaviour and queen bees. Women in
Management Review, 21(4): 264-276.
27
Mervis, C. B. 1980. Category structure and the development of categorization. Theoretical issues in
reading comprehension: Perspectives from Cognitive Psychology, Linguistics, Artificial Intelligence,
and Education: 279-307.
Meyer, J. W. & Rowan, B. 1977. Institutionalized organizations: Formal structure as myth and ceremony.
American Journal of Sociology, 83(2): 340-363.
Miller, A. R. 2011. The effects of motherhood timing on career path. Journal of Population Economics,
24(3): 1071-1100.
Mooney, N. & D'Argy Smith, M. 2005. Are Career Women at War?, Daily Mail, September 29, 2005 ed.
London.
Morrison, A. M. & Vonglinow, M. A. 1990. Women and minorities in management. American
Psychologist, 45(2): 200-208.
Niederle, M. & Vesterlund, L. 2007. DoWomen Shy away from Competition? Do Men Compete too
Much? Quarterly Journal of Economics, 122(3): 1067-1101.
Nieva, V. F. & Gutek, B. A. 1981. Women and work: A psychological perspective. New York: Praeger.
O'Leary, V. & Ryan, M. M. 1994. Women bosses: counting the changes or changes that count. In M.
Tanton (Ed.), Women in Management: A developing presence: Routledge, London: 63-78. New York.
Phelps, E. S. 1972. The Statistical Theory of Racism and Sexism. The American Economic Review,
62(4): 659-661.
Platell, A. 2004. Why are women so awful to each other?, Daily Mail, 23 August 2004 ed. London.
Powell, G. N. & Butterfield, D. A. 2002. Exploring the Influence of Decision Makers' Race and Gender
on Actual Promotions to Top Management. Personnel Psychology, 55: 397-428.
Reed, J. S. 1972. Percent black and lynching: A test of Blalock's theory. Social Forces, 50(3): 356-360.
Rodeheffer, C. D., Hill, S. H., & Lord, C., G. 2012. Does this recession make me look black? The effect
of resource scarcity on the categorization of black faces. Psychology Science.
Rosin, H. 2012. The End of Men: and the Rise of Women. New York, NY: Riverhead Books.
28
Ryan, M. K. & Haslam, A. S. 2007. The glass cliff: Exploring the dynamics surrounding the appointment
of women to precarious leadership positions. Academy of Management Review, 32(2): 549-572.
Schaller, M., Park, J. H., & Faukner, J. 2003. Prehistoric dangers and contemporary prejudices. European
Review of Social Psychology, 14: 105-137.
South, S. J., Bonjean, C. M., Markham, W. T., & Corder, J. 1982. Social structure and intergroup
interaction: Men and women of the federal bureaucracy. American Sociological Review: 587-599.
Staines, G., Tavris, C., & Jayaratne, T. E. 1974. The queen bee syndrome. Psychology Today, 7(8): 55-
60.
Tajfel, H. 1974. Social identity and intergroup behaviour. Social Science Information/sur les sciences
sociales.
Tajfel, H. & Forgas, J. P. 1981. Social categorization: Cognitions, values, and groups. In J. P. Forgas
(Ed.), Social cognition: Perspective on everyday understanding: 113-140. New York: Academic Press.
Tsui, A. S. & O’Reilly, C. A. 1989. Beyond simple demographic effects: The importance of relational
demography in superior-subordinate dyads. Academy of Management Journal, 32(2): 402-423.
Tsui, A. S., Egan, T. D., & Oreilly, C. A. 1992. Being Different: Relational Demography and
Organizational Attachment. Administrative Science Quarterly, 37(4): 549-579.
Warning, R. & Buchanan, F. R. 2009. An exploration of unspoken bias: women who work for women.
Gender in Management: An International Journal, 24(2): 131-145.
Williams, K. Y. & O'Reilly, C. A. 1998. Demography and diversity in organizations: A review of 40
years of research, Research in Organizational Behavior, Vol 20, 1998, Vol. 20: 77-140.
29
Table 1 – Descriptive statistics and correlations
Mean
Std. Dev.
1
2
3
4
5
6
7
8
9
10
11
12
13
14
15
1. Advertising intensity 0.01 0.03 2. Chief executive officer 0.15 0.36 0.00 3. Female 0.06 0.24 0.03 -0.08 4. Firm Age 2.61 1.09 0.00 0.00 -0.03 5. Leverage 0.16 0.15 -0.08 0.00 -0.02 0.13 6. Line officer 0.19 0.39 0.02 -0.22 -0.03 0.03 0.01 7. Other woman 0.25 0.43 0.06 0.02 0.08 -0.03 -0.02 0.01 8. Other woman – CEO 0.01 0.12 0.03 -0.05 0.05 -0.03 -0.02 0.01 0.21 9. Other woman – Line 0.04 0.19 0.06 0.02 0.05 0.01 -0.03 0.01 0.36 0.06 10. Other woman – Misc. 0.14 0.35 0.04 0.01 0.06 -0.02 -0.02 -0.01 0.71 0.04 0.03 11. Other woman – Prof. 0.08 0.28 0.02 0.03 0.04 -0.03 0.00 0.01 0.54 0.04 0.03 0.02 12. Professional 0.15 0.36 0.01 -0.19 0.10 -0.03 0.00 -0.22 0.03 0.04 0.03 -0.01 0.03 13. R&D intensity 0.02 0.05 0.04 0.01 -0.01 -0.05 -0.21 -0.01 0.00 -0.01 -0.01 -0.01 0.00 0.03 14. Size – assets 4.82 3.85 0.15 0.02 0.01 0.22 0.11 0.04 0.03 0.00 0.03 -0.01 0.03 0.05 0.14 15. Size – employees 1.88 1.30 0.10 0.00 0.00 0.32 0.12 0.07 0.01 0.00 0.06 -0.01 0.00 -0.01 -0.14 0.29 16. Tobin’s q 0.98 0.40 0.11 0.00 0.01 -0.19 -0.50 -0.01 0.02 0.00 0.02 0.03 0.02 -0.01 0.30 -0.13 -0.12

30
Table 2 – Probability a top management position is occupied by a woman: marginal effects 1 2 3 FE OLS RE Logit FE OLS RE Logit FE OLS RE Logit Other woman -15.35*** -2.94*** (0.62) (0.18) Other woman – CEO -22.39*** -3.71*** (2.49) (0.25) Other woman – Line -14.70*** -2.60*** (1.01) (0.17) Other woman – Prof. -13.29*** -2.32*** (0.69) (0.15) Other woman – Misc. -13.60*** -2.41*** (0.63) (0.15) Chief executive officer -4.73*** -2.82*** -4.39*** -2.20*** -4.57*** -2.39*** (0.26) (0.16) (0.25) (0.15) (0.22) (0.16) Line officer -2.28*** -1.02*** -2.13*** -0.81*** -2.20*** -0.85*** (0.24) (0.08) (0.23) (0.07) (0.22) (0.07) Professional 4.09*** 1.02*** 3.80*** 0.72*** 3.81*** 0.72*** (0.42) (0.07) (0.39) (0.06) (0.38) (0.06) Advertising intensity 2.43 1.03 2.84 0.78 4.76 1.64** (3.41) (0.90) (5.00) (0.75) (5.75) (0.75) Firm age -0.32 -0.16*** -0.40 -0.13*** -0.39 -0.10** (0.15) (0.04) (0.23) (0.04) (0.25) (0.04) Leverage -1.81* -0.77*** -2.64** -0.86*** -2.83* -0.98*** (0.96) (0.26) (1.48) (0.23) (1.55) (0.23) R&D intensity -2.51 -0.92* -3.15 -1.04** -3.97 -1.36** (2.34) (0.54) (3.25) (0.44) (3.72) (0.44) Size – assets -0.02 -0.01 -0.03 0.00 -0.02 0.00 (0.02) (0.00) (0.03) (0.00) (0.03) (0.00) Size – employees -0.63*** -0.07 -0.89** -0.13*** -0.92** -0.12** (0.24) (0.04) (0.36) (0.04) (0.39) (0.04) Tobin’s q -0.04 0.11 0.02 0.06 -0.14 -0.02 (0.34) (0.09) (0.51) (0.08) (0.54) (0.08) Observations 195,684 195,684 195,684 195,684 195,684 195,684 F-Stat. Other woman CEO vs. Line 10.00*** 54.24*** CEO vs. Prof. 13.43*** 79.12*** CEO vs. Misc. 13.29*** 76.51*** Line vs. Prof. 1.73 9.26** Line vs. Misc. 1.35 5.45**
31
Prof. vs. Misc. 0.19 1.48 Standard errors are in parentheses and are clustered at the firm level. Regressions include untabulated dummy variables for year. The fixed and random effects are calculated with respect to firms. Figures are expressed in percentage terms. *, **, *** Denote significance at the 10%, 5%, and 1%, levels, respectively.

32
Table 3 – Probability a top management position is occupied by a woman by type of position: marginal effects Chief executive officer Line officer Professional Miscellaneous FE OLS RE Logit FE OLS RE Logit FE OLS RE Logit FE OLS RE Logit
Other woman – CEO -14.53*** -0.30*** -1.68 -0.10 -8.33*** -0.87*** (3.37) (0.05) (4.28) (0.29) (2.66) (0.17) Other woman – Line -4.84*** -6.85e-3*** -20.95*** -0.43*** -6.19*** -0.82*** -11.04*** -1.36*** (1.02) (1.74e-3) (2.04) (0.06) (1.90) (0.19) (1.23) (0.13) Other woman – Prof. -0.39 5.70e-4 -2.08** -0.07*** -36.44*** -4.29*** -5.17*** -0.76*** (0.54) (1.12e-3) (0.83) (0.02) (1.52) (0.39) (0.83) (0.09) Other woman – Misc. -1.70*** -2.17e-3** -6.45*** -0.20*** -8.09*** -1.04*** -18.66*** -2.13*** (0.52) (1.07e-3) (0.79) (0.03) (1.28) (0.15) (0.88) (0.15) Advertising intensity -2.93 -5.99e-3 4.34 0.28 8.48 3.40** 4.60 0.84 (4.39) (1.50-e2) (8.78) (0.27) (17.37) (1.96) (6.69) (0.84) Firm age -0.30 -1.84e-3** -0.16 -0.01 0.12 -0.03 -0.73** -0.18*** (0.24) (7.35e-4) (0.34) (0.01) (0.48) (0.07) (0.34) (0.05) Leverage -0.01 -4.40e-3 -2.63 -0.26*** -2.44 -0.58 -2.34 -0.58** (1.50) (4.07e-3) (2.45) (0.10) (4.29) (0.46) (1.94) (0.24) R&D intensity -0.52 4.12e-3 -2.29 -0.26 -12.95 -2.67*** -2.39 -0.38 (3.14) (8.22e-3) (3.10) (0.23) (11.02) (0.91) (3.41) (0.45) Size – assets -0.05** -2.25e-4* 0.00 0.00 0.03 0.00 -0.03 0.00 (0.02) (1.25e-4) (0.04) (0.00) (0.08) (0.01) (0.04) (0.00) Size – employees -0.52 -8.33e-5 0.36 0.07*** -1.88* -0.07 -0.56 -0.06 (0.37) (5.64e-4) (0.50) (0.02) (1.06) (0.07) (0.45) (0.04) Tobin’s q 0.27 1.40e-3 0.20 0.10*** -2.25 -0.38** 0.28 0.12 (0.50) (1.54e-3) (0.85) (0.03) (1.44) (0.19) (0.65) (0.08) Observations 31,237 31,237 38,913 38,913 30,760 30,760 94,774 94,774 F-Stat. Other woman CEO vs. Line 3.26* 7.52*** 1.25 4.73** 0.96 7.44*** CEO vs. Prof. 13.21*** 17.86*** 59.99*** 74.73*** 1.32 0.44 CEO vs. Misc. 5.78** 5.46** 2.21 8.62*** 14.92*** 46.91*** Line vs. Prof. 15.02*** 12.23*** 76.59*** 39.13*** 161.90*** 88.30*** 17.30*** 24.92*** Line vs. Misc. 10.37*** 7.61*** 49.43*** 30.70*** 0.87 1.12 35.19*** 46.90*** Prof. vs. Misc. 3.30* 3.19* 16.22*** 12.52*** 273.99*** 99.47*** 168.72*** 119.42*** Standard errors are in parentheses and are clustered at the firm level. Regressions include untabulated dummy variables for year. The fixed and random effects are calculated with respect to firms. Figures are expressed in percentage terms. *, **, *** Denote significance at the 10%, 5%, and 1%, levels, respectively.

33
Figure 1 – Female Participation Rates in Top Management across Time, by Job Category
0%
1%
2%
3%
4%
5%
6%
7%
8%
9%
10%
11%
12%
13%
14%
15%
1992 1995 1998 2001 2004 2007 2010
Year
Overall CEO Line Professional Miscellaneous