who wins in offshoring? · pdf filewho wins in offshoring? ... lan-zzy396-20031015-5408-zzy 1...
TRANSCRIPT
LAN-ZZY396-20031015-5408-ZZY
Who Wins in Offshoring?Who Wins in Offshoring?
McKinsey Global InstituteMcKinsey Global InstituteFebruary 4, 2004February 4, 2004
LAN-ZZY396-20031015-5408-ZZY
1
McKinsey Global Institute
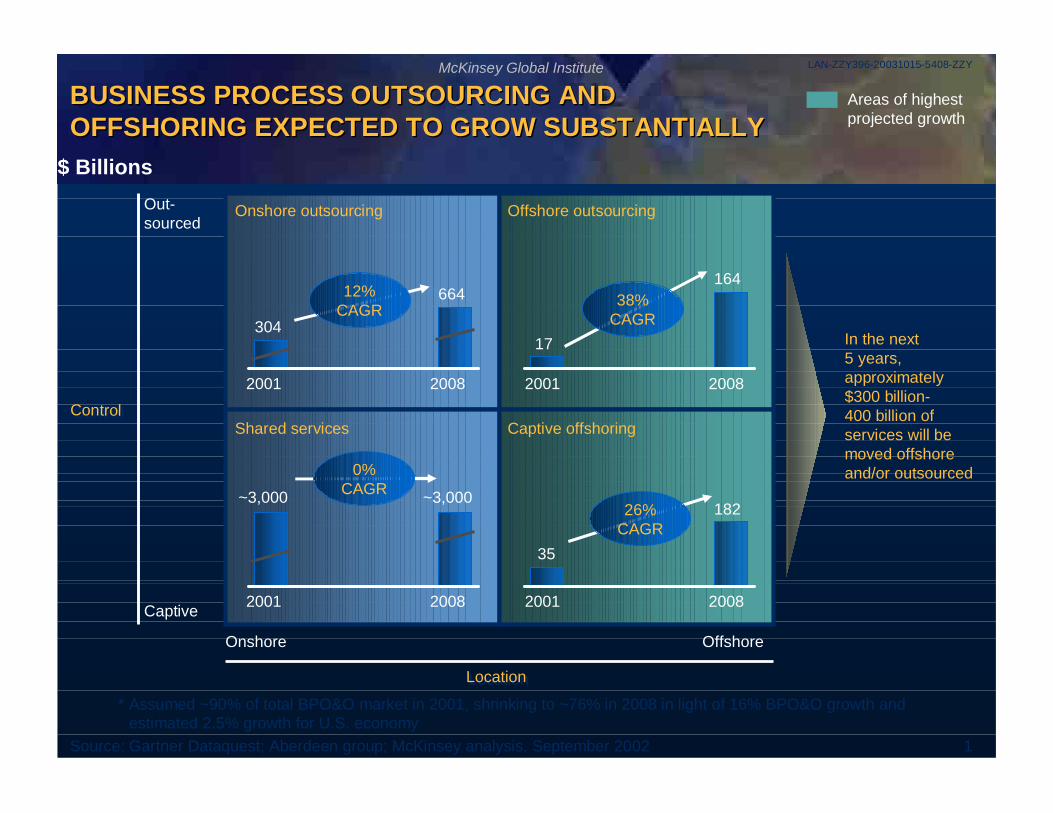
BUSINESS PROCESS OUTSOURCING ANDOFFSHORING EXPECTED TO GROW SUBSTANTIALLYBUSINESS PROCESS OUTSOURCING ANDOFFSHORING EXPECTED TO GROW SUBSTANTIALLY
* Assumed ~90% of total BPO&O market in 2001, shrinking to ~76% in 2008 in light of 16% BPO&O growth andestimated 2.5% growth for U.S. economy
Source: Gartner Dataquest; Aberdeen group; McKinsey analysis, September 2002
ControlControl
In the next5 years,approximately$300 billion-400 billion ofservices will bemoved offshoreand/or outsourced
LocationLocation
Onshore Offshore
Out-sourced
Captive
Onshore outsourcing Offshore outsourcing
Captive offshoringShared services
2001 2008
304
664
2001 2008
17
164
2001 2008
~3,000 ~3,000
2001 2008
35
182
12%CAGR 38%
CAGR
0%CAGR
26%CAGR
Areas of highestprojected growth
$ Billions

LAN-ZZY396-20031015-5408-ZZY
2
McKinsey Global Institute
Australia
0.4
Mexico
0.5
EasternEurope
0.4Russia
0.2
China
1.1
Philippines0.3
0.05Thailand
India
7.7
South Africa0.01
Israel
3.0Ireland
8.3
Canada
3.7
INDIA IS A DOMINANT PLAYER IN OFFSHORINGINDIA IS A DOMINANT PLAYER IN OFFSHORING
Offshored services market size$ Billions, 2001
* Includes Poland, Romania, Hungary, and Czech Republic** Primarily composed of MNC captives
Source: Software Associations; U.S country commercial reports; press articles; McKinsey analysis; Gartner; IDC; Countrygovernment websites; Ministry of Information Technology for various countries; Enterprise Ireland; NASSCOM
LAN-ZZY396-20031015-5408-ZZY
3
McKinsey Global Institute
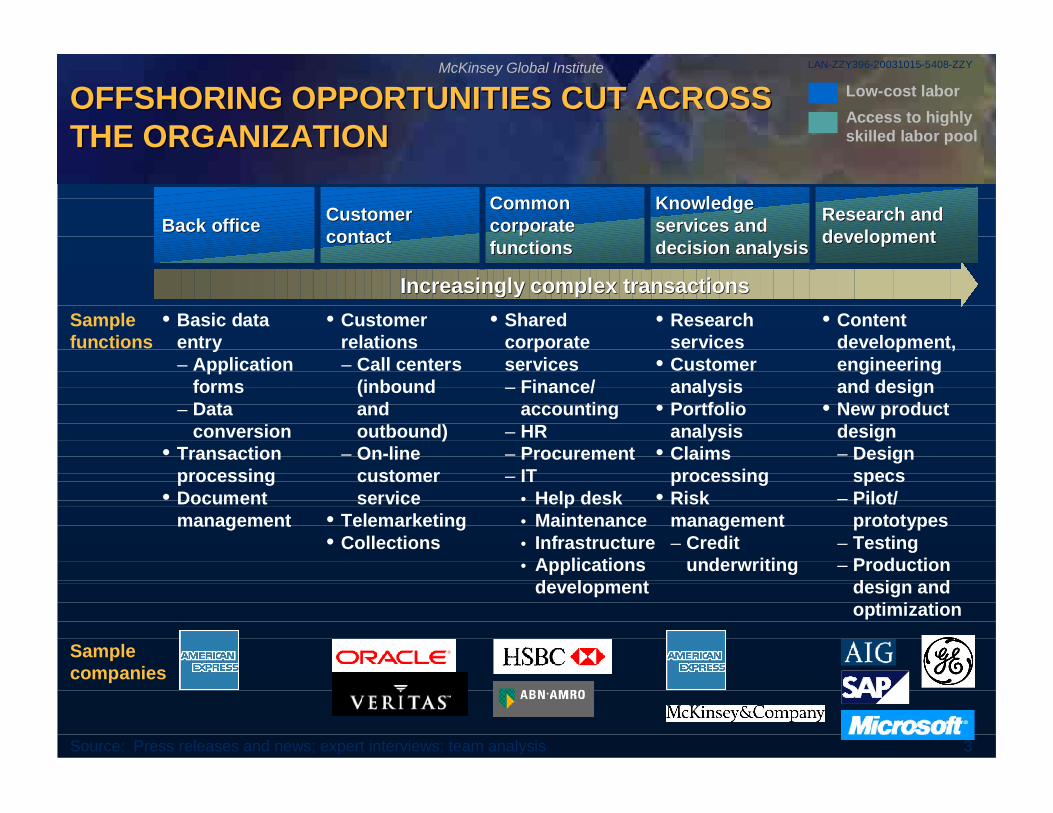
OFFSHORING OPPORTUNITIES CUT ACROSSTHE ORGANIZATIONOFFSHORING OPPORTUNITIES CUT ACROSSTHE ORGANIZATION
Source: Press releases and news; expert interviews; team analysis
Samplefunctions
Samplecompanies
Increasingly complex transactionsIncreasingly complex transactions• Basic data
entry– Application
forms– Data
conversion• Transaction
processing• Document
management
• Customerrelations– Call centers
(inboundandoutbound)
– On-linecustomerservice
• Telemarketing• Collections
• Sharedcorporateservices– Finance/
accounting– HR– Procurement– IT
• Help desk• Maintenance• Infrastructure• Applications
development
• Researchservices
• Customeranalysis
• Portfolioanalysis
• Claimsprocessing
• Riskmanagement– Credit
underwriting
• Contentdevelopment,engineeringand design
• New productdesign– Design
specs– Pilot/
prototypes– Testing– Production
design andoptimization
Back officeBack office CustomerCustomercontactcontact
CommonCommoncorporatecorporatefunctionsfunctions
KnowledgeKnowledgeservices andservices anddecision analysisdecision analysis
Research andResearch anddevelopmentdevelopment
Access to highlyskilled labor pool
Low-cost labor
LAN-ZZY396-20031015-5408-ZZY
4
McKinsey Global Institute
Source: McKinsey Global Institute
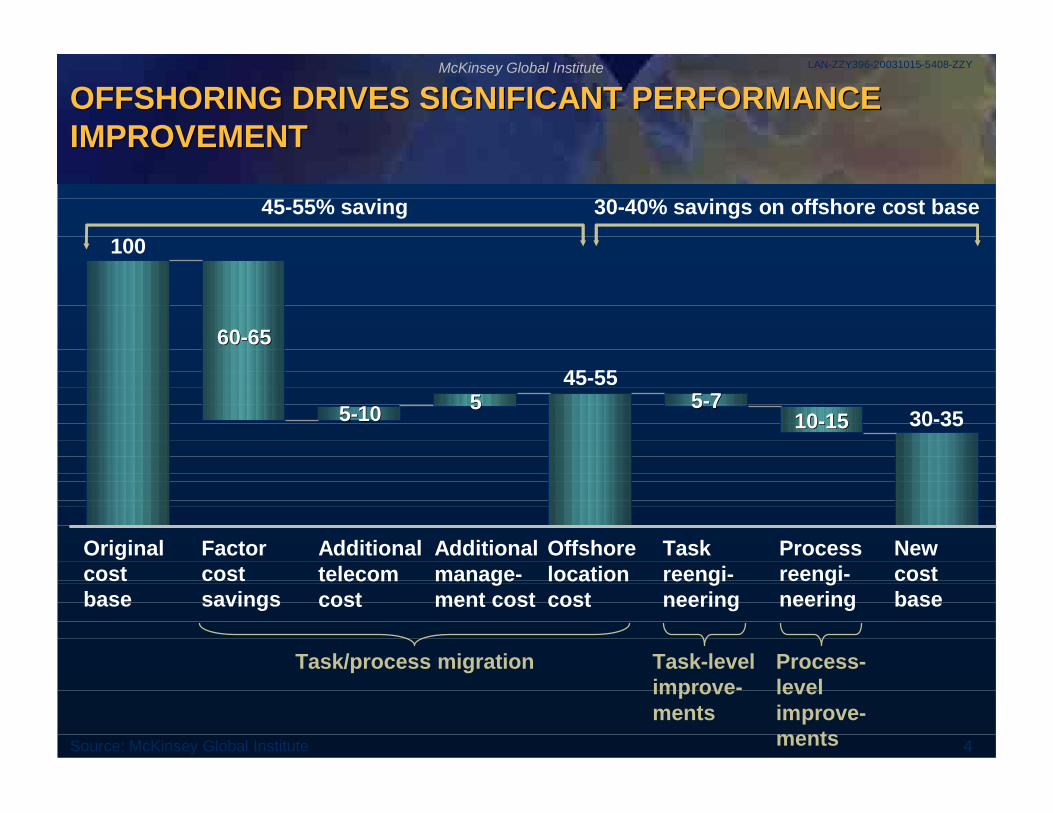
OFFSHORING DRIVES SIGNIFICANT PERFORMANCEIMPROVEMENTOFFSHORING DRIVES SIGNIFICANT PERFORMANCEIMPROVEMENT
Originalcostbase
Factorcostsavings
Additionaltelecomcost
Additionalmanage-ment cost
Offshorelocationcost
Taskreengi-neering
Processreengi-neering
Newcostbase
Task/process migration Task-levelimprove-ments
Process-levelimprove-ments
45-55% saving 30-40% savings on offshore cost base
100
6060--6565
55--1010 5545-55
55--771010--1515 30-35
LAN-ZZY396-20031015-5408-ZZY
5
McKinsey Global Institute
0.33
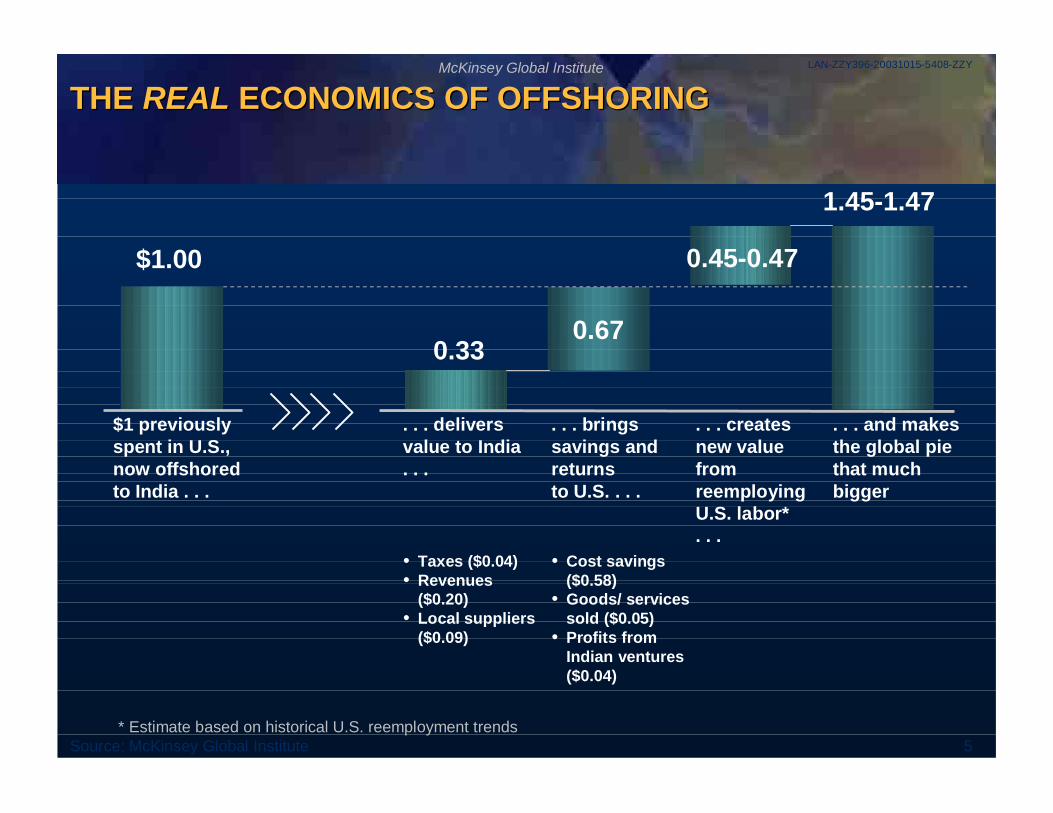
* Estimate based on historical U.S. reemployment trendsSource: McKinsey Global Institute
THE REAL ECONOMICS OF OFFSHORINGTHE REAL ECONOMICS OF OFFSHORING
• Taxes ($0.04)• Revenues
($0.20)• Local suppliers
($0.09)
. . . deliversvalue to India. . .
0.67
• Cost savings($0.58)
• Goods/ servicessold ($0.05)
• Profits fromIndian ventures($0.04)
. . . bringssavings andreturnsto U.S. . . .
1.45-1.47
. . . and makesthe global piethat muchbigger
0.45-0.47
. . . createsnew valuefromreemployingU.S. labor*. . .
$1 previouslyspent in U.S.,now offshoredto India . . .
$1.00
LAN-ZZY396-20031015-5408-ZZY
6
McKinsey Global Institute
0.030.33
0.10
0.09
0.10
0.01
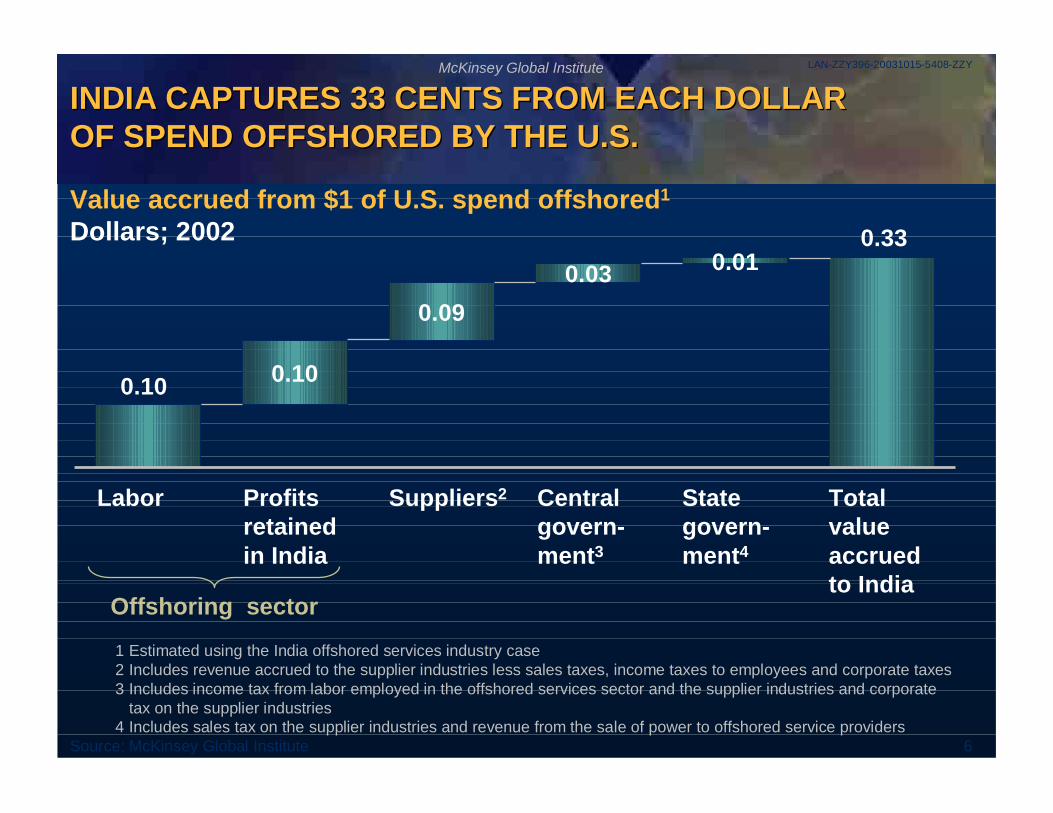
Profitsretainedin India
INDIA CAPTURES 33 CENTS FROM EACH DOLLAROF SPEND OFFSHORED BY THE U.S.INDIA CAPTURES 33 CENTS FROM EACH DOLLAROF SPEND OFFSHORED BY THE U.S.
Value accrued from $1 of U.S. spend offshored1
Dollars; 2002
Centralgovern-ment3
Stategovern-ment4
Totalvalueaccruedto India
Labor Suppliers2
Offshoring sector
1 Estimated using the India offshored services industry case2 Includes revenue accrued to the supplier industries less sales taxes, income taxes to employees and corporate taxes3 Includes income tax from labor employed in the offshored services sector and the supplier industries and corporate
tax on the supplier industries4 Includes sales tax on the supplier industries and revenue from the sale of power to offshored service providers
Source: McKinsey Global Institute
LAN-ZZY396-20031015-5408-ZZY
7
McKinsey Global Institute
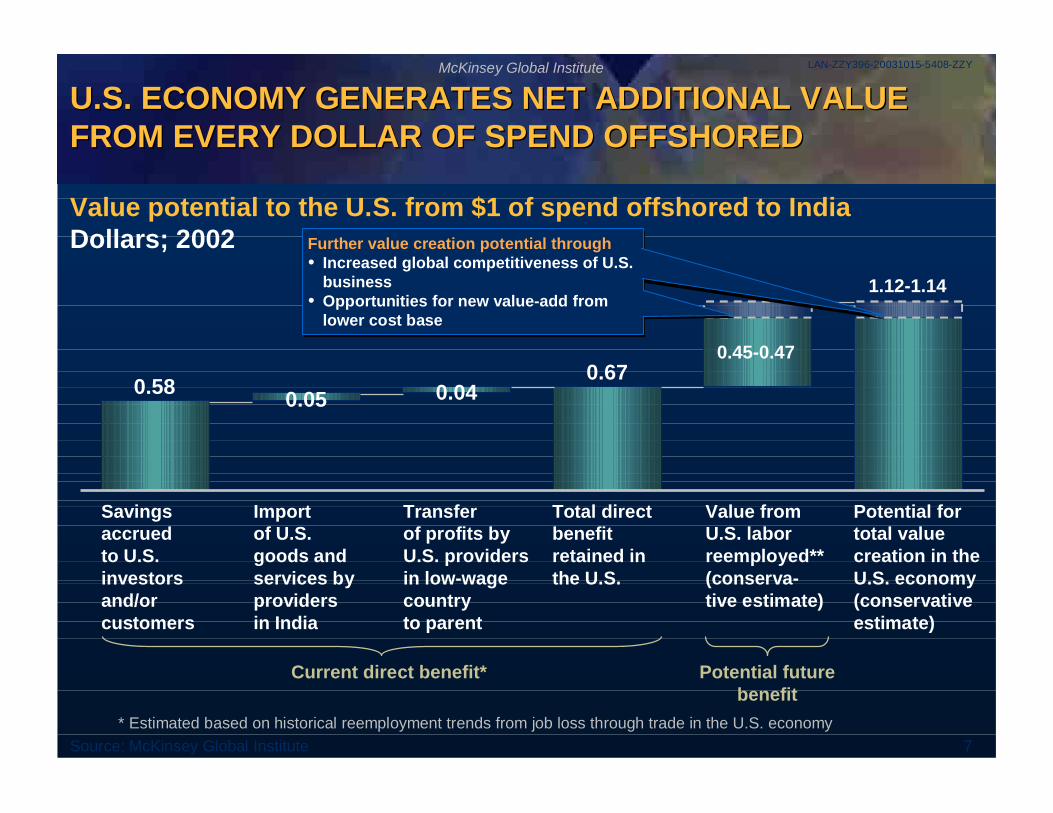
0.45-0.47
0.05 0.040.58
1.12-1.14
0.67
U.S. ECONOMY GENERATES NET ADDITIONAL VALUEFROM EVERY DOLLAR OF SPEND OFFSHOREDU.S. ECONOMY GENERATES NET ADDITIONAL VALUEFROM EVERY DOLLAR OF SPEND OFFSHORED
Savingsaccruedto U.S.investorsand/orcustomers
Importof U.S.goods andservices byprovidersin India
Transferof profits byU.S. providersin low-wagecountryto parent
Value potential to the U.S. from $1 of spend offshored to IndiaDollars; 2002
Total directbenefitretained inthe U.S.
Value fromU.S. laborreemployed**(conserva-tive estimate)
Potential fortotal valuecreation in theU.S. economy(conservativeestimate)
Current direct benefit* Potential futurebenefit
* Estimated based on historical reemployment trends from job loss through trade in the U.S. economySource: McKinsey Global Institute
Further value creation potential through• Increased global competitiveness of U.S.
business• Opportunities for new value-add from
lower cost base
Further value creation potential through• Increased global competitiveness of U.S.
business• Opportunities for new value-add from
lower cost base
LAN-ZZY396-20031015-5408-ZZY
8
McKinsey Global Institute
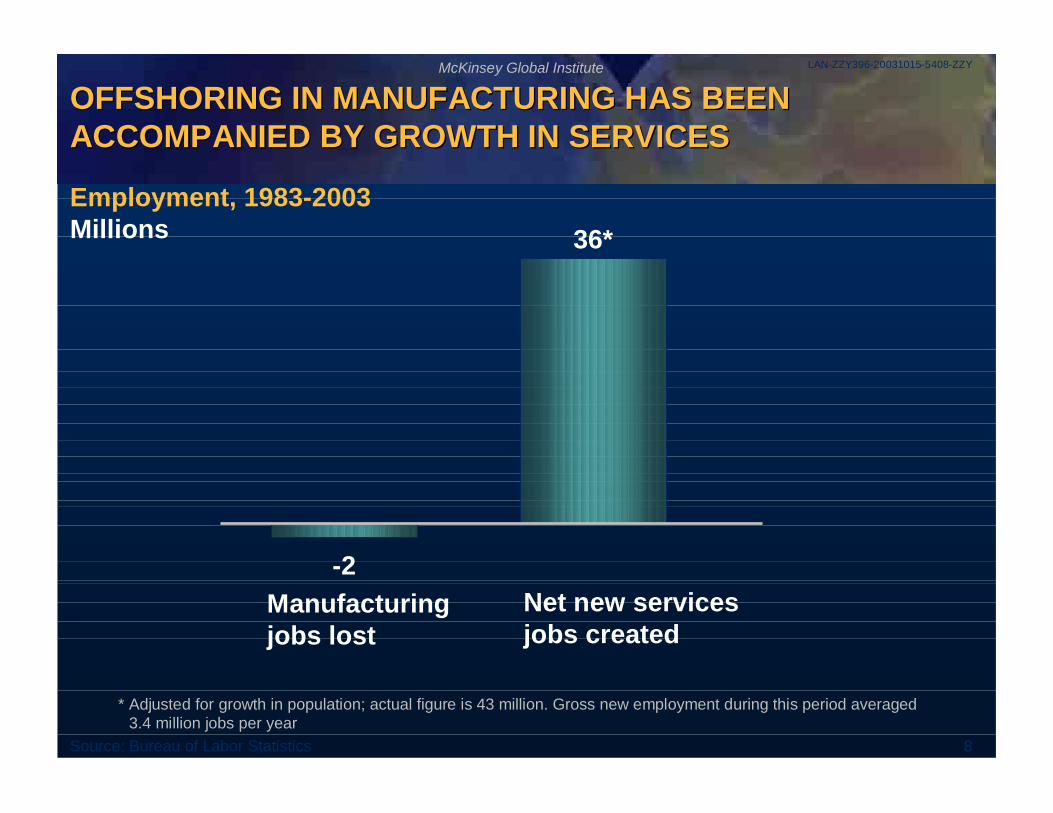
OFFSHORING IN MANUFACTURING HAS BEENACCOMPANIED BY GROWTH IN SERVICESOFFSHORING IN MANUFACTURING HAS BEENACCOMPANIED BY GROWTH IN SERVICES
* Adjusted for growth in population; actual figure is 43 million. Gross new employment during this period averaged3.4 million jobs per year
Source: Bureau of Labor Statistics
Employment, 1983-2003Millions
-2
36*
Manufacturingjobs lost
Net new servicesjobs created
LAN-ZZY396-20031015-5408-ZZY
9
McKinsey Global Institute
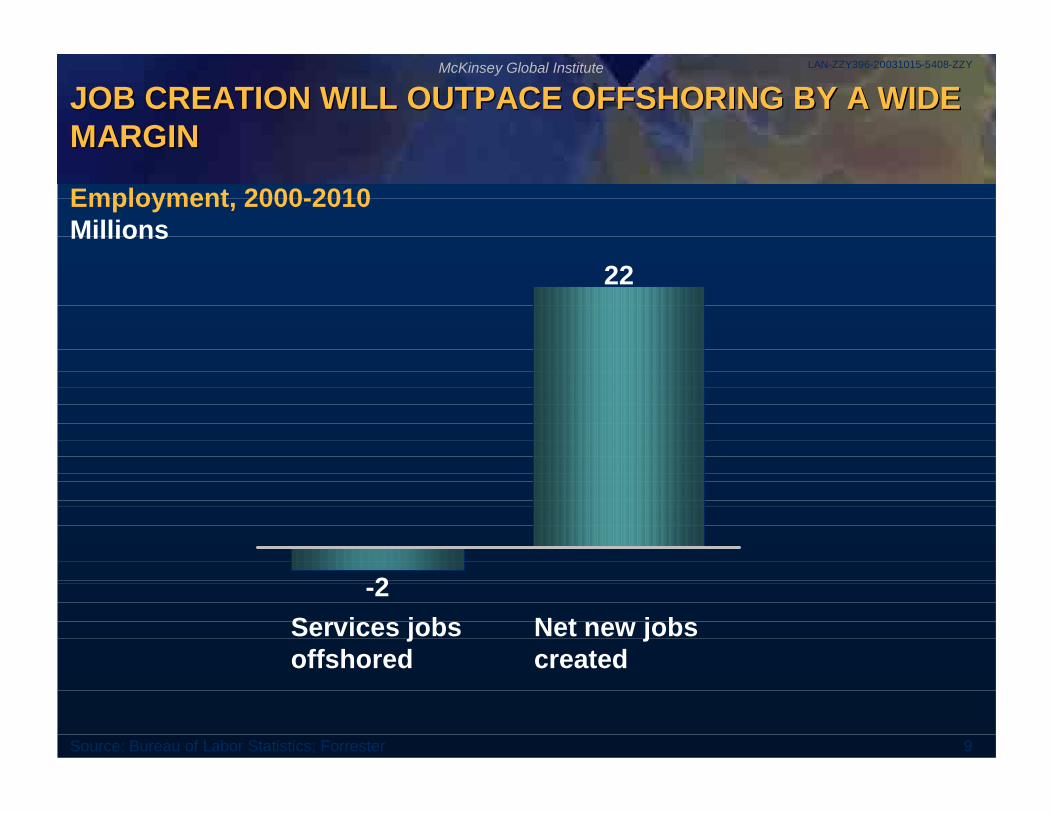
JOB CREATION WILL OUTPACE OFFSHORING BY A WIDEMARGINJOB CREATION WILL OUTPACE OFFSHORING BY A WIDEMARGIN
Source: Bureau of Labor Statistics; Forrester
22
-2
Employment, 2000-2010Millions
Services jobsoffshored
Net new jobscreated
LAN-ZZY396-20031015-5408-ZZY
10
McKinsey Global Institute
0
10
20
30
40
50
60
70
80
90
100
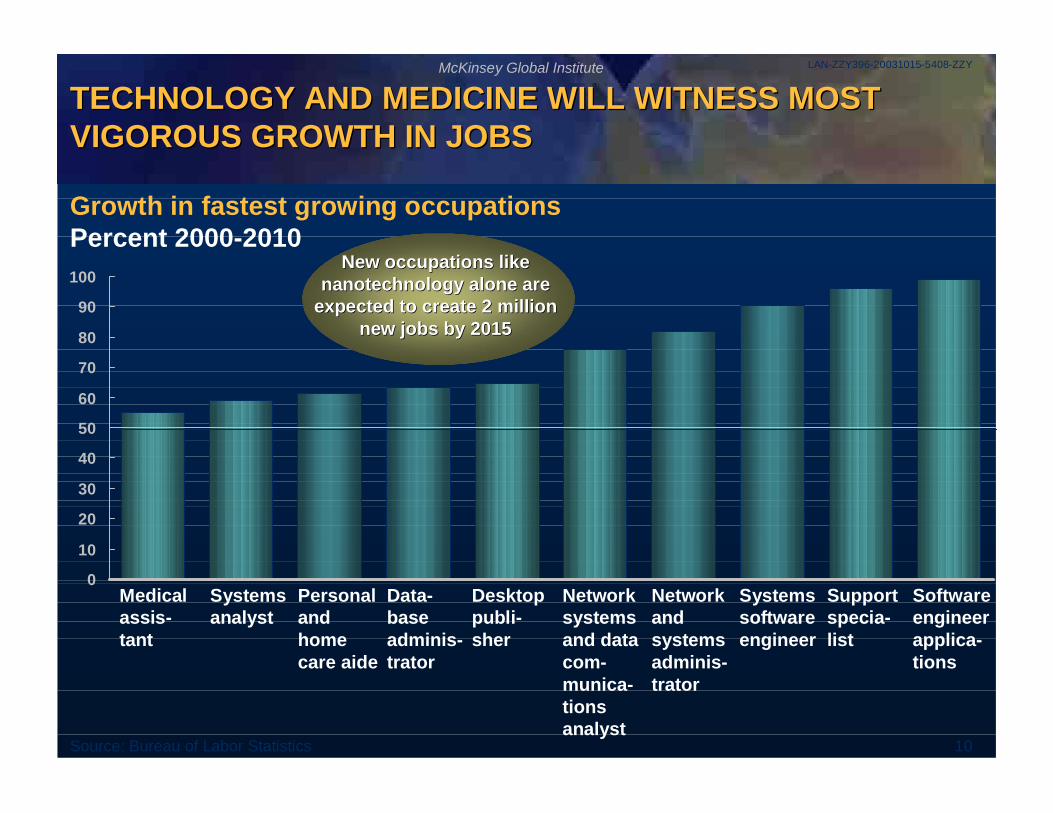
TECHNOLOGY AND MEDICINE WILL WITNESS MOSTVIGOROUS GROWTH IN JOBSTECHNOLOGY AND MEDICINE WILL WITNESS MOSTVIGOROUS GROWTH IN JOBS
Source: Bureau of Labor Statistics
Growth in fastest growing occupationsPercent 2000-2010
New occupations likeNew occupations likenanotechnology alone arenanotechnology alone are
expected to create 2expected to create 2 millionmillionnew jobs by 2015new jobs by 2015
Medicalassis-tant
Systemsanalyst
Personalandhomecare aide
Data-baseadminis-trator
Desktoppubli-sher
Networksystemsand datacom-munica-tionsanalyst
Networkandsystemsadminis-trator
Systemssoftwareengineer
Supportspecia-list
Softwareengineerapplica-tions
LAN-ZZY396-20031015-5408-ZZY
11
McKinsey Global Institute
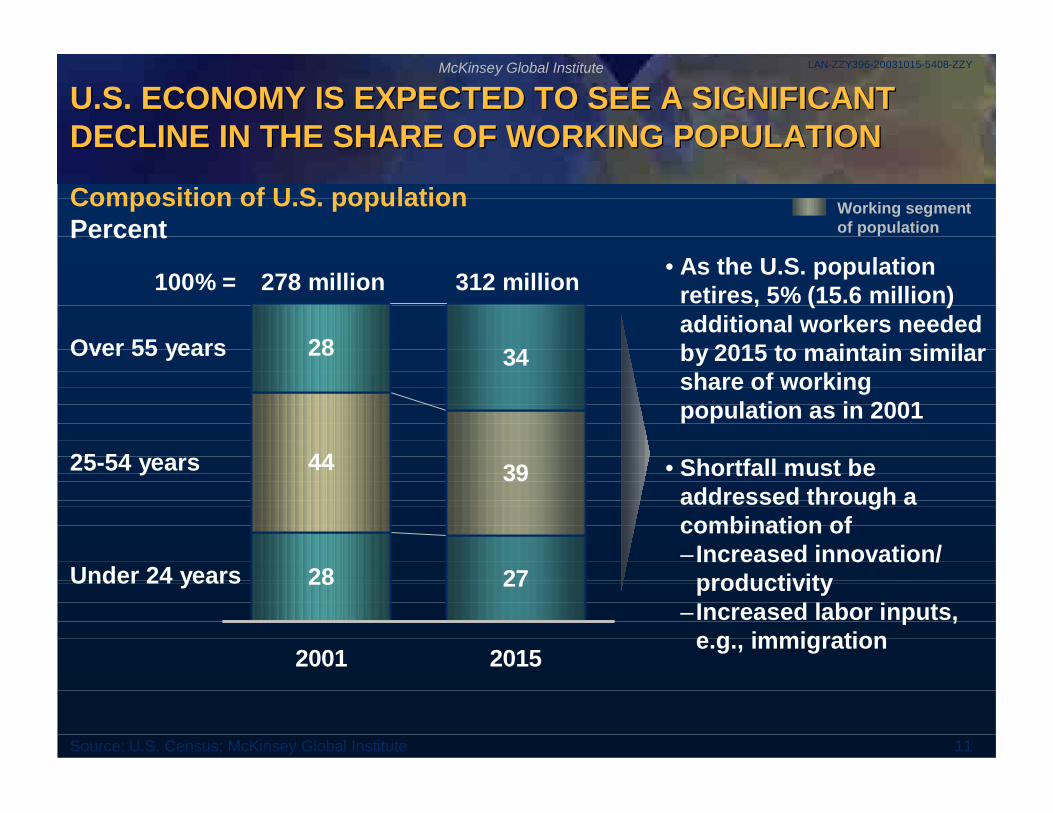
U.S. ECONOMY IS EXPECTED TO SEE A SIGNIFICANTDECLINE IN THE SHARE OF WORKING POPULATIONU.S. ECONOMY IS EXPECTED TO SEE A SIGNIFICANTDECLINE IN THE SHARE OF WORKING POPULATION
Composition of U.S. populationPercent
Source: U.S. Census; McKinsey Global Institute
28 27
44 39
28 34
2001 2015
100% = 278 million 312 million
Over 55 years
25-54 years
Under 24 years
• As the U.S. populationretires, 5% (15.6 million)additional workers neededby 2015 to maintain similarshare of workingpopulation as in 2001
• Shortfall must beaddressed through acombination of– Increased innovation/
productivity– Increased labor inputs,
e.g., immigration
Working segmentof population
LAN-ZZY396-20031015-5408-ZZY
12
McKinsey Global Institute
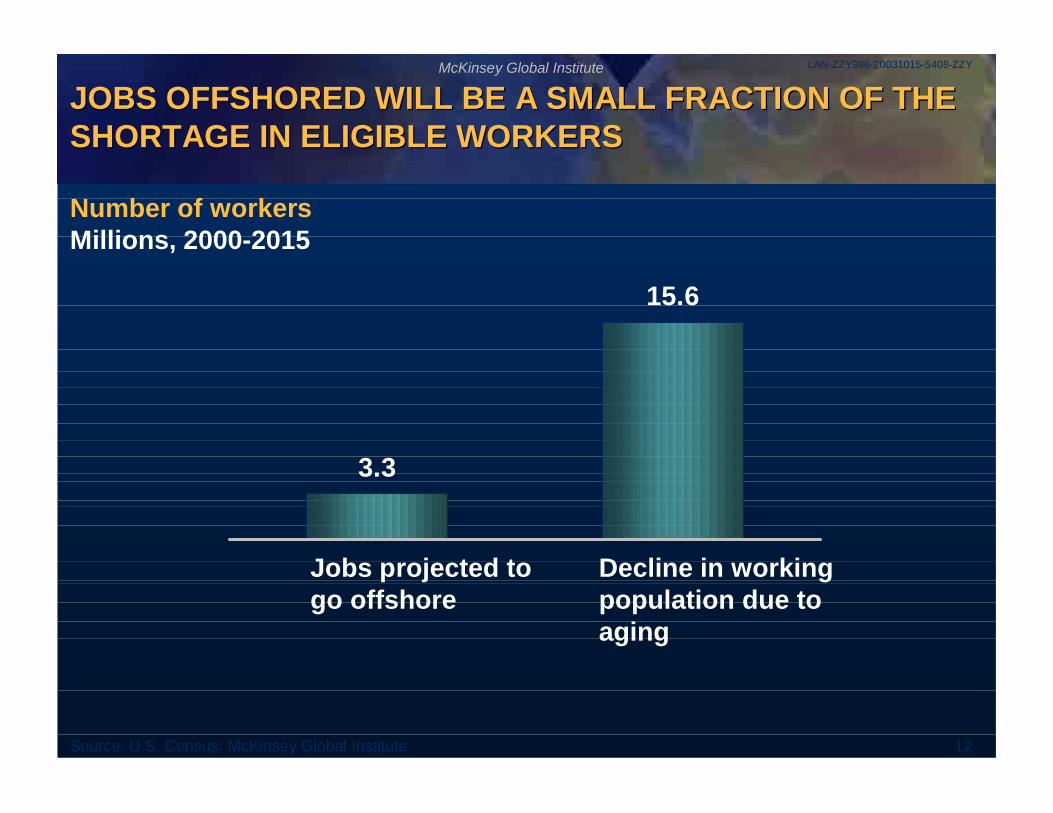
JOBS OFFSHORED WILL BE A SMALL FRACTION OF THESHORTAGE IN ELIGIBLE WORKERSJOBS OFFSHORED WILL BE A SMALL FRACTION OF THESHORTAGE IN ELIGIBLE WORKERS
Number of workersMillions, 2000-2015
Source: U.S. Census; McKinsey Global Institute
3.3
15.6
Jobs projected togo offshore
Decline in workingpopulation due toaging
LAN-ZZY396-20031015-5408-ZZY
13
McKinsey Global Institute
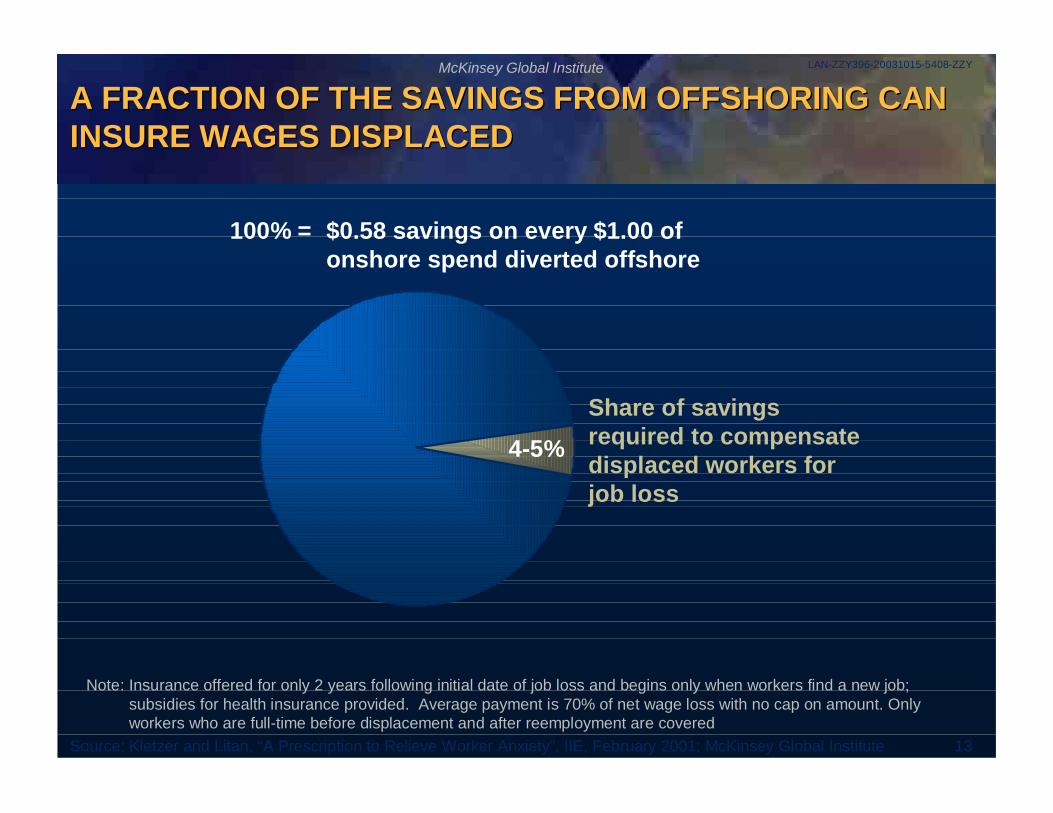
A FRACTION OF THE SAVINGS FROM OFFSHORING CANINSURE WAGES DISPLACEDA FRACTION OF THE SAVINGS FROM OFFSHORING CANINSURE WAGES DISPLACED
100% = $0.58 savings on every $1.00 ofonshore spend diverted offshore
Share of savingsrequired to compensatedisplaced workers forjob loss
4-5%
Note: Insurance offered for only 2 years following initial date of job loss and begins only when workers find a new job;subsidies for health insurance provided. Average payment is 70% of net wage loss with no cap on amount. Onlyworkers who are full-time before displacement and after reemployment are covered
Source: Kletzer and Litan, “A Prescription to Relieve Worker Anxiety”, IIE, February 2001; McKinsey Global Institute

LAN-ZZY396-20031015-5408-ZZY
McKinsey Global InstituteMcKinsey Global Institutewww.www.mckinseymckinsey.com/.com/mgimgi