who uses free trade agreements? - eria: economic research
TRANSCRIPT

ERIA-DP-2009-22
ERIA Discussion Paper Series
Who Uses Free Trade Agreements?
Kazunobu HAYAKAWA#§ Institute of Developing Economies, Japan External Trade Organization, Japan
Daisuke HIRATSUKA Institute of Developing Economies, Japan External Trade Organization, Japan
Kohei SHIINO Overseas Research Department, Japan External Trade Organization, Japan
Seiya SUKEGAWA Overseas Research Department, Japan External Trade Organization, Japan
November 2009
Abstract: It is noted that utilization of ASEAN Free Trade Agreements (FTAs) is low by international standards. In order to clarify the reasons for such low utilization, this paper investigates what kinds of Japanese affiliates in ASEAN are more likely to use FTAs in their exporting, by employing unique affiliate-level data. Our findings are as follows. First, the larger the affiliate is, or the more diversified the origins of its procurements, the more likely it is to utilize an FTA scheme in its exporting. Second, affiliates that export actively to countries with higher general tariffs are more likely to use FTAs. Third, there are clear differences in FTA utilization depending affiliates’ locations and sectors.
Keywords: FTA; micro data; ASEAN
JEL Classification: F15; F53; O53
# Corresponding author: Kazunobu Hayakawa. Address: Economic Integration Studies Group, Inter-Disciplinary Studies Center, Institute of Developing Economies, 3-2-2 Wakaba, Mihama-ku, Chiba-shi, Chiba 261-8545 Japan. Phone: 81-43-299-9754; Fax: 81-43-299-9763. E-mail: [email protected]. § This research was conducted as a part of the project of the Economic Research Institute for ASEAN and East Asia (ERIA) known as “Deepening East Asian Economic Integration.” We thank Hidehiro Ishiura and Mitsutoshi Okabe for their arrangement of the micro data used in this study. We also thank Fukunari Kimura, Archanun Kohpaiboon, Toshiyuki Matsuura, So Umezaki for their invaluable comments. The opinions expressed in this paper are the sole responsibility of the authors and do not reflect the views of ERIA or the Japan External Trade Organization.

1
1. Introduction
Free Trade Agreements (FTAs) have proliferated in East Asia. Currently, there are
more than thirty Regional Trade Agreements (RTAs) in force involving East Asia, of
which fourteen are intra-regional. Regionalism in East Asia has been led by ASEAN in
particular; the ASEAN Free Trade Area (AFTA) is an agreement that will eliminate
import duties on all products placed in the normal track in the ASEAN-6 (Brunei,
Indonesia, Malaysia, the Philippines, Singapore, and Thailand). The new member
countries, Cambodia, Laos, Myanmar, and Vietnam, will also eliminate tariffs in the
normal track by 2015. Furthermore, regionalism in the ASEAN+6 regions is
exacerbating the hub-and-spoke FTA structure with ASEAN as the hub and other East
Asian countries as the spokes.1
However, such proliferation does not automatically increase the number of
international transactions that utilize FTA schemes. In reality, all firms do not necessarily
use an FTA scheme in their exporting or importing. Administrative costs for securing
certificates of origin (COO), which certify that the exported goods were locally produced,
play a key role in firms’ choice to use FTAs. In order to secure the COO for the goods
they export, firms must prepare all documents required by the investigating authorities.
Since such document preparation is counted as fixed costs, only firms that earn operating
profits enough to cover the fixed costs will choose to use an FTA scheme. In East Asia,
the optional criterion or change in tariff classification criterion tend to be adopted as
criteria to determine the origin of goods, the so-called rules of origin (ROO).2 The
1 In this paper, FTA, RTA, and Economic Partnership Agreement (EPA) are used interchangeably. 2 There are four main types of criteria to determine the origin of goods: 1) the value-added content criterion, 2) the change in tariff classification criterion, 3) the optional criterion that allows firms a

2
“third-party certificate system” is often adopted as a procedure to certify origin; this is a
system wherein third parties such as a relevant ministry or a chamber of commerce take a
role in issuing a certificate of origin after reviewing applications filed by firms.3 In East
Asia, such ROO and procedures to certify origin result in a certain amount of fixed costs
for FTA use, discouraging firms from utilizing an FTA scheme.
Particularly in East Asia, it is noted that the rate of FTA utilization remains at a fairly
low level. Hiratsuka et al. (2008) point out that, to begin with, Japanese firms and their
affiliates operating in ASEAN are not well aware of FTAs. The utilization of AFTA
measured by the ratio of AFTA administrative records to total exports was low, at around
15% to 20%, during the period 2003-06. The utilization rate on the import side was
around 11% to 16%, lower than the corresponding rate for the export side. Furthermore,
the utilization of AFTA observed for both exports and imports is low by international
standards. Kohpaiboon (2008) pointed out that the AFTA utilization rates were lower
than those of NAFTA; the NAFTA utilization rate by Mexican exports to the United
States was around 60% in 2004-05. The utilization rate by Chilean exports to the United
States was around 55% in 2005-06 (James, 2006).
Against this backdrop, the aim of this paper is to clarify the reasons for the low rate of
FTA utilization in East Asia by investigating what kinds of Japanese affiliates in ASEAN
are more likely to use FTAs in their exporting. Indeed, such firm characteristics have
potentially important policy implication, but they remain almost unknown. From the
theoretical point of view, we can refer to one important paper, Demidova and Krishna choice of whether to use the value-added content criterion or the change in tariff classification criterion, and 4) the dual criterion which requires firms to use both the value-added content criterion and the change in tariff classification criterion. For details of each criterion, see the WTO website. 3 There are three main procedures to certify the origin of goods: 1) the third-party certificate system, 2) the self-certificate system, and 3) a hybrid system of third-party certification and self-certification. For details of each system, see the WTO website.

3
(2008). Introducing firm heterogeneity as in Melitz (2003), they demonstrate that
productive firms use an FTA scheme in their exporting, while the less productive firms
use general tariff rates because the less productive firms cannot afford to pay document
fixed costs for FTA use. Thus, firms’ productivity can be taken as one important firms’
attribute. Also on the empirical side, there are few previous studies investigating such
firms’ attributes, perhaps due to the limited data.4 Nevertheless, there are three important
trial papers. Kohpaiboon (2008) analyzed AFTA implementation by Thai exporters for
the period 2003-06, by using AFTA administrative records (collected by the Bureau of
Preferential Trade, Department of Foreign Trade, Ministry of Commerce). He found that
large conglomerate firms or firms in industries with a huge margin between general and
preferential tariff rates tend to utilize the AFTA scheme. If we take firms’ scale as a proxy
for their productivity, the former result supports the above-mentioned theoretical
proposition in Demidova and Krishna (2008) at the sector level. On the other hand,
Takahashi and Urata (2008, 2009) examine FTA usage by Japanese firms at the firm level
by employing a questionnaire survey. They found that larger firms are more likely to use
FTA schemes. Thus, the positive relationship between a firm’s productivity and its FTA
use is valid also at the firm level.
In this paper, we employ a unique dataset. The Japan External Trade Organization
(JETRO) has carried out an ongoing survey of Japanese affiliates operating in Asia for 22
years, since 1987. The survey was initially targeted at manufacturing companies, but in
the wake of the growth of the service sector, inclusion of non-manufacturing companies
began in 2007 (the 21st survey). The survey, named the “Survey of Japanese-Affiliated
Firms in ASEAN, India, and Oceania,” has included questions on the affiliates’ FTA use 4 The impact of FTA on trade is often evaluated by estimating the well-known gravity equation. See, for example, Endoh (1999) and Baier and Bergstrand (2007).

4
particularly in the last three years. For example, it asks whether or not the affiliate
currently uses any existing bilateral/multilateral FTAs or EPAs for import or export
activities. In the survey, moreover, the basic information on affiliates’ activities, such as
the breakdown of their export destinations and their procurement sources, is also
collected. Therefore, this survey enables us to explore more firm characteristics
including their scale. In addition, using the detailed firm characteristics, we can examine
firms’ choice of FTA use with the more sophisticated sample. For example, it is possible
to restrict the sample to firms which are actually exporting to FTA partner countries.
Such detailed and sophisticated analyses will contribute to the enhancement of our
understanding of the mechanics of firms’ FTA use.
The organization of this paper is as follows. Section 2 introduces our dataset and
presents an overview of Japanese affiliates’ FTA use in Asia. In Section 3, we present our
hypotheses on the relationship between firms’ characteristics and their FTA use. Our
empirical framework for examining such hypotheses is presented in Section 4. The
empirical results are reported in Section 5, and our conclusion is presented in Section 6.
2. The Utilization of FTAs by Japanese Affiliates
Employing the 22nd JETRO survey, this section introduces the usage of FTAs by
Japanese affiliates. The survey, which was sent to 5,107 Japanese affiliates operating in
thirteen countries, received 1,852 valid responses (36.3%). Of these, 1,354 were from
ASEAN7 countries (Thailand, Malaysia, Singapore, Indonesia, the Philippines, Vietnam,
and Myanmar), 235 from South Asia (India, Bangladesh, Pakistan, and Sri Lanka), and

5
263 from Oceania (Australia and New Zealand). Although our main analysis presented in
the following sections is devoted to the usage of FTAs for exporting in ASEAN, this
section also refers, for the sake of completeness, to the usage of FTAs for importing in
ASEAN. In order to ensure sufficient responses in each ASEAN country, we focus on six
ASEAN countries (Indonesia, Malaysia, the Philippines, Singapore, Thailand, and
Vietnam).
Table 1 reports Japanese affiliates’ usage rates of FTAs in their exporting and
importing by their location. Here we restrict our sample to Japanese affiliates that are
actually exporting to or importing from any countries. From this table, we can see that
22% of Japanese affiliates with export operations in ASEAN take advantage of FTAs.
This ratio is much lower than 60% in Mexican exports to the United States and 55% in
Chilean exports to the United States. Taking a closer look at FTA usage by location in
ASEAN, the highest level of FTA usage is in Singapore (35%), followed by Indonesia
(26%), and Malaysia (25%). In contrast, in the Philippines and Vietnam, the ratio is
around 10%. Turning to imports, 18% of Japanese affiliates with import operations in
ASEAN utilize FTAs for imports, slightly less than the 22% for exports. In sum, the FTA
utilization ratio in Japanese affiliates is quite low.

6
Table 1. Utilization of FTAs
Exporter Importer Use Intend No intention Use Intend No intention
to use to use to use to use ASEAN 22% 28% 50% 18% 27% 55%
Indonesia 26% 35% 39% 24% 37% 39% Malaysia 25% 21% 53% 16% 18% 66% Philippines 15% 23% 61% 10% 20% 70% Singapore 35% 22% 44% Thailand 22% 34% 44% 21% 33% 46% Vietnam 9% 28% 62% 14% 28% 59%
Source: Survey of Japanese-Affiliated Firms in ASEAN, India, and Oceania. Note: “Use” refers to the share of affiliates that are already using FTAs, “Intend to use” to the share of
affiliates that are now not using but are considering the use of FTAs, and “No intention to use” to the share of affiliates that are now not using and are not going to use FTAs. The figures in Singaporean imports are not available since the general tariff rates are already zero or quite low in Singapore.
The JETRO survey also asks firms about their reasons for not utilizing FTAs/EPAs.
The leading reason in the case of exporting is that “importers are exempted from tariffs”
(123 firms, 37.6%). Actually in many ASEAN countries, incentives to promote inbound
investment reduce or eliminate tariffs on materials or parts imported for assembly and
exported as finished products. Thus, if firms export to countries with such incentives,
they do not need to make use of FTAs/EPAs in their exporting. The second reason is that
“there are no FTAs/EPAs with the countries to which we export” (75 firms, 22.9%).5 On
the other hand, the leading reason why FTAs are neither employed nor considered in
importing is that investment incentive schemes have already eliminated tariffs, as in the
case of exporting (157 firms, 48.9%). Other reasons mentioned include “low levies on
products sold domestically” (13.4%) and “no FTAs/EPAs with the countries from which
we import” (13.1%).
5 The third reason is that “tariffs are already low in the countries to which we export” (65 firms, 19.9%). Indeed, of the 390 manufacturing firms in Asia and Oceania, the largest proportion (28.2%) state that they would consider using an FTA with a preferential tariff margin in the 3% to 5% range (according to the 22nd Survey of Japanese-Affiliated Firms in ASEAN, India, and Oceania).
7
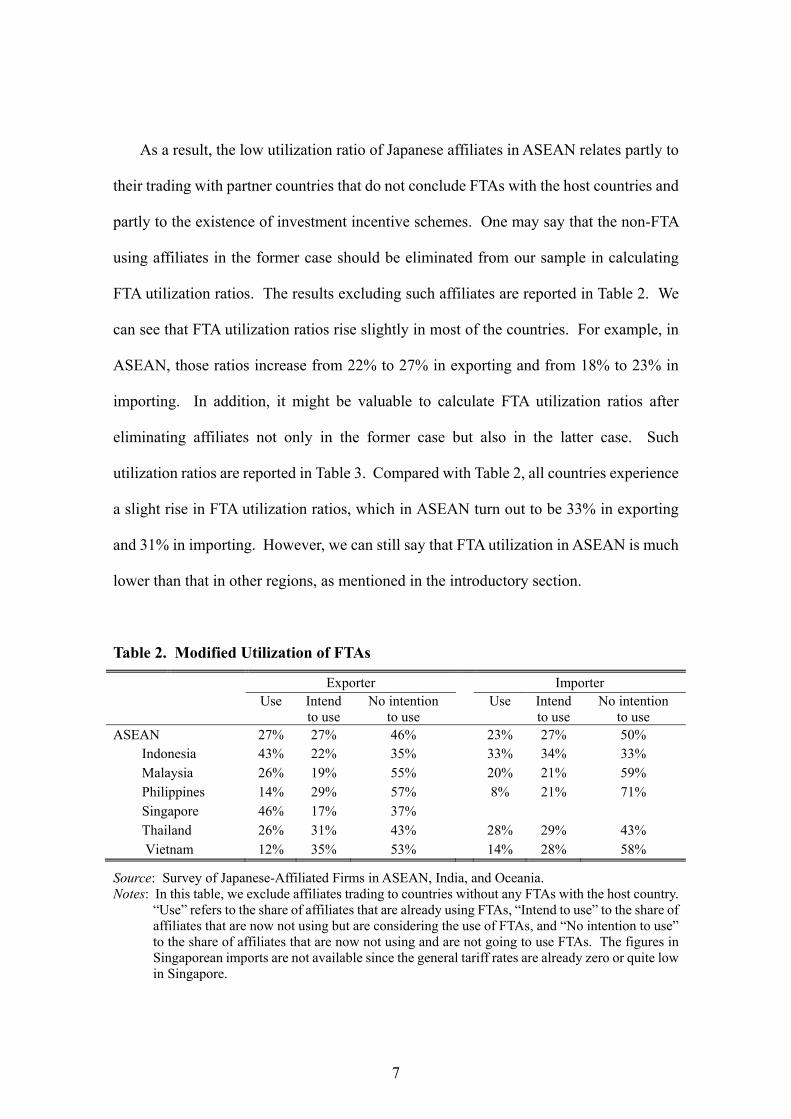
As a result, the low utilization ratio of Japanese affiliates in ASEAN relates partly to
their trading with partner countries that do not conclude FTAs with the host countries and
partly to the existence of investment incentive schemes. One may say that the non-FTA
using affiliates in the former case should be eliminated from our sample in calculating
FTA utilization ratios. The results excluding such affiliates are reported in Table 2. We
can see that FTA utilization ratios rise slightly in most of the countries. For example, in
ASEAN, those ratios increase from 22% to 27% in exporting and from 18% to 23% in
importing. In addition, it might be valuable to calculate FTA utilization ratios after
eliminating affiliates not only in the former case but also in the latter case. Such
utilization ratios are reported in Table 3. Compared with Table 2, all countries experience
a slight rise in FTA utilization ratios, which in ASEAN turn out to be 33% in exporting
and 31% in importing. However, we can still say that FTA utilization in ASEAN is much
lower than that in other regions, as mentioned in the introductory section.
Table 2. Modified Utilization of FTAs
Exporter Importer Use Intend No intention Use Intend No intention
to use to use to use to use ASEAN 27% 27% 46% 23% 27% 50%
Indonesia 43% 22% 35% 33% 34% 33% Malaysia 26% 19% 55% 20% 21% 59% Philippines 14% 29% 57% 8% 21% 71% Singapore 46% 17% 37% Thailand 26% 31% 43% 28% 29% 43% Vietnam 12% 35% 53% 14% 28% 58%
Source: Survey of Japanese-Affiliated Firms in ASEAN, India, and Oceania. Notes: In this table, we exclude affiliates trading to countries without any FTAs with the host country.
“Use” refers to the share of affiliates that are already using FTAs, “Intend to use” to the share of affiliates that are now not using but are considering the use of FTAs, and “No intention to use” to the share of affiliates that are now not using and are not going to use FTAs. The figures in Singaporean imports are not available since the general tariff rates are already zero or quite low in Singapore.

8
Table 3. Further Modified Utilization of FTAs
Exporter Importer Use Intend No intention Use Intend No intention
to use to use to use to use ASEAN 33% 33% 33% 31% 37% 32%
Indonesia 50% 26% 24% 38% 39% 24% Malaysia 38% 28% 34% 28% 29% 43% Philippines 18% 36% 45% 15% 39% 46% Singapore 54% 20% 26% Thailand 31% 36% 33% 37% 39% 24% Vietnam 16% 46% 38% 23% 46% 31%
Source: Survey of Japanese-Affiliated Firms in ASEAN, India, and Oceania. Notes: In this table, we further exclude importers enjoying investment incentive schemes or exporters
of which trading partners enjoy such schemes. “Use” refers to the share of affiliates that are already using FTAs, “Intend to use” to the share of affiliates that are now not using but are considering the use of FTAs, and “No intention to use” to the share of affiliates that are now not using and are not going to use FTAs. The figures in Singaporean imports are not available since the general tariff rates are already zero or quite low in Singapore.
3. Hypotheses
This section presents our hypotheses, which are empirically tested in the following
sections, on what kinds of firms use an FTA scheme in their exporting. For firms to use
an FTA in exporting, the total profit (= operating profit minus fixed costs) from using the
FTA must be greater than that from not using it. If firms choose to use an FTA scheme,
then they can export their products with the FTA preferential tariff rates, which are
mostly zero percent. Otherwise, they must pay the general tariff rates, which are mostly
most-favored nation rates (MFN rates). Use of the FTA scheme, however, will incur a
certain level of administrative cost as mentioned in the introductory section, which
becomes an additional fixed cost for the firms. Therefore, for firms to use FTAs, it is

9
necessary that the difference in the operating profit using FTA rates and operating profit
using general tariff rates is greater than the fixed costs of FTA use.
This argument leads immediately to that the larger the difference between FTA rates
and general tariff rates, the larger the difference in the operating profits from using them.
Since the FTA preferential rates are mostly zero, it might be simply said that the higher
the general tariff rates, the larger the difference in the operating profit. As a result, we
have the following testable hypothesis:
Hypothesis 1. Firms that export to countries with lower general tariff rates are less
likely to use FTAs.
The empirical validity of this hypothesis is just confirmed by Kohpaiboon (2008) at
the sector level.
On the other hand, even if the tariff margin between them is not so large, the larger
the volume of exports, the larger the difference in the operating profit per se would be.
This implies that any elements affecting a firm’s volume of exports and thus its volume of
outputs are also important. For example, since lower wages lead to larger outputs, firms
in countries with low wages can obtain a greater difference in the operating profit
between two tariff rates and are likely to cover fixed costs for FTA use. Particularly in
this paper, we examine the following two firm specific elements.
The first one is firms’ productivity. As mentioned in Section 1, it is expected that the
more productive firms are more likely to use FTAs in their exporting (Demidova and
Krishna, 2008). Also in our context, since a firm’s outputs are increasing in proportion to
its productivity, the difference in the operating profit between FTA rates and general
tariff rates is positively related to the firm’s productivity. Therefore, firms with higher

10
productivity can afford to pay administrative costs and are thus more likely to use an FTA
scheme. As a result, the testable hypothesis on productivity can be summarized as:
Hypothesis 2. The more productive firms are more likely to use FTAs in their
exporting.
The second element sheds light on a firm’s diversity in its sources of procurements.
The hypothesis is summarized as:
Hypothesis 3. The more diversified the origins of firms’ procurements are, the more
likely the firms are to use FTAs in their exporting.
This is the well-known love-of-variety nature in the procurement of intermediate
products. Suppose that intermediate products are differentiated, and further, that firms
prefer more varieties of intermediate products, as in the usual new trade theory; the more
diversified origins of firms’ procurements lowers their input costs, resulting in a larger
volume of output. In addition to this benefit from the horizontal nature of procurement,
its diversified origins may yield benefits from vertical division of labor, i.e., international
fragmentation.6 That is, input costs are lowered by sourcing each intermediate product
from a country with location advantages in producing it. In sum, the more diversified the
origins of firms’ procurements are, the larger their outputs/exports are, and thus the larger
the difference in the operating profit between FTA rates and general rates.
However, more diversified origins might substantially raise the administrative costs
for FTA use. In certifying that the exported goods were locally produced, exporters must
prepare a list of materials inputted for producing them. To complete the list, exporters
6 For a theoretical analysis of international fragmentation, see Arndt and Kierzkowski (2001). For an empirical investigation on fragmentation in East Asia, see Kimura (2006).

11
need to request each materials supplier to issue an invoice or contract documents. Thus,
higher document preparation costs are obviously entailed in sourcing materials from a
larger number of suppliers. In other words, more highly diversified origins of
procurements lead to larger fixed costs for FTA use. As a result, if the effect of increase
of the difference in the operating profit between two tariffs is greater than the effect of a
rise of fixed costs, a firm’s diversity in the sources of procurement encourages it to utilize
an FTA scheme. In the sense that the diversity of procurement origins has conflicting
effects on firm’s choice of FTA use, its empirical examination becomes important.
4. Empirical Framework
This section explains the methodology used to investigate the three hypotheses
presented in the previous section. The source of our data for estimation, as noted in
Section 2, is the “Survey of Japanese-Affiliated Firms in ASEAN, India, and Oceania” for
2006, 2007, and 2008. We again focus on Japanese affiliates in six ASEAN countries
(Indonesia, Malaysia, the Philippines, Singapore, Thailand, and Vietnam). We restrict
our sample only to exporting affiliates because affiliates are unable to use FTA if they do
not export.7
For our empirical analysis, we specify our index function as:
Γi = xi’β0 + εi, where εi ~ N(0, 1) and xi = (Exporti, Scalei, Variancei).
Γi is the difference in affiliate i’s total profits when comparing cases of FTA use and
7 We also conduct some data cleaning. For example, we eliminate observations in which the sum of export shares plus the share of the supply to the local market exceeds 100%.

12
non-use (a time script is omitted). The observation rule for affiliate i is formalized as:
01
00
i
i
iif
ify
,
where yj is an indicator variable taking unity if affiliate j uses an FTA scheme in exporting
and zero otherwise. As a result, our probability model by the probit is given by:
Pr (yi =1| xi) = Φ (xi’β),
where Φ(•) is the standard cumulative normal probability distribution. From our sample,
we exclude the affiliates that answered “considering use” for the data item of FTA use in
exporting because of their ambiguous standpoint in the choice of FTA use.
We introduce three kinds of affiliate characteristic variables. First, we examine the
impact of the margin between FTA and general tariff rates in the countries to which
affiliates export their products (Hypothesis 1). To this end, three kinds of FTAs in which
a significant number of ASEAN countries are included as members are taken into
consideration: AFTA, ASEAN-China FTA, and bilateral FTAs with Japan. Specifically,
we introduce an Export vector, of which the elements are an export share to the other
ASEAN countries (ExASEAN), that to China (ExCHINA), and that to Japan (ExJAPAN),
in total sales. All other things being equal, as argued in the previous section, the larger
exports to any countries with FTAs with host countries always increase the difference in
the operating profit between FTA and general tariff rates. Thus, three share variables are
expected to be significantly positive. However, the magnitude of the coefficients would
differ according to differences in general tariff rates among ASEAN, China, and Japan.
For example, since general tariff rates are already low in Japan and still high in China,
affiliates exporting mainly to Japan would be less likely to use an FTA scheme than those

13
exporting to China. As a result, the magnitude of the coefficients in descending order is
expected to be ExCHINA, ExASEAN, and ExJAPAN.
Second, we examine Hypothesis 2 by introducing Scalei, which is a log of total
employment. Our dataset does not have any convincing productivity measures, e.g.,
Total Factor Productivity (TFP) or labor productivity. From the theoretical point of view,
firms’ productivity is not necessarily related positively to their employment; however,
from the empirical point of view, the productivity (TFP) usually has a positive correlation
with the total employment (see, for example, Fukao and Kwon, 2006). Thus, the use of
employment as a proxy for productivity may be plausible to some extent. As a result, the
larger the affiliates’ scale, the more likely they would be to utilize an FTA scheme.
Next, in order to explore Hypothesis 3, we introduce Concentrationi, which captures
the concentration of sources of intermediate inputs. Our dataset has the shares of local
procurement, imports from other ASEAN countries, imports from Japan, imports from
other Asian countries excluding ASEAN and Japan, imports from the US, imports from
Europe, and imports from other countries. The variable Concentrationi is constructed as a
variance among the above seven shares. The lower the Concentrationi, the more
diversified the sources of intermediate inputs. Thus, if the love-of-variety nature of
intermediate products and the benefits from vertical division of labor reduce affiliates’
input costs greatly, the coefficient for Concentrationi would be expected to be
significantly negative.8 On the other hand, if the diversified sources of inputs result in a
remarkable rise in the administrative costs for FTA use, its coefficient may be estimated
to be positive.
So far, we have not taken care of the ROO explicitly. As mentioned before, for the
8 As mentioned in Section 1, since the change in tariff classification is available as ROO in East Asia, firms do not necessarily need to source a significant share of total inputs from local producers.

14
sake of FTA use, affiliates must secure the ROO of their goods. In order to control the
extent of restrictiveness of ROO, we introduce both country fixed effects and sector fixed
effects because the ROO differs according not only to FTAs but also to sectors. Several
other elements are also controlled by such fixed effects, such as differences in wages
among countries, which affect firms’ operating profits. The differences in efficiency in
obtaining the COO among countries are also captured by the estimates of the fixed effects.
Moreover, those may include the differences in general tariff rates among sectors.
5. Empirical Results
In this section, we report the results of our empirical analyses. Basic statistics are
provided in Table 4, and our probit results are presented in Table 5. The column (I) in
Table 5 shows our baseline result (marginal effects), which is basically consistent with
our expectations.
Table 4. Basic Statistics
Variable Obs Mean Std. Dev. Min Max FTA 872 0.282 0.450 0 1 Scale 872 5.349 1.426 1.099 11.608 Concentration 872 0.060 0.028 0.007 0.109 ExASEAN 872 0.129 0.206 0 1 ExCHINA 872 0.032 0.103 0 1 ExJAPAN 872 0.265 0.347 0 1

15
Table 5. Probit Results
(I) (II) Scale 0.056*** 0.169***
[0.013] [0.040]
Concentration -2.309*** -7.420*** [0.610] [1.942]
ExASEAN 0.195** 0.632** [0.080] [0.251]
ExCHINA 0.324** 1.018** [0.139] [0.437]
ExJAPAN 0.111* 0.384** [0.056] [0.178]
Year Dummy YES YES Sector Dummy YES YES Country Dummy YES YES Observations 872 494 Log Pseudo-likelihood -296 -449 Pseudo R2 0.1343 0.1311
Notes: In this table, the marginal effects of the regressors are reported. ***, **, and * indicate 1%, 5%, and 10% significance, respectively. Figures in parentheses represent the White consistent standard error. In column (II), the sample is restricted to affiliates with positive exports to other ASEAN countries or China, affiliates in Singapore and Malaysia with positive exports to Japan, and affiliates in Thailand and Indonesia with positive exports to Japan in 2008. Furthermore, we drop affiliates who answered “importers are exempted from tariffs” as “reasons for not using FTAs.”
There are three points that are noteworthy. First, as demonstrated in Demidova and
Krishna (2008), the coefficient for Scale is estimated to be significantly positive,
indicating that the larger the affiliate, the more likely it is to utilize an FTA scheme in its
exporting. This result is also consistent with that in Takahashi and Urata (2008, 2009).
Second, the coefficient for Concentration is estimated to be significantly negative,
showing that benefits from the love-of-variety in inputs, and/or from vertical division of
labor, exceed the rise in the administrative costs due to the diversity of procurement
origins. In particular, it is interesting that firms which are actively engaged in
international fragmentation are likely to use an FTA scheme in their exporting. Third,
coefficients for export shares are all estimated to be positively significant and show an

16
expected order in their magnitude. The largest magnitude can be found in the coefficient
for ExCHINA, while the lowest magnitude in that for ExJAPAN. Thus, affiliates that
export actively to countries with higher general tariffs are more likely to use FTAs. This
result is consistent with what Kohpaiboon (2008) confirmed at the sector level.
The results of fixed effects in the estimation of column (I) might be worth reporting
particularly for policy makers. Column (I) in Table 6 reports the results of country fixed
effects. We find that affiliates in the Philippines and Vietnam are less likely to utilize FTA
schemes, while the most active use of FTA is found in affiliates in Singapore. Due to the
fact that Singapore provides the most efficient procedures for obtaining the COO, these
results might suggest that such procedures in the Philippines and Vietnam are more
cumbersome than those in other ASEAN countries.9 The results of sector fixed effects
are reported in column (I) in Table 7. From this table, we can see that FTAs are less likely
to be utilized in electric parts and components and precision machinery. This result is
most likely due to the low general tariff rates in those sectors. Indeed, the general tariff
rates for most IT products are low or zero under the Information Technology Agreement
(ITA).
Table 6. Results of Country Dummy: Thailand as a Base
(I) (II) Coef. Robust Coef. Robust
S.E. S.E. Malaysia 0.052 [0.145] 0.114 [0.174] Singapore 0.490** [0.193] 0.314 [0.221] Indonesia 0.026 [0.161] 0.15 [0.202] Philippines -0.548*** [0.160] -0.396* [0.220] Vietnam -0.670*** [0.255] -0.329 [0.341]
Note: ***, **, and * indicate 1%, 5%, and 10% significance, respectively.
9 Also, this may reflect only the availability of FTA schemes for affiliates. Indeed, Singapore has concluded the largest number of FTAs among ASEAN countries, while there are relatively few FTAs in the Philippines and Vietnam compared with other ASEAN countries in the sample.

17
Table 7. Results of Sector Dummy: Food Sector as a Base
(I) (II) Coef. Robust Coef. Robust
S.E. S.E.
Wearing apparel 0.641 [0.440] 0.875 [0.605] Wood products 0.125 [0.470] 0.101 [0.529] Furniture -0.954 [0.626] Paper products -0.308 [0.563] 0.318 [0.788] Chemicals -0.17 [0.285] 0.108 [0.313] Petroleum products 0.575 [0.556] 1.090* [0.635] Plastic products -0.462 [0.306] -0.192 [0.344] Rubber products -0.232 [0.347] -0.058 [0.397] Glass and glass products -0.303 [0.376] -0.312 [0.419] Basic iron and steel -0.337 [0.344] 0.073 [0.382] Non-ferrous metals -0.139 [0.326] 0.381 [0.385] Metal products -0.369 [0.290] -0.005 [0.329] General machinery -0.368 [0.342] 0.001 [0.394] Electric machinery -0.363 [0.278] -0.092 [0.311] Electric parts -0.938*** [0.297] -0.681** [0.332] Automobile 0.646 [0.425] 1.177** [0.541] Automobile parts 0.314 [0.276] 0.718** [0.317] Precision machinery -0.889* [0.524] -0.753 [0.569] Others -0.459* [0.271] -0.151 [0.302]
Note: ***, **, and * show 1%, 5%, and 10% significance, respectively.
We conduct one important robustness check. As mentioned before, affiliates should
be excluded if they do not export to countries that conclude FTAs with their host countries.
Here, we again pay attention only to three kinds of FTAs; AFTA, ASEAN-China FTA,
and bilateral FTAs with Japan. Specifically, we restrict our sample only to affiliates with
positive exports to other ASEAN countries or China. Furthermore, affiliates in Singapore
and Malaysia are also included if they export to Japan. Affiliates in Thailand and
Indonesia are not excluded if they have positive exports to Japan in 2008.10 We further
10 The reason for not using FTAs/EPAs, “there are no FTAs/EPAs with the countries to which we export”, is available only in 2008. Since, unlike Section 2, our sample years include 2006 and 2007, we cannot use this information for restricting our sample to affiliates exporting to countries with FTAs with their host countries.

18
take care of investment incentive schemes. As mentioned in Section 2, the major reason
for not utilizing FTAs in ASEAN is that “importers are exempted from tariffs” (37.6%).
If affiliates’ trading partners enjoy investment incentive schemes, such affiliates do not
need to use FTAs in their exporting. Thus, such affiliates are dropped from our sample for
the analysis of the exporters’ choice of FTA use. To this end, we use the data item on
“reasons for not using FTAs,” and we drop affiliates that answered “tariffs are exempted
in the importer side” for that item.
The result is reported in column (II). From Table 5, we can see that the results on our
hypotheses remain unchanged. The results of fixed effects are reported in the
corresponding columns in Tables 6 and 7. Two points are noteworthy here. First, there is
the robust result that affiliates in the Philippines are less likely to use an FTA scheme.
Second, coefficients for automobile sectors turn out to be significant. This change may
indicate that active use of investment incentive schemes in ASEAN leads to the
underestimation of the fixed effect’s estimate in those sectors.
6. Concluding Remarks
It is noted that utilization of AFTA is low by international standards. In order to
clarify the reasons for such low utilization, this paper investigates what kinds of Japanese
affiliates in ASEAN are more likely to use FTAs in their exporting. For this purpose, we
employ a unique dataset from a survey of Japanese affiliates operating in Asia conducted
by the Japan External Trade Organization. Our findings are as follow. First, the larger the
affiliate is, or the more diversified the origins of its procurements, the more likely it is to

19
utilize an FTA scheme in its exporting. Second, affiliates that export actively to countries
with higher general tariffs are more likely to use FTAs. Third, there are clear differences
in FTA utilization depending affiliates’ locations and sectors.
These results suggest some reasons why FTA utilization in East Asia is low by
international standards. The first reason is the active use of investment incentive schemes
in ASEAN. Enjoying such schemes, firms do not need to use FTA schemes in order to
trade at zero tariff rates. The second is the fact that the major trade in ASEAN is in the
electrical machinery industry, in which general tariff rates are already low. According to
the World Trade Atlas database, in our six ASEAN countries, the share of electrical
machinery exports to the world in total exports was near 30% during 2006-2008. Almost
the same share can also be observed in the case of imports. The last reason is the
existence of fixed costs, for example the administrative costs due to the cumbersome
procedures for obtaining a COO. The significant results in Scale and Concentration
imply the existence of a certain level of such fixed costs. If fixed costs are high in
ASEAN compared to other regions, this would constitute a reason for low utilization of
FTAs.

20
References
Arndt, S. W. and H. Kierzkowski (2001), “Fragmentation: New Production Patterns in the
World Economy”. Oxford University Press, Oxford.
Baier, S.L. and Bergstrand, J.H. (2007), “Do Free Trade Agreements Actually Increase
Members’ International Trade?”, Journal of International Economics, 71(1):
72-95.
Demidova, S. and Krishna, K. (2008), “Firm Heterogeneity and Firm Behavior with
Conditional Policies”, Economics Letters, 98: 122-128.
Endoh, M. (1999), “Trade Creation and Trade Diversion in the EEC, the LAFTA and the
CMEA: 1960-1994”, Applied Economics, 31(2): 207-216.
Fukao, K. and Kwon, H. (2006), “Why Did Japan’s Tfp Growth Slow Down in the Lost
Decade? An Empirical Analysis Based on Firm-Level Data of Manufacturing
Firms”, Japanese Economic Review, 57(2): 195-228.
Hiratsuka, D., Isono, I., Sato, H., and Umezaki, S. (2008), “Escaping from FTA Trap and
Spaghetti Bowl Problem in East Asia: An Insight from the Enterprise Survey in
Japan, In: Soesastro, H. (Eds.)”. Deepening Economic Integration in East Asia:
The ASEAN Economic Community and Beyond, ERIA Research Project Report
2007 No. 1-2, Chapter 16.
James, W. (2006), “Rules of Origin in Emerging Asia-Pacific Preferential Trade
Agreements: Will PTAs Promote Trade and Development”, Asia-Pacific
Research and Training Network on Trade Working Paper Series, No.19.
Kimura, F. (2006), “International Production and Distribution Networks in East Asia:
Eighteen Facts, Mechanics, and Policy Implication”, Asian Economic Policy
Review, 1: 326–44.
Kohpaiboon, A. (2008), “Export Creation of AFTA and the Response of the Private
Sector: Evidence from Thai Manufacturing”, mimeograph.
Melitz, M. (2003), “The Impact of Trade on Intraindustry Reallocations and Aggregate
Industry Productivity”, Econometrica, 71: 1695-1725.
Takahashi, K. and Urata, S. (2008), “On the Use of FTAs by Japanese Firms”, RIETI
Discussion Paper, 08-E-002.
Takahashi, K. and Urata, S. (2009), “On the Use of FTAs by Japanese Firms: Further
Evidence”, RIETI Discussion Paper, 09-E-028.

21
ERIA Discussion Paper Series
No. Author(s) Title Year
2009-22
Kazunobu HAYAKAWA, Daisuke HIRATSUKA, Kohei SHIINO, and
Seiya SUKEGAWA
Who Uses Free Trade Agreements? Nov 2009
2009-21 Ayako OBASHI Resiliency of Production Networks in Asia:
Evidence from the Asian Crisis Oct
2009
2009-20 Mitsuyo ANDO and Fukunari KIMURA
Fragmentation in East Asia: Further Evidence Oct
2009
2009-19 Xunpeng SHI The Prospects for Coal: Global Experience and Implications for Energy Policy
Sept 2009
2009-18 Sothea OUM Income Distribution and Poverty in a CGE Framework: A Proposed Methodology
Jun 2009
2009-17 Erlinda M. MEDALLA and Jenny BALBOA
ASEAN Rules of Origin:
Lessons and Recommendations for the Best Practice
Jun 2009
2009-16 Masami ISHIDA Special Economic Zones and Economic Corridors Jun
2009
2009-15 Toshihiro KUDO Border Area Development in the GMS:
Turning the Periphery into the Center of Growth
May 2009
2009-14 Claire HOLLWEG and Marn-Heong WONG
Measuring Regulatory Restrictions in Logistics Services
Apr 2009
2009-13 Loreli C. De DIOS Business View on Trade Facilitation Apr 2009
2009-12 Patricia SOURDIN and Richard POMFRET
Monitoring Trade Costs in Southeast Asia Apr 2009
2009-11 Philippa DEE and
Huong DINH
Barriers to Trade in Health and Financial Services in ASEAN
Apr 2009
2009-10 Sayuri SHIRAI The Impact of the US Subprime Mortgage Crisis on the World and East Asia: Through Analyses of Cross-border Capital Movements
Apr 2009
2009-09 Mitsuyo ANDO and
Akie IRIYAMA
International Production Networks and Export/Import Responsiveness to Exchange Rates: The Case of Japanese Manufacturing Firms
Mar 2009

22
2009-08 Archanun KOHPAIBOON Vertical and Horizontal FDI Technology Spillovers: Evidence from Thai Manufacturing
Mar 2009
2009-07 Kazunobu HAYAKAWA, Fukunari KIMURA, and Toshiyuki MATSUURA
Gains from Fragmentation at the Firm Level:
Evidence from Japanese Multinationals in East Asia
Mar 2009
2009-06 Dionisius A. NARJOKO Plant Entry in a More Liberalised Industrialisation Process: An Experience of Indonesian Manufacturing during the 1990s
Mar 2009
2009-05 Kazunobu HAYAKAWA, Fukunari KIMURA, and Tomohiro MACHIKITA
Firm-level Analysis of Globalization: A Survey Mar 2009
2009-04 Chin Hee HAHN and Chang-Gyun PARK
Learning-by-exporting in Korean Manufacturing:
A Plant-level Analysis
Mar 2009
2009-03 Ayako OBASHI Stability of Production Networks in East Asia: Duration and Survival of Trade
Mar 2009
2009-02 Fukunari KIMURA The Spatial Structure of Production/Distribution Networks and Its Implication for Technology Transfers and Spillovers
Mar 2009
2009-01 Fukunari KIMURA and Ayako OBASHI
International Production Networks:
Comparison between China and ASEAN
Jan 2009
2008-03 Kazunobu HAYAKAWA and Fukunari KIMURA
The Effect of Exchange Rate Volatility on International Trade in East Asia
Dec 2008
2008-02
Satoru KUMAGAI, Toshitaka GOKAN, Ikumo ISONO, and Souknilanh KEOLA
Predicting Long-Term Effects of Infrastructure Development Projects in Continental South East Asia: IDE Geographical Simulation Model
Dec 2008
2008-01 Kazunobu HAYAKAWA, Fukunari KIMURA, and Tomohiro MACHIKITA
Firm-level Analysis of Globalization: A Survey Dec 2008