who on earth cares about water ? j. feyen faculty of agricultural and applied biological sciences...
TRANSCRIPT

Who on earth cares about water ?Who on earth cares about water ?
J. Feyen
Faculty of Agricultural and Applied Biological SciencesDepartment of Land Management, Leuven, Belgium

Water, a most precious resource !
• Those confronted with excess, i.e. either too much or too little are for sure concerned. Those not ….. do not care at all, unless …. a few by profession!
• How much cost water? (in Belgium total cost is equal to 0.25 to 2.5% of net family income)
• When the well is dry, we know the worth of water (Benjamin Franklin)
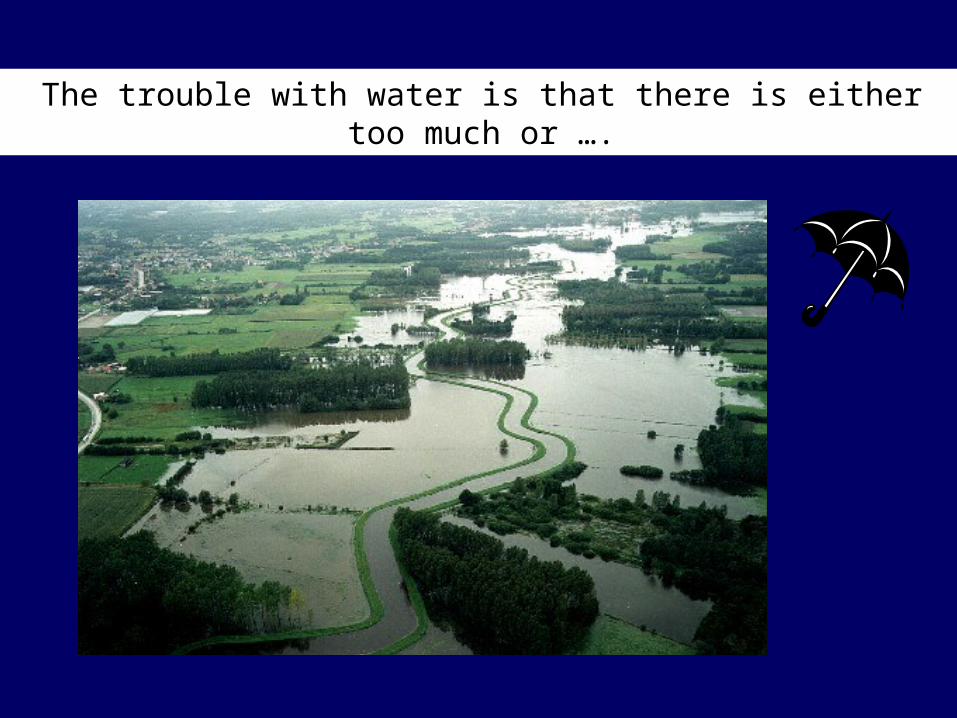
The trouble with water is that there is either too much or ….
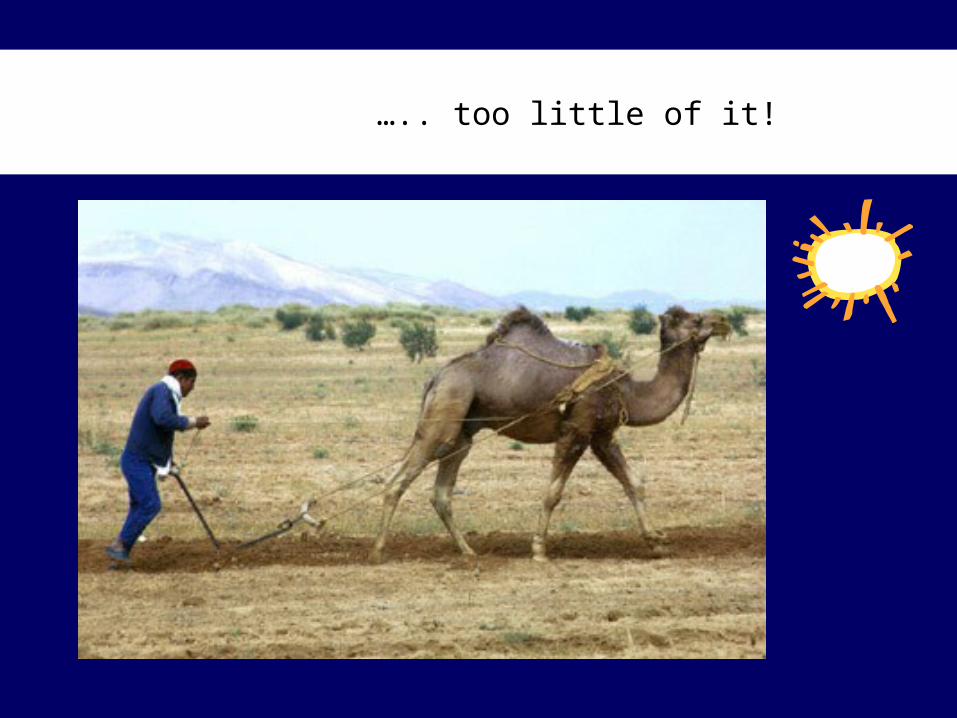
….. too little of it!

Water, a most precious resource
•Humans can live for a month without food, but will die in less than a week without water. •Humans consume water, discard it, poison it, waste it, and restlessly change the hydrological cycles, indifferent to the consequences: too many people, too little water, water in the wrong places and in the wrong amounts. •The human population is burgeoning, but water demand is increasing twice as fast.
(Quoted from Water Wars by Marq de Villiers, 1999)
• 22 African countries fail to provide safe water for at least half their population - Africa has some of the greatest lakes in the world (Victoria, Tanganyika, Nyasa, Chad, … but they are shrinking)
• Critical countries in Asia are China, India and Pakistan hosting more than 2 billion inhabitants
• Middle East is mostly arid, deserts are spreading through south-central Turkey and down the Euphrates River system in Iraq to the Persian Gulf, and from Jordan to Syria
Water, a most precious resource
There are hundreds, may I say thousands, of houses in this metropolis which have no drainage whatever, and the greater part of them have stinking, overflowing cesspools. And there are also hundreds of streets, courts and alleys that have no sewers; and how the drainage and filth are cleaned away and how the miserable inhabitants live in such places, it is hard to say.
(John Philips, engineer, London, 1847)
Water, a most precious resource

• Although we can not live without clean water, yet we use our waterways as a dumping ground for waste, pouring billions of tonnes of chemicals, methals and organic pollutants into lakes, rivers and oceans every year.
• Today we continue to ignore the vital importance of water, while consuming more and more. Not only is the level of water in the global well getting low, the water is also polutted, sometimes to the point where it is no longer drinkable.
Water, a most precious resource

What we pour down the drain comes back out of our taps !
Water, a most precious resource
Water, a most precious resource
• In 1930s there were fifty-two species of fish in the river Rhine. By 1975 there were twenty-nine, and most of them were on the verge of extinction. The river was suffocating; oxygen saturation had diminished from a norm of 90 percent to 40. A few years later biologists officially declared the river dead. The Rhine was converted into a sewer.
• 1991 ….ICPR established : “restoration of the Rhine, recognized as the backbone of the ecosystem”
Water, a most precious resource
• Severe pollution in Lake Maracaibo and the Gulf of Venezuela, at the mouth of Rio Magdalena, Colombia, in the Gulf of Guayaquil, Ecuador, at Blanca Bay, Argentina, at the mounth of the River Plate between Argentina and Uruguay, on the coast south of São Paulo and around Rio, and along the coast at Recife.
• The cowboy capitalism and the corruption of officials in Brazil led to an outpouring of chemical and industrial pollution exceeded only in Eastern Europe and parts of China. >130 tons of mercury are washed annually onto the banks of Tapajos River from the gold-mining industry.
• Whenever we contaminate one part of the hydrological cycle, we risk contaminating it all. For example, DDT, a pesticide now banned in most developed countries, has been detected in every phase of the water cycle.
• Population served by waste-water treatment plants (Denmark: 98.0%; Sweden: 95%; UK: 87.0%; USA: 71.6%; Spain: 53.0%; Japan: 45.9%; Portugal: 20.9%; Greece: 11.4%; Turkey: 6.3%; developing countries ?)
Water, a most precious resource

• Because most of us do not know where our wastes go and do not see the impact they have, we continue to pollute.
• Our current economic system does not take into account the costs of environmental degradation - we profit by polluting. Our economic system is not structured to reflect the vital importance of clean water for life.
Water, a most precious resource
• Even a wealthy country like the USA, with access to the latest in technology, cannot rule out a water crisis in the future. Half of US rivers and lakes have been damaged by pollution. Some public waterworks have had to shut down owing to groundwater pollution.
• A wealthy American industrialist has been buying freshwater lakes to leave to his grandchildren …...
Water, a most precious resource
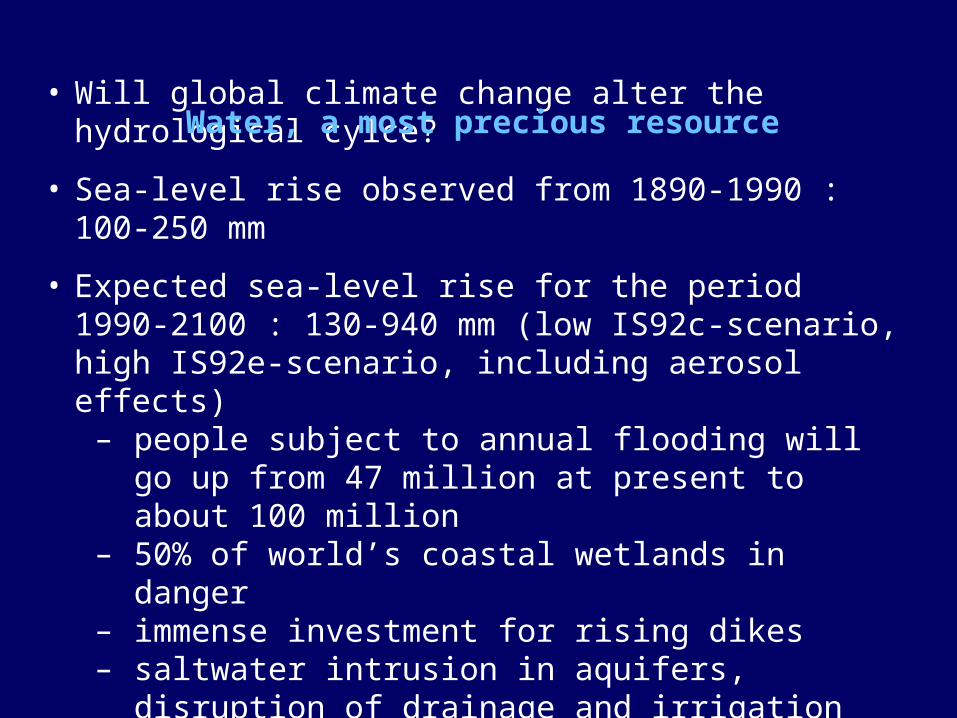
• Will global climate change alter the hydrological cylce?
• Sea-level rise observed from 1890-1990 : 100-250 mm
• Expected sea-level rise for the period 1990-2100 : 130-940 mm (low IS92c-scenario, high IS92e-scenario, including aerosol effects)
– people subject to annual flooding will go up from 47 million at present to about 100 million
– 50% of world’s coastal wetlands in danger– immense investment for rising dikes– saltwater intrusion in aquifers, disruption of drainage
and irrigation systems
Water, a most precious resource

If there was no rain, the earth would be barren. Without the cycle of evporation/rain, all water on earth would be
salt and we’d be fish.
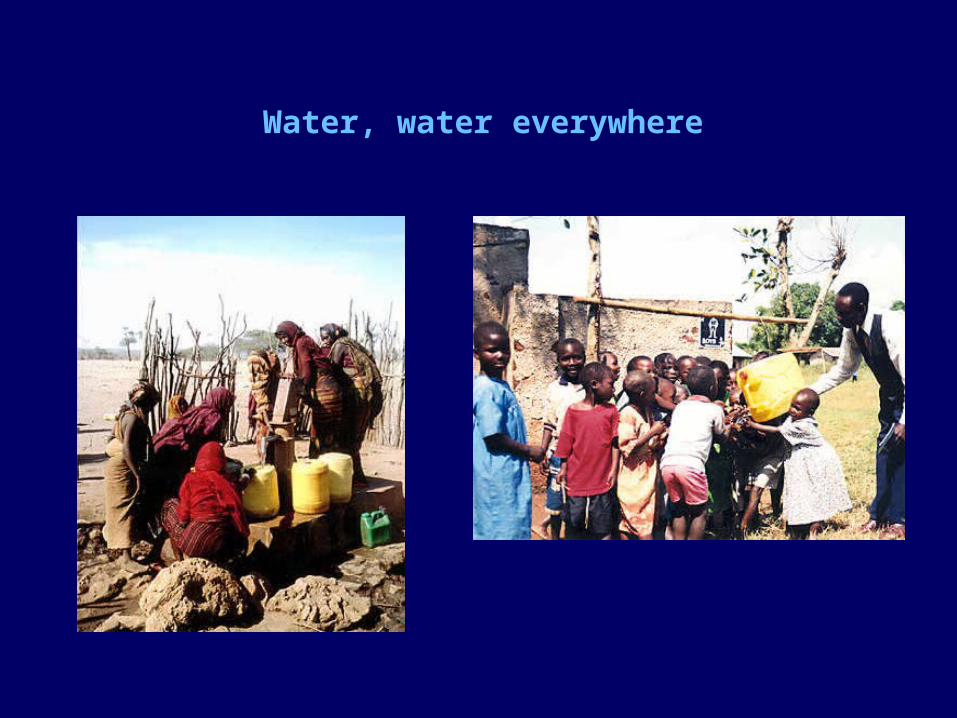
Water, water everywhere

2,700
83 0.18 0.09
0
500
1,000
1,500
2,000
2,500
3,000W
ate
r d
ep
th i
n m
Glo
ba
l w
ate
rst
ock
Fre
sh w
ate
rst
ock
Fre
sh w
ate
rst
ock
in
lake
s a
nd
rive
rs
Re
ne
wa
ble
fre
sh w
ate
rfr
act
ion
Water, water everywhere
35% for irrigation, industry and households, and 19% for
instream needs
Less than a tea spoon out of a 5-litre bucket
3%
Water, water everywhere
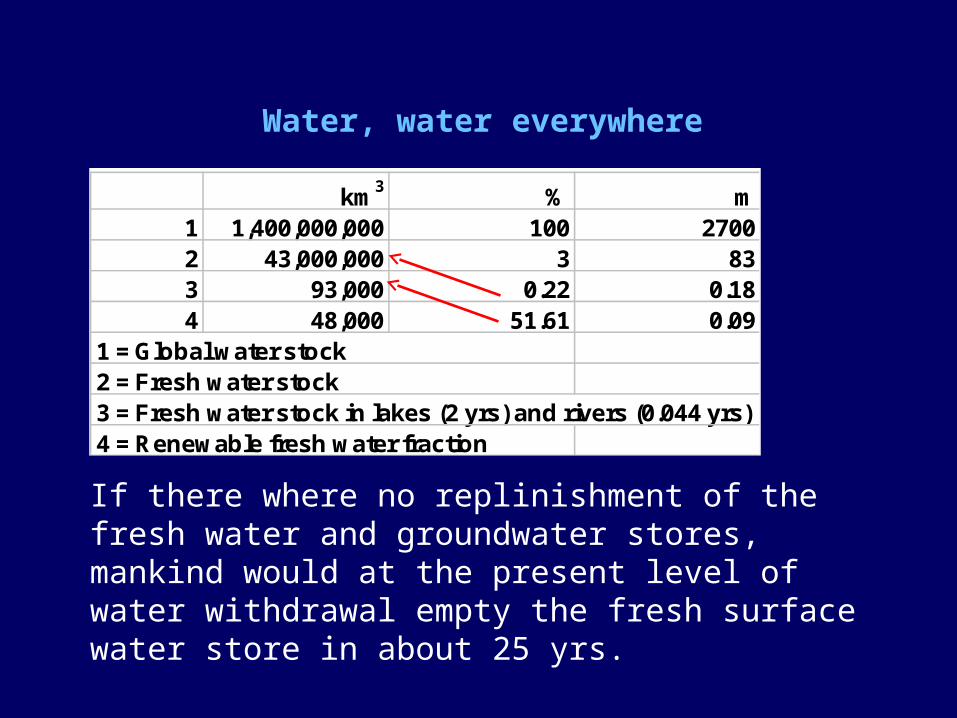
If there where no replinishment of the fresh water and groundwater stores, mankind would at the present level of water withdrawal empty the fresh surface water store in about 25 yrs.
km3 % m1 1,400,000,000 100 27002 43,000,000 3 833 93,000 0.22 0.184 48,000 51.61 0.09
1 = Global water stock 2 = Fresh water stock 3 = Fresh water stock in lakes (2 yrs) and rivers (0.044 yrs)4 = Renewable fresh water fraction

Water, water everywhere
km3 %Fresh water stock 43,000,000Fresh water in arctics and glaciers 29,500,000 68.60Liquid fresh water stock 13,500,000 31.40Fresh water stock at a depth > 500 m 9,180,000 68.00Readily available fresh water stock 4,320,000 32.00
Annual rainfall 577,000Annual rainfall on oceans 458,000 79.38Annual rainfall on land 119,000 20.62
Annual evapotranspiration 71,000 59.66Renewable fresh water stock 48,000 40.34

Water demand tripled between 1950 and 1990. It is expected to double again in thirty-five years. In 2025
demand is estimated at 7.500 km3, whereas the annual renewable stock remains at 48.000 km3!
0
500
1000
1500
2000
2500
3000
1880 1900 1920 1940 1960 1980 2000
Year
Wa
ter
co
nsu
mp
tio
n
(bil
lio
n m
3/y
ea
r)
Huishoudelijk
Irrigatie
Industrie
HouseholdIrrigationIndustry
Water, water everywhere

0
2
4
6
8
10
12
1880 1900 1920 1940 1960 1980 2000 2020 2040 2060
Year
Po
pu
lati
on
in
bil
lio
n
1998 2050
Population increase of 70 million people/year on average between 1950-1990; will increase with 3.6 billion or 90
million/year on average between 1990 and 2030
Water, water everywhere
Water, water everywhere
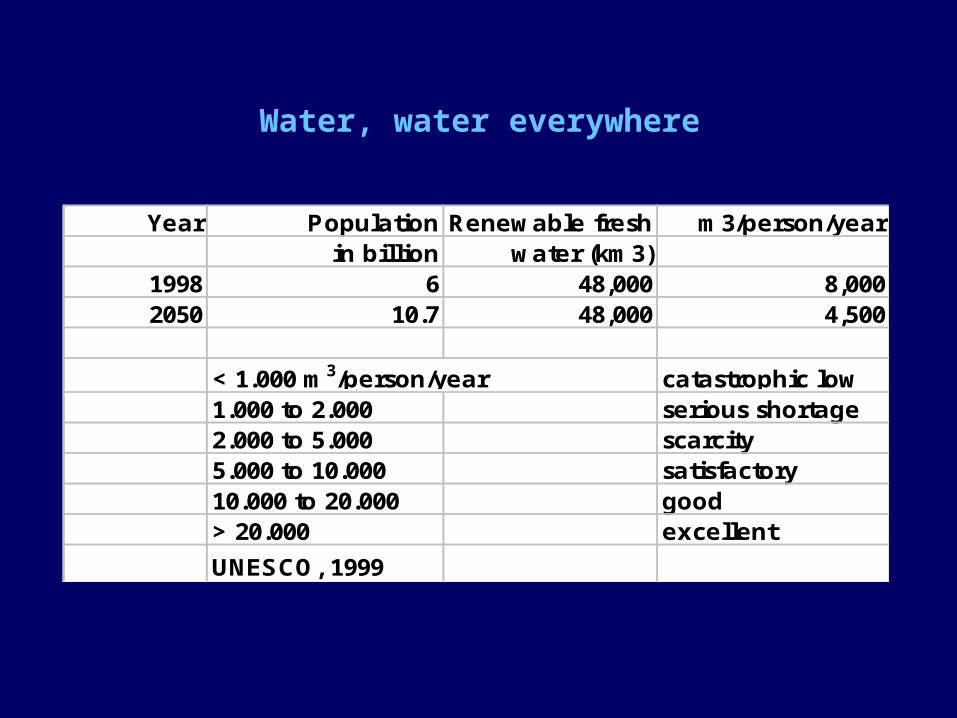
Year Population Renewable fresh m3/person/yearin billion water (km3)
1998 6 48,000 8,0002050 10.7 48,000 4,500
< 1.000 m3/person/year catastrophic low1.000 to 2.000 serious shortage2.000 to 5.000 scarcity5.000 to 10.000 satisfactory10.000 to 20.000 good> 20.000 excellent
UNESCO, 1999

Water, water everywhere
Year Population Renewable fresh m3/person/year
in billion water (km3)1998 6 48,000 8,0002050 10.7 48,000 4,500
North and Central America 1,692Former Soviet Union 1,330Oceania 907Europe 726Asia 526South America 476Africa 244

• Water consumption in Belgium
– 745m3/person/year– 7.5% domestic (56
m3/person/yr), 87% industrial use (648 m3/person/yr) and 5.5% (41 m3/person/yr) consumption in agriculture
– 60% tap-water, and 40% extracted directly from surface and groundwater
Water, water everywhere
Daily water consumptionin l/personUSA 397Japan 379Switzerland 270Italy 220The Netherlands 167France 157Belgium 153United Kingdom 150Austria & Germany 145Spain 126India 25African countries <25
Water, water everywhere
Water, water everywhere
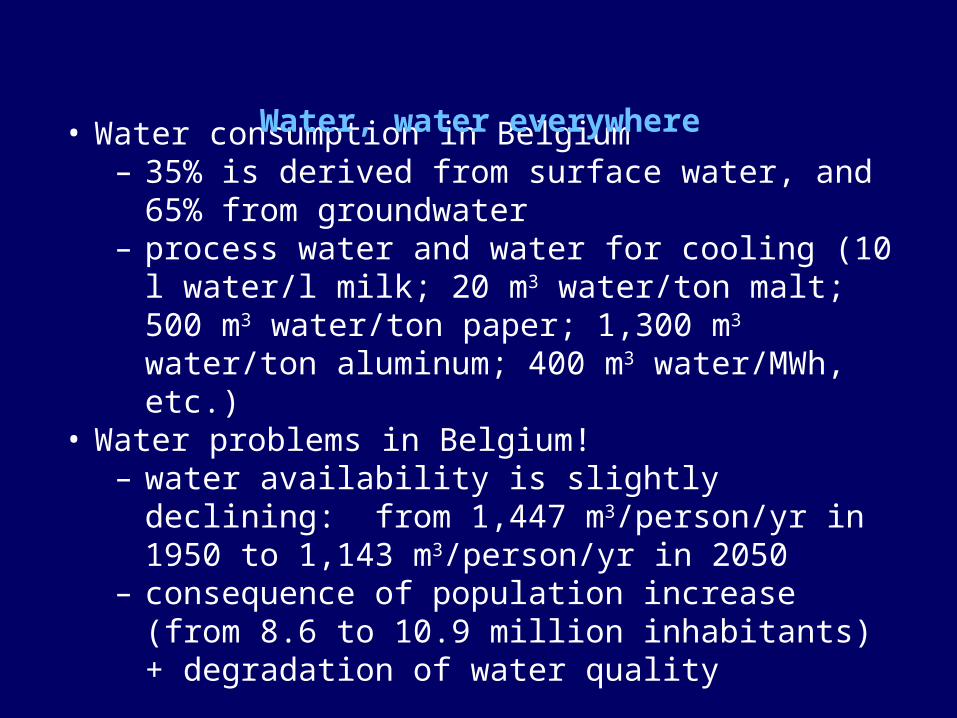
• Water consumption in Belgium – 35% is derived from surface water, and 65% from
groundwater– process water and water for cooling (10 l water/l milk;
20 m3 water/ton malt; 500 m3 water/ton paper; 1,300 m3 water/ton aluminum; 400 m3 water/MWh, etc.)
• Water problems in Belgium!– water availability is slightly declining: from 1,447
m3/person/yr in 1950 to 1,143 m3/person/yr in 2050– consequence of population increase (from 8.6 to 10.9
million inhabitants) + degradation of water quality
Water, water everywhere
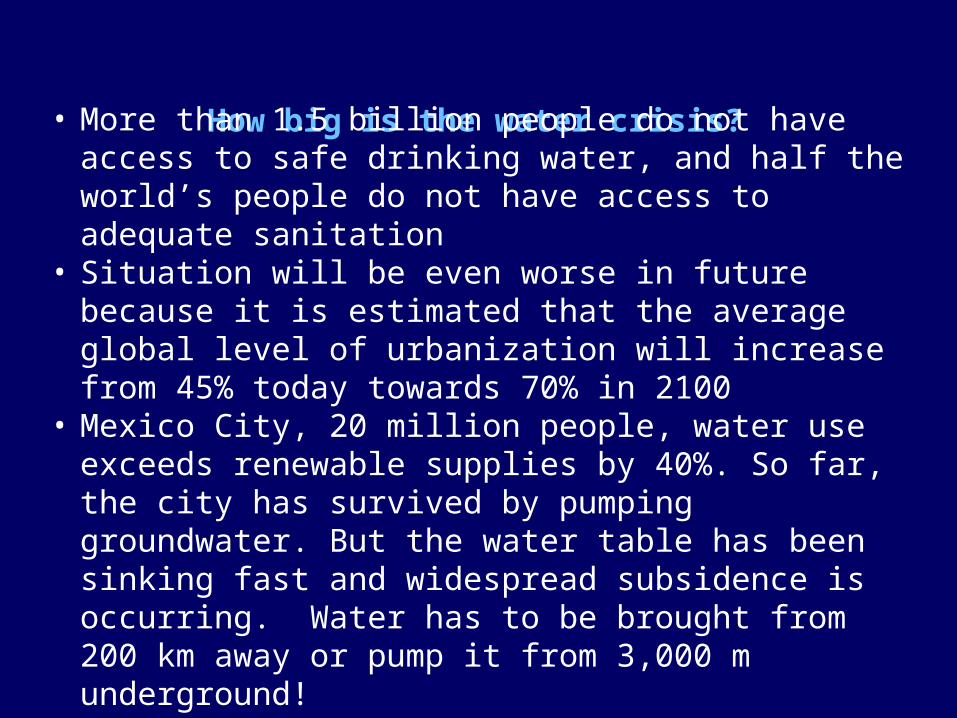
How big is the water crisis?
• More than 1.5 billion people do not have access to safe drinking water, and half the world’s people do not have access to adequate sanitation
• Situation will be even worse in future because it is estimated that the average global level of urbanization will increase from 45% today towards 70% in 2100
• Mexico City, 20 million people, water use exceeds renewable supplies by 40%. So far, the city has survived by pumping groundwater. But the water table has been sinking fast and widespread subsidence is occurring. Water has to be brought from 200 km away or pump it from 3,000 m underground!
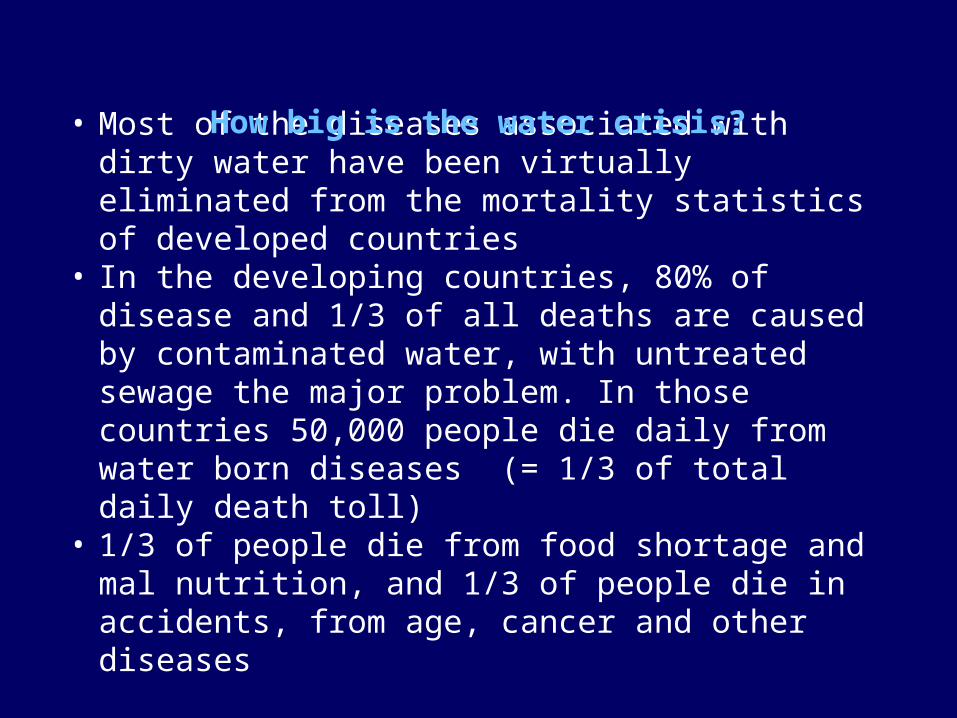
• Most of the diseases associated with dirty water have been virtually eliminated from the mortality statistics of developed countries
• In the developing countries, 80% of disease and 1/3 of all deaths are caused by contaminated water, with untreated sewage the major problem. In those countries 50,000 people die daily from water born diseases (= 1/3 of total daily death toll)
• 1/3 of people die from food shortage and mal nutrition, and 1/3 of people die in accidents, from age, cancer and other diseases
How big is the water crisis?
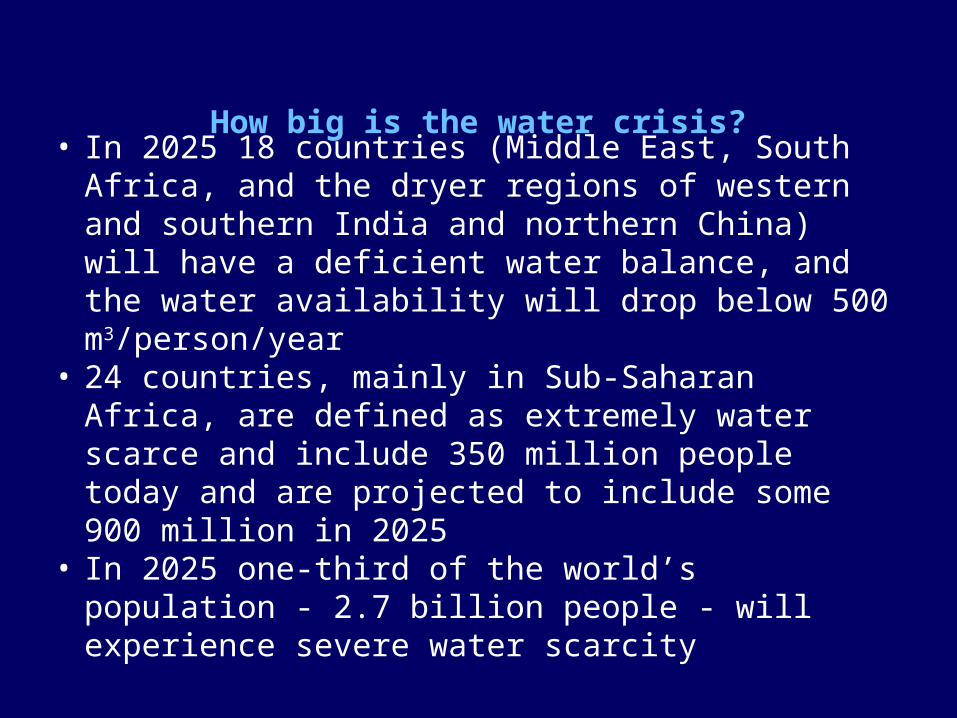
• In 2025 18 countries (Middle East, South Africa, and the dryer regions of western and southern India and northern China) will have a deficient water balance, and the water availability will drop below 500 m3/person/year
• 24 countries, mainly in Sub-Saharan Africa, are defined as extremely water scarce and include 350 million people today and are projected to include some 900 million in 2025
• In 2025 one-third of the world’s population - 2.7 billion people - will experience severe water scarcity
How big is the water crisis?
How big is the water crisis?
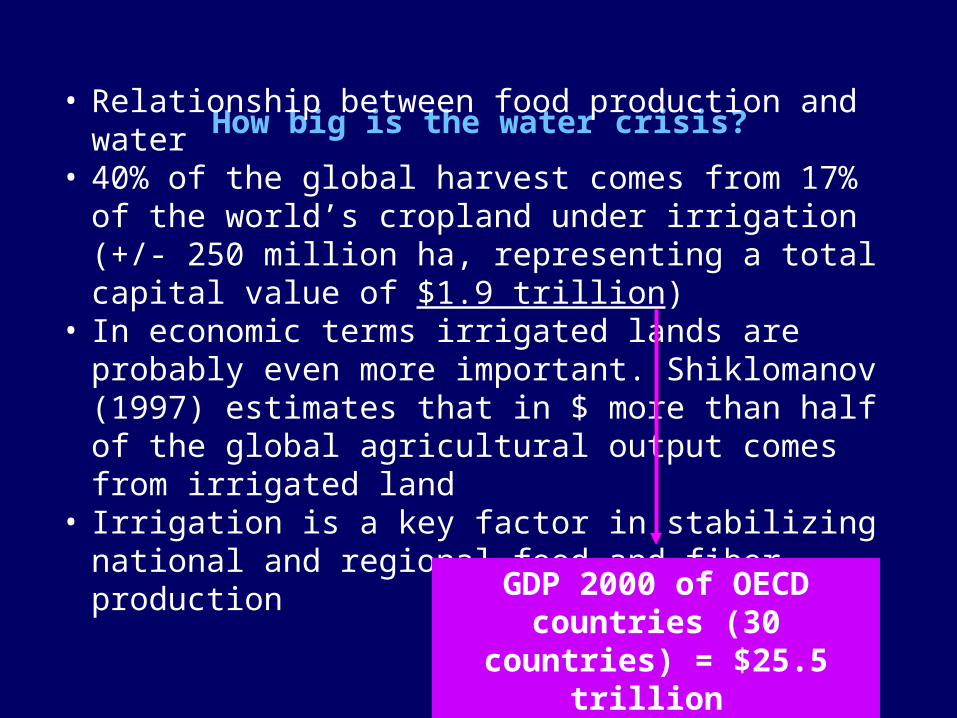
• Relationship between food production and water• 40% of the global harvest comes from 17% of the
world’s cropland under irrigation (+/- 250 million ha, representing a total capital value of $1.9 trillion)
• In economic terms irrigated lands are probably even more important. Shiklomanov (1997) estimates that in $ more than half of the global agricultural output comes from irrigated land
• Irrigation is a key factor in stabilizing national and regional food and fiber production
GDP 2000 of OECD countries (30 countries) = $25.5 trillion
How big is the water crisis?
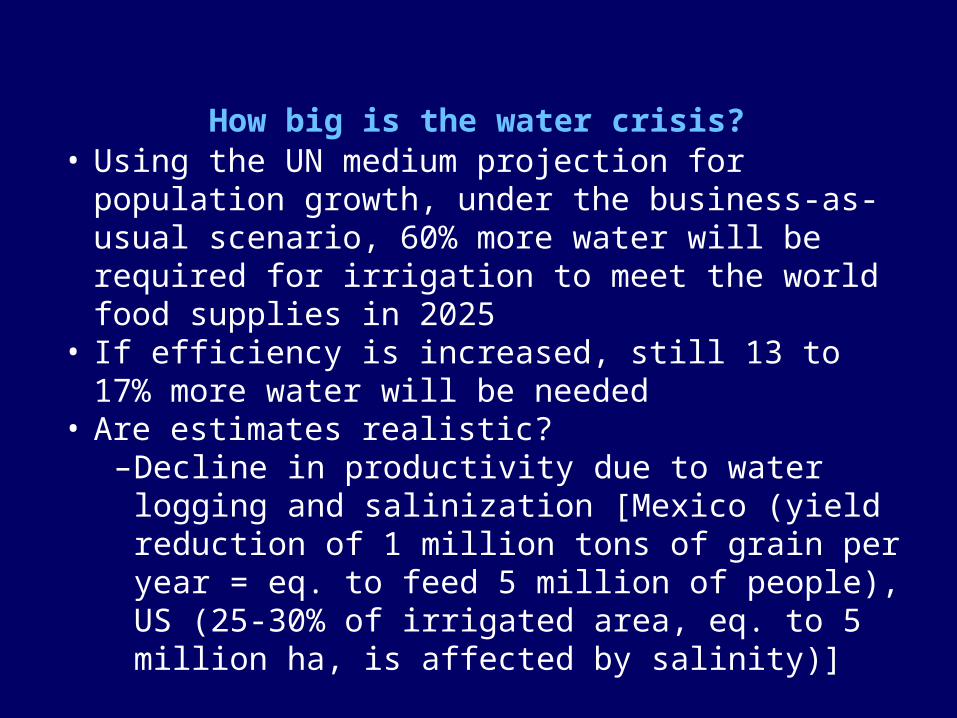
• Using the UN medium projection for population growth, under the business-as-usual scenario, 60% more water will be required for irrigation to meet the world food supplies in 2025
• If efficiency is increased, still 13 to 17% more water will be needed
• Are estimates realistic?–Decline in productivity due to water logging and
salinization [Mexico (yield reduction of 1 million tons of grain per year = eq. to feed 5 million of people), US (25-30% of irrigated area, eq. to 5 million ha, is affected by salinity)]

How big is the water crisis?
• Are estimates realistic?–Over the last decade the expansion of the area under
irrigation is in decline due to: low commodity prices, high investment and energy costs, low efficiency, poor maintenance and management, unfavorable economic conditions
–Between 1970 and 1980 world-wide investment in irrigation development (main irrigation infrastructure) exceeded $15 billion/year. Since then it decreased gradually, and investments vary presently between $8 and 10 billion/year (World Bank/UNDP)
How big is the water crisis?
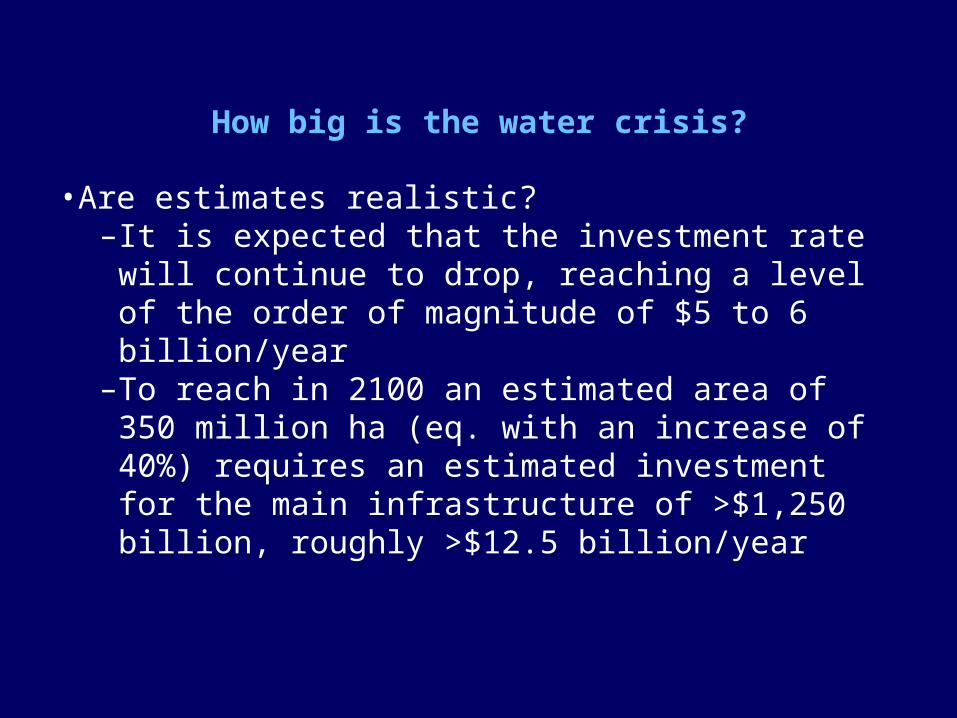
• Are estimates realistic? –It is expected that the investment rate will continue to
drop, reaching a level of the order of magnitude of $5 to 6 billion/year
–To reach in 2100 an estimated area of 350 million ha (eq. with an increase of 40%) requires an estimated investment for the main infrastructure of >$1,250 billion, roughly >$12.5 billion/year
How big is the water crisis?
• In conclusion: – In 2025 many of the water scarce countries will
need to produce more than twice their existing water supplies
– This means embarking on large and expensive water-development projects, which many will not be able to finance
– Water scarcity is already a major destabilizing force within countries because different sectors of the economy are vying for the same water resources

How big is the water crisis?
• Within the next 25 years there is great potential for more water conflict not just within countries but between them
• International conflicts linked to water disputes (20th
century)– 1948: India and Pakistan (Indus river basin)– 1951-53: Israel and Syria (Jordan river basin)– 1958: Egypt and Sudan (Nile river basin) – 1963-64: Ethiopia and Somalia (Ogaden desert)– 1965-66: Israel and Syria (Jordan river basin)– 1975: Iraq and Syria (Euphrates river basin)– 1989-91: Mauritania and Senegal (Senegal river
basin)
How big is the water crisis?
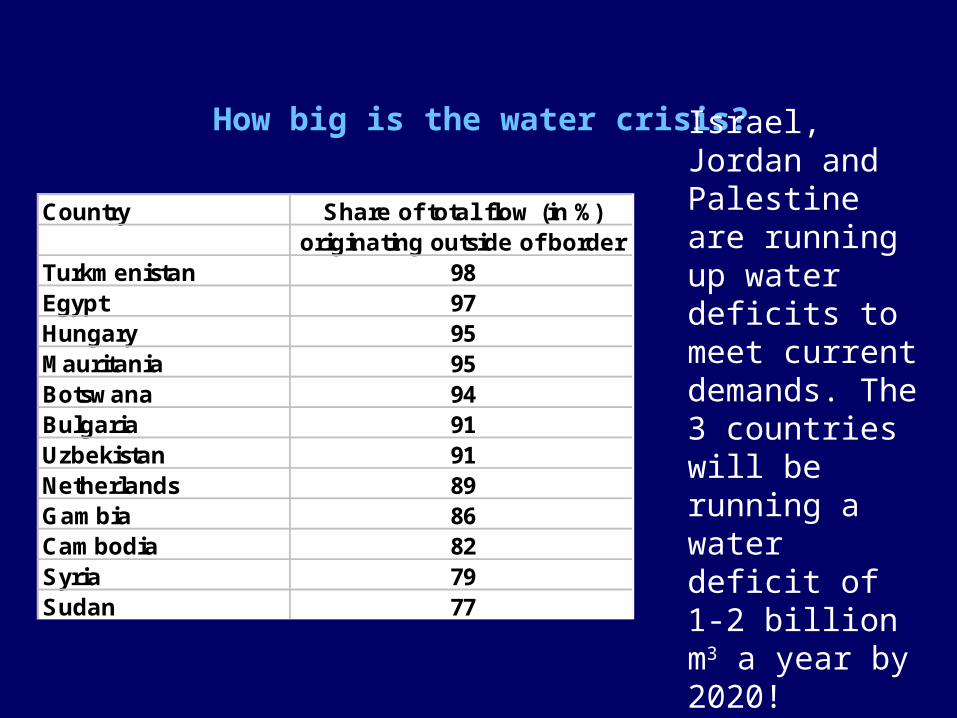
Israel, Jordan and Palestine are running up water deficits to meet current demands. The 3 countries will be running a water deficit of 1-2 billion m3 a year by 2020!
Country Share of total flow (in %)originating outside of border
Turkmenistan 98Egypt 97Hungary 95Mauritania 95Botswana 94Bulgaria 91Uzbekistan 91Netherlands 89Gambia 86Cambodia 82Syria 79Sudan 77
How big is the water crisis?
Conflicts occur even in Europe, where the sharing of water is regulated by 175 international treaties. In many other countries agreements are often ill defined or non-existent.
Whereas in most of the developing countries disputes are centerred around water quantity, in the industrialized countries the cause of dispute is water quality. This is particularly the case in Europe where the Danube flows through 12 and the Rhine through 8 countries. The Rhine is the source of drinking water for 12 million people.
Riparian discharges from sewage works and factories have been the subject of bitter disputes between countries!
Raising global political awareness
1965: International Hydrological Decade (IHD, 1965-1974)1972: UN Conf. on the Human Environment in Stockholm, Sweden (start of the UNEP)1972: The limits of growth (Meadows et al.)1977: UN Water Conference in Mar del Plata, Argentina1981-1990: International Drinking Water Supply and Sanitation Decade (objective: full access to water supply and sanitation for all inhabitants of developing countries)!!!1987: UN report Our Common Future (WCED)1992: Int. Conf. On Water and the Environùment (ICWE), Dublin, Ireland
Raising global political awareness
1992: UN Conf. on Environment and Development (UNCED) in Rio de Janeiro, Brazil, which produced Agenda 212000: UN Conference on water in the Hague, the Netherlands
Will those meetings and similar initiatives ultimately result in a reliable and equitable water distribution and an efficient use of water?
Will those meetings remove the source of political friction which eventually spark new wars?
Raising global political awareness
• water management should link technological, social and economic development with the protection of natural ecosystems;
• water management should approached in on a participatory basis, involving users, planners and policy makers at all levels;
• women should play a central role in the provision, management and safeguarding of water;
• water should be considered as an economic good
Will those meetings result in the implementation of the four guiding principles of the Dublin Statement, which still are considered as the basic cornerstones for reform:

Sceptic for the future …..!
Despite the push to fight hunger globally, efforts are falling short of the goals set out during the World Food Summit in 1996, when the international community pledged to cut the number of hungry in half by 2015. Today, the number is falling by six million per year, well below the average rate of 20 million needed to reach the target.
Rome, 19 July 2001.- "Will the world continue to watch the hungry people of the world die silently?" said Jacques Diouf, Director-General of the UN Food and Agriculture Organization (FAO), in a news conference prior to his meeting with the G8 in Genoa.
Sceptic for the future …..!
Dr. Diouf called on all concerned, particularly the G8 countries, to contribute to a Trust Fund for Food Security with an initial amount of $500 million to support agriculture in developing countries. "This amount is necessary to accelerate the process towards the goal set by the 1996 World Food Summit --cutting by half the number of hungry by 2015," he said. According to FAO the food gap is widening and 1 in 4 children worldwide will be malnourished in 2020.

Sceptic for the future …..!
• $500 million is not a large amount." He observed that the total lending to agriculture and rural development by the World Bank and Regional Financial Institutions amounted to $3.5 billion in 1999 while OECD countries spent around $361 billion over the same period on supporting their farmers

Sceptic for the future …..!

Sceptic for the future …..!

Sceptic for the future …..! Air planes $ millionF-14 Tomcats 38F-15E Strike Eagle 43F16 Fighting Falcon 20FA-18 Hornets 29AC-130 H/U Gunship 53B1-B Lancer 200B-2 Spirit (Stealth bomber) 1,300B-52 Stratofortresses 30
Missiles Unit cost # # TotalTomahawk missile 1.00 4,710 4,710
Navy Air ForceAGM-154A 0.25 8,800 3,000 2,950AGM-154B 0.43 1,200 3,000 1,806AGM-154C 0.66 7,800 0 5,148
FleetAir carrier 4,500
Cost of desalinisation plant for a community of 100,000 inhabitants
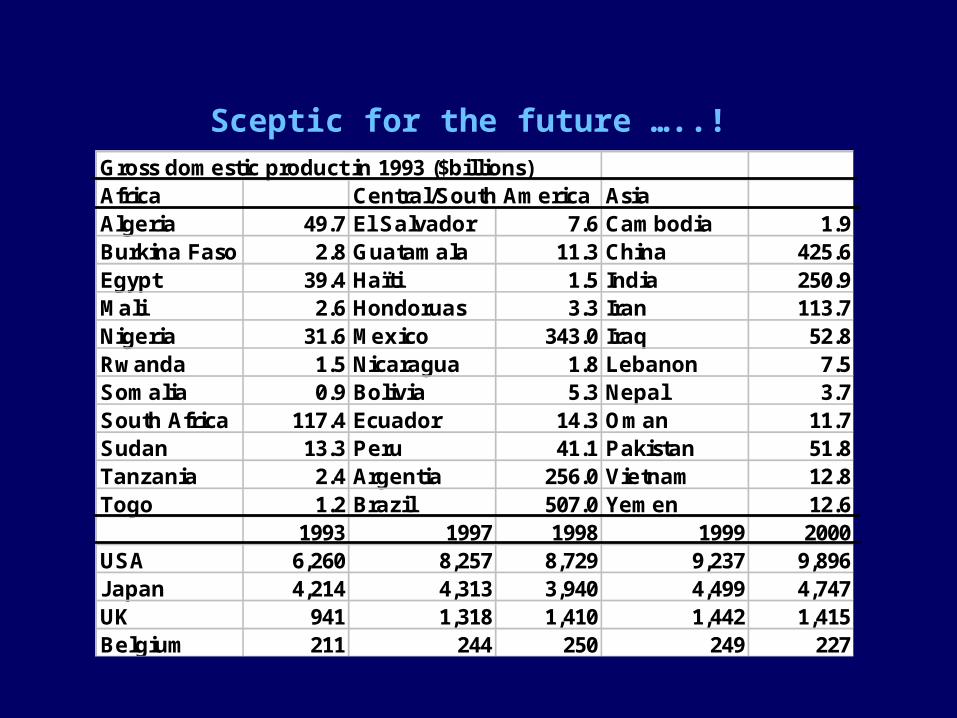
Sceptic for the future …..! Gross domestic product in 1993 ($billions)Africa Central/South America AsiaAlgeria 49.7 El Salvador 7.6 Cambodia 1.9Burkina Faso 2.8 Guatamala 11.3 China 425.6Egypt 39.4 Haïti 1.5 India 250.9Mali 2.6 Hondoruas 3.3 Iran 113.7Nigeria 31.6 Mexico 343.0 Iraq 52.8Rwanda 1.5 Nicaragua 1.8 Lebanon 7.5Somalia 0.9 Bolivia 5.3 Nepal 3.7South Africa 117.4 Ecuador 14.3 Oman 11.7Sudan 13.3 Peru 41.1 Pakistan 51.8Tanzania 2.4 Argentia 256.0 Vietnam 12.8Togo 1.2 Brazil 507.0 Yemen 12.6
1993 1997 1998 1999 2000USA 6,260 8,257 8,729 9,237 9,896Japan 4,214 4,313 3,940 4,499 4,747UK 941 1,318 1,410 1,442 1,415Belgium 211 244 250 249 227

Sceptic for the future …..!
"The poor and the developing countries are tired of declarations that are not followed by action. Resources from donors and major financial institutions have been
dwindling over the last five years!”
Sceptic for the future …..!
There is enough money and knowledge to foresee every human being today and in the future with fresh water and adequate sanitation, however …….
In the meantime watertables are dropping worldwide because of overpumping. Mexico City is sinking and the watertable in Beijing is dropping by several metres a year, ….. we continue polluting rivers and lakes to the point where the water is no longer drinkable, ….. not longer usable by fish, animals, plants .….

My premise …..!
•We have enough
•We just need to look after it better

Myth 1 …..!
•Only take what you can replace
•If you live in Europe – this is fine
•If you live in Saudi Arabia or Libya?
Myth 2 …..!
Water is consumed by people, industry,
agriculture and the environment
•People and industry only ‘borrow’ it
•Agriculture and the environment consume water in large quantities
Myth 3 …..!
•Water is lost through misuse or leakage

The toilet myth …..!
•Save water by reducing the flush

The toilet myth …..!
river
Water treatment
5 litres
5 litres
Lessons learnt …..!
•Water is not lost
•We just borrow it and then return it
•We can borrow it many times
•But we need to clean it up

The irrigation myth …..!
Farmers can save water by using it more efficiently

The irrigation myth …..!
1000 units of water
500
River basin efficiency is now 50%
Farms operate at 50% efficiency

The irrigation myth …..!
1000 units of water
500
250
Farms operate at 50% efficiency
500
250
River basin efficiency is now 75%

The irrigation myth …..!
1000 units of water
500
250
125
Farms operate at 50% efficiency
River basin efficiency is now 87.5%
500
250
125

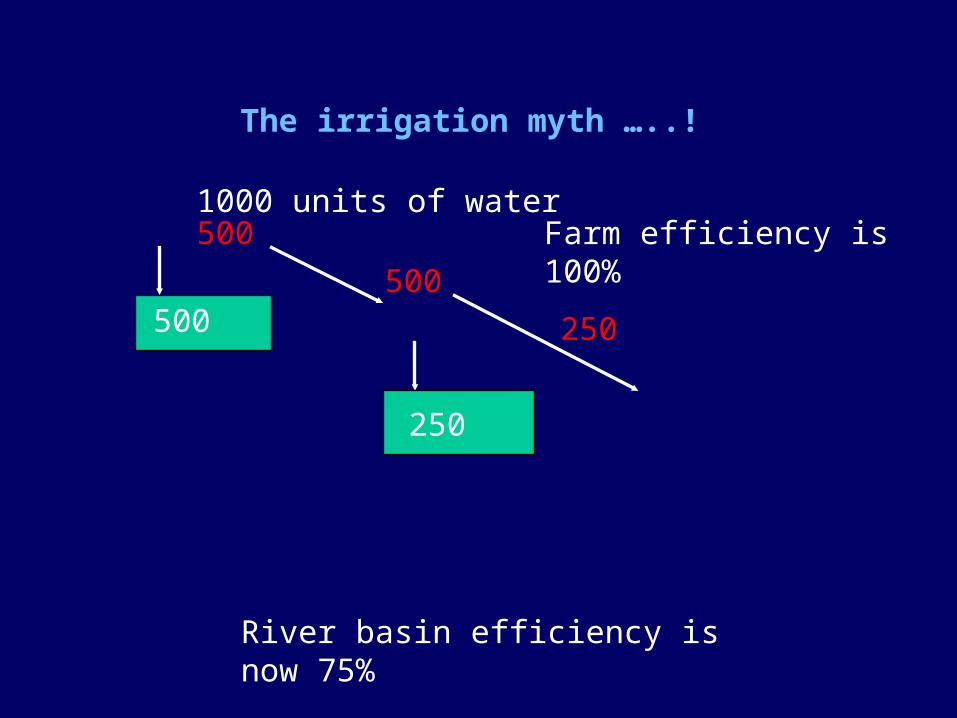
The irrigation myth …..!
1000 units of water
500
500
500
River basin efficiency is now 50%
Farm efficiency to 100%
The irrigation myth …..!
500
500
250500
250
River basin efficiency is now 75%
1000 units of waterFarm efficiency is 100%
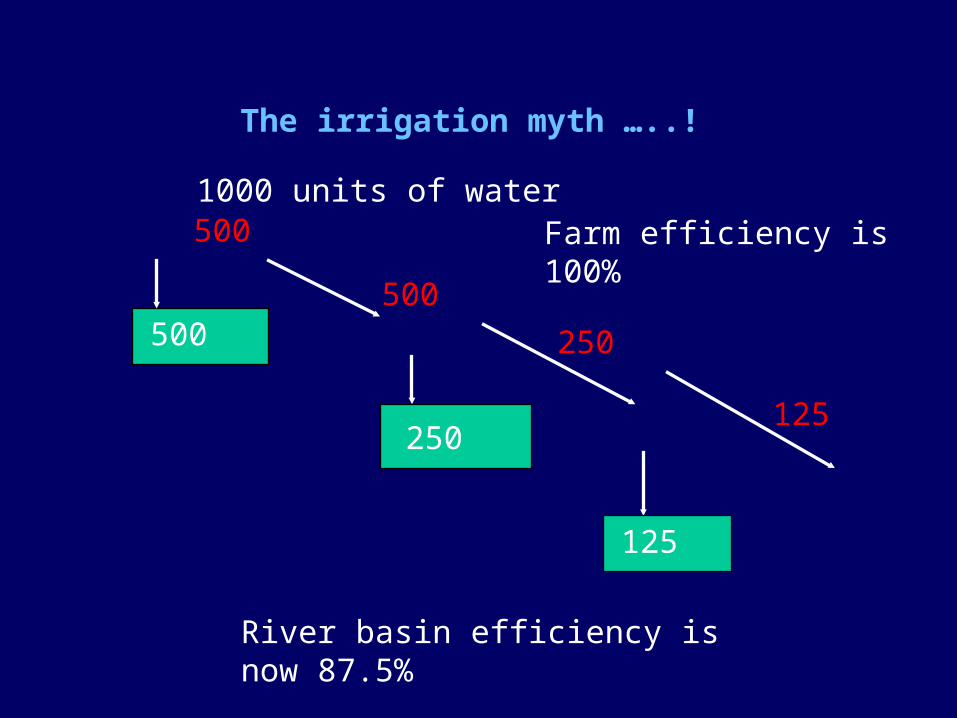
The irrigation myth …..!
500 Farm efficiency is 100%
500
250500
250
125
125
1000 units of water
River basin efficiency is now 87.5%

Lessons learnt …..!
•Efficiency of individual farms is not so important
•Efficiency of whole river basin is important
•Water is not lost unless it flows into sea
•Should we worry so much about leakage?

Lessons learnt …..!
We must have water to grow crops.
A problem for dry countries?
•Why not ‘import’ water?
1000t water 1t grain
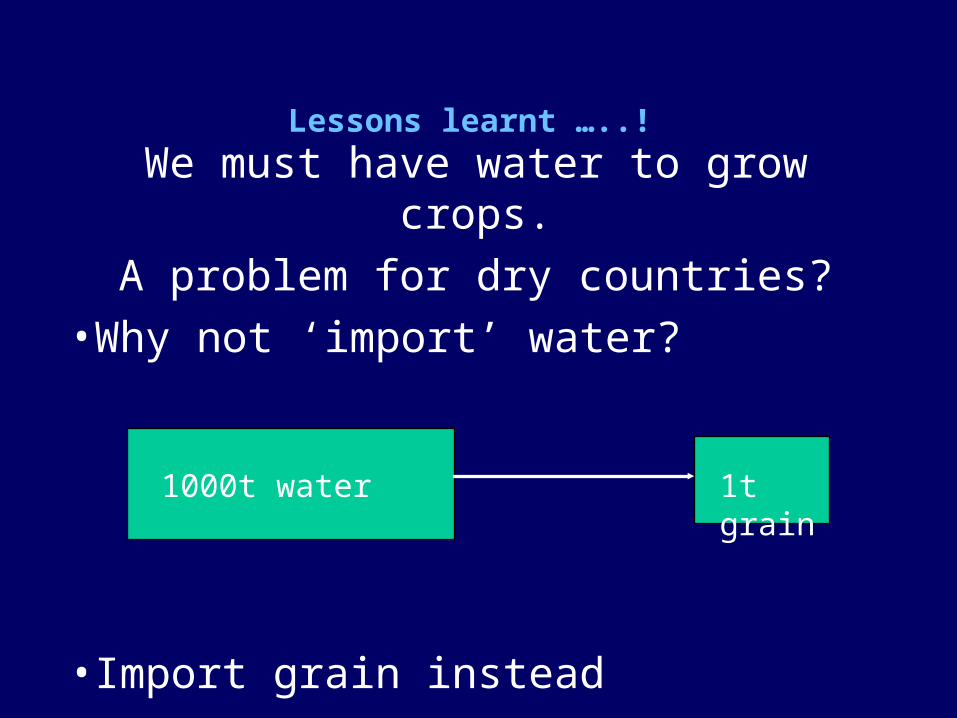
Lessons learnt …..!
We must have water to grow crops.
A problem for dry countries?
•Why not ‘import’ water?
•Import grain instead
1000t water 1t grain

Lessons learnt …..!
•We have enough
•We just need to look after it better

Lessons learnt …..!

Lessons learnt …..!
•Demand for water is escalating, contributing to intensified competition among users. In many areas, giving water to one user means denying it to another. •It lies well within current technical, institutional and financial capacities to make water available to every human being and to equip every community with the necessary sanitation facilities. However, ...........