white paper on 5g channel model for bands up to 100 ghz
TRANSCRIPT
1
White Paper on 5G Channel Model for Bands up to 100 GHz
Contributors Aalto University BUPT CMCC Ericsson Huawei INTEL KT Corporation
Nokia NTT DOCOMO New York University Qualcomm Samsung University of Bristol University of Southern California
2
Existing frequency bands New bands over wide range of frequencies
Frequency
Low SHF 3-6 GHz
High SHF 6-30 GHz
EHF gt 30 GHz
UHF Ex 800 MHz 2 GHz
Existing channel models are available for evaluations
Limited channel modelsconsiderations
New channel model is required for
frequency range above 6 GHz
Target Frequency Bands for 5G
3
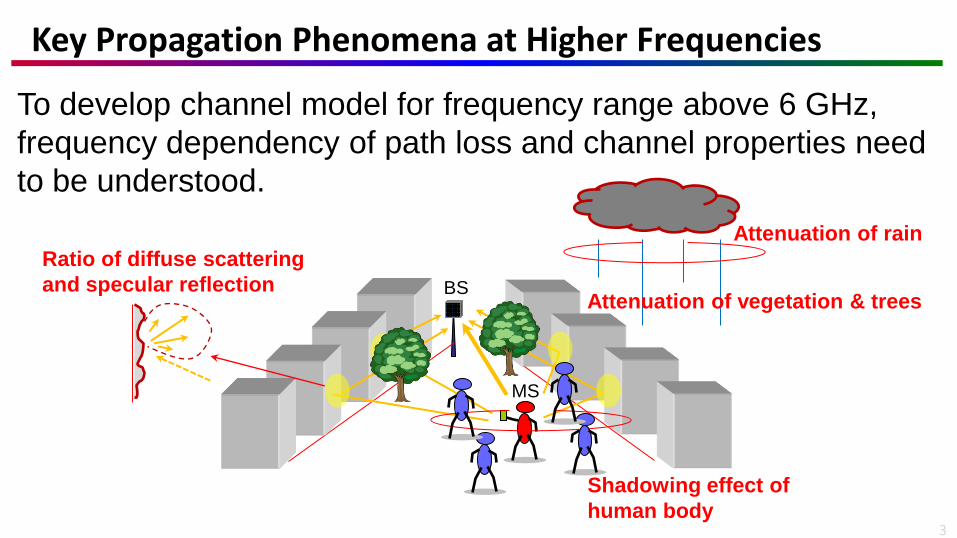
Ratio of diffuse scattering
and specular reflection
Shadowing effect of
human body
Attenuation of rain
Attenuation of vegetation amp trees BS
MS
To develop channel model for frequency range above 6 GHz
frequency dependency of path loss and channel properties need
to be understood
Key Propagation Phenomena at Higher Frequencies
4
M Channel Models
80211 Channel Models
Many organizations study 5G channel modeling
Scenarios Freq range Model
IEEE80211 Indoor 57-64 GHz Statistical channel model
METIS2020 UMi UMa V2VD2D Indoor Up to 86 GHz GSCM Map-based and hybrid
MiWEBA UMi 60 GHz Semi-deterministic semi-stochastic
COST2100 UMi Indoor 03 36-53 GHz GSCM
NYU WIRELESS UMi UMa Indoor 28386073 GHz GSCM
QuaDRiGa FraunhoferHHI
UMi Indoor O2I Dense (stadium) Backhaul
1028436082 GHz GSCM
Efforts for 5G Channel Measurements and Modeling
5
Identify Statusexpectation of existing information on high frequencies bull Existingongoing channel
measurementsmodeling activities bull Deployment scenarios and their
prioritization bull Spectrum bands of interests bull Additional features to be considered for
new model
5G channel model development bull Details of the deployment scenarios bull Pathlossshadowing bull LOS probability bull Small-scale fading bull Additional features required (eg Larger
band support blockage loss probability additional loss spatial consistency support of 3D beamforming with large array etc)
Oct 2015 Jun 2016 Dec 2015
(Ref) RP-151606 ndash New SID Proposal Study on channel model for frequency spectrum above 6 GHz
Channel modeling study has been initiated in 3GPP Objective Develop a channel model to enable a study on feasibility and
framework of 5G using high frequency spectrum of 6-100 GHz
Study on 5G Channel Model in 3GPP
6
6 - 20 GHz 20 - 30 GHz 30 - 60 GHz gt 60 GHz
UMi
Aalto Univ CMCC Ericsson IntelFraunhofer HHI NokiaAalborg NTT DOCOMO Orange
ATampT Aalto Univ CMCC Huawei IntelFraunhofer HHI NokiaAalborg NTT DOCOMO NYU Qualcomm Samsung CATT KT ETRI ITRICCU ZTE
ATampT Huawei IntelFraunhofer HHI NTT DOCOMO Qualcomm CATT ETRI ITRICCU ZTE
ATampT Aalto Univ Huawei IntelFraunhofer HHI NYU
UMa CMCC NokiaAalborg NokiaAalborg NYU
Indoor
Aalto Univ CMCC Ericsson Huawei IntelFraunhofer HHI NokiaAalborg NTT DOCOMO Orange
ATampT Alcatel-Lucent Aalto Univ BUPT CMCC Huawei IntelFraunhofer HHI NokiaAalborg NTT DOCOMO NYU Qualcomm Samsung CATT KT ETRI ITRICCU ZTE
ATampT Ericsson Huawei IntelFraunhofer HHI NTT DOCOMO NYU Qualcomm CATT ETRI ITRICCU ZTE
ATampT Aalto Univ Huawei IntelFraunhofer HHI NYU
O2I
Ericsson Huawei IntelFraunhofer HHI NokiaAalborg NTT DOCOMO Orange
ATampT Alcatel-Lucent Ericsson Huawei IntelFraunhofer HHI KT NTT DOCOMO NYU Samsung
ATampT Ericsson Huawei IntelFraunhofer HHI NTT DOCOMO
ATampT Huawei IntelFraunhofer HHI
Many companies and academia conducted measurement campaigns for 5G channel modeling
Efforts for 5G Channel Measurements and Modeling
7
White Paper titles ldquo5G Channel Model for bands up to 100 GHzrdquo put on this workshop website httpwww5gworkshopscom was developed by below parties to facilitate development of new channel models for spectrum bands ranging from 6 GHz to 100 GHz
bull Aalto University BUPT CMCC Ericsson Huawei Intel KT Corporation Nokia NTT DOCOMO New York University Qualcomm Samsung University of Bristol and University of Southern California
The White Paper was developed based on extensive measurement and ray tracing results across a multitude of bands conducted by the parties
The White Paper has been submitted or will be submitted to standardization forums such as 3GPP and relevant organizations to support their channel modeling activities
The White Paper will be updated to cover remaining aspects such as details on fast fading models and clustering
White Paper on 5G Channel Model for bands up to 100 GHz
8
It is highly preferable that the new model be based on the existing 3GPP 3D channel model bull Extensions should cater to 5G modeling requirements and scenarios
The new model should be bull Sufficiently accurate for the purposes of 5G evaluation
bull No more complex than it is necessary
Other considerable requirements
New channel model (Ref) 3GPP 3D channel model
Scenario 5G scenarios UMi and UMa
Frequency range Up to 100 GHz Up to 6 GHz
Bandwidth Up to 2 GHz Up to 100 MHz
Support of large antenna array
Finer angular resolution around 1 deg etc NA
Mobility Up to 350 kmh Suitability for dual mobility (D2DV2V)
Up to 350 kmh
Spatialtemporalfrequency consistency
Spatial consistency inter-site correlation correlation among bands LOSNLOS state etc ()
Partly supported (eg spatial consistency of LSPs with fixed BS)
() These features could possibly be optional for simpler studies
Modeling Approaches and Requirements
9
UMi ndash Street canyon Urban micro-cellular environment with BSs below rooftop level UMi ndash Open area Urban micro-cellular environment with BSs below rooftop level and pointing
towards open area UMa Urban macro-cellular environment with BSs above rooftop level Indoor ndash Office Typical office environment comprised of open and closed areas Indoor ndash Shopping mall Large multiple-story building with open ceiling in the middle
UMi ndash Open area
Hachiko-mae Tokyo
Indoor ndash Office Indoor ndash Shopping mall
UMi ndash Street canyon UMa
5th avenue New York
Both of outdoor-to-outdoor (O2O) and outdoor-to-indoor (O2I) are considered for UMi and UMa scenarios
Approx 50 m
Typical 5G Deployment Scenarios
10
The following slides provide describe the following (covered in more detail in [5GCM white paper])
bull Urban Micro Environment (UMi)
bull Indoor Hotspot (InH) Environment
bull Urban Macro Environment (UMa)
bull Penetration loss
5G Channel Model Specific Topics
11
Urban Micro Environment Channel Characteristics
12
Measurement Campaigns by multiple groups 2 GHz ~ 73 GHz
bull NokiaAalborg (2 10 18 GHz) Qualcomm (29 29 GHz) CMCC (6 GHz) IntelHHI (10 60 GHz) docomo (26 37 GHz) SamsungKAIST (28 GHz) KT (28 GHz) Huawei (28 72 73 GHz) NYU (28 73 GHz) Aalto Univ (60 GHz)
Urban Micro (UMi) ndash Street Canyon Environment
TX
TX
RX
TX View
TX View
RX
TX
RX
TX
RX
13
LoS Probability (based on Ray-tracing) ndash Street Canyon
0 50 100 150 200 250 3000
01
02
03
04
05
06
07
08
09
1
Distance [2D] (m)
Lo
S P
rob
ab
ility
LoS Probability UMi
UMi Street-Canyon data (based on ray-tracing)
3GPP UMi model (d1=18 d2=36) RMSE = 0023
Fitted (d1d2) model (d1=20 d2=39) RMSE = 0001
NYU squared model (d1=22 d2=100) RMSE = 0026
NYU Campus Manhattan
TX
TX
Tokyo Downtown
Fitted (d1d2) model based on 3GPP ITU Model
NYU Squared model proposed by NYU
Current model used in 3GPP ITU
Ray-Tracing Simulations
Models d1 d2 MSE
3GPP UMi 18 36 0023
d1d2 model 20 39 0001
NYU (squared) 22 100 0026
Current model has small error over all distances LoS probability seems no frequency dependent
14
Pathloss model based on multiple measurement campaigns
bull LoS model ndash well matched to Friisrsquo free-space pathloss model
bull NLoS model ndash pathloss slope range (n asymp 3~4) similar to lower-band below 6 GHz
Large-scale Propagation Model Pathloss Shadow Fading
Single-Slope Pathloss Model
Baseline Model CI model (LoS) CI --γ model (NLoS)
Valid freq [GHz]
Validity dist [m]
n (CI)
[dB] γ σSF [dB] [min ~ max] [min ~ max]
Street Canyon
LoS 198 NA
31
2 ~ 73
5~221
NLoS CI 319 82
10~959 ABG 348 2102 234 78
Open Square
LoS 185 NA
42
2 ~ 60
6~88
NLoS CI 289 71
8~605 ABG 414 366 243 70
15
Baseline LoS Model CI model Baseline NLoS Model CI model and --γ model
Shadow Fading Model fixed SF model distance-dependent SF model is considered with further analysis
UMi Pathloss Model Street-Canyon Single-Slope Model
Pathloss Exponent = 198
16
Dual-sloped pathloss observed based on ray-tracing simulation still requires more analysis bull The median-values of pathloss has different slope in near far region
bull Due to different propagation characteristics in mmWave severe diffraction loss reflection-dominant propagation
UMi Pathloss Model Street-Canyon Dual-slope Model
1st slope well matched up to 200m range 2nd slope of pathloss appeared over 150 m
Severe diffraction loss penetration loss Mostly reflected paths in NLoS no twice-penetrated paths In far area (over 150 m) the effect of diffracted path is dominant after several reflections
102
0
01
02
03
04
05
06
07
08
09
1
Distance (m)
Pro
babili
ty o
f th
e S
trongest
Ray
Diffraction+Reflection
Diffraction Only
Reflection OnlyReflection
Dominant Area
17
Based on the WINNER-like ITU3GPP model SCM model extended for mmWave band
Developimplement additional features of higher frequency on baseline model
Fast-fading Channel Extension of Stochastic Channel Model
Baseline Model ndash Extension of the current SCM model
- Reuse the framework of doublendashdirectional channel model
in standardization [ITU-R M2135 3GPP TR36873]
- Parameter extraction from Measurement Ray-tracing
simulation over many frequencies
[Ongoing] Modular Approach added on Baseline Model New features can be activated for some scenarios
- Blockage model from moving vehicles human body
- Geometry-induced additional loss in dense urban street-canyon
- Spatial-consistency for Massive MIMO MU-MIMO
[1] S Hur S Baek B Kim Y Chang A Molisch T Rappaport K Haneda and J Park Proposal on Millimeter-Wave Channel Modeling for 5G Cellular System under review IEEE JSTSP May 2015 [2] M Samimi and T Rappaport Local Multipath Model Parameters for Generating 5G Millimeter-Wave 3GPP-like Channel Impulse Response will be presented in EuCAPrsquo2016 April 2016
18
Delay angular spreads are frequency dependent
bull Smaller DSAS in higher frequency due to highly directional characteristics
bull Measurement and ray-tracing simulation used for extraction of large-scale parameters
Fast-fading Model Preliminary Channel Model Parameters
28 GHz1 73 GHz2
LoS NLoS LoS NLoS
Delay spread (σDS)
log10(seconds)
μDS -870 -739 -771 -752
εDS 054 031 034 050
AoA spread (σASA)
log10(degrees)
μASA -049 142 169 145
εASA 093 029 027 032
AoD spread (σASD)
log10(degrees)
μASD -040 082 128 132
εASD 107 038 050 038
ZoA spread (σZSA)
(degrees)
μZSA -140 069 060 053
εZSA 109 040 009 015
ZoD spread (σZSD)
(degrees)
μZSD -125 -021 NA 046
εZSD 004 030 NA 018
Delay distribution Exponential distribution
AoD and AoA distribution Laplacian distribution Uniform [0 360]
ZoD and ZoA distribution Laplacian distribution Gaussian distribution
Delay scaling parameter 442 482 390 310
DSASDASA in smaller ranges as frequency increases Measurement and ray-tracing shows
- Mean of RMS delay spread asymp 50 ns (28 GHz NLoS)
- Mean of AS of arrival asymp 30 deg (28 GHz NLoS)
Extract large-scale parameters in SCM framework 28 GHz (Samsung) and 73 GHz (NYU WIRELESS)
0 20 40 60 80 100 120 140 160 1800
01
02
03
04
05
06
07
08
09
1
RMS Delay Spread [ns]
Cu
mu
lative
Dis
trib
utio
n F
un
ctio
n (
CD
F)
Daejeon 28GHz Urban NLoS
Measurement
Ray-Tracing
0 20 40 60 800
01
02
03
04
05
06
07
08
09
1
Azimuth Angle spread [deg]
Cu
mu
lativ
e D
istr
ibu
tion
Fu
nctio
n (
CD
F)
Daejeon 28GHz Urban NLoS
ASD Measurement
ASD Ray-Tracing
ASA Measurement
ASA Ray-Tracing
19
Indoor Hotspot Environment Channel Characteristics
Definition on Scenarios
Typical indoor office
Open ceiling (in the middle)
Corridor
Open ceiling
(Open space in 1st floor)
Shop
Typical shopping mall
Considering the possibility of carrying 80 of the MBB traffic typical indoor
hotspot deployment scenarios are worthy of careful investigation
Measurement Campaign for InH
Contributor Scenario Frequency band (GHz)
Aalto University Shopping mall LOSNLOS 28 60
CMCC Indoor office LOSNLOS 14 28
DOCOMO Indoor office LOS 20
Ericsson Indoor office LOSNLOS 244 58 148 60
Huawei Indoor office LOSNLOS 73 28
Nokia Shopping mall O2I 2 10 18
NYU Indoor office LOSNLOS 28 73
Qualcomm Indoor office Shopping mall LOSNLOS 29 29 61
Samsung Shopping mall LOSNLOS 28
Ray tracing simulation is also important tools for investigating the LOS probability and channel characteristics validation especially when measurement data is not available
In LOS conditions multiple reflections from walls floor and ceiling give rise to
waveguiding Measurements in both office and shopping mall scenarios show that
path loss exponents based on a 1 m free space reference distance are typically
below 2 leading to more favorable path loss than predicted by Friisrsquo free space loss
formula The strength of the waveguiding effect is variable and the path loss
exponent appears to increase very slightly with increasing frequency possibly due to
the relation between the wavelength and surface roughness
Measurements of the small scale channel properties such as angular spread and
delay spread have shown remarkable similarities between channels over a very wide
frequency range It appears as if the main multipath components are present at all
frequencies though with some smaller variations in amplitudes
Recent work shows that polarization discrimination ranges between 15 and 25 dB
for indoor millimeter wave channels [Karttunen EuCAP2015] with greater
polarization discrimination at 73 GHz than at 28 GHz [MacCartney 2015]
InH Channel Characteristics
Three types of typical indoor office scenarios were investigated with ray tracing bull Open plan office bull Closed plan office bull Hybrid office including both open and closed areas
LOS probability (12)
0 5 10 15 20 25 30 35 40 45 500
5
10
15
20
Open planed area (cubic)
Closed office amp meeting room
Transmitter
Open plan office Closed plan office Hybrid office
Source Ericsson Source Ericsson Source Aalto
40
m
75
mRo
om
he
igh
t 2
68
m
Source Huawei
Source Qualcomm
LOS probability (22)
Model Original UpdatedNew MSE
ITU 00499
WINNERII B3
00572
WINNER II A1
00473
New model NA 00449
89 170
8911 )94)1(exp(
11 1
d
dd
d
PLOS
1 )49)1(exp(
1 1
dd
dPLOS
The modeling results for four models are approaching to the averaged LOS probability samples
The LOS probability model used in ITU IMT-Advanced evaluation and WINNER II are also presented here for comparison
The influence of data set from different types of office scenarios open or closed have been merged
The results show that the new model has a good fit to the data in an average sense and can be used for 5G InH
scenarios evaluation
56 320)632)56(exp(
5621 )74)21(exp(
21 1
dd
dd
d
PLOS0 10 20 30 40 50 60 70
0
01
02
03
04
05
06
07
08
09
1
distance(m)
LO
S p
robability
Huawei hybrid office
Qualcomm hybrid office
Ericsson open office
Ericsson corridor
Ericsson room
Aalto corridor
Aalto room
Averaged LOS Prob
ITU Model
WINNER Model B3
WINNER Model A1
New model
62 )))(10log40161(1(901
62 1
313 dd
dPLOS
3750
37182718exp
181
d
dd
d
PLOS
10 )45)10(exp(
10 1
dd
dPLOS
52 )))(10log610241(1(901
52 1
313 dd
dPLOS
For LOS
Due to strong reflections from walls
ceiling and floor wave guide
propagation can be observed for both
indoor office and shopping mall
For NLOS
Propagation path loss can be modeled
with dual PL slopes along with the
propagation distance
Frequency dependency higher than free
space can be observed for both
scenarios
Single-slope model is FFS
Shadowing Distance dependency of shadowing can
be observed in measurement on some
frequency band But it is still FFS
Path Loss Modeling (13)
100
101
102
-5
0
5
10
15
20
25
30
35
40
Distance (m)
Excess L
oss b
ased o
n P
L_d0 (
dB
)
244GHz samples
29GHz samples
58GHz samples
148GHz samples
20GHz samples
28GHz Huawei samples
28GHz NYU samples
29GHz samples
60GHz samples
73GHz Huawei samples
73GHz NYU samples
freespace PL
modeling results(Zone2)
100
101
102
100
101
102
20
40
60
80
100
120
140
160
Distance(m)Frequency(GHz)
Path
loss(d
B)
244GHz samples
29GHz samples
58GHz samples
148GHz samples
28GHz Huawei samples
28GHz NYU samples
29GHz samples
60GHz samples
73GHz Huawei samples
73GHz NYU samples
model results
100
101
102
-10
0
10
20
30
40
50
Distance (m)
Excess L
oss b
ased o
n P
L_d0 (
dB
)
29GHz samples
28GHz samples
285GHz samples
29GHz samples
61GHz samples
63GHz_I samples
63GHz_II samples
63GHz_III samples
model results
freespace plane
Ind
oo
r o
ffic
e
Sh
op
pin
g m
all
LOS NLOS
LOS NLOS
100
101
102
100
101
102
20
40
60
80
100
120
140
160
Distance(m)Frequency(GHz)
Path
loss(d
B)
29GHz samples
28GHz samples
285GHz samples
29GHz samples
61GHz samples
63GHz_I samples
63GHz_II samples
63GHz_III samples
model results
For LOS CI model can be adopted
For NLOS dual-slope ABG and CIF model can be adopted as two options
Single slope model is FFS
Option 1 ABG
Option 2 CIF w Free Space Path Loss (FSPL) reference 1 m
and
and fo is the avg center frequency of input data (K =number of unique frequencies Nk is path loss data points at kth frequency fk)
Path Loss Modeling (23)
Xm
dnmfdBdfPLLOS
1log10)1(FSPL])[( 10
BP
BP
BP
BP
ABG
Dual ddd
dfd
ddfd
dPL )(log10)(10log10)(log10
1 )(10log10)(log10
)(1021101
1101
BP
BP
BP
BP
CIFDual
ddd
d
f
ffbn
m
d
f
ffbnmfFSPL
ddm
d
f
ffbnmfFSPL
dPL
)(log110)1
(log110)1(
1 )1
(log110)1(
)(
10
0
02210
0
011
10
0
011
K
k K
K
k Kk
N
Nff
1
10
Path Loss Modeling (33)
Scenario CICIF Model Parameters ABG Model Parameters
Indoor office LOS n=173 σ= 302 dB NA
Indoor office NLoS
dual slope
n1=251 b1=012 f0= 241 GHz n2=425 b2=004
dBP = 78 m σ=765 dB
1=17 1=330 =249 dBP = 690 m 2=417
σ= 778 dB
Shopping Mall LoS n=173 σ= 201 dB NA
Shopping Mall NLoS dual slope n1=243 b1=-001 f0= 395 GHz n2=836 b2=039
dBP = 110 m σ=626 dB
1=29 1=2217 =224 dBP = 1470 m
2=1147 σ=636 dB
Indoor office NLoS
single slope (FFS) n=319 b=006 f0= 242 GHz σ=829 dB =383 =1730 =249 σ=803 dB
Shopping Mall NLoS
single slope (FFS) n=259 b=001 f0= 395 GHz σ=740 dB =321 =1809 =224 σ=697 dB
Frequency dependency on rms DS
In some measurment campaign delay spread
show similarity over a very wide frequency range
While in some other measurement campaign
some frequency dependency can be observed
Bandwidth dependency on rms
DS
In some measurement campaign bandwidth
dependency can observed considering the
possibility of large variance on the system
bandwidth may be adopted for above 6GHz
system
Delay Spread
DS based on measurement on
58 148 60GHz (Ericsson)
DS based on measurement on 29 29 61GHz
(Qualcomm)
0 05 1 15 20
20
40
60
80
100
y = 612exp(-171x)+778
Bandwidth [GHz]
De
lay
Sp
rea
d [
ns
]
Delay Spread evolving fitting
73G NLOS DS per cluster
73G NLOS fitted curve
12ns500M75ns2G
85ns10M
DS based on measurement on
73GHz (Huawei)
Polarization has been investigated based on
measurement on 28GHz 60GHz and 73GHz
If based on 3GPP XPR model XPR can be
decribed in table below It is still need further
investigation on the frequency dependency on
the XPR
Polarization Modeling
TX Azimuth [deg]
RX
Azi
mut
h [deg
]
HH
-90 -60 -30 0 30 60 90
-180
-135
-90
-45
0
45
90
135
TX Azimuth [deg]
RX
Azi
mut
h [deg
]
HV
-90 -60 -30 0 30 60 90
-180
-135
-90
-45
0
45
90
135
TX Azimuth [deg]
RX
Azi
mut
h [deg
]
VH
-90 -60 -30 0 30 60 90
-180
-135
-90
-45
0
45
90
135
TX Azimuth [deg]
RX
Azi
mut
h [deg
]
VV
-90 -60 -30 0 30 60 90
-180
-135
-90
-45
0
45
90
135-40
-35
-30
-25
-20
-15
-10
-5
0
Polarization measurement on 73GHz (Huawei)
Polarization measurement on 28GHz and 60GHz (Aalto Univ)
文档名称 文档密级
28GHz 60 GHz 73GHz
Scenario Shopping mall Shopping mall Indoor office
LOS NLOS LOS NLOS Hybrid
XPR (dB)
XPR 1612 1448 1685 1606 11
XPR
622 626 662 534 65
Preliminary results on polarization modeling
For InH scenarios fast fading channel
characteristics have been investigated based on
both measurement and ray-tracing
Both indoor office and shopping mall
environments have been investigated at
frequencies including 20 GHz 28 GHz 60GHz
and 73 GHz
Some preliminary analysis on large-scale channel
characteristics have been collected in table on the
right
Although it is still too early to apply these results to
the full frequency range up to 100 GHz these
preliminary investigations have provided insight into
the difference induced by the largely extended
frequency range
Collection of Results
1 From DOCOMO based on measurement
2 From Aalto University based on measurement
3 From NokiaNYU based on ray-tracing
4 From Huawei based on measurement
文档名称 文档密级
20 GHz1 28GHz2 60 GHz2 73GHz3 73GHz4
Scenario Indoor office Shopping mall Shopping mall Indoor office Indoor office
LOS LOS NLOS LOS NLOS Hybrid Hybrid
Delay spread ()
log10
(seconds)
DS -733 -752 -759 -762 -745 -81 NA
DS
01 017 033 020 011 04 NA
Delay distribution NA Exponential Exponential NA
AoA spread (ASA
) log
10(degrees)
ASA
NA 154 157 150 160 16 NA
ASA
NA 016 018 016 015 037 NA
AoD spread (ASD
) log
10(degrees)
ASD
18 144 168 143 172 15 NA
ASD
009 016 019 010 008 026 NA
ZoA spread (ZSA
)
(degrees)
ZSA NA 087 068 086 067 -0025d+118 NA
ZSA
NA 045 031 040 023 030 NA
ZoD spread (ZSD
)
(degrees)
ZSD 0 075 095 074 088 -0040d+145 NA
ZSD
048 034 022 030 020 033 NA
AoD and AoA distribution NA Wrapped Gaussian Uniform NA
ZoD and ZoA distribution NA Laplacian Laplacian NA
XPR (dB)
XPR NA 1612 1448 1685 1606 15 11
XPR
NA 622 626 662 534 2 65
LOS Ricean K
factor (dB)
K NA -018 NA -107 NA 8 NA
K NA 285 NA 358 NA 3 NA
31
Urban Macro Environment Channel Characteristics
32
Access points on or above rooftops (25-35 m high) cell radii gt= 200 m
Outdoor-to-outdoor and outdoor-to-indoor (UEs from 15-225 m)
UMa characteristics
bull LOS path loss close to free space
bull NLOS path loss minus free-space path loss at 1 m is very similar across frequency
bull Reflections likely dominate not diffraction
bull Delay and angle spreads appear to decrease with frequency
bull XPR decreases with frequency according to ray tracing but measurements have yet to verify this finding
5G UMa Environment
33
Aalborg University 2 10 18 28 GHz measurements bull 20 m and 25 m high Txrsquos
Ericsson data at 28 GHz bull Lindholmen (25 m high) bull Molndal (46 m high)
NYU 38 GHz measurements Austin Tx
Samsung 28 GHz ray-tracing data Ottawa and NYU-campus bull 23-35 m high Tx bull Only data with path loss lt= 100 dB minus FSPL(1 m) are used
Nokia 2 56 10 18 28 393 and 735 GHz ray tracing data bull Same environment as Aalborg data bull Only data with path loss lt= 100 dB minus FSPL(1 m) are used bull Data not used for path loss and LOS probability since it would be redundant with the Aalborg measured
data
UMa Available Data
34
UMa reuse 3GPP definition
bull Good match to new measurements
bull Also already has 3-D UE placement
)(11118
min)( 6363UT
dd hdCeed
dp
mhdg
h
mh
hdCUT
UT
UT
UT2313)(
10
13
130
)(51
md
otherwise
ddedg 18
0
150exp)251()(
26
0 100 200 300 400 500 6000
01
02
03
04
05
06
07
08
09
1
Distance (m)
LO
S p
robabili
ty
Data
3GPP UMa
d1d2 model
NYU (squared) model
Other LOS probability models only slightly improve match to data over 3GPP model
LOS Probability Findings
35
In all models d is distance f is frequency X is shadow fading Gaussian RV (dB)
Close-in (CI) reference distance path loss model
Alpha-Beta-Gamma (ABG) path loss model
CICI Xm
dnmfdBdf
1log10)1(FSPL])[(PL 10
FSPL( f 1m) = 20log10
4p f
c
aelig
egraveccedil
ouml
oslashdivide
ABGABG XGHz
f
m
ddBdf
1log10
1log10])[(PL 1010
Scenario CI Model Parameters ABG Model Parameters
UMa- LoS n=20 SF = 41 dB NA
UMa-nLoS n=30 SF = 68 dB =34 =192 =23 SF = 65 dB
Proposed UMa Path Loss and Shadow Fading Models (Single Slope)
36
14 16 18 20 22 24 26 28 30
40
50
60
70
80
90
100
10log10(d)
Path
loss m
inus F
SP
L(d
0=
1 m
) (d
B)
CI
ABG 2 GHz
ABG 28 GHz
ABG 100 GHz
3GPP UMa
NLOS UMa PL Models Compared to 3GPP UMa Model
37
These parameters found using the ray-tracing results in the Aalborg environment
56 GHz 10 GHz 18 GHz 28 GHz 393 GHz 735 GHz
Delay spread (st)
log10(seconds)
mDS -675 -680 -685 -688 -689 -691
eDS 068 088 078 073 073 069
AoA spread (sASA)
log10(degrees)
mASA 134 114 114 115 114 109
eASA 081 114 101 094 091 087
AoD spread (sASD)
log10(degrees)
mASD 087 067 074 075 078 082
eASD 081 135 105 116 106 093
ZoA spread (sZSA)
log10(degrees)
mZSA 048 031 026 026 024 020
eZSA 075 092 085 081 081 079
ZoD spread (sZSD)
log10(degrees)
mZSD -026 -024 -022 -022 -020 -016
eZSD 070 074 078 081 082 083
Shadow fading (dB) 982 1022 1028 1012 1014 997
Delay distribution Exponential Exponential Exponential Exponential Exponential Exponential
AoD and AoA distribution Laplacian Laplacian Laplacian Laplacian Laplacian Laplacian
ZoD and ZoA distribution Laplacian Laplacian Laplacian Laplacian Laplacian Laplacian
Delay scaling parameter TBD TBD TBD TBD TBD TBD
XPR (dB) mXPR 1387 1294 1097 1076 938 789
sXPR 612 636 680 657 660 638
Preliminary UMa NLOS Large-Scale Parameters (LSPs)
38
LOS path loss is very close to free space
NLOS path loss minus free-space path loss at 1 m (FSPL(1 m)) shows very little change across frequency
bull Aalborg data taken at 2 10 and 18 GHz in the same environment shows
bull Path loss minus FSPL(1 m) increases from 2 to 10 GHz but decreases from 10 to 18 GHz
bull Additional loss from 2 to 10 GHz may be due to diffraction loss and after 10 GHz (where diffraction is no longer a dominant channel effect) there may be a slight increase in reflectivity in the environment
bull More measurements are needed to confirm a linear trend of path loss minus FSPL (1 m) with the log of frequency (as modeled in the ABG model)
Delay and angle spreads tend to decrease with frequency
Although not shown elevation angle spreads and biases at both the Tx and Rx will have a distance dependence
XPR appears to decrease with frequency in ray-tracing results due to diffuse scattering model but measurements have yet to verify this trend
Summary of UMa Trends
39
Building penetration loss
40
Sources [Rodriguez VTC Fall 2014]
[Zhao 2013] and measurements
contributed by Samsung and Nokia
Material penetration loss
41
Most buildings have facades made up of multiple materials
bull Windows concrete brick wood
Very close to the external wall the loss characteristics of a single material may dominate
Further into the building the combined loss of multiple materials is experienced
Building penetration loss
42
Buildings with standard glass have lower loss than buildings with IRR glass
bull Non-linear dependence vs frequency
For comparison models from [Semaan Globecom 2014] are plotted
bull Low loss model 30 glass 70 concrete
bull High loss model 70 IRR glass 30 concrete
Other models have also been proposed see [5GCM white paper]
Building penetration Measurements
Sources [Larsson EuCAP 2014] and
measurements contributed by Qualcomm
NTT DOCOMO and Ericsson
43
Incidence angle to external wall
bull Loss increases by up to 15-20 dB for grazing incidence
Multiple internal reflections in material
bull Causes frequency-dependent constructive or destructive interference
Additional loss due to internal walls furniture people etc
bull Typically in the order 02-2 dBm with weak frequency dependence
Additional considerations
44
Building penetration loss tends to increase with frequency
bull Quantified through measurements over a large frequency range
bull Highly variable losses due to differences among building materials
bull IRR coated glass has high loss even at low frequencies
More details and further model proposals described in the white paper
Conclusions
45
[5GCM white paper] A Ghosh ed ldquo5G channel model for bands up to 100 GHzrdquo Globecom 2015 Available for download via httpwww5gworkshopscom5GCMhtml
[Zhao 2013] H Zhao et al28 GHz millimeter wave cellular communication measurements for reflection and penetration loss in and around buildings in New York city in 2013 IEEE International Conference on Communications (ICC) pp 5163-5167 9-13 June 2013
[Rodriguez VTC Fall 2014] I Rodriguez H C Nguyen N T K Jorgensen T B Sorensen and P Mogensen Radio Propagation into Modern Buildings Attenuation Measurements in the Range from 800 MHz to 18 GHz in Proc of IEEE Vehicular Technology Conference (VTC fall) 2014 pp 1-5
[Larsson EuCAP 2014] C Larsson F Harrysson B-E Olssson and J-E Berg An outdoor-to-indoor propagation scenario at 28 GHz in Proc of European Conference on Antennas and Propagation (EuCAP) 2014 pp 3301-3304
[Semaan Globecom 2014] E Semaan F Harrysson A Furuskaumlr and H Asplund Outdoor-to-indoor coverage in high frequency bands Globecom Workshops 2014 pp 393-398
References

2
Existing frequency bands New bands over wide range of frequencies
Frequency
Low SHF 3-6 GHz
High SHF 6-30 GHz
EHF gt 30 GHz
UHF Ex 800 MHz 2 GHz
Existing channel models are available for evaluations
Limited channel modelsconsiderations
New channel model is required for
frequency range above 6 GHz
Target Frequency Bands for 5G
3
Ratio of diffuse scattering
and specular reflection
Shadowing effect of
human body
Attenuation of rain
Attenuation of vegetation amp trees BS
MS
To develop channel model for frequency range above 6 GHz
frequency dependency of path loss and channel properties need
to be understood
Key Propagation Phenomena at Higher Frequencies
4
M Channel Models
80211 Channel Models
Many organizations study 5G channel modeling
Scenarios Freq range Model
IEEE80211 Indoor 57-64 GHz Statistical channel model
METIS2020 UMi UMa V2VD2D Indoor Up to 86 GHz GSCM Map-based and hybrid
MiWEBA UMi 60 GHz Semi-deterministic semi-stochastic
COST2100 UMi Indoor 03 36-53 GHz GSCM
NYU WIRELESS UMi UMa Indoor 28386073 GHz GSCM
QuaDRiGa FraunhoferHHI
UMi Indoor O2I Dense (stadium) Backhaul
1028436082 GHz GSCM
Efforts for 5G Channel Measurements and Modeling
5
Identify Statusexpectation of existing information on high frequencies bull Existingongoing channel
measurementsmodeling activities bull Deployment scenarios and their
prioritization bull Spectrum bands of interests bull Additional features to be considered for
new model
5G channel model development bull Details of the deployment scenarios bull Pathlossshadowing bull LOS probability bull Small-scale fading bull Additional features required (eg Larger
band support blockage loss probability additional loss spatial consistency support of 3D beamforming with large array etc)
Oct 2015 Jun 2016 Dec 2015
(Ref) RP-151606 ndash New SID Proposal Study on channel model for frequency spectrum above 6 GHz
Channel modeling study has been initiated in 3GPP Objective Develop a channel model to enable a study on feasibility and
framework of 5G using high frequency spectrum of 6-100 GHz
Study on 5G Channel Model in 3GPP
6
6 - 20 GHz 20 - 30 GHz 30 - 60 GHz gt 60 GHz
UMi
Aalto Univ CMCC Ericsson IntelFraunhofer HHI NokiaAalborg NTT DOCOMO Orange
ATampT Aalto Univ CMCC Huawei IntelFraunhofer HHI NokiaAalborg NTT DOCOMO NYU Qualcomm Samsung CATT KT ETRI ITRICCU ZTE
ATampT Huawei IntelFraunhofer HHI NTT DOCOMO Qualcomm CATT ETRI ITRICCU ZTE
ATampT Aalto Univ Huawei IntelFraunhofer HHI NYU
UMa CMCC NokiaAalborg NokiaAalborg NYU
Indoor
Aalto Univ CMCC Ericsson Huawei IntelFraunhofer HHI NokiaAalborg NTT DOCOMO Orange
ATampT Alcatel-Lucent Aalto Univ BUPT CMCC Huawei IntelFraunhofer HHI NokiaAalborg NTT DOCOMO NYU Qualcomm Samsung CATT KT ETRI ITRICCU ZTE
ATampT Ericsson Huawei IntelFraunhofer HHI NTT DOCOMO NYU Qualcomm CATT ETRI ITRICCU ZTE
ATampT Aalto Univ Huawei IntelFraunhofer HHI NYU
O2I
Ericsson Huawei IntelFraunhofer HHI NokiaAalborg NTT DOCOMO Orange
ATampT Alcatel-Lucent Ericsson Huawei IntelFraunhofer HHI KT NTT DOCOMO NYU Samsung
ATampT Ericsson Huawei IntelFraunhofer HHI NTT DOCOMO
ATampT Huawei IntelFraunhofer HHI
Many companies and academia conducted measurement campaigns for 5G channel modeling
Efforts for 5G Channel Measurements and Modeling
7
White Paper titles ldquo5G Channel Model for bands up to 100 GHzrdquo put on this workshop website httpwww5gworkshopscom was developed by below parties to facilitate development of new channel models for spectrum bands ranging from 6 GHz to 100 GHz
bull Aalto University BUPT CMCC Ericsson Huawei Intel KT Corporation Nokia NTT DOCOMO New York University Qualcomm Samsung University of Bristol and University of Southern California
The White Paper was developed based on extensive measurement and ray tracing results across a multitude of bands conducted by the parties
The White Paper has been submitted or will be submitted to standardization forums such as 3GPP and relevant organizations to support their channel modeling activities
The White Paper will be updated to cover remaining aspects such as details on fast fading models and clustering
White Paper on 5G Channel Model for bands up to 100 GHz
8
It is highly preferable that the new model be based on the existing 3GPP 3D channel model bull Extensions should cater to 5G modeling requirements and scenarios
The new model should be bull Sufficiently accurate for the purposes of 5G evaluation
bull No more complex than it is necessary
Other considerable requirements
New channel model (Ref) 3GPP 3D channel model
Scenario 5G scenarios UMi and UMa
Frequency range Up to 100 GHz Up to 6 GHz
Bandwidth Up to 2 GHz Up to 100 MHz
Support of large antenna array
Finer angular resolution around 1 deg etc NA
Mobility Up to 350 kmh Suitability for dual mobility (D2DV2V)
Up to 350 kmh
Spatialtemporalfrequency consistency
Spatial consistency inter-site correlation correlation among bands LOSNLOS state etc ()
Partly supported (eg spatial consistency of LSPs with fixed BS)
() These features could possibly be optional for simpler studies
Modeling Approaches and Requirements
9
UMi ndash Street canyon Urban micro-cellular environment with BSs below rooftop level UMi ndash Open area Urban micro-cellular environment with BSs below rooftop level and pointing
towards open area UMa Urban macro-cellular environment with BSs above rooftop level Indoor ndash Office Typical office environment comprised of open and closed areas Indoor ndash Shopping mall Large multiple-story building with open ceiling in the middle
UMi ndash Open area
Hachiko-mae Tokyo
Indoor ndash Office Indoor ndash Shopping mall
UMi ndash Street canyon UMa
5th avenue New York
Both of outdoor-to-outdoor (O2O) and outdoor-to-indoor (O2I) are considered for UMi and UMa scenarios
Approx 50 m
Typical 5G Deployment Scenarios
10
The following slides provide describe the following (covered in more detail in [5GCM white paper])
bull Urban Micro Environment (UMi)
bull Indoor Hotspot (InH) Environment
bull Urban Macro Environment (UMa)
bull Penetration loss
5G Channel Model Specific Topics
11
Urban Micro Environment Channel Characteristics
12
Measurement Campaigns by multiple groups 2 GHz ~ 73 GHz
bull NokiaAalborg (2 10 18 GHz) Qualcomm (29 29 GHz) CMCC (6 GHz) IntelHHI (10 60 GHz) docomo (26 37 GHz) SamsungKAIST (28 GHz) KT (28 GHz) Huawei (28 72 73 GHz) NYU (28 73 GHz) Aalto Univ (60 GHz)
Urban Micro (UMi) ndash Street Canyon Environment
TX
TX
RX
TX View
TX View
RX
TX
RX
TX
RX
13
LoS Probability (based on Ray-tracing) ndash Street Canyon
0 50 100 150 200 250 3000
01
02
03
04
05
06
07
08
09
1
Distance [2D] (m)
Lo
S P
rob
ab
ility
LoS Probability UMi
UMi Street-Canyon data (based on ray-tracing)
3GPP UMi model (d1=18 d2=36) RMSE = 0023
Fitted (d1d2) model (d1=20 d2=39) RMSE = 0001
NYU squared model (d1=22 d2=100) RMSE = 0026
NYU Campus Manhattan
TX
TX
Tokyo Downtown
Fitted (d1d2) model based on 3GPP ITU Model
NYU Squared model proposed by NYU
Current model used in 3GPP ITU
Ray-Tracing Simulations
Models d1 d2 MSE
3GPP UMi 18 36 0023
d1d2 model 20 39 0001
NYU (squared) 22 100 0026
Current model has small error over all distances LoS probability seems no frequency dependent
14
Pathloss model based on multiple measurement campaigns
bull LoS model ndash well matched to Friisrsquo free-space pathloss model
bull NLoS model ndash pathloss slope range (n asymp 3~4) similar to lower-band below 6 GHz
Large-scale Propagation Model Pathloss Shadow Fading
Single-Slope Pathloss Model
Baseline Model CI model (LoS) CI --γ model (NLoS)
Valid freq [GHz]
Validity dist [m]
n (CI)
[dB] γ σSF [dB] [min ~ max] [min ~ max]
Street Canyon
LoS 198 NA
31
2 ~ 73
5~221
NLoS CI 319 82
10~959 ABG 348 2102 234 78
Open Square
LoS 185 NA
42
2 ~ 60
6~88
NLoS CI 289 71
8~605 ABG 414 366 243 70
15
Baseline LoS Model CI model Baseline NLoS Model CI model and --γ model
Shadow Fading Model fixed SF model distance-dependent SF model is considered with further analysis
UMi Pathloss Model Street-Canyon Single-Slope Model
Pathloss Exponent = 198
16
Dual-sloped pathloss observed based on ray-tracing simulation still requires more analysis bull The median-values of pathloss has different slope in near far region
bull Due to different propagation characteristics in mmWave severe diffraction loss reflection-dominant propagation
UMi Pathloss Model Street-Canyon Dual-slope Model
1st slope well matched up to 200m range 2nd slope of pathloss appeared over 150 m
Severe diffraction loss penetration loss Mostly reflected paths in NLoS no twice-penetrated paths In far area (over 150 m) the effect of diffracted path is dominant after several reflections
102
0
01
02
03
04
05
06
07
08
09
1
Distance (m)
Pro
babili
ty o
f th
e S
trongest
Ray
Diffraction+Reflection
Diffraction Only
Reflection OnlyReflection
Dominant Area
17
Based on the WINNER-like ITU3GPP model SCM model extended for mmWave band
Developimplement additional features of higher frequency on baseline model
Fast-fading Channel Extension of Stochastic Channel Model
Baseline Model ndash Extension of the current SCM model
- Reuse the framework of doublendashdirectional channel model
in standardization [ITU-R M2135 3GPP TR36873]
- Parameter extraction from Measurement Ray-tracing
simulation over many frequencies
[Ongoing] Modular Approach added on Baseline Model New features can be activated for some scenarios
- Blockage model from moving vehicles human body
- Geometry-induced additional loss in dense urban street-canyon
- Spatial-consistency for Massive MIMO MU-MIMO
[1] S Hur S Baek B Kim Y Chang A Molisch T Rappaport K Haneda and J Park Proposal on Millimeter-Wave Channel Modeling for 5G Cellular System under review IEEE JSTSP May 2015 [2] M Samimi and T Rappaport Local Multipath Model Parameters for Generating 5G Millimeter-Wave 3GPP-like Channel Impulse Response will be presented in EuCAPrsquo2016 April 2016
18
Delay angular spreads are frequency dependent
bull Smaller DSAS in higher frequency due to highly directional characteristics
bull Measurement and ray-tracing simulation used for extraction of large-scale parameters
Fast-fading Model Preliminary Channel Model Parameters
28 GHz1 73 GHz2
LoS NLoS LoS NLoS
Delay spread (σDS)
log10(seconds)
μDS -870 -739 -771 -752
εDS 054 031 034 050
AoA spread (σASA)
log10(degrees)
μASA -049 142 169 145
εASA 093 029 027 032
AoD spread (σASD)
log10(degrees)
μASD -040 082 128 132
εASD 107 038 050 038
ZoA spread (σZSA)
(degrees)
μZSA -140 069 060 053
εZSA 109 040 009 015
ZoD spread (σZSD)
(degrees)
μZSD -125 -021 NA 046
εZSD 004 030 NA 018
Delay distribution Exponential distribution
AoD and AoA distribution Laplacian distribution Uniform [0 360]
ZoD and ZoA distribution Laplacian distribution Gaussian distribution
Delay scaling parameter 442 482 390 310
DSASDASA in smaller ranges as frequency increases Measurement and ray-tracing shows
- Mean of RMS delay spread asymp 50 ns (28 GHz NLoS)
- Mean of AS of arrival asymp 30 deg (28 GHz NLoS)
Extract large-scale parameters in SCM framework 28 GHz (Samsung) and 73 GHz (NYU WIRELESS)
0 20 40 60 80 100 120 140 160 1800
01
02
03
04
05
06
07
08
09
1
RMS Delay Spread [ns]
Cu
mu
lative
Dis
trib
utio
n F
un
ctio
n (
CD
F)
Daejeon 28GHz Urban NLoS
Measurement
Ray-Tracing
0 20 40 60 800
01
02
03
04
05
06
07
08
09
1
Azimuth Angle spread [deg]
Cu
mu
lativ
e D
istr
ibu
tion
Fu
nctio
n (
CD
F)
Daejeon 28GHz Urban NLoS
ASD Measurement
ASD Ray-Tracing
ASA Measurement
ASA Ray-Tracing
19
Indoor Hotspot Environment Channel Characteristics
Definition on Scenarios
Typical indoor office
Open ceiling (in the middle)
Corridor
Open ceiling
(Open space in 1st floor)
Shop
Typical shopping mall
Considering the possibility of carrying 80 of the MBB traffic typical indoor
hotspot deployment scenarios are worthy of careful investigation
Measurement Campaign for InH
Contributor Scenario Frequency band (GHz)
Aalto University Shopping mall LOSNLOS 28 60
CMCC Indoor office LOSNLOS 14 28
DOCOMO Indoor office LOS 20
Ericsson Indoor office LOSNLOS 244 58 148 60
Huawei Indoor office LOSNLOS 73 28
Nokia Shopping mall O2I 2 10 18
NYU Indoor office LOSNLOS 28 73
Qualcomm Indoor office Shopping mall LOSNLOS 29 29 61
Samsung Shopping mall LOSNLOS 28
Ray tracing simulation is also important tools for investigating the LOS probability and channel characteristics validation especially when measurement data is not available
In LOS conditions multiple reflections from walls floor and ceiling give rise to
waveguiding Measurements in both office and shopping mall scenarios show that
path loss exponents based on a 1 m free space reference distance are typically
below 2 leading to more favorable path loss than predicted by Friisrsquo free space loss
formula The strength of the waveguiding effect is variable and the path loss
exponent appears to increase very slightly with increasing frequency possibly due to
the relation between the wavelength and surface roughness
Measurements of the small scale channel properties such as angular spread and
delay spread have shown remarkable similarities between channels over a very wide
frequency range It appears as if the main multipath components are present at all
frequencies though with some smaller variations in amplitudes
Recent work shows that polarization discrimination ranges between 15 and 25 dB
for indoor millimeter wave channels [Karttunen EuCAP2015] with greater
polarization discrimination at 73 GHz than at 28 GHz [MacCartney 2015]
InH Channel Characteristics
Three types of typical indoor office scenarios were investigated with ray tracing bull Open plan office bull Closed plan office bull Hybrid office including both open and closed areas
LOS probability (12)
0 5 10 15 20 25 30 35 40 45 500
5
10
15
20
Open planed area (cubic)
Closed office amp meeting room
Transmitter
Open plan office Closed plan office Hybrid office
Source Ericsson Source Ericsson Source Aalto
40
m
75
mRo
om
he
igh
t 2
68
m
Source Huawei
Source Qualcomm
LOS probability (22)
Model Original UpdatedNew MSE
ITU 00499
WINNERII B3
00572
WINNER II A1
00473
New model NA 00449
89 170
8911 )94)1(exp(
11 1
d
dd
d
PLOS
1 )49)1(exp(
1 1
dd
dPLOS
The modeling results for four models are approaching to the averaged LOS probability samples
The LOS probability model used in ITU IMT-Advanced evaluation and WINNER II are also presented here for comparison
The influence of data set from different types of office scenarios open or closed have been merged
The results show that the new model has a good fit to the data in an average sense and can be used for 5G InH
scenarios evaluation
56 320)632)56(exp(
5621 )74)21(exp(
21 1
dd
dd
d
PLOS0 10 20 30 40 50 60 70
0
01
02
03
04
05
06
07
08
09
1
distance(m)
LO
S p
robability
Huawei hybrid office
Qualcomm hybrid office
Ericsson open office
Ericsson corridor
Ericsson room
Aalto corridor
Aalto room
Averaged LOS Prob
ITU Model
WINNER Model B3
WINNER Model A1
New model
62 )))(10log40161(1(901
62 1
313 dd
dPLOS
3750
37182718exp
181
d
dd
d
PLOS
10 )45)10(exp(
10 1
dd
dPLOS
52 )))(10log610241(1(901
52 1
313 dd
dPLOS
For LOS
Due to strong reflections from walls
ceiling and floor wave guide
propagation can be observed for both
indoor office and shopping mall
For NLOS
Propagation path loss can be modeled
with dual PL slopes along with the
propagation distance
Frequency dependency higher than free
space can be observed for both
scenarios
Single-slope model is FFS
Shadowing Distance dependency of shadowing can
be observed in measurement on some
frequency band But it is still FFS
Path Loss Modeling (13)
100
101
102
-5
0
5
10
15
20
25
30
35
40
Distance (m)
Excess L
oss b
ased o
n P
L_d0 (
dB
)
244GHz samples
29GHz samples
58GHz samples
148GHz samples
20GHz samples
28GHz Huawei samples
28GHz NYU samples
29GHz samples
60GHz samples
73GHz Huawei samples
73GHz NYU samples
freespace PL
modeling results(Zone2)
100
101
102
100
101
102
20
40
60
80
100
120
140
160
Distance(m)Frequency(GHz)
Path
loss(d
B)
244GHz samples
29GHz samples
58GHz samples
148GHz samples
28GHz Huawei samples
28GHz NYU samples
29GHz samples
60GHz samples
73GHz Huawei samples
73GHz NYU samples
model results
100
101
102
-10
0
10
20
30
40
50
Distance (m)
Excess L
oss b
ased o
n P
L_d0 (
dB
)
29GHz samples
28GHz samples
285GHz samples
29GHz samples
61GHz samples
63GHz_I samples
63GHz_II samples
63GHz_III samples
model results
freespace plane
Ind
oo
r o
ffic
e
Sh
op
pin
g m
all
LOS NLOS
LOS NLOS
100
101
102
100
101
102
20
40
60
80
100
120
140
160
Distance(m)Frequency(GHz)
Path
loss(d
B)
29GHz samples
28GHz samples
285GHz samples
29GHz samples
61GHz samples
63GHz_I samples
63GHz_II samples
63GHz_III samples
model results
For LOS CI model can be adopted
For NLOS dual-slope ABG and CIF model can be adopted as two options
Single slope model is FFS
Option 1 ABG
Option 2 CIF w Free Space Path Loss (FSPL) reference 1 m
and
and fo is the avg center frequency of input data (K =number of unique frequencies Nk is path loss data points at kth frequency fk)
Path Loss Modeling (23)
Xm
dnmfdBdfPLLOS
1log10)1(FSPL])[( 10
BP
BP
BP
BP
ABG
Dual ddd
dfd
ddfd
dPL )(log10)(10log10)(log10
1 )(10log10)(log10
)(1021101
1101
BP
BP
BP
BP
CIFDual
ddd
d
f
ffbn
m
d
f
ffbnmfFSPL
ddm
d
f
ffbnmfFSPL
dPL
)(log110)1
(log110)1(
1 )1
(log110)1(
)(
10
0
02210
0
011
10
0
011
K
k K
K
k Kk
N
Nff
1
10
Path Loss Modeling (33)
Scenario CICIF Model Parameters ABG Model Parameters
Indoor office LOS n=173 σ= 302 dB NA
Indoor office NLoS
dual slope
n1=251 b1=012 f0= 241 GHz n2=425 b2=004
dBP = 78 m σ=765 dB
1=17 1=330 =249 dBP = 690 m 2=417
σ= 778 dB
Shopping Mall LoS n=173 σ= 201 dB NA
Shopping Mall NLoS dual slope n1=243 b1=-001 f0= 395 GHz n2=836 b2=039
dBP = 110 m σ=626 dB
1=29 1=2217 =224 dBP = 1470 m
2=1147 σ=636 dB
Indoor office NLoS
single slope (FFS) n=319 b=006 f0= 242 GHz σ=829 dB =383 =1730 =249 σ=803 dB
Shopping Mall NLoS
single slope (FFS) n=259 b=001 f0= 395 GHz σ=740 dB =321 =1809 =224 σ=697 dB
Frequency dependency on rms DS
In some measurment campaign delay spread
show similarity over a very wide frequency range
While in some other measurement campaign
some frequency dependency can be observed
Bandwidth dependency on rms
DS
In some measurement campaign bandwidth
dependency can observed considering the
possibility of large variance on the system
bandwidth may be adopted for above 6GHz
system
Delay Spread
DS based on measurement on
58 148 60GHz (Ericsson)
DS based on measurement on 29 29 61GHz
(Qualcomm)
0 05 1 15 20
20
40
60
80
100
y = 612exp(-171x)+778
Bandwidth [GHz]
De
lay
Sp
rea
d [
ns
]
Delay Spread evolving fitting
73G NLOS DS per cluster
73G NLOS fitted curve
12ns500M75ns2G
85ns10M
DS based on measurement on
73GHz (Huawei)
Polarization has been investigated based on
measurement on 28GHz 60GHz and 73GHz
If based on 3GPP XPR model XPR can be
decribed in table below It is still need further
investigation on the frequency dependency on
the XPR
Polarization Modeling
TX Azimuth [deg]
RX
Azi
mut
h [deg
]
HH
-90 -60 -30 0 30 60 90
-180
-135
-90
-45
0
45
90
135
TX Azimuth [deg]
RX
Azi
mut
h [deg
]
HV
-90 -60 -30 0 30 60 90
-180
-135
-90
-45
0
45
90
135
TX Azimuth [deg]
RX
Azi
mut
h [deg
]
VH
-90 -60 -30 0 30 60 90
-180
-135
-90
-45
0
45
90
135
TX Azimuth [deg]
RX
Azi
mut
h [deg
]
VV
-90 -60 -30 0 30 60 90
-180
-135
-90
-45
0
45
90
135-40
-35
-30
-25
-20
-15
-10
-5
0
Polarization measurement on 73GHz (Huawei)
Polarization measurement on 28GHz and 60GHz (Aalto Univ)
文档名称 文档密级
28GHz 60 GHz 73GHz
Scenario Shopping mall Shopping mall Indoor office
LOS NLOS LOS NLOS Hybrid
XPR (dB)
XPR 1612 1448 1685 1606 11
XPR
622 626 662 534 65
Preliminary results on polarization modeling
For InH scenarios fast fading channel
characteristics have been investigated based on
both measurement and ray-tracing
Both indoor office and shopping mall
environments have been investigated at
frequencies including 20 GHz 28 GHz 60GHz
and 73 GHz
Some preliminary analysis on large-scale channel
characteristics have been collected in table on the
right
Although it is still too early to apply these results to
the full frequency range up to 100 GHz these
preliminary investigations have provided insight into
the difference induced by the largely extended
frequency range
Collection of Results
1 From DOCOMO based on measurement
2 From Aalto University based on measurement
3 From NokiaNYU based on ray-tracing
4 From Huawei based on measurement
文档名称 文档密级
20 GHz1 28GHz2 60 GHz2 73GHz3 73GHz4
Scenario Indoor office Shopping mall Shopping mall Indoor office Indoor office
LOS LOS NLOS LOS NLOS Hybrid Hybrid
Delay spread ()
log10
(seconds)
DS -733 -752 -759 -762 -745 -81 NA
DS
01 017 033 020 011 04 NA
Delay distribution NA Exponential Exponential NA
AoA spread (ASA
) log
10(degrees)
ASA
NA 154 157 150 160 16 NA
ASA
NA 016 018 016 015 037 NA
AoD spread (ASD
) log
10(degrees)
ASD
18 144 168 143 172 15 NA
ASD
009 016 019 010 008 026 NA
ZoA spread (ZSA
)
(degrees)
ZSA NA 087 068 086 067 -0025d+118 NA
ZSA
NA 045 031 040 023 030 NA
ZoD spread (ZSD
)
(degrees)
ZSD 0 075 095 074 088 -0040d+145 NA
ZSD
048 034 022 030 020 033 NA
AoD and AoA distribution NA Wrapped Gaussian Uniform NA
ZoD and ZoA distribution NA Laplacian Laplacian NA
XPR (dB)
XPR NA 1612 1448 1685 1606 15 11
XPR
NA 622 626 662 534 2 65
LOS Ricean K
factor (dB)
K NA -018 NA -107 NA 8 NA
K NA 285 NA 358 NA 3 NA
31
Urban Macro Environment Channel Characteristics
32
Access points on or above rooftops (25-35 m high) cell radii gt= 200 m
Outdoor-to-outdoor and outdoor-to-indoor (UEs from 15-225 m)
UMa characteristics
bull LOS path loss close to free space
bull NLOS path loss minus free-space path loss at 1 m is very similar across frequency
bull Reflections likely dominate not diffraction
bull Delay and angle spreads appear to decrease with frequency
bull XPR decreases with frequency according to ray tracing but measurements have yet to verify this finding
5G UMa Environment
33
Aalborg University 2 10 18 28 GHz measurements bull 20 m and 25 m high Txrsquos
Ericsson data at 28 GHz bull Lindholmen (25 m high) bull Molndal (46 m high)
NYU 38 GHz measurements Austin Tx
Samsung 28 GHz ray-tracing data Ottawa and NYU-campus bull 23-35 m high Tx bull Only data with path loss lt= 100 dB minus FSPL(1 m) are used
Nokia 2 56 10 18 28 393 and 735 GHz ray tracing data bull Same environment as Aalborg data bull Only data with path loss lt= 100 dB minus FSPL(1 m) are used bull Data not used for path loss and LOS probability since it would be redundant with the Aalborg measured
data
UMa Available Data
34
UMa reuse 3GPP definition
bull Good match to new measurements
bull Also already has 3-D UE placement
)(11118
min)( 6363UT
dd hdCeed
dp
mhdg
h
mh
hdCUT
UT
UT
UT2313)(
10
13
130
)(51
md
otherwise
ddedg 18
0
150exp)251()(
26
0 100 200 300 400 500 6000
01
02
03
04
05
06
07
08
09
1
Distance (m)
LO
S p
robabili
ty
Data
3GPP UMa
d1d2 model
NYU (squared) model
Other LOS probability models only slightly improve match to data over 3GPP model
LOS Probability Findings
35
In all models d is distance f is frequency X is shadow fading Gaussian RV (dB)
Close-in (CI) reference distance path loss model
Alpha-Beta-Gamma (ABG) path loss model
CICI Xm
dnmfdBdf
1log10)1(FSPL])[(PL 10
FSPL( f 1m) = 20log10
4p f
c
aelig
egraveccedil
ouml
oslashdivide
ABGABG XGHz
f
m
ddBdf
1log10
1log10])[(PL 1010
Scenario CI Model Parameters ABG Model Parameters
UMa- LoS n=20 SF = 41 dB NA
UMa-nLoS n=30 SF = 68 dB =34 =192 =23 SF = 65 dB
Proposed UMa Path Loss and Shadow Fading Models (Single Slope)
36
14 16 18 20 22 24 26 28 30
40
50
60
70
80
90
100
10log10(d)
Path
loss m
inus F
SP
L(d
0=
1 m
) (d
B)
CI
ABG 2 GHz
ABG 28 GHz
ABG 100 GHz
3GPP UMa
NLOS UMa PL Models Compared to 3GPP UMa Model
37
These parameters found using the ray-tracing results in the Aalborg environment
56 GHz 10 GHz 18 GHz 28 GHz 393 GHz 735 GHz
Delay spread (st)
log10(seconds)
mDS -675 -680 -685 -688 -689 -691
eDS 068 088 078 073 073 069
AoA spread (sASA)
log10(degrees)
mASA 134 114 114 115 114 109
eASA 081 114 101 094 091 087
AoD spread (sASD)
log10(degrees)
mASD 087 067 074 075 078 082
eASD 081 135 105 116 106 093
ZoA spread (sZSA)
log10(degrees)
mZSA 048 031 026 026 024 020
eZSA 075 092 085 081 081 079
ZoD spread (sZSD)
log10(degrees)
mZSD -026 -024 -022 -022 -020 -016
eZSD 070 074 078 081 082 083
Shadow fading (dB) 982 1022 1028 1012 1014 997
Delay distribution Exponential Exponential Exponential Exponential Exponential Exponential
AoD and AoA distribution Laplacian Laplacian Laplacian Laplacian Laplacian Laplacian
ZoD and ZoA distribution Laplacian Laplacian Laplacian Laplacian Laplacian Laplacian
Delay scaling parameter TBD TBD TBD TBD TBD TBD
XPR (dB) mXPR 1387 1294 1097 1076 938 789
sXPR 612 636 680 657 660 638
Preliminary UMa NLOS Large-Scale Parameters (LSPs)
38
LOS path loss is very close to free space
NLOS path loss minus free-space path loss at 1 m (FSPL(1 m)) shows very little change across frequency
bull Aalborg data taken at 2 10 and 18 GHz in the same environment shows
bull Path loss minus FSPL(1 m) increases from 2 to 10 GHz but decreases from 10 to 18 GHz
bull Additional loss from 2 to 10 GHz may be due to diffraction loss and after 10 GHz (where diffraction is no longer a dominant channel effect) there may be a slight increase in reflectivity in the environment
bull More measurements are needed to confirm a linear trend of path loss minus FSPL (1 m) with the log of frequency (as modeled in the ABG model)
Delay and angle spreads tend to decrease with frequency
Although not shown elevation angle spreads and biases at both the Tx and Rx will have a distance dependence
XPR appears to decrease with frequency in ray-tracing results due to diffuse scattering model but measurements have yet to verify this trend
Summary of UMa Trends
39
Building penetration loss
40
Sources [Rodriguez VTC Fall 2014]
[Zhao 2013] and measurements
contributed by Samsung and Nokia
Material penetration loss
41
Most buildings have facades made up of multiple materials
bull Windows concrete brick wood
Very close to the external wall the loss characteristics of a single material may dominate
Further into the building the combined loss of multiple materials is experienced
Building penetration loss
42
Buildings with standard glass have lower loss than buildings with IRR glass
bull Non-linear dependence vs frequency
For comparison models from [Semaan Globecom 2014] are plotted
bull Low loss model 30 glass 70 concrete
bull High loss model 70 IRR glass 30 concrete
Other models have also been proposed see [5GCM white paper]
Building penetration Measurements
Sources [Larsson EuCAP 2014] and
measurements contributed by Qualcomm
NTT DOCOMO and Ericsson
43
Incidence angle to external wall
bull Loss increases by up to 15-20 dB for grazing incidence
Multiple internal reflections in material
bull Causes frequency-dependent constructive or destructive interference
Additional loss due to internal walls furniture people etc
bull Typically in the order 02-2 dBm with weak frequency dependence
Additional considerations
44
Building penetration loss tends to increase with frequency
bull Quantified through measurements over a large frequency range
bull Highly variable losses due to differences among building materials
bull IRR coated glass has high loss even at low frequencies
More details and further model proposals described in the white paper
Conclusions
45
[5GCM white paper] A Ghosh ed ldquo5G channel model for bands up to 100 GHzrdquo Globecom 2015 Available for download via httpwww5gworkshopscom5GCMhtml
[Zhao 2013] H Zhao et al28 GHz millimeter wave cellular communication measurements for reflection and penetration loss in and around buildings in New York city in 2013 IEEE International Conference on Communications (ICC) pp 5163-5167 9-13 June 2013
[Rodriguez VTC Fall 2014] I Rodriguez H C Nguyen N T K Jorgensen T B Sorensen and P Mogensen Radio Propagation into Modern Buildings Attenuation Measurements in the Range from 800 MHz to 18 GHz in Proc of IEEE Vehicular Technology Conference (VTC fall) 2014 pp 1-5
[Larsson EuCAP 2014] C Larsson F Harrysson B-E Olssson and J-E Berg An outdoor-to-indoor propagation scenario at 28 GHz in Proc of European Conference on Antennas and Propagation (EuCAP) 2014 pp 3301-3304
[Semaan Globecom 2014] E Semaan F Harrysson A Furuskaumlr and H Asplund Outdoor-to-indoor coverage in high frequency bands Globecom Workshops 2014 pp 393-398
References

5
Identify Statusexpectation of existing information on high frequencies bull Existingongoing channel
measurementsmodeling activities bull Deployment scenarios and their
prioritization bull Spectrum bands of interests bull Additional features to be considered for
new model
5G channel model development bull Details of the deployment scenarios bull Pathlossshadowing bull LOS probability bull Small-scale fading bull Additional features required (eg Larger
band support blockage loss probability additional loss spatial consistency support of 3D beamforming with large array etc)
Oct 2015 Jun 2016 Dec 2015
(Ref) RP-151606 ndash New SID Proposal Study on channel model for frequency spectrum above 6 GHz
Channel modeling study has been initiated in 3GPP Objective Develop a channel model to enable a study on feasibility and
framework of 5G using high frequency spectrum of 6-100 GHz
Study on 5G Channel Model in 3GPP
6
6 - 20 GHz 20 - 30 GHz 30 - 60 GHz gt 60 GHz
UMi
Aalto Univ CMCC Ericsson IntelFraunhofer HHI NokiaAalborg NTT DOCOMO Orange
ATampT Aalto Univ CMCC Huawei IntelFraunhofer HHI NokiaAalborg NTT DOCOMO NYU Qualcomm Samsung CATT KT ETRI ITRICCU ZTE
ATampT Huawei IntelFraunhofer HHI NTT DOCOMO Qualcomm CATT ETRI ITRICCU ZTE
ATampT Aalto Univ Huawei IntelFraunhofer HHI NYU
UMa CMCC NokiaAalborg NokiaAalborg NYU
Indoor
Aalto Univ CMCC Ericsson Huawei IntelFraunhofer HHI NokiaAalborg NTT DOCOMO Orange
ATampT Alcatel-Lucent Aalto Univ BUPT CMCC Huawei IntelFraunhofer HHI NokiaAalborg NTT DOCOMO NYU Qualcomm Samsung CATT KT ETRI ITRICCU ZTE
ATampT Ericsson Huawei IntelFraunhofer HHI NTT DOCOMO NYU Qualcomm CATT ETRI ITRICCU ZTE
ATampT Aalto Univ Huawei IntelFraunhofer HHI NYU
O2I
Ericsson Huawei IntelFraunhofer HHI NokiaAalborg NTT DOCOMO Orange
ATampT Alcatel-Lucent Ericsson Huawei IntelFraunhofer HHI KT NTT DOCOMO NYU Samsung
ATampT Ericsson Huawei IntelFraunhofer HHI NTT DOCOMO
ATampT Huawei IntelFraunhofer HHI
Many companies and academia conducted measurement campaigns for 5G channel modeling
Efforts for 5G Channel Measurements and Modeling
7
White Paper titles ldquo5G Channel Model for bands up to 100 GHzrdquo put on this workshop website httpwww5gworkshopscom was developed by below parties to facilitate development of new channel models for spectrum bands ranging from 6 GHz to 100 GHz
bull Aalto University BUPT CMCC Ericsson Huawei Intel KT Corporation Nokia NTT DOCOMO New York University Qualcomm Samsung University of Bristol and University of Southern California
The White Paper was developed based on extensive measurement and ray tracing results across a multitude of bands conducted by the parties
The White Paper has been submitted or will be submitted to standardization forums such as 3GPP and relevant organizations to support their channel modeling activities
The White Paper will be updated to cover remaining aspects such as details on fast fading models and clustering
White Paper on 5G Channel Model for bands up to 100 GHz
8
It is highly preferable that the new model be based on the existing 3GPP 3D channel model bull Extensions should cater to 5G modeling requirements and scenarios
The new model should be bull Sufficiently accurate for the purposes of 5G evaluation
bull No more complex than it is necessary
Other considerable requirements
New channel model (Ref) 3GPP 3D channel model
Scenario 5G scenarios UMi and UMa
Frequency range Up to 100 GHz Up to 6 GHz
Bandwidth Up to 2 GHz Up to 100 MHz
Support of large antenna array
Finer angular resolution around 1 deg etc NA
Mobility Up to 350 kmh Suitability for dual mobility (D2DV2V)
Up to 350 kmh
Spatialtemporalfrequency consistency
Spatial consistency inter-site correlation correlation among bands LOSNLOS state etc ()
Partly supported (eg spatial consistency of LSPs with fixed BS)
() These features could possibly be optional for simpler studies
Modeling Approaches and Requirements
9
UMi ndash Street canyon Urban micro-cellular environment with BSs below rooftop level UMi ndash Open area Urban micro-cellular environment with BSs below rooftop level and pointing
towards open area UMa Urban macro-cellular environment with BSs above rooftop level Indoor ndash Office Typical office environment comprised of open and closed areas Indoor ndash Shopping mall Large multiple-story building with open ceiling in the middle
UMi ndash Open area
Hachiko-mae Tokyo
Indoor ndash Office Indoor ndash Shopping mall
UMi ndash Street canyon UMa
5th avenue New York
Both of outdoor-to-outdoor (O2O) and outdoor-to-indoor (O2I) are considered for UMi and UMa scenarios
Approx 50 m
Typical 5G Deployment Scenarios
10
The following slides provide describe the following (covered in more detail in [5GCM white paper])
bull Urban Micro Environment (UMi)
bull Indoor Hotspot (InH) Environment
bull Urban Macro Environment (UMa)
bull Penetration loss
5G Channel Model Specific Topics
11
Urban Micro Environment Channel Characteristics
12
Measurement Campaigns by multiple groups 2 GHz ~ 73 GHz
bull NokiaAalborg (2 10 18 GHz) Qualcomm (29 29 GHz) CMCC (6 GHz) IntelHHI (10 60 GHz) docomo (26 37 GHz) SamsungKAIST (28 GHz) KT (28 GHz) Huawei (28 72 73 GHz) NYU (28 73 GHz) Aalto Univ (60 GHz)
Urban Micro (UMi) ndash Street Canyon Environment
TX
TX
RX
TX View
TX View
RX
TX
RX
TX
RX
13
LoS Probability (based on Ray-tracing) ndash Street Canyon
0 50 100 150 200 250 3000
01
02
03
04
05
06
07
08
09
1
Distance [2D] (m)
Lo
S P
rob
ab
ility
LoS Probability UMi
UMi Street-Canyon data (based on ray-tracing)
3GPP UMi model (d1=18 d2=36) RMSE = 0023
Fitted (d1d2) model (d1=20 d2=39) RMSE = 0001
NYU squared model (d1=22 d2=100) RMSE = 0026
NYU Campus Manhattan
TX
TX
Tokyo Downtown
Fitted (d1d2) model based on 3GPP ITU Model
NYU Squared model proposed by NYU
Current model used in 3GPP ITU
Ray-Tracing Simulations
Models d1 d2 MSE
3GPP UMi 18 36 0023
d1d2 model 20 39 0001
NYU (squared) 22 100 0026
Current model has small error over all distances LoS probability seems no frequency dependent
14
Pathloss model based on multiple measurement campaigns
bull LoS model ndash well matched to Friisrsquo free-space pathloss model
bull NLoS model ndash pathloss slope range (n asymp 3~4) similar to lower-band below 6 GHz
Large-scale Propagation Model Pathloss Shadow Fading
Single-Slope Pathloss Model
Baseline Model CI model (LoS) CI --γ model (NLoS)
Valid freq [GHz]
Validity dist [m]
n (CI)
[dB] γ σSF [dB] [min ~ max] [min ~ max]
Street Canyon
LoS 198 NA
31
2 ~ 73
5~221
NLoS CI 319 82
10~959 ABG 348 2102 234 78
Open Square
LoS 185 NA
42
2 ~ 60
6~88
NLoS CI 289 71
8~605 ABG 414 366 243 70
15
Baseline LoS Model CI model Baseline NLoS Model CI model and --γ model
Shadow Fading Model fixed SF model distance-dependent SF model is considered with further analysis
UMi Pathloss Model Street-Canyon Single-Slope Model
Pathloss Exponent = 198
16
Dual-sloped pathloss observed based on ray-tracing simulation still requires more analysis bull The median-values of pathloss has different slope in near far region
bull Due to different propagation characteristics in mmWave severe diffraction loss reflection-dominant propagation
UMi Pathloss Model Street-Canyon Dual-slope Model
1st slope well matched up to 200m range 2nd slope of pathloss appeared over 150 m
Severe diffraction loss penetration loss Mostly reflected paths in NLoS no twice-penetrated paths In far area (over 150 m) the effect of diffracted path is dominant after several reflections
102
0
01
02
03
04
05
06
07
08
09
1
Distance (m)
Pro
babili
ty o
f th
e S
trongest
Ray
Diffraction+Reflection
Diffraction Only
Reflection OnlyReflection
Dominant Area
17
Based on the WINNER-like ITU3GPP model SCM model extended for mmWave band
Developimplement additional features of higher frequency on baseline model
Fast-fading Channel Extension of Stochastic Channel Model
Baseline Model ndash Extension of the current SCM model
- Reuse the framework of doublendashdirectional channel model
in standardization [ITU-R M2135 3GPP TR36873]
- Parameter extraction from Measurement Ray-tracing
simulation over many frequencies
[Ongoing] Modular Approach added on Baseline Model New features can be activated for some scenarios
- Blockage model from moving vehicles human body
- Geometry-induced additional loss in dense urban street-canyon
- Spatial-consistency for Massive MIMO MU-MIMO
[1] S Hur S Baek B Kim Y Chang A Molisch T Rappaport K Haneda and J Park Proposal on Millimeter-Wave Channel Modeling for 5G Cellular System under review IEEE JSTSP May 2015 [2] M Samimi and T Rappaport Local Multipath Model Parameters for Generating 5G Millimeter-Wave 3GPP-like Channel Impulse Response will be presented in EuCAPrsquo2016 April 2016
18
Delay angular spreads are frequency dependent
bull Smaller DSAS in higher frequency due to highly directional characteristics
bull Measurement and ray-tracing simulation used for extraction of large-scale parameters
Fast-fading Model Preliminary Channel Model Parameters
28 GHz1 73 GHz2
LoS NLoS LoS NLoS
Delay spread (σDS)
log10(seconds)
μDS -870 -739 -771 -752
εDS 054 031 034 050
AoA spread (σASA)
log10(degrees)
μASA -049 142 169 145
εASA 093 029 027 032
AoD spread (σASD)
log10(degrees)
μASD -040 082 128 132
εASD 107 038 050 038
ZoA spread (σZSA)
(degrees)
μZSA -140 069 060 053
εZSA 109 040 009 015
ZoD spread (σZSD)
(degrees)
μZSD -125 -021 NA 046
εZSD 004 030 NA 018
Delay distribution Exponential distribution
AoD and AoA distribution Laplacian distribution Uniform [0 360]
ZoD and ZoA distribution Laplacian distribution Gaussian distribution
Delay scaling parameter 442 482 390 310
DSASDASA in smaller ranges as frequency increases Measurement and ray-tracing shows
- Mean of RMS delay spread asymp 50 ns (28 GHz NLoS)
- Mean of AS of arrival asymp 30 deg (28 GHz NLoS)
Extract large-scale parameters in SCM framework 28 GHz (Samsung) and 73 GHz (NYU WIRELESS)
0 20 40 60 80 100 120 140 160 1800
01
02
03
04
05
06
07
08
09
1
RMS Delay Spread [ns]
Cu
mu
lative
Dis
trib
utio
n F
un
ctio
n (
CD
F)
Daejeon 28GHz Urban NLoS
Measurement
Ray-Tracing
0 20 40 60 800
01
02
03
04
05
06
07
08
09
1
Azimuth Angle spread [deg]
Cu
mu
lativ
e D
istr
ibu
tion
Fu
nctio
n (
CD
F)
Daejeon 28GHz Urban NLoS
ASD Measurement
ASD Ray-Tracing
ASA Measurement
ASA Ray-Tracing
19
Indoor Hotspot Environment Channel Characteristics
Definition on Scenarios
Typical indoor office
Open ceiling (in the middle)
Corridor
Open ceiling
(Open space in 1st floor)
Shop
Typical shopping mall
Considering the possibility of carrying 80 of the MBB traffic typical indoor
hotspot deployment scenarios are worthy of careful investigation
Measurement Campaign for InH
Contributor Scenario Frequency band (GHz)
Aalto University Shopping mall LOSNLOS 28 60
CMCC Indoor office LOSNLOS 14 28
DOCOMO Indoor office LOS 20
Ericsson Indoor office LOSNLOS 244 58 148 60
Huawei Indoor office LOSNLOS 73 28
Nokia Shopping mall O2I 2 10 18
NYU Indoor office LOSNLOS 28 73
Qualcomm Indoor office Shopping mall LOSNLOS 29 29 61
Samsung Shopping mall LOSNLOS 28
Ray tracing simulation is also important tools for investigating the LOS probability and channel characteristics validation especially when measurement data is not available
In LOS conditions multiple reflections from walls floor and ceiling give rise to
waveguiding Measurements in both office and shopping mall scenarios show that
path loss exponents based on a 1 m free space reference distance are typically
below 2 leading to more favorable path loss than predicted by Friisrsquo free space loss
formula The strength of the waveguiding effect is variable and the path loss
exponent appears to increase very slightly with increasing frequency possibly due to
the relation between the wavelength and surface roughness
Measurements of the small scale channel properties such as angular spread and
delay spread have shown remarkable similarities between channels over a very wide
frequency range It appears as if the main multipath components are present at all
frequencies though with some smaller variations in amplitudes
Recent work shows that polarization discrimination ranges between 15 and 25 dB
for indoor millimeter wave channels [Karttunen EuCAP2015] with greater
polarization discrimination at 73 GHz than at 28 GHz [MacCartney 2015]
InH Channel Characteristics
Three types of typical indoor office scenarios were investigated with ray tracing bull Open plan office bull Closed plan office bull Hybrid office including both open and closed areas
LOS probability (12)
0 5 10 15 20 25 30 35 40 45 500
5
10
15
20
Open planed area (cubic)
Closed office amp meeting room
Transmitter
Open plan office Closed plan office Hybrid office
Source Ericsson Source Ericsson Source Aalto
40
m
75
mRo
om
he
igh
t 2
68
m
Source Huawei
Source Qualcomm
LOS probability (22)
Model Original UpdatedNew MSE
ITU 00499
WINNERII B3
00572
WINNER II A1
00473
New model NA 00449
89 170
8911 )94)1(exp(
11 1
d
dd
d
PLOS
1 )49)1(exp(
1 1
dd
dPLOS
The modeling results for four models are approaching to the averaged LOS probability samples
The LOS probability model used in ITU IMT-Advanced evaluation and WINNER II are also presented here for comparison
The influence of data set from different types of office scenarios open or closed have been merged
The results show that the new model has a good fit to the data in an average sense and can be used for 5G InH
scenarios evaluation
56 320)632)56(exp(
5621 )74)21(exp(
21 1
dd
dd
d
PLOS0 10 20 30 40 50 60 70
0
01
02
03
04
05
06
07
08
09
1
distance(m)
LO
S p
robability
Huawei hybrid office
Qualcomm hybrid office
Ericsson open office
Ericsson corridor
Ericsson room
Aalto corridor
Aalto room
Averaged LOS Prob
ITU Model
WINNER Model B3
WINNER Model A1
New model
62 )))(10log40161(1(901
62 1
313 dd
dPLOS
3750
37182718exp
181
d
dd
d
PLOS
10 )45)10(exp(
10 1
dd
dPLOS
52 )))(10log610241(1(901
52 1
313 dd
dPLOS
For LOS
Due to strong reflections from walls
ceiling and floor wave guide
propagation can be observed for both
indoor office and shopping mall
For NLOS
Propagation path loss can be modeled
with dual PL slopes along with the
propagation distance
Frequency dependency higher than free
space can be observed for both
scenarios
Single-slope model is FFS
Shadowing Distance dependency of shadowing can
be observed in measurement on some
frequency band But it is still FFS
Path Loss Modeling (13)
100
101
102
-5
0
5
10
15
20
25
30
35
40
Distance (m)
Excess L
oss b
ased o
n P
L_d0 (
dB
)
244GHz samples
29GHz samples
58GHz samples
148GHz samples
20GHz samples
28GHz Huawei samples
28GHz NYU samples
29GHz samples
60GHz samples
73GHz Huawei samples
73GHz NYU samples
freespace PL
modeling results(Zone2)
100
101
102
100
101
102
20
40
60
80
100
120
140
160
Distance(m)Frequency(GHz)
Path
loss(d
B)
244GHz samples
29GHz samples
58GHz samples
148GHz samples
28GHz Huawei samples
28GHz NYU samples
29GHz samples
60GHz samples
73GHz Huawei samples
73GHz NYU samples
model results
100
101
102
-10
0
10
20
30
40
50
Distance (m)
Excess L
oss b
ased o
n P
L_d0 (
dB
)
29GHz samples
28GHz samples
285GHz samples
29GHz samples
61GHz samples
63GHz_I samples
63GHz_II samples
63GHz_III samples
model results
freespace plane
Ind
oo
r o
ffic
e
Sh
op
pin
g m
all
LOS NLOS
LOS NLOS
100
101
102
100
101
102
20
40
60
80
100
120
140
160
Distance(m)Frequency(GHz)
Path
loss(d
B)
29GHz samples
28GHz samples
285GHz samples
29GHz samples
61GHz samples
63GHz_I samples
63GHz_II samples
63GHz_III samples
model results
For LOS CI model can be adopted
For NLOS dual-slope ABG and CIF model can be adopted as two options
Single slope model is FFS
Option 1 ABG
Option 2 CIF w Free Space Path Loss (FSPL) reference 1 m
and
and fo is the avg center frequency of input data (K =number of unique frequencies Nk is path loss data points at kth frequency fk)
Path Loss Modeling (23)
Xm
dnmfdBdfPLLOS
1log10)1(FSPL])[( 10
BP
BP
BP
BP
ABG
Dual ddd
dfd
ddfd
dPL )(log10)(10log10)(log10
1 )(10log10)(log10
)(1021101
1101
BP
BP
BP
BP
CIFDual
ddd
d
f
ffbn
m
d
f
ffbnmfFSPL
ddm
d
f
ffbnmfFSPL
dPL
)(log110)1
(log110)1(
1 )1
(log110)1(
)(
10
0
02210
0
011
10
0
011
K
k K
K
k Kk
N
Nff
1
10
Path Loss Modeling (33)
Scenario CICIF Model Parameters ABG Model Parameters
Indoor office LOS n=173 σ= 302 dB NA
Indoor office NLoS
dual slope
n1=251 b1=012 f0= 241 GHz n2=425 b2=004
dBP = 78 m σ=765 dB
1=17 1=330 =249 dBP = 690 m 2=417
σ= 778 dB
Shopping Mall LoS n=173 σ= 201 dB NA
Shopping Mall NLoS dual slope n1=243 b1=-001 f0= 395 GHz n2=836 b2=039
dBP = 110 m σ=626 dB
1=29 1=2217 =224 dBP = 1470 m
2=1147 σ=636 dB
Indoor office NLoS
single slope (FFS) n=319 b=006 f0= 242 GHz σ=829 dB =383 =1730 =249 σ=803 dB
Shopping Mall NLoS
single slope (FFS) n=259 b=001 f0= 395 GHz σ=740 dB =321 =1809 =224 σ=697 dB
Frequency dependency on rms DS
In some measurment campaign delay spread
show similarity over a very wide frequency range
While in some other measurement campaign
some frequency dependency can be observed
Bandwidth dependency on rms
DS
In some measurement campaign bandwidth
dependency can observed considering the
possibility of large variance on the system
bandwidth may be adopted for above 6GHz
system
Delay Spread
DS based on measurement on
58 148 60GHz (Ericsson)
DS based on measurement on 29 29 61GHz
(Qualcomm)
0 05 1 15 20
20
40
60
80
100
y = 612exp(-171x)+778
Bandwidth [GHz]
De
lay
Sp
rea
d [
ns
]
Delay Spread evolving fitting
73G NLOS DS per cluster
73G NLOS fitted curve
12ns500M75ns2G
85ns10M
DS based on measurement on
73GHz (Huawei)
Polarization has been investigated based on
measurement on 28GHz 60GHz and 73GHz
If based on 3GPP XPR model XPR can be
decribed in table below It is still need further
investigation on the frequency dependency on
the XPR
Polarization Modeling
TX Azimuth [deg]
RX
Azi
mut
h [deg
]
HH
-90 -60 -30 0 30 60 90
-180
-135
-90
-45
0
45
90
135
TX Azimuth [deg]
RX
Azi
mut
h [deg
]
HV
-90 -60 -30 0 30 60 90
-180
-135
-90
-45
0
45
90
135
TX Azimuth [deg]
RX
Azi
mut
h [deg
]
VH
-90 -60 -30 0 30 60 90
-180
-135
-90
-45
0
45
90
135
TX Azimuth [deg]
RX
Azi
mut
h [deg
]
VV
-90 -60 -30 0 30 60 90
-180
-135
-90
-45
0
45
90
135-40
-35
-30
-25
-20
-15
-10
-5
0
Polarization measurement on 73GHz (Huawei)
Polarization measurement on 28GHz and 60GHz (Aalto Univ)
文档名称 文档密级
28GHz 60 GHz 73GHz
Scenario Shopping mall Shopping mall Indoor office
LOS NLOS LOS NLOS Hybrid
XPR (dB)
XPR 1612 1448 1685 1606 11
XPR
622 626 662 534 65
Preliminary results on polarization modeling
For InH scenarios fast fading channel
characteristics have been investigated based on
both measurement and ray-tracing
Both indoor office and shopping mall
environments have been investigated at
frequencies including 20 GHz 28 GHz 60GHz
and 73 GHz
Some preliminary analysis on large-scale channel
characteristics have been collected in table on the
right
Although it is still too early to apply these results to
the full frequency range up to 100 GHz these
preliminary investigations have provided insight into
the difference induced by the largely extended
frequency range
Collection of Results
1 From DOCOMO based on measurement
2 From Aalto University based on measurement
3 From NokiaNYU based on ray-tracing
4 From Huawei based on measurement
文档名称 文档密级
20 GHz1 28GHz2 60 GHz2 73GHz3 73GHz4
Scenario Indoor office Shopping mall Shopping mall Indoor office Indoor office
LOS LOS NLOS LOS NLOS Hybrid Hybrid
Delay spread ()
log10
(seconds)
DS -733 -752 -759 -762 -745 -81 NA
DS
01 017 033 020 011 04 NA
Delay distribution NA Exponential Exponential NA
AoA spread (ASA
) log
10(degrees)
ASA
NA 154 157 150 160 16 NA
ASA
NA 016 018 016 015 037 NA
AoD spread (ASD
) log
10(degrees)
ASD
18 144 168 143 172 15 NA
ASD
009 016 019 010 008 026 NA
ZoA spread (ZSA
)
(degrees)
ZSA NA 087 068 086 067 -0025d+118 NA
ZSA
NA 045 031 040 023 030 NA
ZoD spread (ZSD
)
(degrees)
ZSD 0 075 095 074 088 -0040d+145 NA
ZSD
048 034 022 030 020 033 NA
AoD and AoA distribution NA Wrapped Gaussian Uniform NA
ZoD and ZoA distribution NA Laplacian Laplacian NA
XPR (dB)
XPR NA 1612 1448 1685 1606 15 11
XPR
NA 622 626 662 534 2 65
LOS Ricean K
factor (dB)
K NA -018 NA -107 NA 8 NA
K NA 285 NA 358 NA 3 NA
31
Urban Macro Environment Channel Characteristics
32
Access points on or above rooftops (25-35 m high) cell radii gt= 200 m
Outdoor-to-outdoor and outdoor-to-indoor (UEs from 15-225 m)
UMa characteristics
bull LOS path loss close to free space
bull NLOS path loss minus free-space path loss at 1 m is very similar across frequency
bull Reflections likely dominate not diffraction
bull Delay and angle spreads appear to decrease with frequency
bull XPR decreases with frequency according to ray tracing but measurements have yet to verify this finding
5G UMa Environment
33
Aalborg University 2 10 18 28 GHz measurements bull 20 m and 25 m high Txrsquos
Ericsson data at 28 GHz bull Lindholmen (25 m high) bull Molndal (46 m high)
NYU 38 GHz measurements Austin Tx
Samsung 28 GHz ray-tracing data Ottawa and NYU-campus bull 23-35 m high Tx bull Only data with path loss lt= 100 dB minus FSPL(1 m) are used
Nokia 2 56 10 18 28 393 and 735 GHz ray tracing data bull Same environment as Aalborg data bull Only data with path loss lt= 100 dB minus FSPL(1 m) are used bull Data not used for path loss and LOS probability since it would be redundant with the Aalborg measured
data
UMa Available Data
34
UMa reuse 3GPP definition
bull Good match to new measurements
bull Also already has 3-D UE placement
)(11118
min)( 6363UT
dd hdCeed
dp
mhdg
h
mh
hdCUT
UT
UT
UT2313)(
10
13
130
)(51
md
otherwise
ddedg 18
0
150exp)251()(
26
0 100 200 300 400 500 6000
01
02
03
04
05
06
07
08
09
1
Distance (m)
LO
S p
robabili
ty
Data
3GPP UMa
d1d2 model
NYU (squared) model
Other LOS probability models only slightly improve match to data over 3GPP model
LOS Probability Findings
35
In all models d is distance f is frequency X is shadow fading Gaussian RV (dB)
Close-in (CI) reference distance path loss model
Alpha-Beta-Gamma (ABG) path loss model
CICI Xm
dnmfdBdf
1log10)1(FSPL])[(PL 10
FSPL( f 1m) = 20log10
4p f
c
aelig
egraveccedil
ouml
oslashdivide
ABGABG XGHz
f
m
ddBdf
1log10
1log10])[(PL 1010
Scenario CI Model Parameters ABG Model Parameters
UMa- LoS n=20 SF = 41 dB NA
UMa-nLoS n=30 SF = 68 dB =34 =192 =23 SF = 65 dB
Proposed UMa Path Loss and Shadow Fading Models (Single Slope)
36
14 16 18 20 22 24 26 28 30
40
50
60
70
80
90
100
10log10(d)
Path
loss m
inus F
SP
L(d
0=
1 m
) (d
B)
CI
ABG 2 GHz
ABG 28 GHz
ABG 100 GHz
3GPP UMa
NLOS UMa PL Models Compared to 3GPP UMa Model
37
These parameters found using the ray-tracing results in the Aalborg environment
56 GHz 10 GHz 18 GHz 28 GHz 393 GHz 735 GHz
Delay spread (st)
log10(seconds)
mDS -675 -680 -685 -688 -689 -691
eDS 068 088 078 073 073 069
AoA spread (sASA)
log10(degrees)
mASA 134 114 114 115 114 109
eASA 081 114 101 094 091 087
AoD spread (sASD)
log10(degrees)
mASD 087 067 074 075 078 082
eASD 081 135 105 116 106 093
ZoA spread (sZSA)
log10(degrees)
mZSA 048 031 026 026 024 020
eZSA 075 092 085 081 081 079
ZoD spread (sZSD)
log10(degrees)
mZSD -026 -024 -022 -022 -020 -016
eZSD 070 074 078 081 082 083
Shadow fading (dB) 982 1022 1028 1012 1014 997
Delay distribution Exponential Exponential Exponential Exponential Exponential Exponential
AoD and AoA distribution Laplacian Laplacian Laplacian Laplacian Laplacian Laplacian
ZoD and ZoA distribution Laplacian Laplacian Laplacian Laplacian Laplacian Laplacian
Delay scaling parameter TBD TBD TBD TBD TBD TBD
XPR (dB) mXPR 1387 1294 1097 1076 938 789
sXPR 612 636 680 657 660 638
Preliminary UMa NLOS Large-Scale Parameters (LSPs)
38
LOS path loss is very close to free space
NLOS path loss minus free-space path loss at 1 m (FSPL(1 m)) shows very little change across frequency
bull Aalborg data taken at 2 10 and 18 GHz in the same environment shows
bull Path loss minus FSPL(1 m) increases from 2 to 10 GHz but decreases from 10 to 18 GHz
bull Additional loss from 2 to 10 GHz may be due to diffraction loss and after 10 GHz (where diffraction is no longer a dominant channel effect) there may be a slight increase in reflectivity in the environment
bull More measurements are needed to confirm a linear trend of path loss minus FSPL (1 m) with the log of frequency (as modeled in the ABG model)
Delay and angle spreads tend to decrease with frequency
Although not shown elevation angle spreads and biases at both the Tx and Rx will have a distance dependence
XPR appears to decrease with frequency in ray-tracing results due to diffuse scattering model but measurements have yet to verify this trend
Summary of UMa Trends
39
Building penetration loss
40
Sources [Rodriguez VTC Fall 2014]
[Zhao 2013] and measurements
contributed by Samsung and Nokia
Material penetration loss
41
Most buildings have facades made up of multiple materials
bull Windows concrete brick wood
Very close to the external wall the loss characteristics of a single material may dominate
Further into the building the combined loss of multiple materials is experienced
Building penetration loss
42
Buildings with standard glass have lower loss than buildings with IRR glass
bull Non-linear dependence vs frequency
For comparison models from [Semaan Globecom 2014] are plotted
bull Low loss model 30 glass 70 concrete
bull High loss model 70 IRR glass 30 concrete
Other models have also been proposed see [5GCM white paper]
Building penetration Measurements
Sources [Larsson EuCAP 2014] and
measurements contributed by Qualcomm
NTT DOCOMO and Ericsson
43
Incidence angle to external wall
bull Loss increases by up to 15-20 dB for grazing incidence
Multiple internal reflections in material
bull Causes frequency-dependent constructive or destructive interference
Additional loss due to internal walls furniture people etc
bull Typically in the order 02-2 dBm with weak frequency dependence
Additional considerations
44
Building penetration loss tends to increase with frequency
bull Quantified through measurements over a large frequency range
bull Highly variable losses due to differences among building materials
bull IRR coated glass has high loss even at low frequencies
More details and further model proposals described in the white paper
Conclusions
45
[5GCM white paper] A Ghosh ed ldquo5G channel model for bands up to 100 GHzrdquo Globecom 2015 Available for download via httpwww5gworkshopscom5GCMhtml
[Zhao 2013] H Zhao et al28 GHz millimeter wave cellular communication measurements for reflection and penetration loss in and around buildings in New York city in 2013 IEEE International Conference on Communications (ICC) pp 5163-5167 9-13 June 2013
[Rodriguez VTC Fall 2014] I Rodriguez H C Nguyen N T K Jorgensen T B Sorensen and P Mogensen Radio Propagation into Modern Buildings Attenuation Measurements in the Range from 800 MHz to 18 GHz in Proc of IEEE Vehicular Technology Conference (VTC fall) 2014 pp 1-5
[Larsson EuCAP 2014] C Larsson F Harrysson B-E Olssson and J-E Berg An outdoor-to-indoor propagation scenario at 28 GHz in Proc of European Conference on Antennas and Propagation (EuCAP) 2014 pp 3301-3304
[Semaan Globecom 2014] E Semaan F Harrysson A Furuskaumlr and H Asplund Outdoor-to-indoor coverage in high frequency bands Globecom Workshops 2014 pp 393-398
References
10
The following slides provide describe the following (covered in more detail in [5GCM white paper])
bull Urban Micro Environment (UMi)
bull Indoor Hotspot (InH) Environment
bull Urban Macro Environment (UMa)
bull Penetration loss
5G Channel Model Specific Topics
11
Urban Micro Environment Channel Characteristics
12
Measurement Campaigns by multiple groups 2 GHz ~ 73 GHz
bull NokiaAalborg (2 10 18 GHz) Qualcomm (29 29 GHz) CMCC (6 GHz) IntelHHI (10 60 GHz) docomo (26 37 GHz) SamsungKAIST (28 GHz) KT (28 GHz) Huawei (28 72 73 GHz) NYU (28 73 GHz) Aalto Univ (60 GHz)
Urban Micro (UMi) ndash Street Canyon Environment
TX
TX
RX
TX View
TX View
RX
TX
RX
TX
RX
13
LoS Probability (based on Ray-tracing) ndash Street Canyon
0 50 100 150 200 250 3000
01
02
03
04
05
06
07
08
09
1
Distance [2D] (m)
Lo
S P
rob
ab
ility
LoS Probability UMi
UMi Street-Canyon data (based on ray-tracing)
3GPP UMi model (d1=18 d2=36) RMSE = 0023
Fitted (d1d2) model (d1=20 d2=39) RMSE = 0001
NYU squared model (d1=22 d2=100) RMSE = 0026
NYU Campus Manhattan
TX
TX
Tokyo Downtown
Fitted (d1d2) model based on 3GPP ITU Model
NYU Squared model proposed by NYU
Current model used in 3GPP ITU
Ray-Tracing Simulations
Models d1 d2 MSE
3GPP UMi 18 36 0023
d1d2 model 20 39 0001
NYU (squared) 22 100 0026
Current model has small error over all distances LoS probability seems no frequency dependent
14
Pathloss model based on multiple measurement campaigns
bull LoS model ndash well matched to Friisrsquo free-space pathloss model
bull NLoS model ndash pathloss slope range (n asymp 3~4) similar to lower-band below 6 GHz
Large-scale Propagation Model Pathloss Shadow Fading
Single-Slope Pathloss Model
Baseline Model CI model (LoS) CI --γ model (NLoS)
Valid freq [GHz]
Validity dist [m]
n (CI)
[dB] γ σSF [dB] [min ~ max] [min ~ max]
Street Canyon
LoS 198 NA
31
2 ~ 73
5~221
NLoS CI 319 82
10~959 ABG 348 2102 234 78
Open Square
LoS 185 NA
42
2 ~ 60
6~88
NLoS CI 289 71
8~605 ABG 414 366 243 70
15
Baseline LoS Model CI model Baseline NLoS Model CI model and --γ model
Shadow Fading Model fixed SF model distance-dependent SF model is considered with further analysis
UMi Pathloss Model Street-Canyon Single-Slope Model
Pathloss Exponent = 198
16
Dual-sloped pathloss observed based on ray-tracing simulation still requires more analysis bull The median-values of pathloss has different slope in near far region
bull Due to different propagation characteristics in mmWave severe diffraction loss reflection-dominant propagation
UMi Pathloss Model Street-Canyon Dual-slope Model
1st slope well matched up to 200m range 2nd slope of pathloss appeared over 150 m
Severe diffraction loss penetration loss Mostly reflected paths in NLoS no twice-penetrated paths In far area (over 150 m) the effect of diffracted path is dominant after several reflections
102
0
01
02
03
04
05
06
07
08
09
1
Distance (m)
Pro
babili
ty o
f th
e S
trongest
Ray
Diffraction+Reflection
Diffraction Only
Reflection OnlyReflection
Dominant Area
17
Based on the WINNER-like ITU3GPP model SCM model extended for mmWave band
Developimplement additional features of higher frequency on baseline model
Fast-fading Channel Extension of Stochastic Channel Model
Baseline Model ndash Extension of the current SCM model
- Reuse the framework of doublendashdirectional channel model
in standardization [ITU-R M2135 3GPP TR36873]
- Parameter extraction from Measurement Ray-tracing
simulation over many frequencies
[Ongoing] Modular Approach added on Baseline Model New features can be activated for some scenarios
- Blockage model from moving vehicles human body
- Geometry-induced additional loss in dense urban street-canyon
- Spatial-consistency for Massive MIMO MU-MIMO
[1] S Hur S Baek B Kim Y Chang A Molisch T Rappaport K Haneda and J Park Proposal on Millimeter-Wave Channel Modeling for 5G Cellular System under review IEEE JSTSP May 2015 [2] M Samimi and T Rappaport Local Multipath Model Parameters for Generating 5G Millimeter-Wave 3GPP-like Channel Impulse Response will be presented in EuCAPrsquo2016 April 2016
18
Delay angular spreads are frequency dependent
bull Smaller DSAS in higher frequency due to highly directional characteristics
bull Measurement and ray-tracing simulation used for extraction of large-scale parameters
Fast-fading Model Preliminary Channel Model Parameters
28 GHz1 73 GHz2
LoS NLoS LoS NLoS
Delay spread (σDS)
log10(seconds)
μDS -870 -739 -771 -752
εDS 054 031 034 050
AoA spread (σASA)
log10(degrees)
μASA -049 142 169 145
εASA 093 029 027 032
AoD spread (σASD)
log10(degrees)
μASD -040 082 128 132
εASD 107 038 050 038
ZoA spread (σZSA)
(degrees)
μZSA -140 069 060 053
εZSA 109 040 009 015
ZoD spread (σZSD)
(degrees)
μZSD -125 -021 NA 046
εZSD 004 030 NA 018
Delay distribution Exponential distribution
AoD and AoA distribution Laplacian distribution Uniform [0 360]
ZoD and ZoA distribution Laplacian distribution Gaussian distribution
Delay scaling parameter 442 482 390 310
DSASDASA in smaller ranges as frequency increases Measurement and ray-tracing shows
- Mean of RMS delay spread asymp 50 ns (28 GHz NLoS)
- Mean of AS of arrival asymp 30 deg (28 GHz NLoS)
Extract large-scale parameters in SCM framework 28 GHz (Samsung) and 73 GHz (NYU WIRELESS)
0 20 40 60 80 100 120 140 160 1800
01
02
03
04
05
06
07
08
09
1
RMS Delay Spread [ns]
Cu
mu
lative
Dis
trib
utio
n F
un
ctio
n (
CD
F)
Daejeon 28GHz Urban NLoS
Measurement
Ray-Tracing
0 20 40 60 800
01
02
03
04
05
06
07
08
09
1
Azimuth Angle spread [deg]
Cu
mu
lativ
e D
istr
ibu
tion
Fu
nctio
n (
CD
F)
Daejeon 28GHz Urban NLoS
ASD Measurement
ASD Ray-Tracing
ASA Measurement
ASA Ray-Tracing
19
Indoor Hotspot Environment Channel Characteristics
Definition on Scenarios
Typical indoor office
Open ceiling (in the middle)
Corridor
Open ceiling
(Open space in 1st floor)
Shop
Typical shopping mall
Considering the possibility of carrying 80 of the MBB traffic typical indoor
hotspot deployment scenarios are worthy of careful investigation
Measurement Campaign for InH
Contributor Scenario Frequency band (GHz)
Aalto University Shopping mall LOSNLOS 28 60
CMCC Indoor office LOSNLOS 14 28
DOCOMO Indoor office LOS 20
Ericsson Indoor office LOSNLOS 244 58 148 60
Huawei Indoor office LOSNLOS 73 28
Nokia Shopping mall O2I 2 10 18
NYU Indoor office LOSNLOS 28 73
Qualcomm Indoor office Shopping mall LOSNLOS 29 29 61
Samsung Shopping mall LOSNLOS 28
Ray tracing simulation is also important tools for investigating the LOS probability and channel characteristics validation especially when measurement data is not available
In LOS conditions multiple reflections from walls floor and ceiling give rise to
waveguiding Measurements in both office and shopping mall scenarios show that
path loss exponents based on a 1 m free space reference distance are typically
below 2 leading to more favorable path loss than predicted by Friisrsquo free space loss
formula The strength of the waveguiding effect is variable and the path loss
exponent appears to increase very slightly with increasing frequency possibly due to
the relation between the wavelength and surface roughness
Measurements of the small scale channel properties such as angular spread and
delay spread have shown remarkable similarities between channels over a very wide
frequency range It appears as if the main multipath components are present at all
frequencies though with some smaller variations in amplitudes
Recent work shows that polarization discrimination ranges between 15 and 25 dB
for indoor millimeter wave channels [Karttunen EuCAP2015] with greater
polarization discrimination at 73 GHz than at 28 GHz [MacCartney 2015]
InH Channel Characteristics
Three types of typical indoor office scenarios were investigated with ray tracing bull Open plan office bull Closed plan office bull Hybrid office including both open and closed areas
LOS probability (12)
0 5 10 15 20 25 30 35 40 45 500
5
10
15
20
Open planed area (cubic)
Closed office amp meeting room
Transmitter
Open plan office Closed plan office Hybrid office
Source Ericsson Source Ericsson Source Aalto
40
m
75
mRo
om
he
igh
t 2
68
m
Source Huawei
Source Qualcomm
LOS probability (22)
Model Original UpdatedNew MSE
ITU 00499
WINNERII B3
00572
WINNER II A1
00473
New model NA 00449
89 170
8911 )94)1(exp(
11 1
d
dd
d
PLOS
1 )49)1(exp(
1 1
dd
dPLOS
The modeling results for four models are approaching to the averaged LOS probability samples
The LOS probability model used in ITU IMT-Advanced evaluation and WINNER II are also presented here for comparison
The influence of data set from different types of office scenarios open or closed have been merged
The results show that the new model has a good fit to the data in an average sense and can be used for 5G InH
scenarios evaluation
56 320)632)56(exp(
5621 )74)21(exp(
21 1
dd
dd
d
PLOS0 10 20 30 40 50 60 70
0
01
02
03
04
05
06
07
08
09
1
distance(m)
LO
S p
robability
Huawei hybrid office
Qualcomm hybrid office
Ericsson open office
Ericsson corridor
Ericsson room
Aalto corridor
Aalto room
Averaged LOS Prob
ITU Model
WINNER Model B3
WINNER Model A1
New model
62 )))(10log40161(1(901
62 1
313 dd
dPLOS
3750
37182718exp
181
d
dd
d
PLOS
10 )45)10(exp(
10 1
dd
dPLOS
52 )))(10log610241(1(901
52 1
313 dd
dPLOS
For LOS
Due to strong reflections from walls
ceiling and floor wave guide
propagation can be observed for both
indoor office and shopping mall
For NLOS
Propagation path loss can be modeled
with dual PL slopes along with the
propagation distance
Frequency dependency higher than free
space can be observed for both
scenarios
Single-slope model is FFS
Shadowing Distance dependency of shadowing can
be observed in measurement on some
frequency band But it is still FFS
Path Loss Modeling (13)
100
101
102
-5
0
5
10
15
20
25
30
35
40
Distance (m)
Excess L
oss b
ased o
n P
L_d0 (
dB
)
244GHz samples
29GHz samples
58GHz samples
148GHz samples
20GHz samples
28GHz Huawei samples
28GHz NYU samples
29GHz samples
60GHz samples
73GHz Huawei samples
73GHz NYU samples
freespace PL
modeling results(Zone2)
100
101
102
100
101
102
20
40
60
80
100
120
140
160
Distance(m)Frequency(GHz)
Path
loss(d
B)
244GHz samples
29GHz samples
58GHz samples
148GHz samples
28GHz Huawei samples
28GHz NYU samples
29GHz samples
60GHz samples
73GHz Huawei samples
73GHz NYU samples
model results
100
101
102
-10
0
10
20
30
40
50
Distance (m)
Excess L
oss b
ased o
n P
L_d0 (
dB
)
29GHz samples
28GHz samples
285GHz samples
29GHz samples
61GHz samples
63GHz_I samples
63GHz_II samples
63GHz_III samples
model results
freespace plane
Ind
oo
r o
ffic
e
Sh
op
pin
g m
all
LOS NLOS
LOS NLOS
100
101
102
100
101
102
20
40
60
80
100
120
140
160
Distance(m)Frequency(GHz)
Path
loss(d
B)
29GHz samples
28GHz samples
285GHz samples
29GHz samples
61GHz samples
63GHz_I samples
63GHz_II samples
63GHz_III samples
model results
For LOS CI model can be adopted
For NLOS dual-slope ABG and CIF model can be adopted as two options
Single slope model is FFS
Option 1 ABG
Option 2 CIF w Free Space Path Loss (FSPL) reference 1 m
and
and fo is the avg center frequency of input data (K =number of unique frequencies Nk is path loss data points at kth frequency fk)
Path Loss Modeling (23)
Xm
dnmfdBdfPLLOS
1log10)1(FSPL])[( 10
BP
BP
BP
BP
ABG
Dual ddd
dfd
ddfd
dPL )(log10)(10log10)(log10
1 )(10log10)(log10
)(1021101
1101
BP
BP
BP
BP
CIFDual
ddd
d
f
ffbn
m
d
f
ffbnmfFSPL
ddm
d
f
ffbnmfFSPL
dPL
)(log110)1
(log110)1(
1 )1
(log110)1(
)(
10
0
02210
0
011
10
0
011
K
k K
K
k Kk
N
Nff
1
10
Path Loss Modeling (33)
Scenario CICIF Model Parameters ABG Model Parameters
Indoor office LOS n=173 σ= 302 dB NA
Indoor office NLoS
dual slope
n1=251 b1=012 f0= 241 GHz n2=425 b2=004
dBP = 78 m σ=765 dB
1=17 1=330 =249 dBP = 690 m 2=417
σ= 778 dB
Shopping Mall LoS n=173 σ= 201 dB NA
Shopping Mall NLoS dual slope n1=243 b1=-001 f0= 395 GHz n2=836 b2=039
dBP = 110 m σ=626 dB
1=29 1=2217 =224 dBP = 1470 m
2=1147 σ=636 dB
Indoor office NLoS
single slope (FFS) n=319 b=006 f0= 242 GHz σ=829 dB =383 =1730 =249 σ=803 dB
Shopping Mall NLoS
single slope (FFS) n=259 b=001 f0= 395 GHz σ=740 dB =321 =1809 =224 σ=697 dB
Frequency dependency on rms DS
In some measurment campaign delay spread
show similarity over a very wide frequency range
While in some other measurement campaign
some frequency dependency can be observed
Bandwidth dependency on rms
DS
In some measurement campaign bandwidth
dependency can observed considering the
possibility of large variance on the system
bandwidth may be adopted for above 6GHz
system
Delay Spread
DS based on measurement on
58 148 60GHz (Ericsson)
DS based on measurement on 29 29 61GHz
(Qualcomm)
0 05 1 15 20
20
40
60
80
100
y = 612exp(-171x)+778
Bandwidth [GHz]
De
lay
Sp
rea
d [
ns
]
Delay Spread evolving fitting
73G NLOS DS per cluster
73G NLOS fitted curve
12ns500M75ns2G
85ns10M
DS based on measurement on
73GHz (Huawei)
Polarization has been investigated based on
measurement on 28GHz 60GHz and 73GHz
If based on 3GPP XPR model XPR can be
decribed in table below It is still need further
investigation on the frequency dependency on
the XPR
Polarization Modeling
TX Azimuth [deg]
RX
Azi
mut
h [deg
]
HH
-90 -60 -30 0 30 60 90
-180
-135
-90
-45
0
45
90
135
TX Azimuth [deg]
RX
Azi
mut
h [deg
]
HV
-90 -60 -30 0 30 60 90
-180
-135
-90
-45
0
45
90
135
TX Azimuth [deg]
RX
Azi
mut
h [deg
]
VH
-90 -60 -30 0 30 60 90
-180
-135
-90
-45
0
45
90
135
TX Azimuth [deg]
RX
Azi
mut
h [deg
]
VV
-90 -60 -30 0 30 60 90
-180
-135
-90
-45
0
45
90
135-40
-35
-30
-25
-20
-15
-10
-5
0
Polarization measurement on 73GHz (Huawei)
Polarization measurement on 28GHz and 60GHz (Aalto Univ)
文档名称 文档密级
28GHz 60 GHz 73GHz
Scenario Shopping mall Shopping mall Indoor office
LOS NLOS LOS NLOS Hybrid
XPR (dB)
XPR 1612 1448 1685 1606 11
XPR
622 626 662 534 65
Preliminary results on polarization modeling
For InH scenarios fast fading channel
characteristics have been investigated based on
both measurement and ray-tracing
Both indoor office and shopping mall
environments have been investigated at
frequencies including 20 GHz 28 GHz 60GHz
and 73 GHz
Some preliminary analysis on large-scale channel
characteristics have been collected in table on the
right
Although it is still too early to apply these results to
the full frequency range up to 100 GHz these
preliminary investigations have provided insight into
the difference induced by the largely extended
frequency range
Collection of Results
1 From DOCOMO based on measurement
2 From Aalto University based on measurement
3 From NokiaNYU based on ray-tracing
4 From Huawei based on measurement
文档名称 文档密级
20 GHz1 28GHz2 60 GHz2 73GHz3 73GHz4
Scenario Indoor office Shopping mall Shopping mall Indoor office Indoor office
LOS LOS NLOS LOS NLOS Hybrid Hybrid
Delay spread ()
log10
(seconds)
DS -733 -752 -759 -762 -745 -81 NA
DS
01 017 033 020 011 04 NA
Delay distribution NA Exponential Exponential NA
AoA spread (ASA
) log
10(degrees)
ASA
NA 154 157 150 160 16 NA
ASA
NA 016 018 016 015 037 NA
AoD spread (ASD
) log
10(degrees)
ASD
18 144 168 143 172 15 NA
ASD
009 016 019 010 008 026 NA
ZoA spread (ZSA
)
(degrees)
ZSA NA 087 068 086 067 -0025d+118 NA
ZSA
NA 045 031 040 023 030 NA
ZoD spread (ZSD
)
(degrees)
ZSD 0 075 095 074 088 -0040d+145 NA
ZSD
048 034 022 030 020 033 NA
AoD and AoA distribution NA Wrapped Gaussian Uniform NA
ZoD and ZoA distribution NA Laplacian Laplacian NA
XPR (dB)
XPR NA 1612 1448 1685 1606 15 11
XPR
NA 622 626 662 534 2 65
LOS Ricean K
factor (dB)
K NA -018 NA -107 NA 8 NA
K NA 285 NA 358 NA 3 NA
31
Urban Macro Environment Channel Characteristics
32
Access points on or above rooftops (25-35 m high) cell radii gt= 200 m
Outdoor-to-outdoor and outdoor-to-indoor (UEs from 15-225 m)
UMa characteristics
bull LOS path loss close to free space
bull NLOS path loss minus free-space path loss at 1 m is very similar across frequency
bull Reflections likely dominate not diffraction
bull Delay and angle spreads appear to decrease with frequency
bull XPR decreases with frequency according to ray tracing but measurements have yet to verify this finding
5G UMa Environment
33
Aalborg University 2 10 18 28 GHz measurements bull 20 m and 25 m high Txrsquos
Ericsson data at 28 GHz bull Lindholmen (25 m high) bull Molndal (46 m high)
NYU 38 GHz measurements Austin Tx
Samsung 28 GHz ray-tracing data Ottawa and NYU-campus bull 23-35 m high Tx bull Only data with path loss lt= 100 dB minus FSPL(1 m) are used
Nokia 2 56 10 18 28 393 and 735 GHz ray tracing data bull Same environment as Aalborg data bull Only data with path loss lt= 100 dB minus FSPL(1 m) are used bull Data not used for path loss and LOS probability since it would be redundant with the Aalborg measured
data
UMa Available Data
34
UMa reuse 3GPP definition
bull Good match to new measurements
bull Also already has 3-D UE placement
)(11118
min)( 6363UT
dd hdCeed
dp
mhdg
h
mh
hdCUT
UT
UT
UT2313)(
10
13
130
)(51
md
otherwise
ddedg 18
0
150exp)251()(
26
0 100 200 300 400 500 6000
01
02
03
04
05
06
07
08
09
1
Distance (m)
LO
S p
robabili
ty
Data
3GPP UMa
d1d2 model
NYU (squared) model
Other LOS probability models only slightly improve match to data over 3GPP model
LOS Probability Findings
35
In all models d is distance f is frequency X is shadow fading Gaussian RV (dB)
Close-in (CI) reference distance path loss model
Alpha-Beta-Gamma (ABG) path loss model
CICI Xm
dnmfdBdf
1log10)1(FSPL])[(PL 10
FSPL( f 1m) = 20log10
4p f
c
aelig
egraveccedil
ouml
oslashdivide
ABGABG XGHz
f
m
ddBdf
1log10
1log10])[(PL 1010
Scenario CI Model Parameters ABG Model Parameters
UMa- LoS n=20 SF = 41 dB NA
UMa-nLoS n=30 SF = 68 dB =34 =192 =23 SF = 65 dB
Proposed UMa Path Loss and Shadow Fading Models (Single Slope)
36
14 16 18 20 22 24 26 28 30
40
50
60
70
80
90
100
10log10(d)
Path
loss m
inus F
SP
L(d
0=
1 m
) (d
B)
CI
ABG 2 GHz
ABG 28 GHz
ABG 100 GHz
3GPP UMa
NLOS UMa PL Models Compared to 3GPP UMa Model
37
These parameters found using the ray-tracing results in the Aalborg environment
56 GHz 10 GHz 18 GHz 28 GHz 393 GHz 735 GHz
Delay spread (st)
log10(seconds)
mDS -675 -680 -685 -688 -689 -691
eDS 068 088 078 073 073 069
AoA spread (sASA)
log10(degrees)
mASA 134 114 114 115 114 109
eASA 081 114 101 094 091 087
AoD spread (sASD)
log10(degrees)
mASD 087 067 074 075 078 082
eASD 081 135 105 116 106 093
ZoA spread (sZSA)
log10(degrees)
mZSA 048 031 026 026 024 020
eZSA 075 092 085 081 081 079
ZoD spread (sZSD)
log10(degrees)
mZSD -026 -024 -022 -022 -020 -016
eZSD 070 074 078 081 082 083
Shadow fading (dB) 982 1022 1028 1012 1014 997
Delay distribution Exponential Exponential Exponential Exponential Exponential Exponential
AoD and AoA distribution Laplacian Laplacian Laplacian Laplacian Laplacian Laplacian
ZoD and ZoA distribution Laplacian Laplacian Laplacian Laplacian Laplacian Laplacian
Delay scaling parameter TBD TBD TBD TBD TBD TBD
XPR (dB) mXPR 1387 1294 1097 1076 938 789
sXPR 612 636 680 657 660 638
Preliminary UMa NLOS Large-Scale Parameters (LSPs)
38
LOS path loss is very close to free space
NLOS path loss minus free-space path loss at 1 m (FSPL(1 m)) shows very little change across frequency
bull Aalborg data taken at 2 10 and 18 GHz in the same environment shows
bull Path loss minus FSPL(1 m) increases from 2 to 10 GHz but decreases from 10 to 18 GHz
bull Additional loss from 2 to 10 GHz may be due to diffraction loss and after 10 GHz (where diffraction is no longer a dominant channel effect) there may be a slight increase in reflectivity in the environment
bull More measurements are needed to confirm a linear trend of path loss minus FSPL (1 m) with the log of frequency (as modeled in the ABG model)
Delay and angle spreads tend to decrease with frequency
Although not shown elevation angle spreads and biases at both the Tx and Rx will have a distance dependence
XPR appears to decrease with frequency in ray-tracing results due to diffuse scattering model but measurements have yet to verify this trend
Summary of UMa Trends
39
Building penetration loss
40
Sources [Rodriguez VTC Fall 2014]
[Zhao 2013] and measurements
contributed by Samsung and Nokia
Material penetration loss
41
Most buildings have facades made up of multiple materials
bull Windows concrete brick wood
Very close to the external wall the loss characteristics of a single material may dominate
Further into the building the combined loss of multiple materials is experienced
Building penetration loss
42
Buildings with standard glass have lower loss than buildings with IRR glass
bull Non-linear dependence vs frequency
For comparison models from [Semaan Globecom 2014] are plotted
bull Low loss model 30 glass 70 concrete
bull High loss model 70 IRR glass 30 concrete
Other models have also been proposed see [5GCM white paper]
Building penetration Measurements
Sources [Larsson EuCAP 2014] and
measurements contributed by Qualcomm
NTT DOCOMO and Ericsson
43
Incidence angle to external wall
bull Loss increases by up to 15-20 dB for grazing incidence
Multiple internal reflections in material
bull Causes frequency-dependent constructive or destructive interference
Additional loss due to internal walls furniture people etc
bull Typically in the order 02-2 dBm with weak frequency dependence
Additional considerations
44
Building penetration loss tends to increase with frequency
bull Quantified through measurements over a large frequency range
bull Highly variable losses due to differences among building materials
bull IRR coated glass has high loss even at low frequencies
More details and further model proposals described in the white paper
Conclusions
45
[5GCM white paper] A Ghosh ed ldquo5G channel model for bands up to 100 GHzrdquo Globecom 2015 Available for download via httpwww5gworkshopscom5GCMhtml
[Zhao 2013] H Zhao et al28 GHz millimeter wave cellular communication measurements for reflection and penetration loss in and around buildings in New York city in 2013 IEEE International Conference on Communications (ICC) pp 5163-5167 9-13 June 2013
[Rodriguez VTC Fall 2014] I Rodriguez H C Nguyen N T K Jorgensen T B Sorensen and P Mogensen Radio Propagation into Modern Buildings Attenuation Measurements in the Range from 800 MHz to 18 GHz in Proc of IEEE Vehicular Technology Conference (VTC fall) 2014 pp 1-5
[Larsson EuCAP 2014] C Larsson F Harrysson B-E Olssson and J-E Berg An outdoor-to-indoor propagation scenario at 28 GHz in Proc of European Conference on Antennas and Propagation (EuCAP) 2014 pp 3301-3304
[Semaan Globecom 2014] E Semaan F Harrysson A Furuskaumlr and H Asplund Outdoor-to-indoor coverage in high frequency bands Globecom Workshops 2014 pp 393-398
References

13
LoS Probability (based on Ray-tracing) ndash Street Canyon
0 50 100 150 200 250 3000
01
02
03
04
05
06
07
08
09
1
Distance [2D] (m)
Lo
S P
rob
ab
ility
LoS Probability UMi
UMi Street-Canyon data (based on ray-tracing)
3GPP UMi model (d1=18 d2=36) RMSE = 0023
Fitted (d1d2) model (d1=20 d2=39) RMSE = 0001
NYU squared model (d1=22 d2=100) RMSE = 0026
NYU Campus Manhattan
TX
TX
Tokyo Downtown
Fitted (d1d2) model based on 3GPP ITU Model
NYU Squared model proposed by NYU
Current model used in 3GPP ITU
Ray-Tracing Simulations
Models d1 d2 MSE
3GPP UMi 18 36 0023
d1d2 model 20 39 0001
NYU (squared) 22 100 0026
Current model has small error over all distances LoS probability seems no frequency dependent
14
Pathloss model based on multiple measurement campaigns
bull LoS model ndash well matched to Friisrsquo free-space pathloss model
bull NLoS model ndash pathloss slope range (n asymp 3~4) similar to lower-band below 6 GHz
Large-scale Propagation Model Pathloss Shadow Fading
Single-Slope Pathloss Model
Baseline Model CI model (LoS) CI --γ model (NLoS)
Valid freq [GHz]
Validity dist [m]
n (CI)
[dB] γ σSF [dB] [min ~ max] [min ~ max]
Street Canyon
LoS 198 NA
31
2 ~ 73
5~221
NLoS CI 319 82
10~959 ABG 348 2102 234 78
Open Square
LoS 185 NA
42
2 ~ 60
6~88
NLoS CI 289 71
8~605 ABG 414 366 243 70
15
Baseline LoS Model CI model Baseline NLoS Model CI model and --γ model
Shadow Fading Model fixed SF model distance-dependent SF model is considered with further analysis
UMi Pathloss Model Street-Canyon Single-Slope Model
Pathloss Exponent = 198
16
Dual-sloped pathloss observed based on ray-tracing simulation still requires more analysis bull The median-values of pathloss has different slope in near far region
bull Due to different propagation characteristics in mmWave severe diffraction loss reflection-dominant propagation
UMi Pathloss Model Street-Canyon Dual-slope Model
1st slope well matched up to 200m range 2nd slope of pathloss appeared over 150 m
Severe diffraction loss penetration loss Mostly reflected paths in NLoS no twice-penetrated paths In far area (over 150 m) the effect of diffracted path is dominant after several reflections
102
0
01
02
03
04
05
06
07
08
09
1
Distance (m)
Pro
babili
ty o
f th
e S
trongest
Ray
Diffraction+Reflection
Diffraction Only
Reflection OnlyReflection
Dominant Area
17
Based on the WINNER-like ITU3GPP model SCM model extended for mmWave band
Developimplement additional features of higher frequency on baseline model
Fast-fading Channel Extension of Stochastic Channel Model
Baseline Model ndash Extension of the current SCM model
- Reuse the framework of doublendashdirectional channel model
in standardization [ITU-R M2135 3GPP TR36873]
- Parameter extraction from Measurement Ray-tracing
simulation over many frequencies
[Ongoing] Modular Approach added on Baseline Model New features can be activated for some scenarios
- Blockage model from moving vehicles human body
- Geometry-induced additional loss in dense urban street-canyon
- Spatial-consistency for Massive MIMO MU-MIMO
[1] S Hur S Baek B Kim Y Chang A Molisch T Rappaport K Haneda and J Park Proposal on Millimeter-Wave Channel Modeling for 5G Cellular System under review IEEE JSTSP May 2015 [2] M Samimi and T Rappaport Local Multipath Model Parameters for Generating 5G Millimeter-Wave 3GPP-like Channel Impulse Response will be presented in EuCAPrsquo2016 April 2016
18
Delay angular spreads are frequency dependent
bull Smaller DSAS in higher frequency due to highly directional characteristics
bull Measurement and ray-tracing simulation used for extraction of large-scale parameters
Fast-fading Model Preliminary Channel Model Parameters
28 GHz1 73 GHz2
LoS NLoS LoS NLoS
Delay spread (σDS)
log10(seconds)
μDS -870 -739 -771 -752
εDS 054 031 034 050
AoA spread (σASA)
log10(degrees)
μASA -049 142 169 145
εASA 093 029 027 032
AoD spread (σASD)
log10(degrees)
μASD -040 082 128 132
εASD 107 038 050 038
ZoA spread (σZSA)
(degrees)
μZSA -140 069 060 053
εZSA 109 040 009 015
ZoD spread (σZSD)
(degrees)
μZSD -125 -021 NA 046
εZSD 004 030 NA 018
Delay distribution Exponential distribution
AoD and AoA distribution Laplacian distribution Uniform [0 360]
ZoD and ZoA distribution Laplacian distribution Gaussian distribution
Delay scaling parameter 442 482 390 310
DSASDASA in smaller ranges as frequency increases Measurement and ray-tracing shows
- Mean of RMS delay spread asymp 50 ns (28 GHz NLoS)
- Mean of AS of arrival asymp 30 deg (28 GHz NLoS)
Extract large-scale parameters in SCM framework 28 GHz (Samsung) and 73 GHz (NYU WIRELESS)
0 20 40 60 80 100 120 140 160 1800
01
02
03
04
05
06
07
08
09
1
RMS Delay Spread [ns]
Cu
mu
lative
Dis
trib
utio
n F
un
ctio
n (
CD
F)
Daejeon 28GHz Urban NLoS
Measurement
Ray-Tracing
0 20 40 60 800
01
02
03
04
05
06
07
08
09
1
Azimuth Angle spread [deg]
Cu
mu
lativ
e D
istr
ibu
tion
Fu
nctio
n (
CD
F)
Daejeon 28GHz Urban NLoS
ASD Measurement
ASD Ray-Tracing
ASA Measurement
ASA Ray-Tracing
19
Indoor Hotspot Environment Channel Characteristics
Definition on Scenarios
Typical indoor office
Open ceiling (in the middle)
Corridor
Open ceiling
(Open space in 1st floor)
Shop
Typical shopping mall
Considering the possibility of carrying 80 of the MBB traffic typical indoor
hotspot deployment scenarios are worthy of careful investigation
Measurement Campaign for InH
Contributor Scenario Frequency band (GHz)
Aalto University Shopping mall LOSNLOS 28 60
CMCC Indoor office LOSNLOS 14 28
DOCOMO Indoor office LOS 20
Ericsson Indoor office LOSNLOS 244 58 148 60
Huawei Indoor office LOSNLOS 73 28
Nokia Shopping mall O2I 2 10 18
NYU Indoor office LOSNLOS 28 73
Qualcomm Indoor office Shopping mall LOSNLOS 29 29 61
Samsung Shopping mall LOSNLOS 28
Ray tracing simulation is also important tools for investigating the LOS probability and channel characteristics validation especially when measurement data is not available
In LOS conditions multiple reflections from walls floor and ceiling give rise to
waveguiding Measurements in both office and shopping mall scenarios show that
path loss exponents based on a 1 m free space reference distance are typically
below 2 leading to more favorable path loss than predicted by Friisrsquo free space loss
formula The strength of the waveguiding effect is variable and the path loss
exponent appears to increase very slightly with increasing frequency possibly due to
the relation between the wavelength and surface roughness
Measurements of the small scale channel properties such as angular spread and
delay spread have shown remarkable similarities between channels over a very wide
frequency range It appears as if the main multipath components are present at all
frequencies though with some smaller variations in amplitudes
Recent work shows that polarization discrimination ranges between 15 and 25 dB
for indoor millimeter wave channels [Karttunen EuCAP2015] with greater
polarization discrimination at 73 GHz than at 28 GHz [MacCartney 2015]
InH Channel Characteristics
Three types of typical indoor office scenarios were investigated with ray tracing bull Open plan office bull Closed plan office bull Hybrid office including both open and closed areas
LOS probability (12)
0 5 10 15 20 25 30 35 40 45 500
5
10
15
20
Open planed area (cubic)
Closed office amp meeting room
Transmitter
Open plan office Closed plan office Hybrid office
Source Ericsson Source Ericsson Source Aalto
40
m
75
mRo
om
he
igh
t 2
68
m
Source Huawei
Source Qualcomm
LOS probability (22)
Model Original UpdatedNew MSE
ITU 00499
WINNERII B3
00572
WINNER II A1
00473
New model NA 00449
89 170
8911 )94)1(exp(
11 1
d
dd
d
PLOS
1 )49)1(exp(
1 1
dd
dPLOS
The modeling results for four models are approaching to the averaged LOS probability samples
The LOS probability model used in ITU IMT-Advanced evaluation and WINNER II are also presented here for comparison
The influence of data set from different types of office scenarios open or closed have been merged
The results show that the new model has a good fit to the data in an average sense and can be used for 5G InH
scenarios evaluation
56 320)632)56(exp(
5621 )74)21(exp(
21 1
dd
dd
d
PLOS0 10 20 30 40 50 60 70
0
01
02
03
04
05
06
07
08
09
1
distance(m)
LO
S p
robability
Huawei hybrid office
Qualcomm hybrid office
Ericsson open office
Ericsson corridor
Ericsson room
Aalto corridor
Aalto room
Averaged LOS Prob
ITU Model
WINNER Model B3
WINNER Model A1
New model
62 )))(10log40161(1(901
62 1
313 dd
dPLOS
3750
37182718exp
181
d
dd
d
PLOS
10 )45)10(exp(
10 1
dd
dPLOS
52 )))(10log610241(1(901
52 1
313 dd
dPLOS
For LOS
Due to strong reflections from walls
ceiling and floor wave guide
propagation can be observed for both
indoor office and shopping mall
For NLOS
Propagation path loss can be modeled
with dual PL slopes along with the
propagation distance
Frequency dependency higher than free
space can be observed for both
scenarios
Single-slope model is FFS
Shadowing Distance dependency of shadowing can
be observed in measurement on some
frequency band But it is still FFS
Path Loss Modeling (13)
100
101
102
-5
0
5
10
15
20
25
30
35
40
Distance (m)
Excess L
oss b
ased o
n P
L_d0 (
dB
)
244GHz samples
29GHz samples
58GHz samples
148GHz samples
20GHz samples
28GHz Huawei samples
28GHz NYU samples
29GHz samples
60GHz samples
73GHz Huawei samples
73GHz NYU samples
freespace PL
modeling results(Zone2)
100
101
102
100
101
102
20
40
60
80
100
120
140
160
Distance(m)Frequency(GHz)
Path
loss(d
B)
244GHz samples
29GHz samples
58GHz samples
148GHz samples
28GHz Huawei samples
28GHz NYU samples
29GHz samples
60GHz samples
73GHz Huawei samples
73GHz NYU samples
model results
100
101
102
-10
0
10
20
30
40
50
Distance (m)
Excess L
oss b
ased o
n P
L_d0 (
dB
)
29GHz samples
28GHz samples
285GHz samples
29GHz samples
61GHz samples
63GHz_I samples
63GHz_II samples
63GHz_III samples
model results
freespace plane
Ind
oo
r o
ffic
e
Sh
op
pin
g m
all
LOS NLOS
LOS NLOS
100
101
102
100
101
102
20
40
60
80
100
120
140
160
Distance(m)Frequency(GHz)
Path
loss(d
B)
29GHz samples
28GHz samples
285GHz samples
29GHz samples
61GHz samples
63GHz_I samples
63GHz_II samples
63GHz_III samples
model results
For LOS CI model can be adopted
For NLOS dual-slope ABG and CIF model can be adopted as two options
Single slope model is FFS
Option 1 ABG
Option 2 CIF w Free Space Path Loss (FSPL) reference 1 m
and
and fo is the avg center frequency of input data (K =number of unique frequencies Nk is path loss data points at kth frequency fk)
Path Loss Modeling (23)
Xm
dnmfdBdfPLLOS
1log10)1(FSPL])[( 10
BP
BP
BP
BP
ABG
Dual ddd
dfd
ddfd
dPL )(log10)(10log10)(log10
1 )(10log10)(log10
)(1021101
1101
BP
BP
BP
BP
CIFDual
ddd
d
f
ffbn
m
d
f
ffbnmfFSPL
ddm
d
f
ffbnmfFSPL
dPL
)(log110)1
(log110)1(
1 )1
(log110)1(
)(
10
0
02210
0
011
10
0
011
K
k K
K
k Kk
N
Nff
1
10
Path Loss Modeling (33)
Scenario CICIF Model Parameters ABG Model Parameters
Indoor office LOS n=173 σ= 302 dB NA
Indoor office NLoS
dual slope
n1=251 b1=012 f0= 241 GHz n2=425 b2=004
dBP = 78 m σ=765 dB
1=17 1=330 =249 dBP = 690 m 2=417
σ= 778 dB
Shopping Mall LoS n=173 σ= 201 dB NA
Shopping Mall NLoS dual slope n1=243 b1=-001 f0= 395 GHz n2=836 b2=039
dBP = 110 m σ=626 dB
1=29 1=2217 =224 dBP = 1470 m
2=1147 σ=636 dB
Indoor office NLoS
single slope (FFS) n=319 b=006 f0= 242 GHz σ=829 dB =383 =1730 =249 σ=803 dB
Shopping Mall NLoS
single slope (FFS) n=259 b=001 f0= 395 GHz σ=740 dB =321 =1809 =224 σ=697 dB
Frequency dependency on rms DS
In some measurment campaign delay spread
show similarity over a very wide frequency range
While in some other measurement campaign
some frequency dependency can be observed
Bandwidth dependency on rms
DS
In some measurement campaign bandwidth
dependency can observed considering the
possibility of large variance on the system
bandwidth may be adopted for above 6GHz
system
Delay Spread
DS based on measurement on
58 148 60GHz (Ericsson)
DS based on measurement on 29 29 61GHz
(Qualcomm)
0 05 1 15 20
20
40
60
80
100
y = 612exp(-171x)+778
Bandwidth [GHz]
De
lay
Sp
rea
d [
ns
]
Delay Spread evolving fitting
73G NLOS DS per cluster
73G NLOS fitted curve
12ns500M75ns2G
85ns10M
DS based on measurement on
73GHz (Huawei)
Polarization has been investigated based on
measurement on 28GHz 60GHz and 73GHz
If based on 3GPP XPR model XPR can be
decribed in table below It is still need further
investigation on the frequency dependency on
the XPR
Polarization Modeling
TX Azimuth [deg]
RX
Azi
mut
h [deg
]
HH
-90 -60 -30 0 30 60 90
-180
-135
-90
-45
0
45
90
135
TX Azimuth [deg]
RX
Azi
mut
h [deg
]
HV
-90 -60 -30 0 30 60 90
-180
-135
-90
-45
0
45
90
135
TX Azimuth [deg]
RX
Azi
mut
h [deg
]
VH
-90 -60 -30 0 30 60 90
-180
-135
-90
-45
0
45
90
135
TX Azimuth [deg]
RX
Azi
mut
h [deg
]
VV
-90 -60 -30 0 30 60 90
-180
-135
-90
-45
0
45
90
135-40
-35
-30
-25
-20
-15
-10
-5
0
Polarization measurement on 73GHz (Huawei)
Polarization measurement on 28GHz and 60GHz (Aalto Univ)
文档名称 文档密级
28GHz 60 GHz 73GHz
Scenario Shopping mall Shopping mall Indoor office
LOS NLOS LOS NLOS Hybrid
XPR (dB)
XPR 1612 1448 1685 1606 11
XPR
622 626 662 534 65
Preliminary results on polarization modeling
For InH scenarios fast fading channel
characteristics have been investigated based on
both measurement and ray-tracing
Both indoor office and shopping mall
environments have been investigated at
frequencies including 20 GHz 28 GHz 60GHz
and 73 GHz
Some preliminary analysis on large-scale channel
characteristics have been collected in table on the
right
Although it is still too early to apply these results to
the full frequency range up to 100 GHz these
preliminary investigations have provided insight into
the difference induced by the largely extended
frequency range
Collection of Results
1 From DOCOMO based on measurement
2 From Aalto University based on measurement
3 From NokiaNYU based on ray-tracing
4 From Huawei based on measurement
文档名称 文档密级
20 GHz1 28GHz2 60 GHz2 73GHz3 73GHz4
Scenario Indoor office Shopping mall Shopping mall Indoor office Indoor office
LOS LOS NLOS LOS NLOS Hybrid Hybrid
Delay spread ()
log10
(seconds)
DS -733 -752 -759 -762 -745 -81 NA
DS
01 017 033 020 011 04 NA
Delay distribution NA Exponential Exponential NA
AoA spread (ASA
) log
10(degrees)
ASA
NA 154 157 150 160 16 NA
ASA
NA 016 018 016 015 037 NA
AoD spread (ASD
) log
10(degrees)
ASD
18 144 168 143 172 15 NA
ASD
009 016 019 010 008 026 NA
ZoA spread (ZSA
)
(degrees)
ZSA NA 087 068 086 067 -0025d+118 NA
ZSA
NA 045 031 040 023 030 NA
ZoD spread (ZSD
)
(degrees)
ZSD 0 075 095 074 088 -0040d+145 NA
ZSD
048 034 022 030 020 033 NA
AoD and AoA distribution NA Wrapped Gaussian Uniform NA
ZoD and ZoA distribution NA Laplacian Laplacian NA
XPR (dB)
XPR NA 1612 1448 1685 1606 15 11
XPR
NA 622 626 662 534 2 65
LOS Ricean K
factor (dB)
K NA -018 NA -107 NA 8 NA
K NA 285 NA 358 NA 3 NA
31
Urban Macro Environment Channel Characteristics
32
Access points on or above rooftops (25-35 m high) cell radii gt= 200 m
Outdoor-to-outdoor and outdoor-to-indoor (UEs from 15-225 m)
UMa characteristics
bull LOS path loss close to free space
bull NLOS path loss minus free-space path loss at 1 m is very similar across frequency
bull Reflections likely dominate not diffraction
bull Delay and angle spreads appear to decrease with frequency
bull XPR decreases with frequency according to ray tracing but measurements have yet to verify this finding
5G UMa Environment
33
Aalborg University 2 10 18 28 GHz measurements bull 20 m and 25 m high Txrsquos
Ericsson data at 28 GHz bull Lindholmen (25 m high) bull Molndal (46 m high)
NYU 38 GHz measurements Austin Tx
Samsung 28 GHz ray-tracing data Ottawa and NYU-campus bull 23-35 m high Tx bull Only data with path loss lt= 100 dB minus FSPL(1 m) are used
Nokia 2 56 10 18 28 393 and 735 GHz ray tracing data bull Same environment as Aalborg data bull Only data with path loss lt= 100 dB minus FSPL(1 m) are used bull Data not used for path loss and LOS probability since it would be redundant with the Aalborg measured
data
UMa Available Data
34
UMa reuse 3GPP definition
bull Good match to new measurements
bull Also already has 3-D UE placement
)(11118
min)( 6363UT
dd hdCeed
dp
mhdg
h
mh
hdCUT
UT
UT
UT2313)(
10
13
130
)(51
md
otherwise
ddedg 18
0
150exp)251()(
26
0 100 200 300 400 500 6000
01
02
03
04
05
06
07
08
09
1
Distance (m)
LO
S p
robabili
ty
Data
3GPP UMa
d1d2 model
NYU (squared) model
Other LOS probability models only slightly improve match to data over 3GPP model
LOS Probability Findings
35
In all models d is distance f is frequency X is shadow fading Gaussian RV (dB)
Close-in (CI) reference distance path loss model
Alpha-Beta-Gamma (ABG) path loss model
CICI Xm
dnmfdBdf
1log10)1(FSPL])[(PL 10
FSPL( f 1m) = 20log10
4p f
c
aelig
egraveccedil
ouml
oslashdivide
ABGABG XGHz
f
m
ddBdf
1log10
1log10])[(PL 1010
Scenario CI Model Parameters ABG Model Parameters
UMa- LoS n=20 SF = 41 dB NA
UMa-nLoS n=30 SF = 68 dB =34 =192 =23 SF = 65 dB
Proposed UMa Path Loss and Shadow Fading Models (Single Slope)
36
14 16 18 20 22 24 26 28 30
40
50
60
70
80
90
100
10log10(d)
Path
loss m
inus F
SP
L(d
0=
1 m
) (d
B)
CI
ABG 2 GHz
ABG 28 GHz
ABG 100 GHz
3GPP UMa
NLOS UMa PL Models Compared to 3GPP UMa Model
37
These parameters found using the ray-tracing results in the Aalborg environment
56 GHz 10 GHz 18 GHz 28 GHz 393 GHz 735 GHz
Delay spread (st)
log10(seconds)
mDS -675 -680 -685 -688 -689 -691
eDS 068 088 078 073 073 069
AoA spread (sASA)
log10(degrees)
mASA 134 114 114 115 114 109
eASA 081 114 101 094 091 087
AoD spread (sASD)
log10(degrees)
mASD 087 067 074 075 078 082
eASD 081 135 105 116 106 093
ZoA spread (sZSA)
log10(degrees)
mZSA 048 031 026 026 024 020
eZSA 075 092 085 081 081 079
ZoD spread (sZSD)
log10(degrees)
mZSD -026 -024 -022 -022 -020 -016
eZSD 070 074 078 081 082 083
Shadow fading (dB) 982 1022 1028 1012 1014 997
Delay distribution Exponential Exponential Exponential Exponential Exponential Exponential
AoD and AoA distribution Laplacian Laplacian Laplacian Laplacian Laplacian Laplacian
ZoD and ZoA distribution Laplacian Laplacian Laplacian Laplacian Laplacian Laplacian
Delay scaling parameter TBD TBD TBD TBD TBD TBD
XPR (dB) mXPR 1387 1294 1097 1076 938 789
sXPR 612 636 680 657 660 638
Preliminary UMa NLOS Large-Scale Parameters (LSPs)
38
LOS path loss is very close to free space
NLOS path loss minus free-space path loss at 1 m (FSPL(1 m)) shows very little change across frequency
bull Aalborg data taken at 2 10 and 18 GHz in the same environment shows
bull Path loss minus FSPL(1 m) increases from 2 to 10 GHz but decreases from 10 to 18 GHz
bull Additional loss from 2 to 10 GHz may be due to diffraction loss and after 10 GHz (where diffraction is no longer a dominant channel effect) there may be a slight increase in reflectivity in the environment
bull More measurements are needed to confirm a linear trend of path loss minus FSPL (1 m) with the log of frequency (as modeled in the ABG model)
Delay and angle spreads tend to decrease with frequency
Although not shown elevation angle spreads and biases at both the Tx and Rx will have a distance dependence
XPR appears to decrease with frequency in ray-tracing results due to diffuse scattering model but measurements have yet to verify this trend
Summary of UMa Trends
39
Building penetration loss
40
Sources [Rodriguez VTC Fall 2014]
[Zhao 2013] and measurements
contributed by Samsung and Nokia
Material penetration loss
41
Most buildings have facades made up of multiple materials
bull Windows concrete brick wood
Very close to the external wall the loss characteristics of a single material may dominate
Further into the building the combined loss of multiple materials is experienced
Building penetration loss
42
Buildings with standard glass have lower loss than buildings with IRR glass
bull Non-linear dependence vs frequency
For comparison models from [Semaan Globecom 2014] are plotted
bull Low loss model 30 glass 70 concrete
bull High loss model 70 IRR glass 30 concrete
Other models have also been proposed see [5GCM white paper]
Building penetration Measurements
Sources [Larsson EuCAP 2014] and
measurements contributed by Qualcomm
NTT DOCOMO and Ericsson
43
Incidence angle to external wall
bull Loss increases by up to 15-20 dB for grazing incidence
Multiple internal reflections in material
bull Causes frequency-dependent constructive or destructive interference
Additional loss due to internal walls furniture people etc
bull Typically in the order 02-2 dBm with weak frequency dependence
Additional considerations
44
Building penetration loss tends to increase with frequency
bull Quantified through measurements over a large frequency range
bull Highly variable losses due to differences among building materials
bull IRR coated glass has high loss even at low frequencies
More details and further model proposals described in the white paper
Conclusions
45
[5GCM white paper] A Ghosh ed ldquo5G channel model for bands up to 100 GHzrdquo Globecom 2015 Available for download via httpwww5gworkshopscom5GCMhtml
[Zhao 2013] H Zhao et al28 GHz millimeter wave cellular communication measurements for reflection and penetration loss in and around buildings in New York city in 2013 IEEE International Conference on Communications (ICC) pp 5163-5167 9-13 June 2013
[Rodriguez VTC Fall 2014] I Rodriguez H C Nguyen N T K Jorgensen T B Sorensen and P Mogensen Radio Propagation into Modern Buildings Attenuation Measurements in the Range from 800 MHz to 18 GHz in Proc of IEEE Vehicular Technology Conference (VTC fall) 2014 pp 1-5
[Larsson EuCAP 2014] C Larsson F Harrysson B-E Olssson and J-E Berg An outdoor-to-indoor propagation scenario at 28 GHz in Proc of European Conference on Antennas and Propagation (EuCAP) 2014 pp 3301-3304
[Semaan Globecom 2014] E Semaan F Harrysson A Furuskaumlr and H Asplund Outdoor-to-indoor coverage in high frequency bands Globecom Workshops 2014 pp 393-398
References

15
Baseline LoS Model CI model Baseline NLoS Model CI model and --γ model
Shadow Fading Model fixed SF model distance-dependent SF model is considered with further analysis
UMi Pathloss Model Street-Canyon Single-Slope Model
Pathloss Exponent = 198
16
Dual-sloped pathloss observed based on ray-tracing simulation still requires more analysis bull The median-values of pathloss has different slope in near far region
bull Due to different propagation characteristics in mmWave severe diffraction loss reflection-dominant propagation
UMi Pathloss Model Street-Canyon Dual-slope Model
1st slope well matched up to 200m range 2nd slope of pathloss appeared over 150 m
Severe diffraction loss penetration loss Mostly reflected paths in NLoS no twice-penetrated paths In far area (over 150 m) the effect of diffracted path is dominant after several reflections
102
0
01
02
03
04
05
06
07
08
09
1
Distance (m)
Pro
babili
ty o
f th
e S
trongest
Ray
Diffraction+Reflection
Diffraction Only
Reflection OnlyReflection
Dominant Area
17
Based on the WINNER-like ITU3GPP model SCM model extended for mmWave band
Developimplement additional features of higher frequency on baseline model
Fast-fading Channel Extension of Stochastic Channel Model
Baseline Model ndash Extension of the current SCM model
- Reuse the framework of doublendashdirectional channel model
in standardization [ITU-R M2135 3GPP TR36873]
- Parameter extraction from Measurement Ray-tracing
simulation over many frequencies
[Ongoing] Modular Approach added on Baseline Model New features can be activated for some scenarios
- Blockage model from moving vehicles human body
- Geometry-induced additional loss in dense urban street-canyon
- Spatial-consistency for Massive MIMO MU-MIMO
[1] S Hur S Baek B Kim Y Chang A Molisch T Rappaport K Haneda and J Park Proposal on Millimeter-Wave Channel Modeling for 5G Cellular System under review IEEE JSTSP May 2015 [2] M Samimi and T Rappaport Local Multipath Model Parameters for Generating 5G Millimeter-Wave 3GPP-like Channel Impulse Response will be presented in EuCAPrsquo2016 April 2016
18
Delay angular spreads are frequency dependent
bull Smaller DSAS in higher frequency due to highly directional characteristics
bull Measurement and ray-tracing simulation used for extraction of large-scale parameters
Fast-fading Model Preliminary Channel Model Parameters
28 GHz1 73 GHz2
LoS NLoS LoS NLoS
Delay spread (σDS)
log10(seconds)
μDS -870 -739 -771 -752
εDS 054 031 034 050
AoA spread (σASA)
log10(degrees)
μASA -049 142 169 145
εASA 093 029 027 032
AoD spread (σASD)
log10(degrees)
μASD -040 082 128 132
εASD 107 038 050 038
ZoA spread (σZSA)
(degrees)
μZSA -140 069 060 053
εZSA 109 040 009 015
ZoD spread (σZSD)
(degrees)
μZSD -125 -021 NA 046
εZSD 004 030 NA 018
Delay distribution Exponential distribution
AoD and AoA distribution Laplacian distribution Uniform [0 360]
ZoD and ZoA distribution Laplacian distribution Gaussian distribution
Delay scaling parameter 442 482 390 310
DSASDASA in smaller ranges as frequency increases Measurement and ray-tracing shows
- Mean of RMS delay spread asymp 50 ns (28 GHz NLoS)
- Mean of AS of arrival asymp 30 deg (28 GHz NLoS)
Extract large-scale parameters in SCM framework 28 GHz (Samsung) and 73 GHz (NYU WIRELESS)
0 20 40 60 80 100 120 140 160 1800
01
02
03
04
05
06
07
08
09
1
RMS Delay Spread [ns]
Cu
mu
lative
Dis
trib
utio
n F
un
ctio
n (
CD
F)
Daejeon 28GHz Urban NLoS
Measurement
Ray-Tracing
0 20 40 60 800
01
02
03
04
05
06
07
08
09
1
Azimuth Angle spread [deg]
Cu
mu
lativ
e D
istr
ibu
tion
Fu
nctio
n (
CD
F)
Daejeon 28GHz Urban NLoS
ASD Measurement
ASD Ray-Tracing
ASA Measurement
ASA Ray-Tracing
19
Indoor Hotspot Environment Channel Characteristics
Definition on Scenarios
Typical indoor office
Open ceiling (in the middle)
Corridor
Open ceiling
(Open space in 1st floor)
Shop
Typical shopping mall
Considering the possibility of carrying 80 of the MBB traffic typical indoor
hotspot deployment scenarios are worthy of careful investigation
Measurement Campaign for InH
Contributor Scenario Frequency band (GHz)
Aalto University Shopping mall LOSNLOS 28 60
CMCC Indoor office LOSNLOS 14 28
DOCOMO Indoor office LOS 20
Ericsson Indoor office LOSNLOS 244 58 148 60
Huawei Indoor office LOSNLOS 73 28
Nokia Shopping mall O2I 2 10 18
NYU Indoor office LOSNLOS 28 73
Qualcomm Indoor office Shopping mall LOSNLOS 29 29 61
Samsung Shopping mall LOSNLOS 28
Ray tracing simulation is also important tools for investigating the LOS probability and channel characteristics validation especially when measurement data is not available
In LOS conditions multiple reflections from walls floor and ceiling give rise to
waveguiding Measurements in both office and shopping mall scenarios show that
path loss exponents based on a 1 m free space reference distance are typically
below 2 leading to more favorable path loss than predicted by Friisrsquo free space loss
formula The strength of the waveguiding effect is variable and the path loss
exponent appears to increase very slightly with increasing frequency possibly due to
the relation between the wavelength and surface roughness
Measurements of the small scale channel properties such as angular spread and
delay spread have shown remarkable similarities between channels over a very wide
frequency range It appears as if the main multipath components are present at all
frequencies though with some smaller variations in amplitudes
Recent work shows that polarization discrimination ranges between 15 and 25 dB
for indoor millimeter wave channels [Karttunen EuCAP2015] with greater
polarization discrimination at 73 GHz than at 28 GHz [MacCartney 2015]
InH Channel Characteristics
Three types of typical indoor office scenarios were investigated with ray tracing bull Open plan office bull Closed plan office bull Hybrid office including both open and closed areas
LOS probability (12)
0 5 10 15 20 25 30 35 40 45 500
5
10
15
20
Open planed area (cubic)
Closed office amp meeting room
Transmitter
Open plan office Closed plan office Hybrid office
Source Ericsson Source Ericsson Source Aalto
40
m
75
mRo
om
he
igh
t 2
68
m
Source Huawei
Source Qualcomm
LOS probability (22)
Model Original UpdatedNew MSE
ITU 00499
WINNERII B3
00572
WINNER II A1
00473
New model NA 00449
89 170
8911 )94)1(exp(
11 1
d
dd
d
PLOS
1 )49)1(exp(
1 1
dd
dPLOS
The modeling results for four models are approaching to the averaged LOS probability samples
The LOS probability model used in ITU IMT-Advanced evaluation and WINNER II are also presented here for comparison
The influence of data set from different types of office scenarios open or closed have been merged
The results show that the new model has a good fit to the data in an average sense and can be used for 5G InH
scenarios evaluation
56 320)632)56(exp(
5621 )74)21(exp(
21 1
dd
dd
d
PLOS0 10 20 30 40 50 60 70
0
01
02
03
04
05
06
07
08
09
1
distance(m)
LO
S p
robability
Huawei hybrid office
Qualcomm hybrid office
Ericsson open office
Ericsson corridor
Ericsson room
Aalto corridor
Aalto room
Averaged LOS Prob
ITU Model
WINNER Model B3
WINNER Model A1
New model
62 )))(10log40161(1(901
62 1
313 dd
dPLOS
3750
37182718exp
181
d
dd
d
PLOS
10 )45)10(exp(
10 1
dd
dPLOS
52 )))(10log610241(1(901
52 1
313 dd
dPLOS
For LOS
Due to strong reflections from walls
ceiling and floor wave guide
propagation can be observed for both
indoor office and shopping mall
For NLOS
Propagation path loss can be modeled
with dual PL slopes along with the
propagation distance
Frequency dependency higher than free
space can be observed for both
scenarios
Single-slope model is FFS
Shadowing Distance dependency of shadowing can
be observed in measurement on some
frequency band But it is still FFS
Path Loss Modeling (13)
100
101
102
-5
0
5
10
15
20
25
30
35
40
Distance (m)
Excess L
oss b
ased o
n P
L_d0 (
dB
)
244GHz samples
29GHz samples
58GHz samples
148GHz samples
20GHz samples
28GHz Huawei samples
28GHz NYU samples
29GHz samples
60GHz samples
73GHz Huawei samples
73GHz NYU samples
freespace PL
modeling results(Zone2)
100
101
102
100
101
102
20
40
60
80
100
120
140
160
Distance(m)Frequency(GHz)
Path
loss(d
B)
244GHz samples
29GHz samples
58GHz samples
148GHz samples
28GHz Huawei samples
28GHz NYU samples
29GHz samples
60GHz samples
73GHz Huawei samples
73GHz NYU samples
model results
100
101
102
-10
0
10
20
30
40
50
Distance (m)
Excess L
oss b
ased o
n P
L_d0 (
dB
)
29GHz samples
28GHz samples
285GHz samples
29GHz samples
61GHz samples
63GHz_I samples
63GHz_II samples
63GHz_III samples
model results
freespace plane
Ind
oo
r o
ffic
e
Sh
op
pin
g m
all
LOS NLOS
LOS NLOS
100
101
102
100
101
102
20
40
60
80
100
120
140
160
Distance(m)Frequency(GHz)
Path
loss(d
B)
29GHz samples
28GHz samples
285GHz samples
29GHz samples
61GHz samples
63GHz_I samples
63GHz_II samples
63GHz_III samples
model results
For LOS CI model can be adopted
For NLOS dual-slope ABG and CIF model can be adopted as two options
Single slope model is FFS
Option 1 ABG
Option 2 CIF w Free Space Path Loss (FSPL) reference 1 m
and
and fo is the avg center frequency of input data (K =number of unique frequencies Nk is path loss data points at kth frequency fk)
Path Loss Modeling (23)
Xm
dnmfdBdfPLLOS
1log10)1(FSPL])[( 10
BP
BP
BP
BP
ABG
Dual ddd
dfd
ddfd
dPL )(log10)(10log10)(log10
1 )(10log10)(log10
)(1021101
1101
BP
BP
BP
BP
CIFDual
ddd
d
f
ffbn
m
d
f
ffbnmfFSPL
ddm
d
f
ffbnmfFSPL
dPL
)(log110)1
(log110)1(
1 )1
(log110)1(
)(
10
0
02210
0
011
10
0
011
K
k K
K
k Kk
N
Nff
1
10
Path Loss Modeling (33)
Scenario CICIF Model Parameters ABG Model Parameters
Indoor office LOS n=173 σ= 302 dB NA
Indoor office NLoS
dual slope
n1=251 b1=012 f0= 241 GHz n2=425 b2=004
dBP = 78 m σ=765 dB
1=17 1=330 =249 dBP = 690 m 2=417
σ= 778 dB
Shopping Mall LoS n=173 σ= 201 dB NA
Shopping Mall NLoS dual slope n1=243 b1=-001 f0= 395 GHz n2=836 b2=039
dBP = 110 m σ=626 dB
1=29 1=2217 =224 dBP = 1470 m
2=1147 σ=636 dB
Indoor office NLoS
single slope (FFS) n=319 b=006 f0= 242 GHz σ=829 dB =383 =1730 =249 σ=803 dB
Shopping Mall NLoS
single slope (FFS) n=259 b=001 f0= 395 GHz σ=740 dB =321 =1809 =224 σ=697 dB
Frequency dependency on rms DS
In some measurment campaign delay spread
show similarity over a very wide frequency range
While in some other measurement campaign
some frequency dependency can be observed
Bandwidth dependency on rms
DS
In some measurement campaign bandwidth
dependency can observed considering the
possibility of large variance on the system
bandwidth may be adopted for above 6GHz
system
Delay Spread
DS based on measurement on
58 148 60GHz (Ericsson)
DS based on measurement on 29 29 61GHz
(Qualcomm)
0 05 1 15 20
20
40
60
80
100
y = 612exp(-171x)+778
Bandwidth [GHz]
De
lay
Sp
rea
d [
ns
]
Delay Spread evolving fitting
73G NLOS DS per cluster
73G NLOS fitted curve
12ns500M75ns2G
85ns10M
DS based on measurement on
73GHz (Huawei)
Polarization has been investigated based on
measurement on 28GHz 60GHz and 73GHz
If based on 3GPP XPR model XPR can be
decribed in table below It is still need further
investigation on the frequency dependency on
the XPR
Polarization Modeling
TX Azimuth [deg]
RX
Azi
mut
h [deg
]
HH
-90 -60 -30 0 30 60 90
-180
-135
-90
-45
0
45
90
135
TX Azimuth [deg]
RX
Azi
mut
h [deg
]
HV
-90 -60 -30 0 30 60 90
-180
-135
-90
-45
0
45
90
135
TX Azimuth [deg]
RX
Azi
mut
h [deg
]
VH
-90 -60 -30 0 30 60 90
-180
-135
-90
-45
0
45
90
135
TX Azimuth [deg]
RX
Azi
mut
h [deg
]
VV
-90 -60 -30 0 30 60 90
-180
-135
-90
-45
0
45
90
135-40
-35
-30
-25
-20
-15
-10
-5
0
Polarization measurement on 73GHz (Huawei)
Polarization measurement on 28GHz and 60GHz (Aalto Univ)
文档名称 文档密级
28GHz 60 GHz 73GHz
Scenario Shopping mall Shopping mall Indoor office
LOS NLOS LOS NLOS Hybrid
XPR (dB)
XPR 1612 1448 1685 1606 11
XPR
622 626 662 534 65
Preliminary results on polarization modeling
For InH scenarios fast fading channel
characteristics have been investigated based on
both measurement and ray-tracing
Both indoor office and shopping mall
environments have been investigated at
frequencies including 20 GHz 28 GHz 60GHz
and 73 GHz
Some preliminary analysis on large-scale channel
characteristics have been collected in table on the
right
Although it is still too early to apply these results to
the full frequency range up to 100 GHz these
preliminary investigations have provided insight into
the difference induced by the largely extended
frequency range
Collection of Results
1 From DOCOMO based on measurement
2 From Aalto University based on measurement
3 From NokiaNYU based on ray-tracing
4 From Huawei based on measurement
文档名称 文档密级
20 GHz1 28GHz2 60 GHz2 73GHz3 73GHz4
Scenario Indoor office Shopping mall Shopping mall Indoor office Indoor office
LOS LOS NLOS LOS NLOS Hybrid Hybrid
Delay spread ()
log10
(seconds)
DS -733 -752 -759 -762 -745 -81 NA
DS
01 017 033 020 011 04 NA
Delay distribution NA Exponential Exponential NA
AoA spread (ASA
) log
10(degrees)
ASA
NA 154 157 150 160 16 NA
ASA
NA 016 018 016 015 037 NA
AoD spread (ASD
) log
10(degrees)
ASD
18 144 168 143 172 15 NA
ASD
009 016 019 010 008 026 NA
ZoA spread (ZSA
)
(degrees)
ZSA NA 087 068 086 067 -0025d+118 NA
ZSA
NA 045 031 040 023 030 NA
ZoD spread (ZSD
)
(degrees)
ZSD 0 075 095 074 088 -0040d+145 NA
ZSD
048 034 022 030 020 033 NA
AoD and AoA distribution NA Wrapped Gaussian Uniform NA
ZoD and ZoA distribution NA Laplacian Laplacian NA
XPR (dB)
XPR NA 1612 1448 1685 1606 15 11
XPR
NA 622 626 662 534 2 65
LOS Ricean K
factor (dB)
K NA -018 NA -107 NA 8 NA
K NA 285 NA 358 NA 3 NA
31
Urban Macro Environment Channel Characteristics
32
Access points on or above rooftops (25-35 m high) cell radii gt= 200 m
Outdoor-to-outdoor and outdoor-to-indoor (UEs from 15-225 m)
UMa characteristics
bull LOS path loss close to free space
bull NLOS path loss minus free-space path loss at 1 m is very similar across frequency
bull Reflections likely dominate not diffraction
bull Delay and angle spreads appear to decrease with frequency
bull XPR decreases with frequency according to ray tracing but measurements have yet to verify this finding
5G UMa Environment
33
Aalborg University 2 10 18 28 GHz measurements bull 20 m and 25 m high Txrsquos
Ericsson data at 28 GHz bull Lindholmen (25 m high) bull Molndal (46 m high)
NYU 38 GHz measurements Austin Tx
Samsung 28 GHz ray-tracing data Ottawa and NYU-campus bull 23-35 m high Tx bull Only data with path loss lt= 100 dB minus FSPL(1 m) are used
Nokia 2 56 10 18 28 393 and 735 GHz ray tracing data bull Same environment as Aalborg data bull Only data with path loss lt= 100 dB minus FSPL(1 m) are used bull Data not used for path loss and LOS probability since it would be redundant with the Aalborg measured
data
UMa Available Data
34
UMa reuse 3GPP definition
bull Good match to new measurements
bull Also already has 3-D UE placement
)(11118
min)( 6363UT
dd hdCeed
dp
mhdg
h
mh
hdCUT
UT
UT
UT2313)(
10
13
130
)(51
md
otherwise
ddedg 18
0
150exp)251()(
26
0 100 200 300 400 500 6000
01
02
03
04
05
06
07
08
09
1
Distance (m)
LO
S p
robabili
ty
Data
3GPP UMa
d1d2 model
NYU (squared) model
Other LOS probability models only slightly improve match to data over 3GPP model
LOS Probability Findings
35
In all models d is distance f is frequency X is shadow fading Gaussian RV (dB)
Close-in (CI) reference distance path loss model
Alpha-Beta-Gamma (ABG) path loss model
CICI Xm
dnmfdBdf
1log10)1(FSPL])[(PL 10
FSPL( f 1m) = 20log10
4p f
c
aelig
egraveccedil
ouml
oslashdivide
ABGABG XGHz
f
m
ddBdf
1log10
1log10])[(PL 1010
Scenario CI Model Parameters ABG Model Parameters
UMa- LoS n=20 SF = 41 dB NA
UMa-nLoS n=30 SF = 68 dB =34 =192 =23 SF = 65 dB
Proposed UMa Path Loss and Shadow Fading Models (Single Slope)
36
14 16 18 20 22 24 26 28 30
40
50
60
70
80
90
100
10log10(d)
Path
loss m
inus F
SP
L(d
0=
1 m
) (d
B)
CI
ABG 2 GHz
ABG 28 GHz
ABG 100 GHz
3GPP UMa
NLOS UMa PL Models Compared to 3GPP UMa Model
37
These parameters found using the ray-tracing results in the Aalborg environment
56 GHz 10 GHz 18 GHz 28 GHz 393 GHz 735 GHz
Delay spread (st)
log10(seconds)
mDS -675 -680 -685 -688 -689 -691
eDS 068 088 078 073 073 069
AoA spread (sASA)
log10(degrees)
mASA 134 114 114 115 114 109
eASA 081 114 101 094 091 087
AoD spread (sASD)
log10(degrees)
mASD 087 067 074 075 078 082
eASD 081 135 105 116 106 093
ZoA spread (sZSA)
log10(degrees)
mZSA 048 031 026 026 024 020
eZSA 075 092 085 081 081 079
ZoD spread (sZSD)
log10(degrees)
mZSD -026 -024 -022 -022 -020 -016
eZSD 070 074 078 081 082 083
Shadow fading (dB) 982 1022 1028 1012 1014 997
Delay distribution Exponential Exponential Exponential Exponential Exponential Exponential
AoD and AoA distribution Laplacian Laplacian Laplacian Laplacian Laplacian Laplacian
ZoD and ZoA distribution Laplacian Laplacian Laplacian Laplacian Laplacian Laplacian
Delay scaling parameter TBD TBD TBD TBD TBD TBD
XPR (dB) mXPR 1387 1294 1097 1076 938 789
sXPR 612 636 680 657 660 638
Preliminary UMa NLOS Large-Scale Parameters (LSPs)
38
LOS path loss is very close to free space
NLOS path loss minus free-space path loss at 1 m (FSPL(1 m)) shows very little change across frequency
bull Aalborg data taken at 2 10 and 18 GHz in the same environment shows
bull Path loss minus FSPL(1 m) increases from 2 to 10 GHz but decreases from 10 to 18 GHz
bull Additional loss from 2 to 10 GHz may be due to diffraction loss and after 10 GHz (where diffraction is no longer a dominant channel effect) there may be a slight increase in reflectivity in the environment
bull More measurements are needed to confirm a linear trend of path loss minus FSPL (1 m) with the log of frequency (as modeled in the ABG model)
Delay and angle spreads tend to decrease with frequency
Although not shown elevation angle spreads and biases at both the Tx and Rx will have a distance dependence
XPR appears to decrease with frequency in ray-tracing results due to diffuse scattering model but measurements have yet to verify this trend
Summary of UMa Trends
39
Building penetration loss
40
Sources [Rodriguez VTC Fall 2014]
[Zhao 2013] and measurements
contributed by Samsung and Nokia
Material penetration loss
41
Most buildings have facades made up of multiple materials
bull Windows concrete brick wood
Very close to the external wall the loss characteristics of a single material may dominate
Further into the building the combined loss of multiple materials is experienced
Building penetration loss
42
Buildings with standard glass have lower loss than buildings with IRR glass
bull Non-linear dependence vs frequency
For comparison models from [Semaan Globecom 2014] are plotted
bull Low loss model 30 glass 70 concrete
bull High loss model 70 IRR glass 30 concrete
Other models have also been proposed see [5GCM white paper]
Building penetration Measurements
Sources [Larsson EuCAP 2014] and
measurements contributed by Qualcomm
NTT DOCOMO and Ericsson
43
Incidence angle to external wall
bull Loss increases by up to 15-20 dB for grazing incidence
Multiple internal reflections in material
bull Causes frequency-dependent constructive or destructive interference
Additional loss due to internal walls furniture people etc
bull Typically in the order 02-2 dBm with weak frequency dependence
Additional considerations
44
Building penetration loss tends to increase with frequency
bull Quantified through measurements over a large frequency range
bull Highly variable losses due to differences among building materials
bull IRR coated glass has high loss even at low frequencies
More details and further model proposals described in the white paper
Conclusions
45
[5GCM white paper] A Ghosh ed ldquo5G channel model for bands up to 100 GHzrdquo Globecom 2015 Available for download via httpwww5gworkshopscom5GCMhtml
[Zhao 2013] H Zhao et al28 GHz millimeter wave cellular communication measurements for reflection and penetration loss in and around buildings in New York city in 2013 IEEE International Conference on Communications (ICC) pp 5163-5167 9-13 June 2013
[Rodriguez VTC Fall 2014] I Rodriguez H C Nguyen N T K Jorgensen T B Sorensen and P Mogensen Radio Propagation into Modern Buildings Attenuation Measurements in the Range from 800 MHz to 18 GHz in Proc of IEEE Vehicular Technology Conference (VTC fall) 2014 pp 1-5
[Larsson EuCAP 2014] C Larsson F Harrysson B-E Olssson and J-E Berg An outdoor-to-indoor propagation scenario at 28 GHz in Proc of European Conference on Antennas and Propagation (EuCAP) 2014 pp 3301-3304
[Semaan Globecom 2014] E Semaan F Harrysson A Furuskaumlr and H Asplund Outdoor-to-indoor coverage in high frequency bands Globecom Workshops 2014 pp 393-398
References