whitbread: strong trading results and value creation
TRANSCRIPT

Whitbread:strong tradingresults and value creation
Interim Report andAccounts 2001/2

TRANSFORMATION OF WHITBREAD
2001/2 (first half-year)2000/1 (first half-year)
Turnover
HotelsRestaurantsSports, healthand fitnessPubs & Bars
Beer and other drinks
Profit
Net assets
01 Financial highlights02 Chairman’s statement04 Chief Executive’s review 08 Finance review
12 Group profit and lossaccount
13 Statement of totalrecognised gains andlosses
13 Movement inshareholders’funds
14 Cash flow statement15 Balance sheet16 Notes to the accounts26 Shareholder services

01
Financial highlights for the six months to September 2001
Significant progress towardsthe demanding financialtargets the board has set.
> future Whitbread like-for-like sales up 4.2%> future Whitbread operating profit up 10.1%> net assets per share up 27%> £487 million premium from Pubs & Bars
demerger
Total group* future Whitbread**% change % change
Sales including share of joint ventures £1,141m (35) £908m 7.1
EBITDA before exceptional items £239.4m (24) £197.1m 9.4
Operating profit before exceptional items £172.0m (26) £137.2m 10.1
Profit before exceptional items and tax £135.7m (25) – –
Adjusted earnings per share 25.77p 3.0 – –
Dividend per share 5.05p (37) – –
Net assets per share £6.44 27 – –
*Part-year only for Pubs & Bars division.**Results for hotels, restaurants and sports, health and fitness.

02
Chairman’s statement
The last six months havedemonstrated the potentialof the future Whitbreadbusinesses to outperformtheir markets.
Whitbread has made good progress towards the achievementof our financial targets with all continuing businesses improvingsales, like-for-like sales, and operating profit.
These results include ten weeks trading for the Pubs & Bars division which was demerged in May and subsequentlyacquired by a Morgan Grenfell Private Equity company.The gross value of £1.625 billion represented a £487 millionpremium over the book value of these assets. £1.129 billion was returned to shareholders, on schedule, in June. Even afterthis transaction, net assets per share were £6.44.
For the future Whitbread businesses, like-for-like sales for theperiod were ahead 1.8% in hotels, 3.7% in restaurants and 18.2% in sports, health and fitness leading to total like-for-like salesgrowth of 4.2%. Operating margins also improved and totaloperating profit grew 10.1%. Returns on capital were strongerfor both restaurants and sports, health and fitness althoughLondon market conditions meant hotel returns were flat.
For the major brands, trading since 2 September has, for themost part, been very encouraging. Like-for-like sales for the twomonths were ahead 5.6% in Travel Inn, 7.9% in Brewers Fayre,5.2% in Beefeater and 16.7% (for September only) in David LloydLeisure. Core Marriott hotels, however, suffered a 4.7% fall inlike-for-like sales reflecting a 3.9% growth in the provinces buta 24.6% decline in London.

03
Only some 10% of future Whitbread profitability is generated inLondon. The rest of the country continues to trade satisfactorily.It may well be that this trend continues but until the marketoutlook becomes more certain, particularly in hotels, we havetaken a number of actions across the business to ensure wehave additional flexibility as to costs and cash flow.
Plans have been put in place to reduce overhead and operatingcosts and to give us the option to defer some £150 million of capital expenditure in the current and next financial years.In hotels, £60 million of this deferment is being implementednow along with a reduction of £10 million in operating costs for the 2002/3 financial year.
Future Whitbread has strong brands, a skilled and committedteam of people and high quality assets. The last six monthshave demonstrated the potential of the future Whitbreadbusinesses to outperform their markets and to achievesignificant progress towards the demanding financial targetsthe board has set.
The interim dividend of 5.05 pence per share will be paid on 8 January 2002 to all shareholders on the register at the close of business on 9 November 2001.
Sir John BanhamChairman
Strong brands, a committed team of people and high quality assets.

04
Chief Executive’s review
Operating profit and EBITDA (see Finance Review) are statedbefore exceptional items (see note 3 to the accounts).
Like-for-like sales are total sales less sales of retail outletsopened for the first time or disposed of since the beginning of 2000/1.
Marriott/SwallowThe Marriott/Swallow business achieved a 1.8% increase in sales and a 5.7% increase in operating profit, despite thedecline in US visitors to London throughout the period and the inevitable disruption caused by converting a further 12 Swallow hotels to the Marriott brand.
The core Marriott hotels, grew total operating profit by 20.6% following a 36.6% increase in the provinces but an 8.9% decline in London. Achieved room rate grew 3.3% to £83.34.The brand’s yield premium to the 4-star market continued togrow to 21% in London and 20% in the provinces. The first tenSwallow conversions also grew operating profit strongly at24.4% ahead of last year.
Excluding the disposal hotels, profit per room, Marriott’s key shareholder value target, grew 6.3% to an annual rate of £8,400 helped by the expected yield improvement of theconverted Swallow hotels and by a 2.3% improvement in non-room revenue. Operating margins improved slightly.
Travel InnTravel Inn grew sales by 9.3% and operating profit by 9.4%.Occupancy in like-for-like hotels was 86.0% and achieved roomrate was 4.2% ahead at £38.09. The number of rooms grew inthe half-year from 14,186 to 15,106.
Sales£203.7m +1.8%
Like-for-like sales growth1.3%
Operating profit£42.4m
Operating profit growth5.7%
Sales£87.9m +9.3%
Like-for-like sales growth3.0%
Operating profit£31.5m
Operating profit growth9.4%
Marriott profit per room up 6.3% to £8,400.

05
Pizza Hut was the main contributor to the 19% increase in high street restaurants’operating profit.
Sales£299.1m +6.1%
Like-for-like sales growth4.5%
Operating profit£44.2m
Operating profit growth10%
Sales£237.1m +8.0%
Like-for-like sales growth2.7%
Operating profit£3.1m
Operating profit growth19%
Pub restaurantsThe 10% improvement in pub restaurants’operating profit wasdriven by the Brewers Fayre brand which grew its operatingprofit by 18%. Brewers Fayre like-for-like sales were up 4.2%,and operating margin was 1.7% points ahead at 18.5%.A further nine Brewsters were opened bringing the total to 129.
Beefeater like-for-like sales grew 5.0% but operating profit fellby 8.5% as a result of the associated costs and trading weekslost through the new brand conversion programme. Operatingprofit for the comparable Beefeater estate was up 7.4%.Average weekly sales for the 27 Out & Out units were up 15%.
High street restaurantsPizza Hut was the main contributor to the 19% increase in highstreet restaurants’operating profit. The brand’s like-for-likesales grew 6.9% and operating profit doubled. The other high street brands also grew like-for-like sales – Costa by 6.2%, T.G.I. Friday’s by 2.8%, and Pelican by 1.4%. The UK high street brands’total like-for-like sales were up 4.4% with the German restaurants still negative at (7.3)% following theBSE scare last year.
During the period the review of high street brands wasconcluded. Pizza Hut, Costa and T.G.I. Friday’s all have thepotential to achieve the required level of performance, based on Whitbread’s overall financial criteria, but a number ofsmaller brands including Bella Pasta, Café Rouge, Abbaye andMamma Amalfi are unlikely to achieve the necessary scale.A new operating structure is being established to managethese brands separately from the Restaurants division and in due course, they will be sold.
In addition, the restaurant management team has largelycompleted the previously announced disposal of 140 sites.In October, 44 pub restaurants, including eight under theDragon Inn brand, were acquired by the Noble House PubCompany for £31 million.

06
Chief Executive’s reviewcontinued
Sports, health and fitnessDavid Lloyd Leisure’s operating profit growth of 24% wasachieved largely through improving the performance of theexisting business. Like-for-like sales growth of 18% for thesegment and 20% for David Lloyd Leisure clubs led the UKhealth and fitness industry. The total number of David LloydLeisure members grew 12% from 222,000 in February to248,000 at 1 September. Operating margins improved slightlyover the same period last year.
Membership fees are the dominant source of revenue for thisbusiness but income from other sources such as food andbeverage sales and personal tuition represent a significantopportunity. Management action increased ‘non-fee’ income by 13% in the period.
David Lloyd Leisure clubs have, in the past, taken three years to reach mature operating levels and to contribute a return on capital in excess of 15%. The number of fee-paying membersis the key determinant. Pre-opening marketing activity hasboosted initial member totals to an average of 1,780 for the four most recent club openings which is over 60% aheadof previous experience.
Sales£80.4m +21.5%
Like-for-like sales growth18%
Operating profit£16.0m
Operating profit growth24%

07
Pubs & Bars turnover for the first ten weeks of the financialyear prior to the demerger in May was £126 million withoperating profit of £30.5 million.
Beer and other drinks turnover of £38.6 million relates to Whitbread’s continuing contractual relationship withHeineken and operating profit of £11.3 million relates primarily to Whitbread’s 25% holding in Britannia Soft Drinks.
David M Thomas CBEChief Executive
The group’s profit marginincreased from 13.1% to 15.1%.

08
Finance review The last 21 months has beena period of transformationfor Whitbread.
Accounting policiesFRS 19 (Deferred Tax) has been adopted for these accounts.Deferred tax is the tax attributable to the timing differencesarising from the inclusion of items of income and expenditurein one period for tax purposes (in accordance with taxlegislation) and another for accounting (in accordance with UK company law and financial reporting standards). Theprincipal timing difference for Whitbread relates to hotelbuildings and furniture, fixtures and equipment in all ourproperties. For these assets, tax relief normally exceeds thecharge against profit for depreciation in the early years of their life. The position reverses in later years.
The impact of adopting FRS 19 is detailed in note 1 to theaccounts. It should be emphasised that FRS 19 has no impacton tax paid nor cash flows.
Year over year comparisons of performanceThe last 21 months has been a period of transformation forWhitbread, inevitably hindering year over year comparisonsof performance. During this time the following strategicinitiatives have been completed:
– the acquisition of the Swallow Group in January 2000.
– the disposal of the Whitbread Beer Company in May 2000.
– the disposal of Whitbread’s 50% interest in the First Quenchoff-licence joint ventures in October 2000.
– the demerger of the Pubs & Bars division in May 2001.
These transactions have created value for shareholders andenabled Whitbread to focus on those growth segments of the UK leisure market where the group already occupiesleading positions.
Wherever possible, the results in this report are presented in a way which helps the measurement of performance trends in future Whitbread.

09
On a like-for-like basis,turnover including jointventures grew by 4.2%.Total turnover for futureWhitbread grew by 7.1%.
Demerger of Pubs & BarsThe demerger of the Pubs & Bars division was concluded in May at a value of £1,612 million, after adjustments forworking capital. £1,129 million of cash was returned directly to shareholders and £483 million was retained by the group to pay transaction costs and reduce long term borrowings.The transaction realised a gain on the book value of Pubs & Bars of £487 million. This gain is included in themovement on shareholders’funds (see page 13 of thisstatement) but, for technical reasons, it is not included inthe profit and loss account.
TurnoverOn a like-for-like basis, turnover including joint ventures grewby 4.2%. Total turnover for future Whitbread grew by 7.1%.As a consequence of the transactions described earlier, totalturnover including joint ventures fell by 35%.
Operating profitAll future Whitbread businesses contributed profit increases,as described in the Chief Executive’s Review. The operatingprofit before exceptional items of future Whitbread businessesgrew by 10%. Total operating profit before exceptional items fell by 26% to £172.0 million, reflecting the transactionsdescribed earlier.
The group’s profit margin (operating profit before exceptionalitems as a percentage of turnover including joint ventures)increased from 13.1% to 15.1%. This increase is mainly attributableto the exit from the lower margin beer and off-licence businessesand the expansion of the higher margin hotels and sports,health and fitness businesses.
Earnings before exceptional items, interest, tax, depreciationand amortisation (‘EBITDA’) EBITDA is a good indicator of the operating cash generated by each division. For future Whitbread, EBITDA grew by 9.4% to £197.1 million.
All future Whitbread businessescontributed profit increases.

Adjusted earnings per share,increased by 3.0% to 25.77 pence.
10
Finance reviewcontinued
Exceptional itemsExceptional items before interest and tax amounted to a net charge of £24.1 million. This amount is analysed in note 3 to the accounts. The main items are charges of £14.4 million and £5.9 million for transaction andreorganisation costs, respectively, associated with the demerger of the Pubs & Bars division.
InterestThe net interest charge fell by £12.2 million to £37.1 million.This reduction reflects a lower level of net debt and lowerinterest rates this year. Net interest was covered 4.7 times by operating profit before exceptional items. The weightedaverage rate of interest on fixed rate sterling debt at the period end was 7.0%. Of the net sterling debt at the period end, 47% was at fixed rates of interest.
TaxationAs explained in note 1 to the accounts, the tax charge on profit before exceptional items for the interim period has beencalculated by applying the forecast effective tax rate for the full year. The charge against profit before exceptional items for the period of £45.1 million represents an underlying rateof 33.2%. The charge includes deferred tax, as described under‘Accounting Policies’above and in note 1. The tax charge for2000/1 has been restated to reflect the adoption of FRS 19.
Earnings per shareAs explained in note 11 to the accounts, a 3 for 5 share capitalconsolidation was implemented at the time of the Pubs & Barsdemerger. This reflected the value returned to shareholders bythe demerger. Adjusted earnings per share, calculated on theweighted average number of shares in issue during the period,increased by 3.0% to 25.77 pence.
Dividend per shareThe Chairman’s Statement in the last annual report indicatedthe board’s intention to adopt a new dividend policy after thedisposal of Pubs & Bars and the reduction in share capital. Theintention is to pay dividends of approximately 40% of profits

11
Net asset value per share atthe period end was £6.44.
after tax for future Whitbread, giving a dividend cover of some 2.5 times. An interim dividend of 5.05 pence per share will be paid on 8 January 2002 to all shareholders on the share register at the close of business on 9 November 2001.
Cash flowNet cash inflow from Operating activities was £180 million.This is in line with the level expected following the transactionsdescribed earlier.
Investment in property and plant was £156 million, comparedwith £170 million in the previous first half.
Cash inflow before financing was £296 million. The underlyingcash outflow (after adjusting for the £462 million cash inflowfrom the demerger of Pubs & Bars and businesses sold and foran outflow in respect of expenditure on new retail outlets of£86 million) was £80 million. The underlying cash flow for thisperiod reflects this year’s lower operating profit from a smallerbusiness whereas the dividend and tax payments relate to lastyear’s profits from a larger business.
Net debtNet debt at the end of the period amounted to £992 million,resulting in a balance sheet gearing ratio of 52%.
Net asset valueNet asset value per share at the period end was £6.44.
Post balance sheet eventSince the balance sheet date, we have announced the intention to sell in due course a number of smaller restaurantbrands including Bella Pasta, Café Rouge, Abbaye and Mamma Amalfi. The book value of the net assets of thesebusinesses in the group accounts as at 1 September 2001amounted to £50 million.

12
Group profit and loss accountSix months to 1 September 2001
6 months to 2.9.2000 2000/16 months to 1.9.2001 (restated) (restated)
Before Exceptional Before After Afterexceptional items exceptional exceptional exceptional
items (note 3) Total items items itemsNotes £m £m £m £m £m £m
TurnoverContinuing operations 1,014.9 – 1,014.9 1,424.3 1,424.3 2,417.5Discontinued operations 126.0 – 126.0 341.3 341.3 677.7
Group and share of joint ventures 1,140.9 – 1,140.9 1,765.6 1,765.6 3,095.2Less share of joint ventures’ turnover (70.4) – (70.4) (360.6) (360.6) (500.6)
2 Group turnover 1,070.5 – 1,070.5 1,405.0 1,405.0 2,594.6
Group operating profit 154.7 – 154.7 219.2 215.9 401.8Share of operating profit in:
Joint ventures 5.0 – 5.0 3.0 2.1 9.1Associates 12.3 – 12.3 9.0 9.0 13.8
Continuing operations 141.5 – 141.5 143.2 141.9 250.6Discontinued operations 30.5 – 30.5 88.0 85.1 174.1
2 Operating profit of the group, jointventures and associates 172.0 – 172.0 231.2 227.0 424.7
Non-operating itemsNet profit/(loss) on disposal of fixed assets – (0.1) (0.1) – 2.8 (4.3)
9 Net loss on the disposal of businesses – (3.7) (3.7) – (18.8) (8.8)Fundamental reorganisation costs – (20.3) (20.3) – – (26.0)
Profit before interest 172.0 (24.1) 147.9 231.2 211.0 385.64 Interest (36.3) (0.8) (37.1) (49.3) (49.3) (93.7)
Profit before taxation 135.7 (24.9) 110.8 181.9 161.7 291.95 Taxation (45.1) 1.5 (43.6) (61.9) (66.0) (107.8)
Profit after taxation 90.6 (23.4) 67.2 120.0 95.7 184.1
Non equity minority interests (0.1) – (0.1) (0.1) (0.1) (0.1)
Profit earned for ordinary shareholders 90.5 (23.4) 67.1 119.9 95.6 184.0
Ordinary dividend (15.0) – (15.0) (40.1) (40.1) (153.1)
Retained profit for the period 75.5 (23.4) 52.1 79.8 55.5 30.9
Dividends per share (pence)Interim 5.05 8.05 8.05Final 23.10
6 Earnings per share (pence)Basic 18.24 19.25 37.18Adjusted basic 25.77 25.01 47.85Diluted 18.17 19.24 37.16Adjusted diluted 25.67 24.99 47.82
13
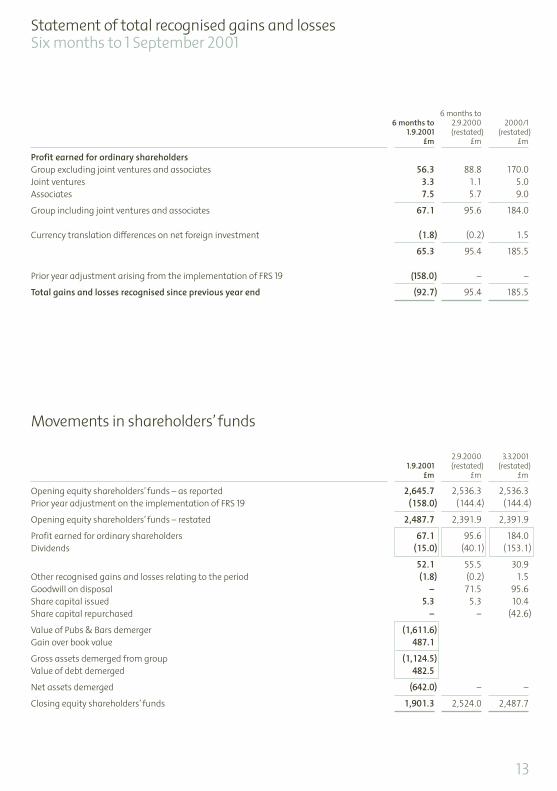
Statement of total recognised gains and lossesSix months to 1 September 2001
6 months to6 months to 2.9.2000 2000/1
1.9.2001 (restated) (restated)£m £m £m
Profit earned for ordinary shareholdersGroup excluding joint ventures and associates 56.3 88.8 170.0Joint ventures 3.3 1.1 5.0Associates 7.5 5.7 9.0
Group including joint ventures and associates 67.1 95.6 184.0
Currency translation differences on net foreign investment (1.8) (0.2) 1.5
65.3 95.4 185.5
Prior year adjustment arising from the implementation of FRS 19 (158.0) – –
Total gains and losses recognised since previous year end (92.7) 95.4 185.5
Movements in shareholders’funds
2.9.2000 3.3.20011.9.2001 (restated) (restated)
£m £m £m
Opening equity shareholders’ funds – as reported 2,645.7 2,536.3 2,536.3Prior year adjustment on the implementation of FRS 19 (158.0) (144.4) (144.4)
Opening equity shareholders’ funds – restated 2,487.7 2,391.9 2,391.9
Profit earned for ordinary shareholders 67.1 95.6 184.0Dividends (15.0) (40.1) (153.1)
52.1 55.5 30.9Other recognised gains and losses relating to the period (1.8) (0.2) 1.5Goodwill on disposal – 71.5 95.6Share capital issued 5.3 5.3 10.4Share capital repurchased – – (42.6)
Value of Pubs & Bars demerger (1,611.6)Gain over book value 487.1
Gross assets demerged from group (1,124.5)Value of debt demerged 482.5
Net assets demerged (642.0) – –
Closing equity shareholders’ funds 1,901.3 2,524.0 2,487.7

14
Cash flow statementSix months to 1 September 2001
6 months to 1.9.2001 6 months to 2.9.2000 2000/1Notes £m £m £m
7 Cash inflow from operating activities 180.2 181.3 492.3
Dividends received from joint venturesand associates 0.2 – 3.5
Returns on investments and servicingof financeInterest received 1.3 0.9 2.0Interest paid (36.7) (51.0) (94.9)Debt issue costs – – (5.3)Loan interest received 0.5 0.7 1.3Preference dividends paid – (0.1) –
Net cash outflow from returns oninvestments and servicing of finance (34.9) (49.5) (96.9)
TaxationUK Corporation Tax paid (36.7) (25.9) (92.9)
Capital expenditure and financial investmentProperty and plant purchased (155.8) (170.5) (331.9)Investments purchased and loans advanced (7.9) (6.2) (6.7)Property and plant sold 1.7 122.8 130.8Investments sold and loans realised – 15.4 22.1
Net cash outflow from capitalexpenditure and financial investment (162.0) (38.5) (185.7)
Acquisitions and disposals8 New businesses acquired – (11.3) (11.0)9 Businesses sold 1.0 389.0 500.3
10 Business demerged 461.1 – –
Net cash inflow from acquisitionsand disposals 462.1 377.7 489.3
Equity dividends paid (113.3) (108.5) (148.2)
Net cash inflow before use of liquidresources and financing 295.6 336.6 461.4
Management of liquid resources13 Net movement on short term securities
and bank deposits 0.2 0.1 0.8
FinancingMinority dividends – – (0.1)Issue of shares 5.3 1.1 6.2Repurchase of shares – – (42.6)
13 Net movement on short term bank borrowings (8.3) (19.6) (28.0)
13 Loan capital issued 2.5 310.0 285.013 Loan capital repaid* (278.2) (651.4) (669.5)
Net cash outflow from financing (278.7) (359.9) (449.0)
13 Increase/(decrease) in cash 17.1 (23.2) 13.2
*The net of receipts and payments on revolving credits is included in loan capital repaid.

15
Balance sheet1 September 2001
2.9.2000 3.3.20011.9.2001 (restated) (restated)
Notes £m £m £m
Fixed assetsIntangible assets 154.1 165.1 159.2Tangible assets 3,022.6 4,032.0 4,138.1Investments
In joint ventures
Share of gross assets 70.6 236.3 69.2Share of gross liabilities (28.8) (120.1) (28.3)
41.8 116.2 40.9In associates 60.3 55.8 53.0Other investments 8.6 2.9 2.4
3,287.4 4,372.0 4,393.6
Current assets and liabilitiesStocks 28.9 32.8 36.1Debtors 169.2 236.1 165.9Cash at bank and in hand 110.1 160.6 66.9
308.2 429.5 268.9Creditors – amounts falling due within one year (534.3) (774.8) (689.9)
Net current liabilities (226.1) (345.3) (421.0)
Total assets less current liabilities 3,061.3 4,026.7 3,972.6
Creditors – amounts falling due after more than one yearLoan capital (998.3) (1,310.2) (1,272.6)
Provisions for liabilities and charges (156.3) (187.1) (207.0)
1,906.7 2,529.4 2,493.0
Capital and reserves11 Called up share capital 147.6 2,239.2 2,207.811 Share premium account 3.7 – –12 Revaluation reserve 138.7 622.2 621.512 Other non-distributable reserves (1,820.6) (1,926.7) (1,830.5)12 Profit and loss account 3,431.9 1,589.3 1,488.9
Shareholders’ funds 1,901.3 2,524.0 2,487.7
Equity minority interests 2.3 2.3 2.2Non-equity minority interests 3.1 3.1 3.1
1,906.7 2,529.4 2,493.0

16
Notes to the accounts
1 Basis of preparation of accounts
The interim accounts were approved by the board on 29 October 2001. They have been prepared on the basis of the accountingpolicies set out in the 2000/1 group accounts, except in respect of deferred tax as set out below. The taxation charge on profitbefore exceptional items for the interim period has been calculated by applying the forecast effective tax rate for the full year.
The balance sheet as at 3 March 2001 and the profit and loss account and cash flow statement for the year ended on that dateare extracts from the statutory accounts which have been delivered to the Registrar of Companies. The auditors’ report on thestatutory accounts was unqualified and did not contain a statement under section 237 of the Companies Act 1985.
FRS 18 (Accounting Policies) has been adopted in the current period. It has had no effect on the published numbers.
FRS 19 (Deferred Tax) has been adopted in the current period. The comparative amounts have been restated to comply with thenew standard. Its effect on the profit and loss account is to increase the taxation charge for the Group by £11.0m (2000 –decrease the taxation charge by £0.9m, 2000/1 – increase the taxation charge by £13.2m). The balance sheet effect is to increaseprovisions in central services by £137.7m (2000 – £151.3m, 2000/1 – £165.4m) and to increase goodwill in Marriott/Swallow hotelsby £7.2m (2000 – £7.6m, 2000/1 – £7.4m). Provisions for deferred tax have not been calculated on a discounted basis.
2 Segmental analysis of turnover, profit and net assets
OperatingTurnover EBITDA# profit† Net assets
Six months to 1 September 2001 £m £m £m £m
By business segmentHotels – Marriott/Swallow 203.7 63.2 42.4 1,243.2
– Travel Inns 87.9 38.7 31.5 448.6
291.6 101.9 73.9 1,691.8
Restaurants – pub restaurants 299.1 58.0 44.2 802.6– high street restaurants 237.1 11.7 3.1 168.4
536.2 69.7 47.3 971.0Sports, health and fitness 80.4 25.5 16.0 441.7
908.2 197.1 137.2 3,104.5Pubs & Bars – managed 99.5 21.1 16.2 (4.0)
– leased 26.5 14.9 14.3 (0.6)Beer and other drinks 38.6 11.3 11.3 56.1
Segmental turnover, profit and net assets 1,072.8 244.4 179.0 3,156.0Share of joint ventures’ turnover (70.4)Central services 68.1 (5.0) (7.0) (257.0)
1,070.5 239.4 172.0 2,899.0
By geographical segmentUnited Kingdom 1,036.4 237.0 171.3 2,862.4Rest of the world 34.1 2.4 0.7 36.6
1,070.5 239.4 172.0 2,899.0

17
Notes to the accounts
2 Segmental analysis of turnover, profit and net assets (continued)
OperatingTurnover EBITDA# profit† Net assets
Six months to 2 September 2000 (restated) £m £m £m £m
By business segmentHotels – Marriott/Swallow 200.1 58.3 40.1 1,164.6
– Travel Inns 80.4 35.5 28.8 397.8
280.5 93.8 68.9 1,562.4
Restaurants – pub restaurants 281.9 54.4 40.2 784.2– high street restaurants 219.6 10.2 2.6 155.7
501.5 64.6 42.8 939.9Sports, health and fitness 66.2 21.7 12.9 416.2
848.2 180.1 124.6 2,918.5Pubs & Bars – managed 266.5 65.8 51.6 781.8
– leased 74.8 38.1 36.4 387.4Beer and other drinks 588.1 29.8 21.2 129.2Acquired businesses for disposal* 16.1 2.6 2.6 7.2
Segmental turnover, profit and net assets 1,793.7 316.4 236.4 4,224.1
Inter-segment turnover (see note below) (63.7)Share of joint ventures’ turnover (360.6)Central services 35.6 (2.1) (5.2) (315.7)Exceptional items (note 3) – (4.2) (4.2) –
1,405.0 310.1 227.0 3,908.4
By geographical segmentUnited Kingdom 1,371.5 307.5 226.1 3,889.0Rest of the world 33.5 2.6 0.9 19.4
1,405.0 310.1 227.0 3,908.4
#EBITDA is earnings before interest, tax, depreciation and amortisation.†Operating profit is stated after charging the amortisation of goodwill as follows:
6 months to 6 months to 1.9.2001 2.9.2000
£m £m
Hotels 4.1 4.1Sports, health and fitness 0.2 0.2
*The acquired business for disposal related mainly to the pubs business acquired with the Swallow Group which was sold on 7 June 2000.
Following the sale of the Whitbread Beer Company there remains a continuing activity within the beer and other drinks segment.This is as a result of the terms of the sale of the Whitbread Beer Company to Interbrew which included arrangements forWhitbread to retain the people and the necessary production capacity to ensure compliance with its obligations for the remainingperiod of the Heineken and Murphy licences.
Segmental turnover for high street restaurants includes the group’s share of joint venture turnover amounting to £69.0m (2000 –£59.9m), hotels includes £1.4m (2000 – £1.2m) and beer and other drinks includes £nil (2000 – £299.5m). Inter-segment turnover is from beer and other drinks to the other segments. Central services turnover comprises, primarily, food distribution servicesprovided to a joint venture and an external customer. The geographical analysis of turnover and profit is by source. The analysis of turnover by destination is not materially different. Sales between geographical segments are not material. Net assets includedabove are total net assets excluding net debt. Following the introduction of FRS 19 all taxation liabilities are now included withinthe net assets of central services. The comparatives have been restated accordingly.

18
Notes to the accounts
2 Segmental analysis of turnover, profit and net assets (continued)
The exceptional costs are detailed in note 3. The analysis of operating exceptional costs is as follows:6 months to 6 months to
1.9.2001 2.9.2000£m £m
Pubs & Bars and Restaurants* – (2.9)Beer and other drinks – (0.9)Central services – (0.4)
– (4.2)
*These costs relate to the restructuring of these businesses into the new divisions of Pubs & Bars and Restaurants. This was acombined project and there was no suitable basis for allocating the costs to individual divisions.
3 Exceptional items6 months to 6 months to
1.9.2001 2.9.2000 2000/1£m £m £m
Restructuring/rationalisation costsGroup excluding joint ventures and associates – (3.3) (2.2)Joint venture reorganisation costs – (0.9) (0.9)
Charged against operating profit – (4.2) (3.1)Non-operating itemsNet profit/(loss) on disposal of fixed assets
Group excluding joint ventures and associates 0.2 2.3 (5.0)Joint ventures – 0.4 0.2Associates (0.3) 0.1 0.5
Net loss on the disposal of businesses (note 9) (3.7) (18.8) (8.8)Fundamental reorganisation costs
Demerger of Pubs & Bars – transaction costs (14.4) – (11.0)Reorganisation costs (5.9) – (15.0)
(24.1) (20.2) (42.2)
The transaction costs are principally advisers’fees and legal costs. The fundamental reorganisation costs relate to the demerger of Pubs & Bars in May 2001 and the sale of the Whitbread Beer Company in May 2000.
19
Notes to the accounts
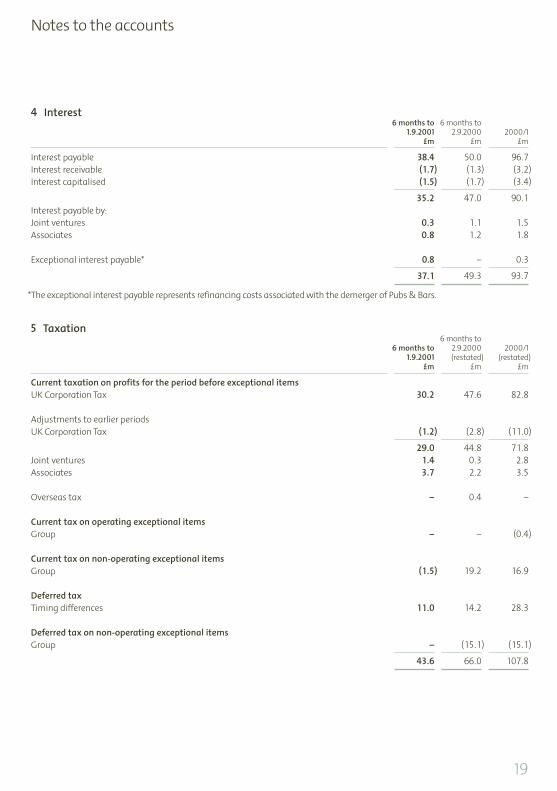
4 Interest6 months to 6 months to
1.9.2001 2.9.2000 2000/1£m £m £m
Interest payable 38.4 50.0 96.7Interest receivable (1.7) (1.3) (3.2)Interest capitalised (1.5) (1.7) (3.4)
35.2 47.0 90.1Interest payable by:Joint ventures 0.3 1.1 1.5Associates 0.8 1.2 1.8
Exceptional interest payable* 0.8 – 0.3
37.1 49.3 93.7
*The exceptional interest payable represents refinancing costs associated with the demerger of Pubs & Bars.
5 Taxation6 months to
6 months to 2.9.2000 2000/11.9.2001 (restated) (restated)
£m £m £m
Current taxation on profits for the period before exceptional itemsUK Corporation Tax 30.2 47.6 82.8
Adjustments to earlier periodsUK Corporation Tax (1.2) (2.8) (11.0)
29.0 44.8 71.8Joint ventures 1.4 0.3 2.8Associates 3.7 2.2 3.5
Overseas tax – 0.4 –
Current tax on operating exceptional itemsGroup – – (0.4)
Current tax on non-operating exceptional itemsGroup (1.5) 19.2 16.9
Deferred taxTiming differences 11.0 14.2 28.3
Deferred tax on non-operating exceptional itemsGroup – (15.1) (15.1)
43.6 66.0 107.8

20
Notes to the accounts
6 Earnings per share
Basic earnings per share is calculated by dividing earnings for ordinary shareholders of £67.1m (2000 – £95.6m) by the weightedaverage number of ordinary shares in issue during the period, 367.9m (2000 – 496.6m). Adjusted basic earnings per share iscalculated as follows:
Earnings (£m) Earnings per share (p)
6 months to 6 months to 6 months to 2.9.2000 2000/1 6 months to 2.9.2000 2000/1
1.9.2001 (restated) (restated) 1.9.2001 (restated) (restated)
Earnings and basic earnings per share 67.1 95.6 184.0 18.24 19.25 37.18Earnings and basic earnings per share attributable to:Goodwill amortisation 4.3 4.3 8.5 1.17 0.87 1.72Exceptional items, net of tax 23.4 24.3 44.3 6.36 4.89 8.95
Adjusted earnings and basic earnings per share 94.8 124.2 236.8 25.77 25.01 47.85
Earnings includes a number of exceptional items. In order to demonstrate the effect of these, together with the impact of goodwillamortisation, an adjusted earnings per share figure is also presented. Diluted earnings per share is the basic and adjusted basicearnings per share after allowing for the dilutive effect of the conversion into ordinary shares of the weighted average number ofoptions outstanding during the period. The number of shares used for the diluted calculation is 369.3m (2000 – 497.0m).
7 Net cash inflow from operating activities6 months to
6 months to 2.9.2000 2000/11.9.2001 (restated) (restated)
£m £m £m
Group operating profit 154.7 215.9 401.8Investment income – (0.1) (0.1)Depreciation/amortisation 67.4 83.1 157.5Payments against provisions (17.0) (8.1) (29.4)Other non-cash items (3.6) 2.1 5.4Increase in stocks (1.2) (9.4) (12.6)Increase in debtors (35.7) (171.6) (109.0)Increase in creditors 15.6 69.4 78.7
Cash inflow from operating activities 180.2 181.3 492.3
8 Acquisitions6 months to 6 months to
1.9.2001 2.9.2000 2000/1£m £m £m
Cash outflow in respect of new businesses acquiredPayments in respect of previous years’ acquisitions – 11.3 11.0

21
Notes to the accounts
9 Disposals6 months to
1.9.2001£m
Fixed assets 4.1Net working capital, excluding cash and overdraft (0.2)Cash and overdraft 0.1
Carrying value of net assets 4.0
Gross sale proceeds 1.5Less costs (1.2)
Net sale proceeds 0.3
Loss on disposal (3.7)
Net sale proceeds 0.3Accrued costs 0.7
Cash inflow 1.0
10 Demerger of Pubs & Bars division6 months to
1.9.2001£m
Fixed assets 1,194.3Investments 0.4Net working capital, excluding cash and overdraft (31.5)Deferred tax provision (38.7)
Gross assets demerged from group 1,124.5Net cash received (482.5)
Net assets demerged 642.0
Net cash received 482.5
Total transaction costs (25.4)Less – paid in prior year 3.8
– accrued costs 0.2
Transaction costs paid in current period (21.4)
Cash inflow from demerger 461.1

22
Notes to the accounts
11 Share capitalAuthorised Allotted, called up and fully paid
1.9.2001 2.9.2000 3.3.2001 1.9.2001 2.9.2000 3.3.2001£m £m £m £m £m £m
Equity share capitalOrdinary shares of 50 pence each# 4,725.0 4,725.0 4,725.0 147.6 2,239.2 2,207.8
Ordinary shares in issue (m) 295.2 497.6 490.6
Share Sharecapital premium
Ordinary shares £m £m
3 March 2001 2,207.8 –Movements during the period:
Reduction of capital under the arrangement to demerge the Pubs & Bars division* (2,062.0) –Issued to employees by exercise of options 1.8 3.7
1 September 2001 147.6 3.7
*On 10 May 2001 the Pubs & Bars division was demerged from Whitbread PLC by means of a reduction of capital under section 135 of the Companies Act 1985. Whitbread PLC then implemented a 3 for 5 share capital consolidation, reducing the number of sharesby 40%. This reduction reflected the value returned to shareholders by the demerger as an approximate proportion of Whitbread PLC’smarket value. Following the capital reduction and share consolidation the nominal value of each Whitbread PLC share is 50 pence.
#In accordance with merger accounting principles, the shares issued in connection with the scheme of arrangement to acquireWhitbread Group PLC, as adjusted to reflect the issue of options and repurchase of shares, have been treated as if issued throughoutthe corresponding year.
At 1 September 2001 there were outstanding options for employees to purchase up to 9.5m (2000 – 14.0m) ordinary shares. During thesix months to 1 September 2001 options on 0.6m (2000 – 2.0m) ordinary shares were exercised by employees under the terms ofvarious share option schemes.

23
Notes to the accounts
12 ReservesJoint
Profit ventures Revaluation Other and loss and
reserve reserves account associates Total£m £m £m £m £m
3 March 2001 – as reported 621.5 (1,855.0) 1,646.9 24.5 437.9Prior year adjustment resulting from the implementation of FRS 19 – – (158.0) – (158.0)
3 March 2001 – restated 621.5 (1,855.0) 1,488.9 24.5 279.9Currency translation differences – – (1.8) – (1.8)Profit retained – – 42.2 9.9 52.1Pubs & Bars division demerger– Value of demerger (1,611.6) (1,611.6)– Gain over book value 487.1 487.1
– Gross assets demerged from group (1,124.5) (1,124.5)– Value of debt demerged 482.5 482.5
Net assets demerged – – (642.0) – (642.0)Revaluation surplus transferred to the profit and loss accounton the demerger of the Pubs & Bars division (483.1) – 483.1 – –Capital reduction following the demerger of the Pubs & Bars division – – 2,062.0 – 2,062.0Discount on shares issued to employees under share optionschemes, less tax – – (0.2) – (0.2)Realised revaluation deficit transferred to the profit and loss account 0.3 – (0.3) – –
1 September 2001 138.7 (1,855.0) 3,431.9 34.4 1,750.0
2 September 2000 622.2 (1,892.2) 1,589.3 (34.5) 284.8
Goodwill £m
Net amount written off against reserves to 3 March 2001 488.4Demerger of Pubs & Bars (38.9)
Net amount written off against reserves to 1 September 2001 449.5

24
Notes to the accounts
13 Reconciliation of net cash flow to movement in net debt6 months to 6 months to
1.9.2001 2.9.2000 2000/1£m £m £m
Increase/(decrease) in cash in the period 17.1 (23.2) 13.2Cash outflow from movement in loan capital 275.7 341.4 389.8*Cash inflow from movement in liquid resources (0.2) (0.1) (0.8)Cash outflow from movement in short term borrowings 8.3 19.6 28.0
Changes in net debt resulting from cash flows 300.9 337.7 430.2
Foreign exchange movements (1.2) (1.2) (1.1)Amortisation of premiums and discounts (0.7) 5.7 0.8
Movement in net debt in the period 299.0 342.2 429.9Opening net debt (1,291.3) (1,721.2) (1,721.2)
Closing net debt (992.3) (1,379.0) (1,291.3)
*Includes £5.3m debt issue costs.
14 Post balance sheet events
Since the balance sheet date the intention to sell, in due course, a number of smaller restaurant brands, including Bella Pasta, CaféRouge, Abbaye and Mamma Amalfi, has been announced. The book value of the assets of these businesses in the group accountsat 1 September 2001 amounted to £50m.

25
Independent review report to Whitbread PLC
IntroductionWe have been instructed by the company to review the financial information for the 6 months ended 1 September 2001 whichcomprises Profit and Loss Account, BalanceSheet, Cash Flow Statement, Statementof Total Recognised Gains and Losses and the related notes 1 to 14. We have read theother information contained in the interimreport and considered whether it contains any apparent misstatements or materialinconsistencies with the financial information.
Directors’ responsibilitiesThe interim report, including the financialinformation contained therein, is theresponsibility of, and has been approved by thedirectors. The directors are responsible forpreparing the interim report in accordancewith the Listing Rules of the Financial ServicesAuthority which require that the accountingpolicies and presentation applied to theinterim figures should be consistent with thoseapplied in preparing the preceding annualaccounts except where any changes, and thereasons for them, are disclosed.
Review work performedWe conducted our review in accordance with guidance contained in Bulletin 1999/4issued by the Auditing Practices Board for use in the United Kingdom. A review consistsprincipally of making enquiries of groupmanagement and applying analyticalprocedures to the financial information andunderlying financial data and based thereon,assessing whether the accounting policiesand presentation have been consistentlyapplied unless otherwise disclosed. A reviewexcludes audit procedures such as tests ofcontrols and verification of assets, liabilitiesand transactions. It is substantially less inscope than an audit performed in accordancewith United Kingdom Auditing Standardsand therefore provides a lower level ofassurance than an audit. Accordingly we donot express an opinion on the financialinformation.
Review conclusionOn the basis of our review we are notaware of any material modifications thatshould be made to the financial information as presented for the six months ended1 September 2001.
Ernst & Young LLPLondon29 October 2001

26
Shareholder services
For further information about the company and its businesses please visit the Whitbreadwebsite at www.whitbread.co.uk
RegistrarThe company’s registrar is Lloyds TSB Registrars, The Causeway,Worthing, West Sussex BN99 6DA.Their website address is www.lloydstsb-registrars.co.uk For enquiries regarding your shareholding please telephone 0870 6003968. You can also view up-to-date information about your holdingsby visiting the shareholder website atwww.shareview.co.uk Please ensure thatyou advise Lloyds TSB promptly of a change of name or address.
Capital Gains TaxMarket values of shares in the company as at 31 March 1982 were as follows:
“A” limited voting shares of 25p each 103.75p“B” shares of 25p each 103.75p
Whitbread has had discussions with theInland Revenue concerning the capital gainstax cost of Whitbread shares following thereduction of capital on 10 May 2001. It isconfirmed that the market value of eachWhitbread share on the 10 May for thesepurposes was 606.5p and the market value of each Fairbar share was 230p.
Financial diaryFinancial half year end 1 September
Announcement of half year results 30 October
Ex-dividend date for interim dividend 7 November
Record date for interim dividend 9 November
Payment of interim dividend 8 January 2002
End of financial year 2 March 2002

27

28

Des
igne
d an
d pr
oduc
ed b
y Ba
mbe
r For
syth
Lim
ited
.Pho
togr
aphy
by
Bill
Robi
nson
.Pri
nted
in E
ngla
nd b
y Li
tho-
Tech
Col
our P
rint
ers
Ltd.

WhitbreadCityPointOne Ropemaker StreetLondonEC2Y 9HX
www.whitbread.co.uk