where is european private equity heading? - 2005 european private equity statistics gemma...
TRANSCRIPT
Where is European Private Equity Heading?Where is European Private Equity Heading?
- 2005 - 2005 European Private Equity StatisticsEuropean Private Equity Statistics
Gemma Postlethwaite, Thomson Financial
16 March 2006

2
Investment Activity Methodology
Data collected from GPs via survey questionnaires, response rate 62.3% for 1,450 PE firms
Europe is defined as location of the PE fund
Fundraising – only formal closings included
Investments – based on completion date, only equity value (debt only if provided by PE fund)
Divestments – at cost, and at time of divestment by PE firm

3
2.4
5.25.7
7.4
9.6
9.26.8 5.4 5.1
17.9
1.8
5.04.9
4.7
10.7
10.2
4.3 4.9 4.5
14.9
3.3
3.4
5.7
4.7
3.6 2.8
7.2
5.0
4.6
3.4 4.2 3.2
3.4
2.2
0
10
20
30
40
50
60
1996 1997 1998 1999 2000 2001 2002 2003 2004 2005
€ billionCapital Markets
Academic I nstitutions
Fund of FundsI nsurance Companies
Pension Funds
Banks
Government Agencies
Private I ndividuals
Corporate I nvestorsRealised Capital Gains
Others/Not Available
8.0
20.0 20.3
25.4
48.0
40.0
27.5 27.0 27.5
59.5
A fund raising all-time record at €60bn
Source: EVCA/Thomson Financial/ PricewaterhouseCoopers
Sustainable level?
77% of funds raised in 2005 allocated to buyout, vs. 65% in 2004
Banks are back – why?
Pension funds invest massively –baby boomers with a pension shortfall
US fund raising also a record with $173bn, but second to 2000
European Private Equity Funds Raised
4
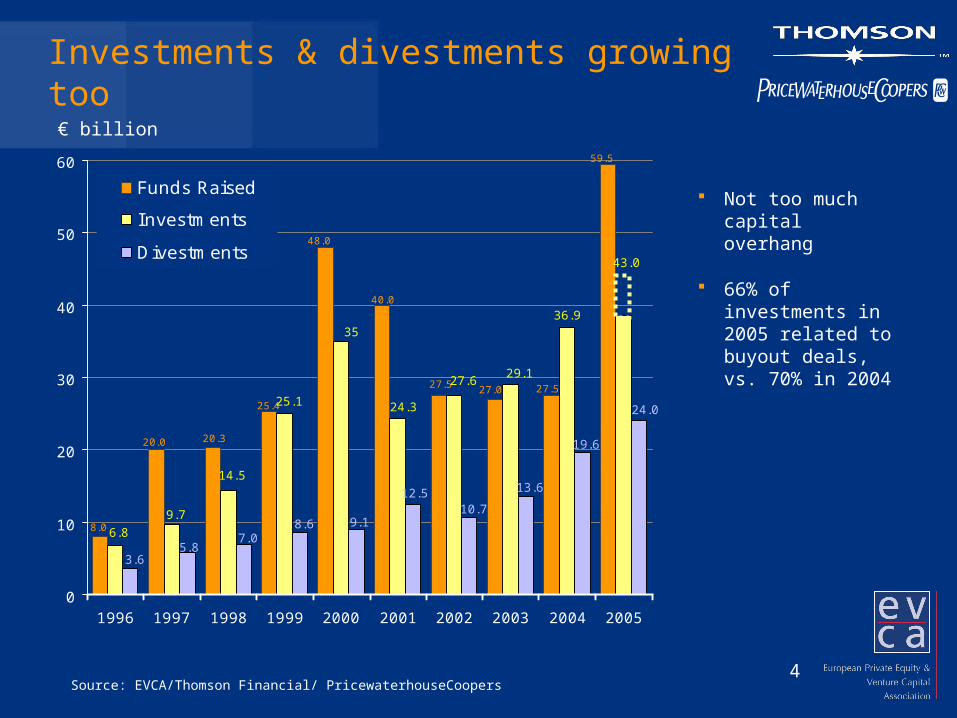
Investments & divestments growing too
€ billion
Source: EVCA/Thomson Financial/ PricewaterhouseCoopers
59.5
8.0
48.0
27.0 27.5
20.0 20.3
25.4
27.5
40.0
36.9
6.8
14.5
9.7
25.1
35
24.3
27.629.1
43.0
13.6
19.6
10.712.5
9.18.6
24.0
7.0
3.65.8
0
10
20
30
40
50
60
1996 1997 1998 1999 2000 2001 2002 2003 2004 2005
Funds Raised
Investments
Divestments
Not too much capital overhang
66% of investments in 2005 related to buyout deals, vs. 70% in 2004
5
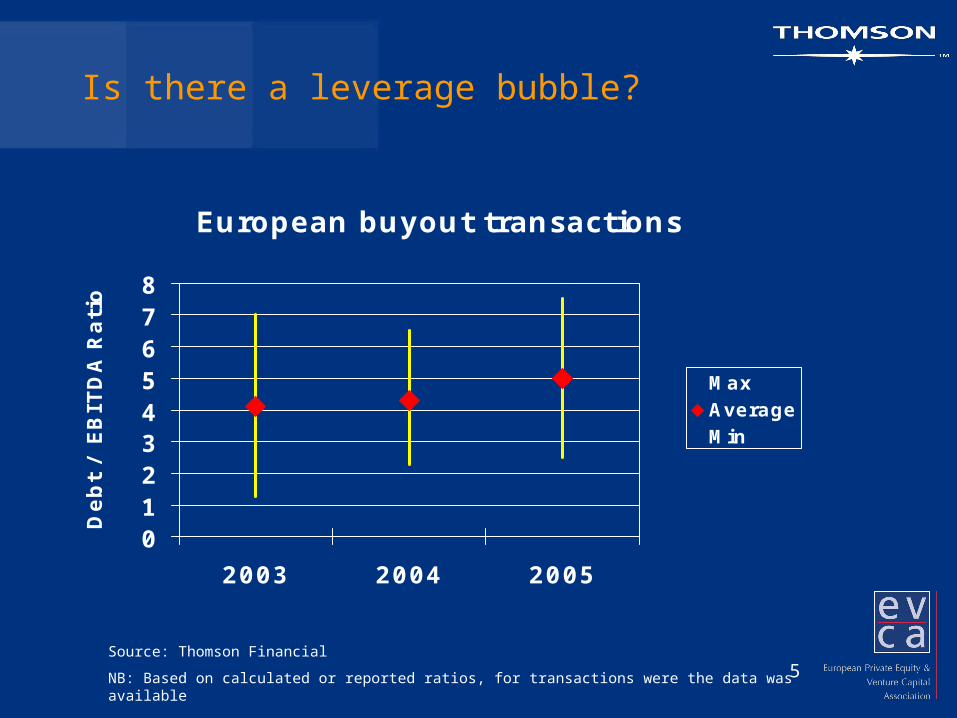
Is there a leverage bubble?
European buyout transactions
012345678
2003 2004 2005
Deb
t /
EB
ITD
A R
ati
o
MaxAverageMin
Source: Thomson Financial
NB: Based on calculated or reported ratios, for transactions were the data was available
6
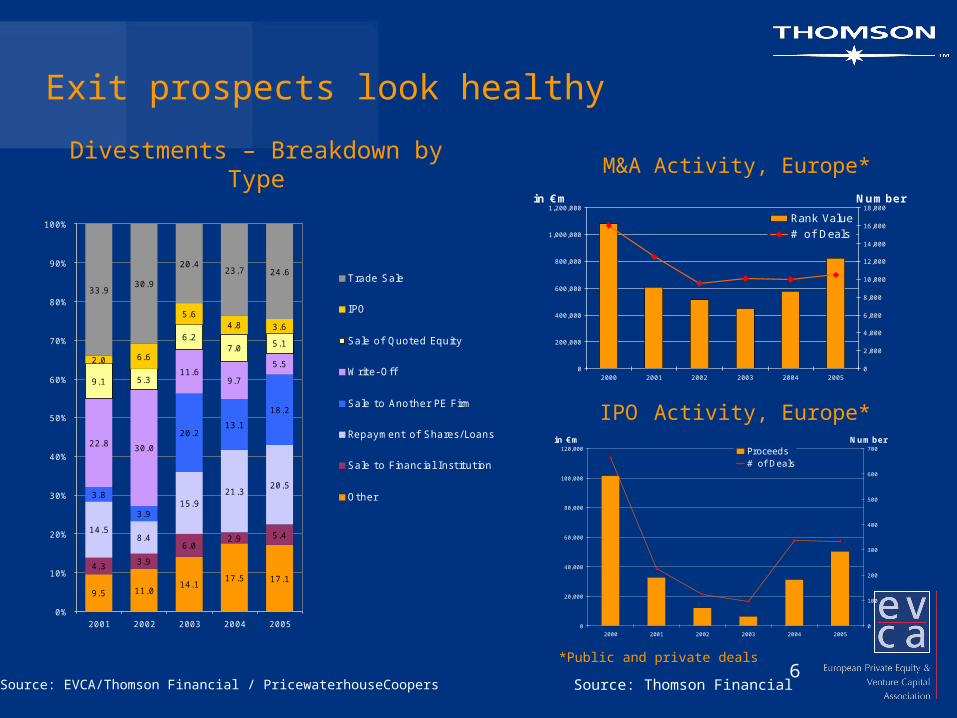
Exit prospects look healthy
9.5 11.014.1
17.5 17.14.3 3.9
6.02.9 5.4
14.58.4
15.921.3
20.53.8
3.9
20.213.1
18.2
22.8 30.0
11.69.7
5.5
9.1 5.3
6.27.0
2.0 6.6
5.64.8 3.6
33.930.9
20.423.7 24.6
5.1
0%
10%
20%
30%
40%
50%
60%
70%
80%
90%
100%
2001 2002 2003 2004 2005
Trade Sale
IPO
Sale of Quoted Equity
Write- Off
Sale to Another PE Firm
Repayment of Shares/ Loans
Sale to Financial Institution
Other
0
200,000
400,000
600,000
800,000
1,000,000
1,200,000
2000 2001 2002 2003 2004 2005
in €m
0
2,000
4,000
6,000
8,000
10,000
12,000
14,000
16,000
18,000Number
Rank Value# of Deals
Source: EVCA/Thomson Financial / PricewaterhouseCoopers
Divestments – Breakdown by Type
0
20,000
40,000
60,000
80,000
100,000
120,000
2000 2001 2002 2003 2004 2005
in €m
0
100
200
300
400
500
600
700
Number
Proceeds# of Deals
M&A Activity, Europe*
IPO Activity, Europe*
Source: Thomson Financial
*Public and private deals

7
Performance Methodology
Data collected from GPs and LPs historically for 1000+ European funds
Returns calculated at fund level, and net of management fees and carried interest
All calculations done by Thomson based on actual cash flows
Pooled IRR: IRR of a group of funds where cash flows have been aggregated together before IRR calculation
Investment horizon return: IRR calculated with Net Asset Value as capital outflow at beginning of period, Net Asset Value at end of period, and actual cash flow in between
DPI: Distribution (in cash or stock) divided by Paid-In capital (‘realised’ ratio)
RVPI: Residual Value divided by Paid-In capital (‘unrealised’ ratio)
TVPI: Total Value divided by Paid-In, sum of DPI and RVPI

8
Investment Benchmarks European Sample
Report Year No. Funds Committed €Bn.
1996 278 20.6
1997 384 39.8 1998 438 51.4 1999 511 68.8 2000 573 87.6 2001 665 108.8 2002 774 135.4 2003 881 158.7 2004 949 159.4 2005 1007 192.4

9
European Private Equity Funds Formed 1980-2005Net IRRs to Investors, Investment Horizon Return as of 31-Dec-2005
Stage 1 YR 3 YR 5 YR 10 YR 20 YR
All Venture 25.4 0.6 -4.0 5.3 5.7
Buyouts 20.9 7.9 5.0 12.6 12.4
Generalist 51.2 1.2 -4.8 9.7 8.6
All Private Equity 24.1 5.2 1.2 10.2 9.6
Source: Thomson Financial / EVCA
Short term indicators show good performance

10
3-year venture IRR moves into positive territory
-10
0
10
20
30
40
Rolli
ng I
RR
s (%
)
10-year IRR5-year IRR3-year IRR
+0.6%
+5.3%
Source: Thomson Financial / EVCA
European Venture 3-,5-,10-Year Rolling IRRs
-4.0%

11
All horizon IRRs in positive territory for buyouts and climbing
-10
0
10
20
30
40
Rolli
ng I
RR
s (%
)
10-year IRR5-year IRR3-year IRR
+7.9%
+12.6%
Source: Thomson Financial / EVCA
European Buyouts3-,5-,10-Year Rolling IRRs
+5.0%

12
Top quarter funds return 23%
Stage PooledIRR
Minimum value Top Quarter
Pooled IRRTop
Quarter
All Venture 5.6 6.1 23.9
Buyouts 12.4 17.1 35.3
Generalist 8.6 8.1 12.4
All Private Equity 9.6 10.4 23.0
Source: Thomson Financial / EVCA
European Private Equity Funds Formed 1980-2005
0
25
50
75
100
2005
+23.0%
+9.5%
3rd quarter
4th quarter
10.4%
Quarter IRR
Top QuartileI RR
Ranking

13
Where is performance coming from?
Stage DPI RVPI TVPI
All Venture 0.60 0.61 1.21
Buyouts 0.80 0.60 1.40
Generalist 0.97 0.40 1.37
All Private Equity 0.78 0.57 1.35
Source: Thomson Financial / EVCA
European Private Equity Funds Formed 1980-2005

14
Conclusion: Record Activity
Fundraising record at €59.5bn Pension funds and banks - main investors with 57.5%
2005 investments steady at €38.5bn, expected to go above €43bn on final data set Buyouts represent 65.8% by amount invested
Venture represent 72.6% by number of investments
Divestments up 23% at €24.0 billion Trade sale continues to be the most popular exit route with 24.6% of the
total amount divested
Write-offs reduced to 5.5% of total amount divested

15
Conclusion: Improved Performance
Long-term performance Stays constant at around 10% net IRR
Robust returns for top quarter funds: 35.3% for buyout and 23.9% for venture funds.
Shorter-term performance Overall 3-year rolling IRR moves up to 5.2% IRR with both buyout and venture
returns in positive territory
1-year rolling IRR is an impressive 20.9% for buyout and 25.4% for venture funds

16
Contact the Thomson Research Specialists:
Performance: Cornelia Andersson [email protected] +44 20 7014 1202
Investment activity: Margherita Del Bianco [email protected] +44 20 7566 1934
How to contribute data?